Investigation of the Viscoelastic Behavior Variation of Glass Mat Thermoplastics (GMT) in Compression Molding


Abstract
:
1. Introduction
2. Investigation Methods and Related Procedures
2.1. Theory and Model
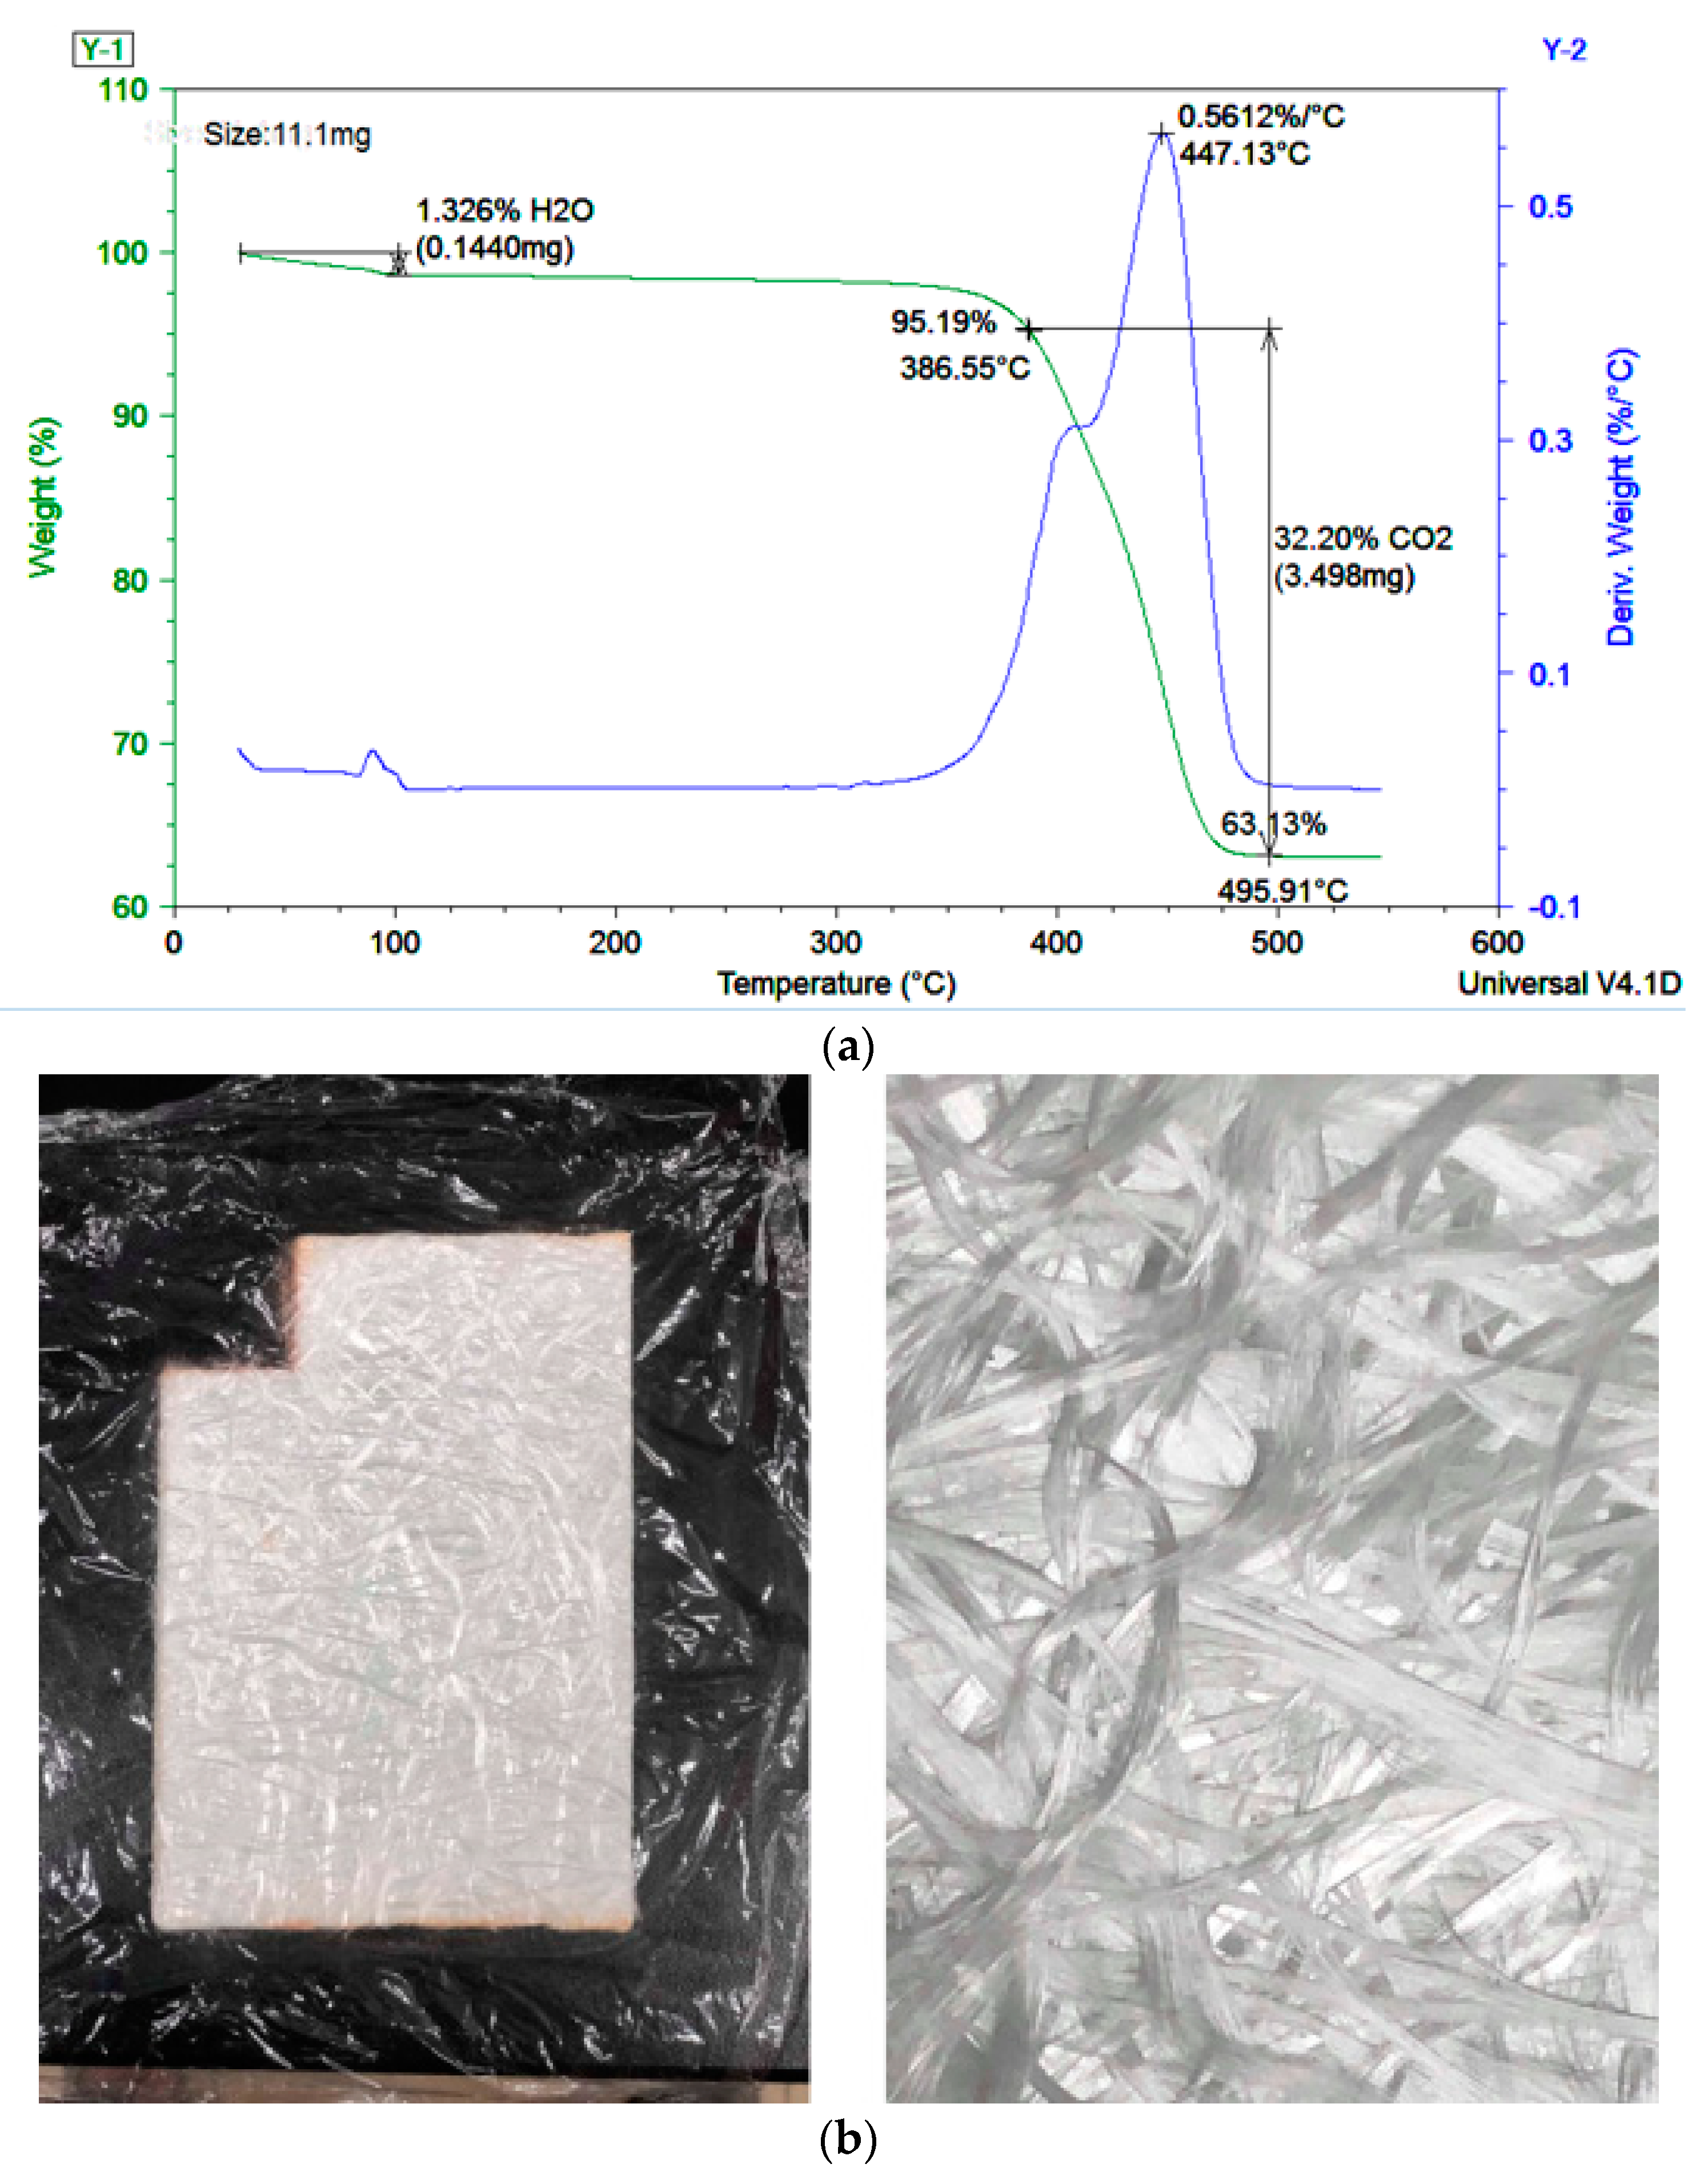
2.2. Materials and Specimen Preparation
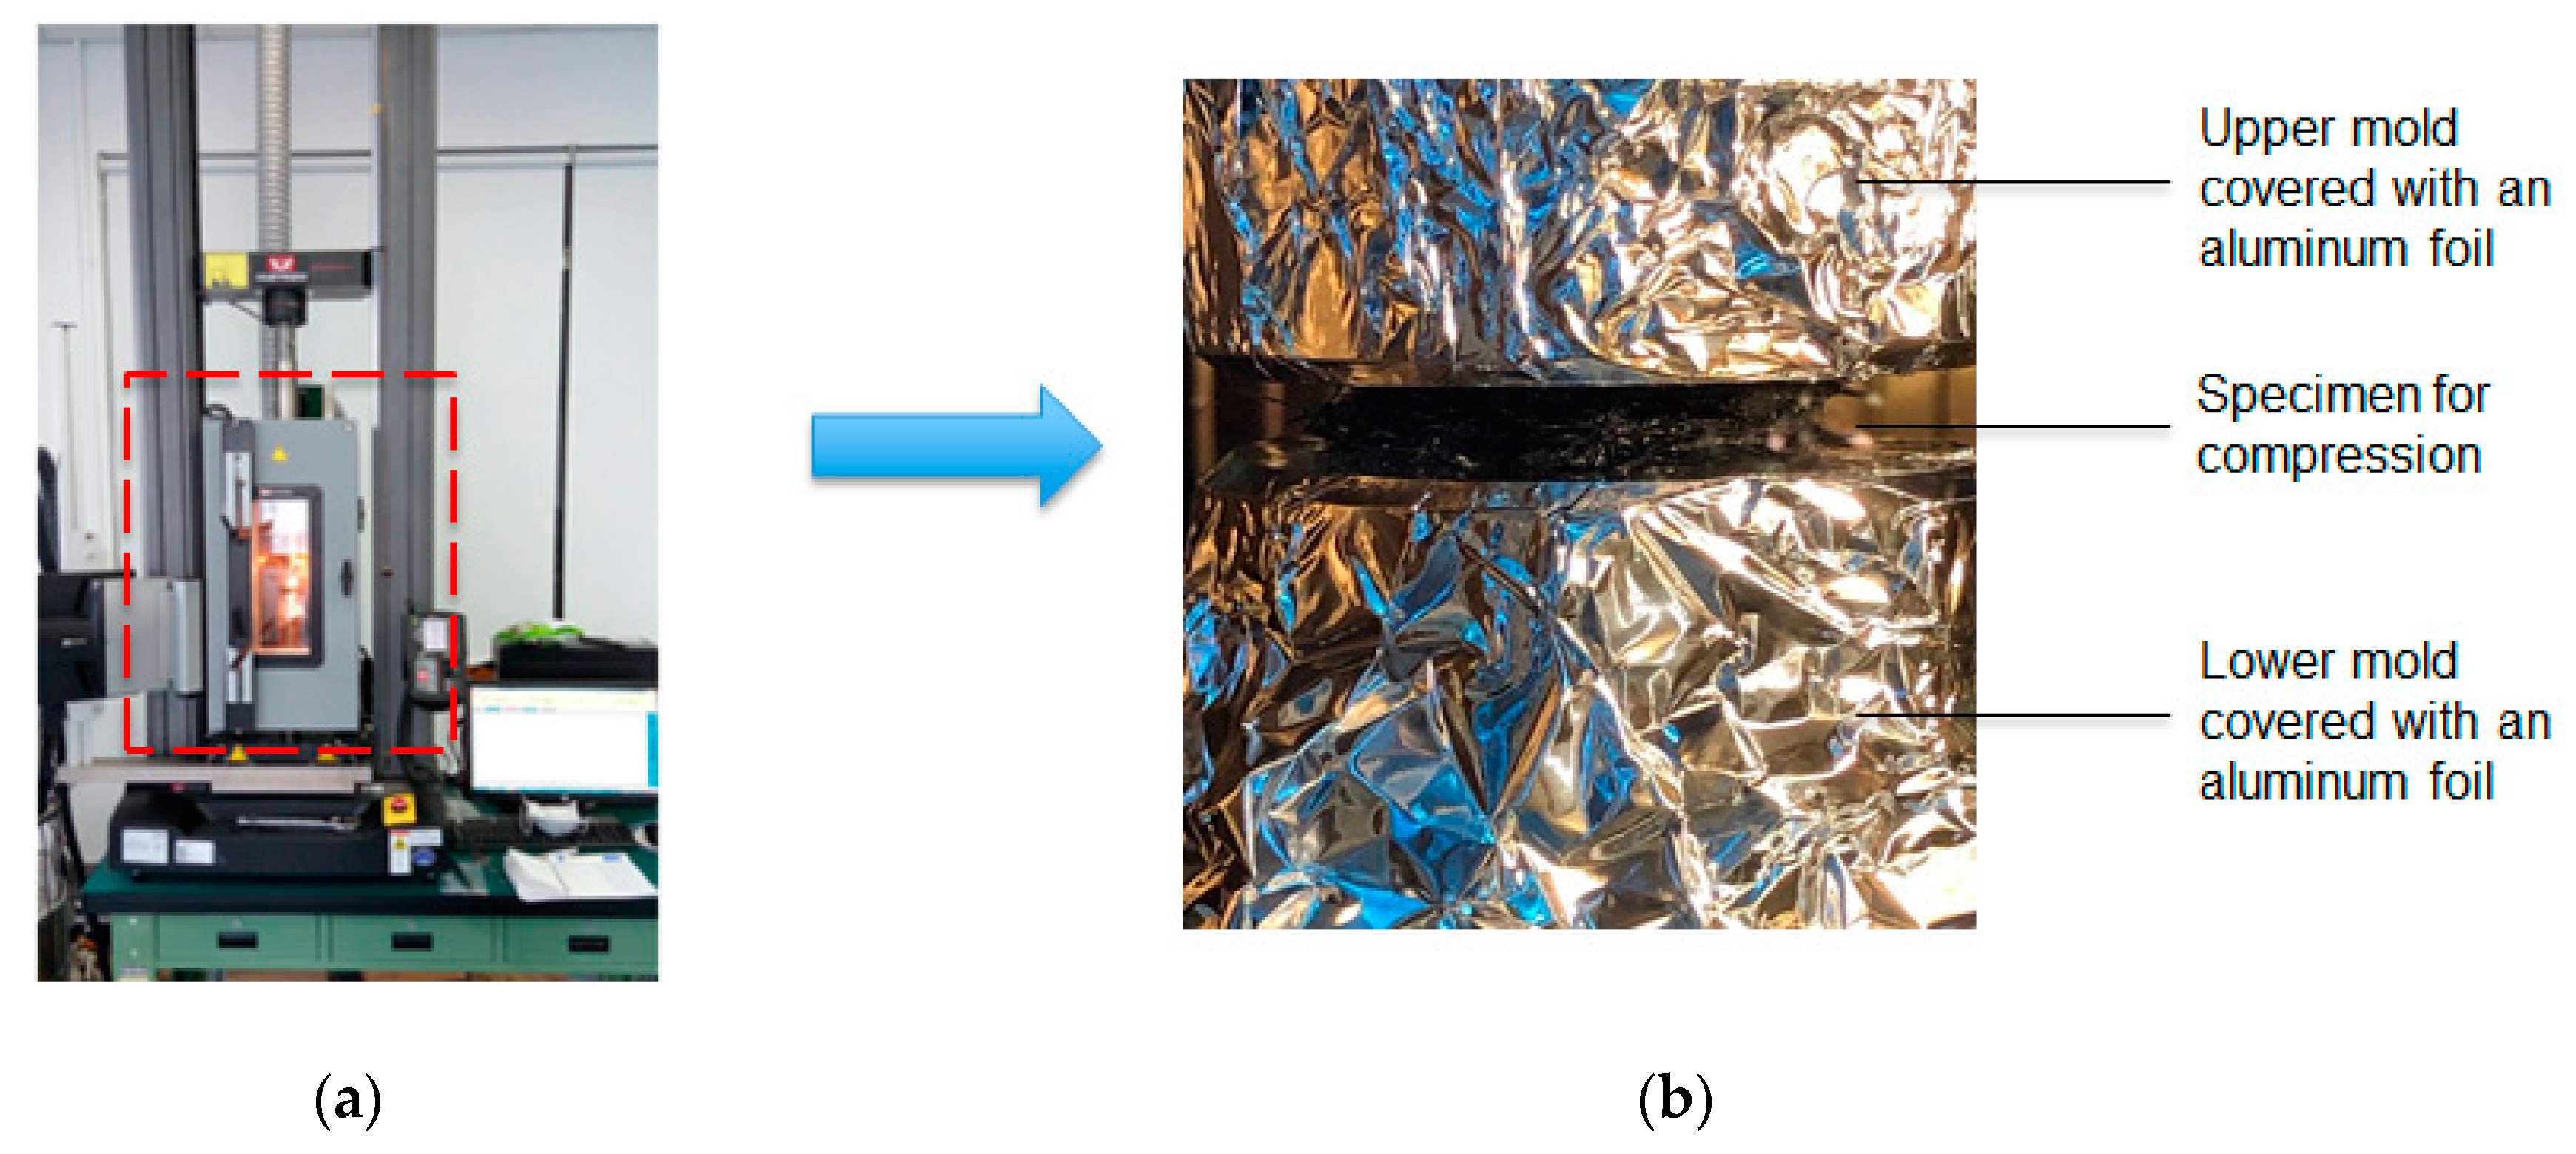
2.3. Experimental Setup and Related Information
2.4. Numerical Simulation Setup and Related Information
3. Results and Discussion
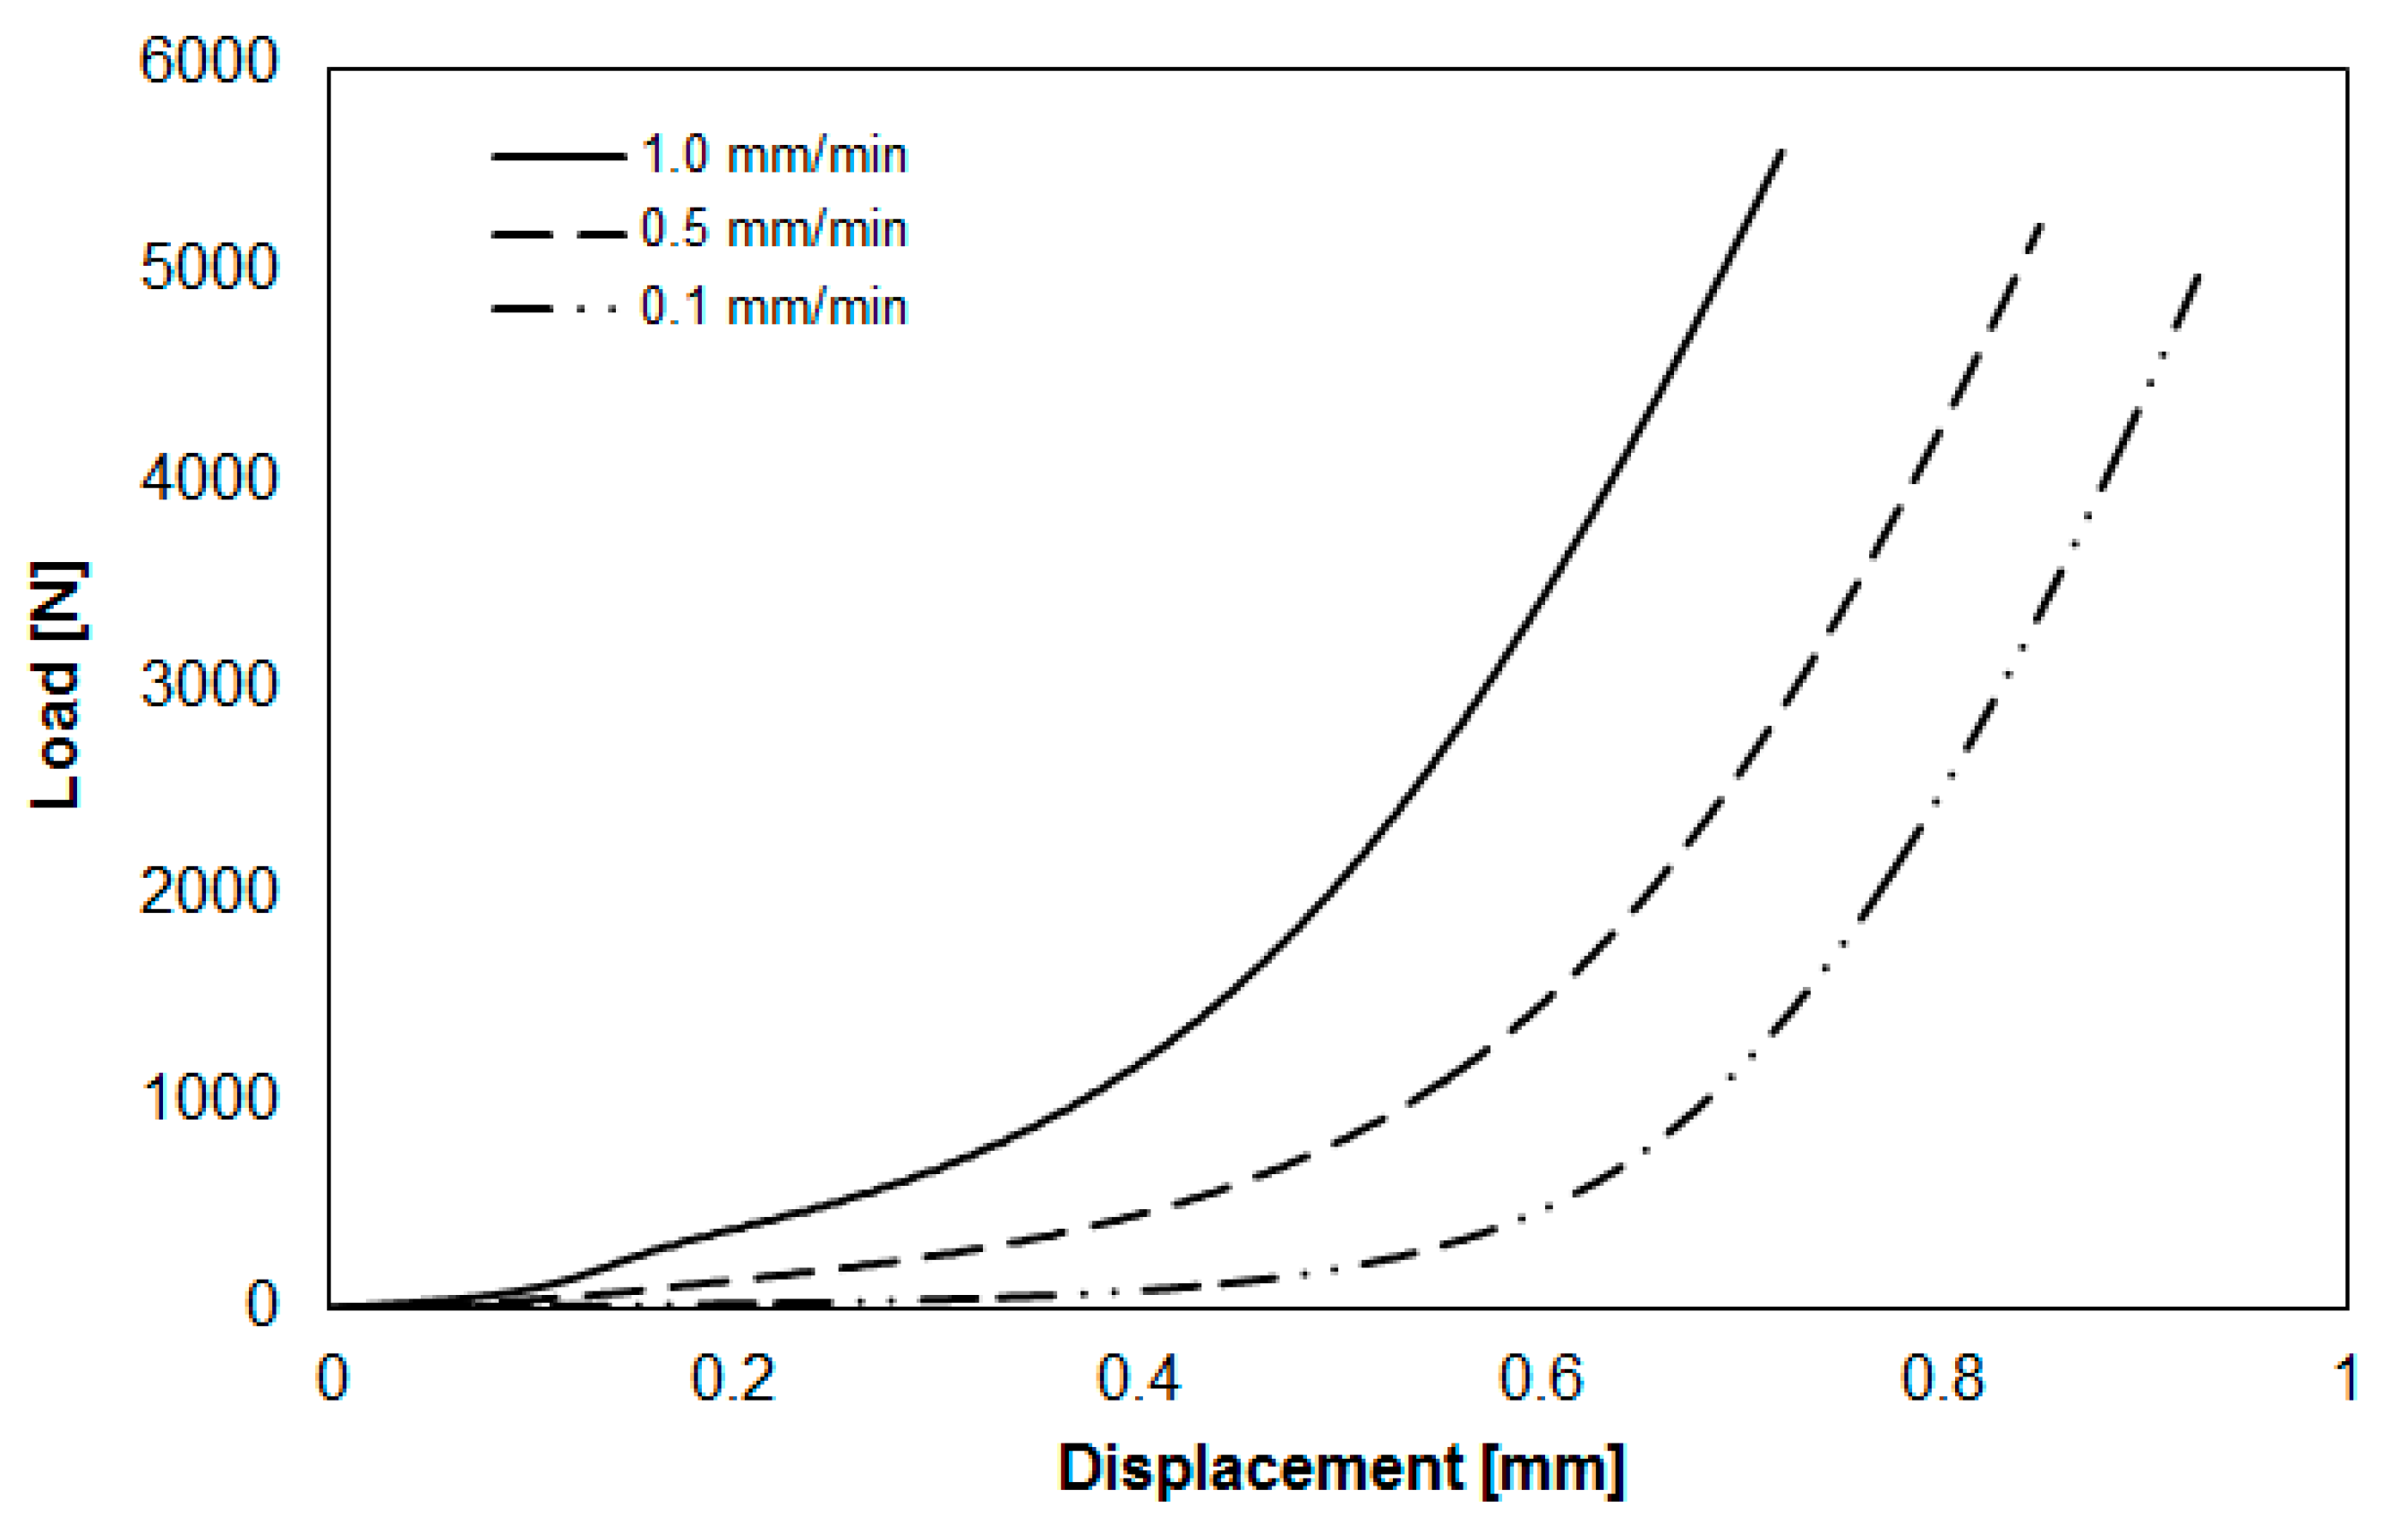
3.1. Basic Compression Experiment and Data Analysis
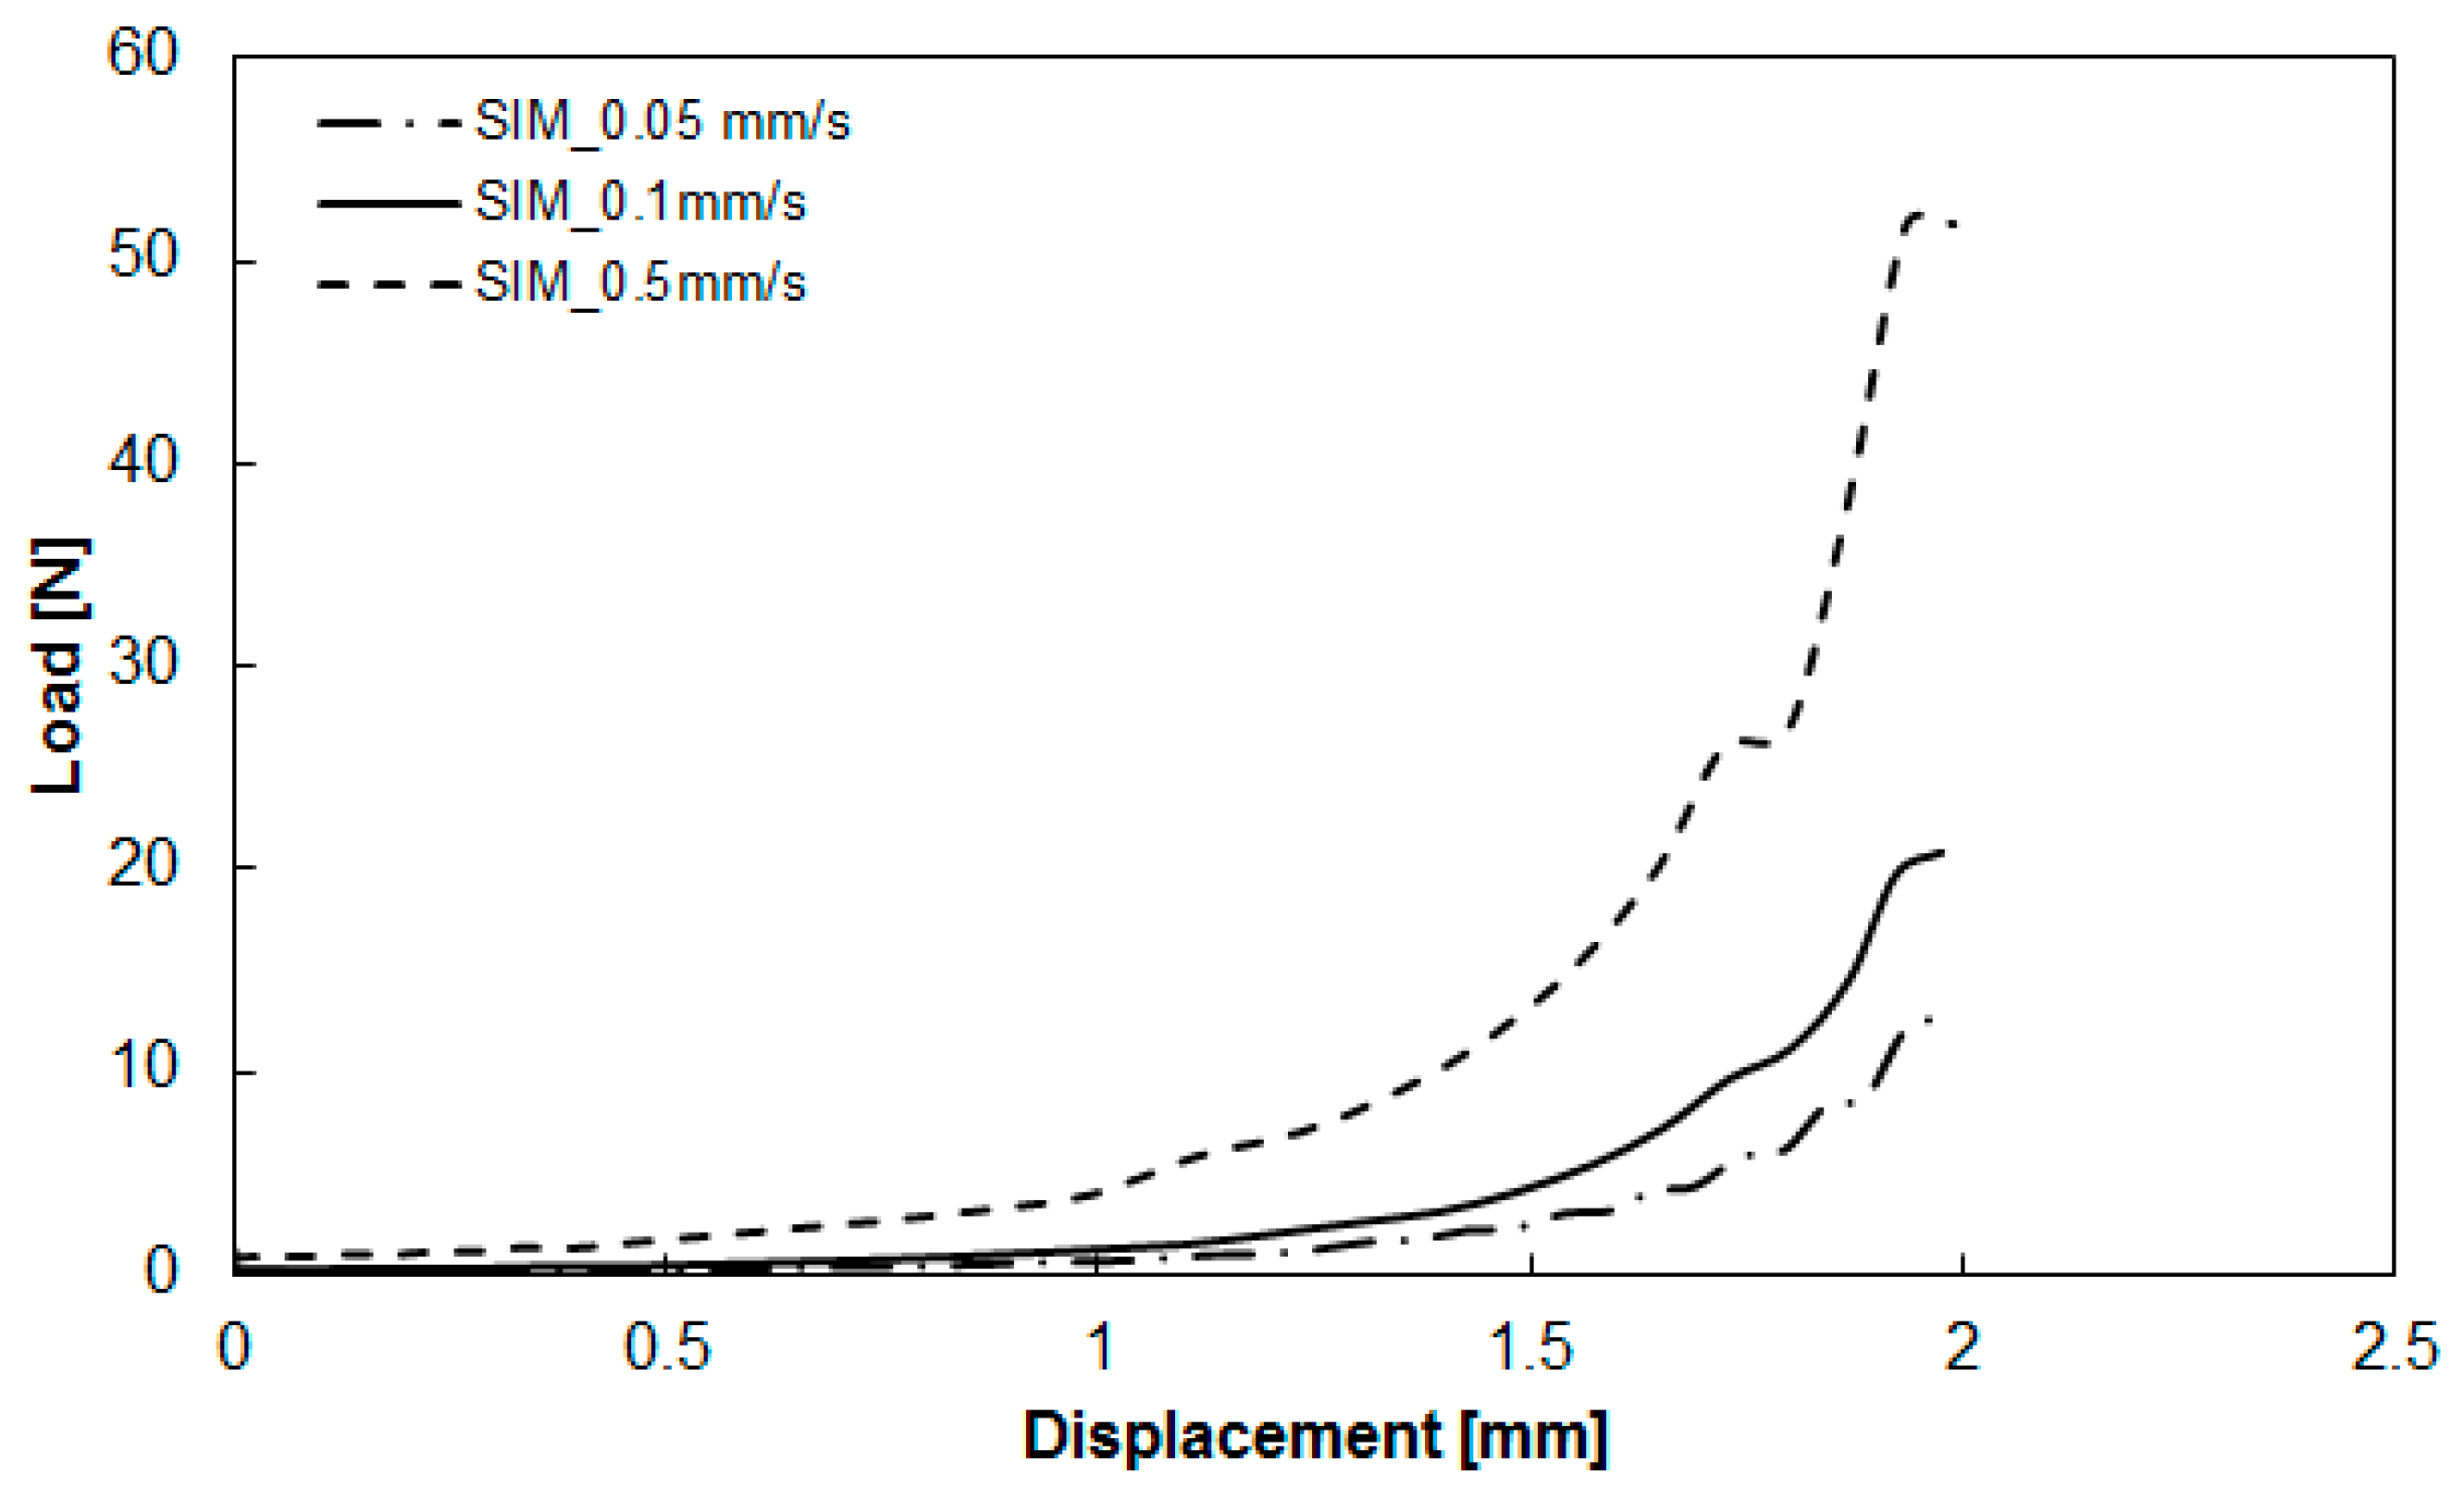
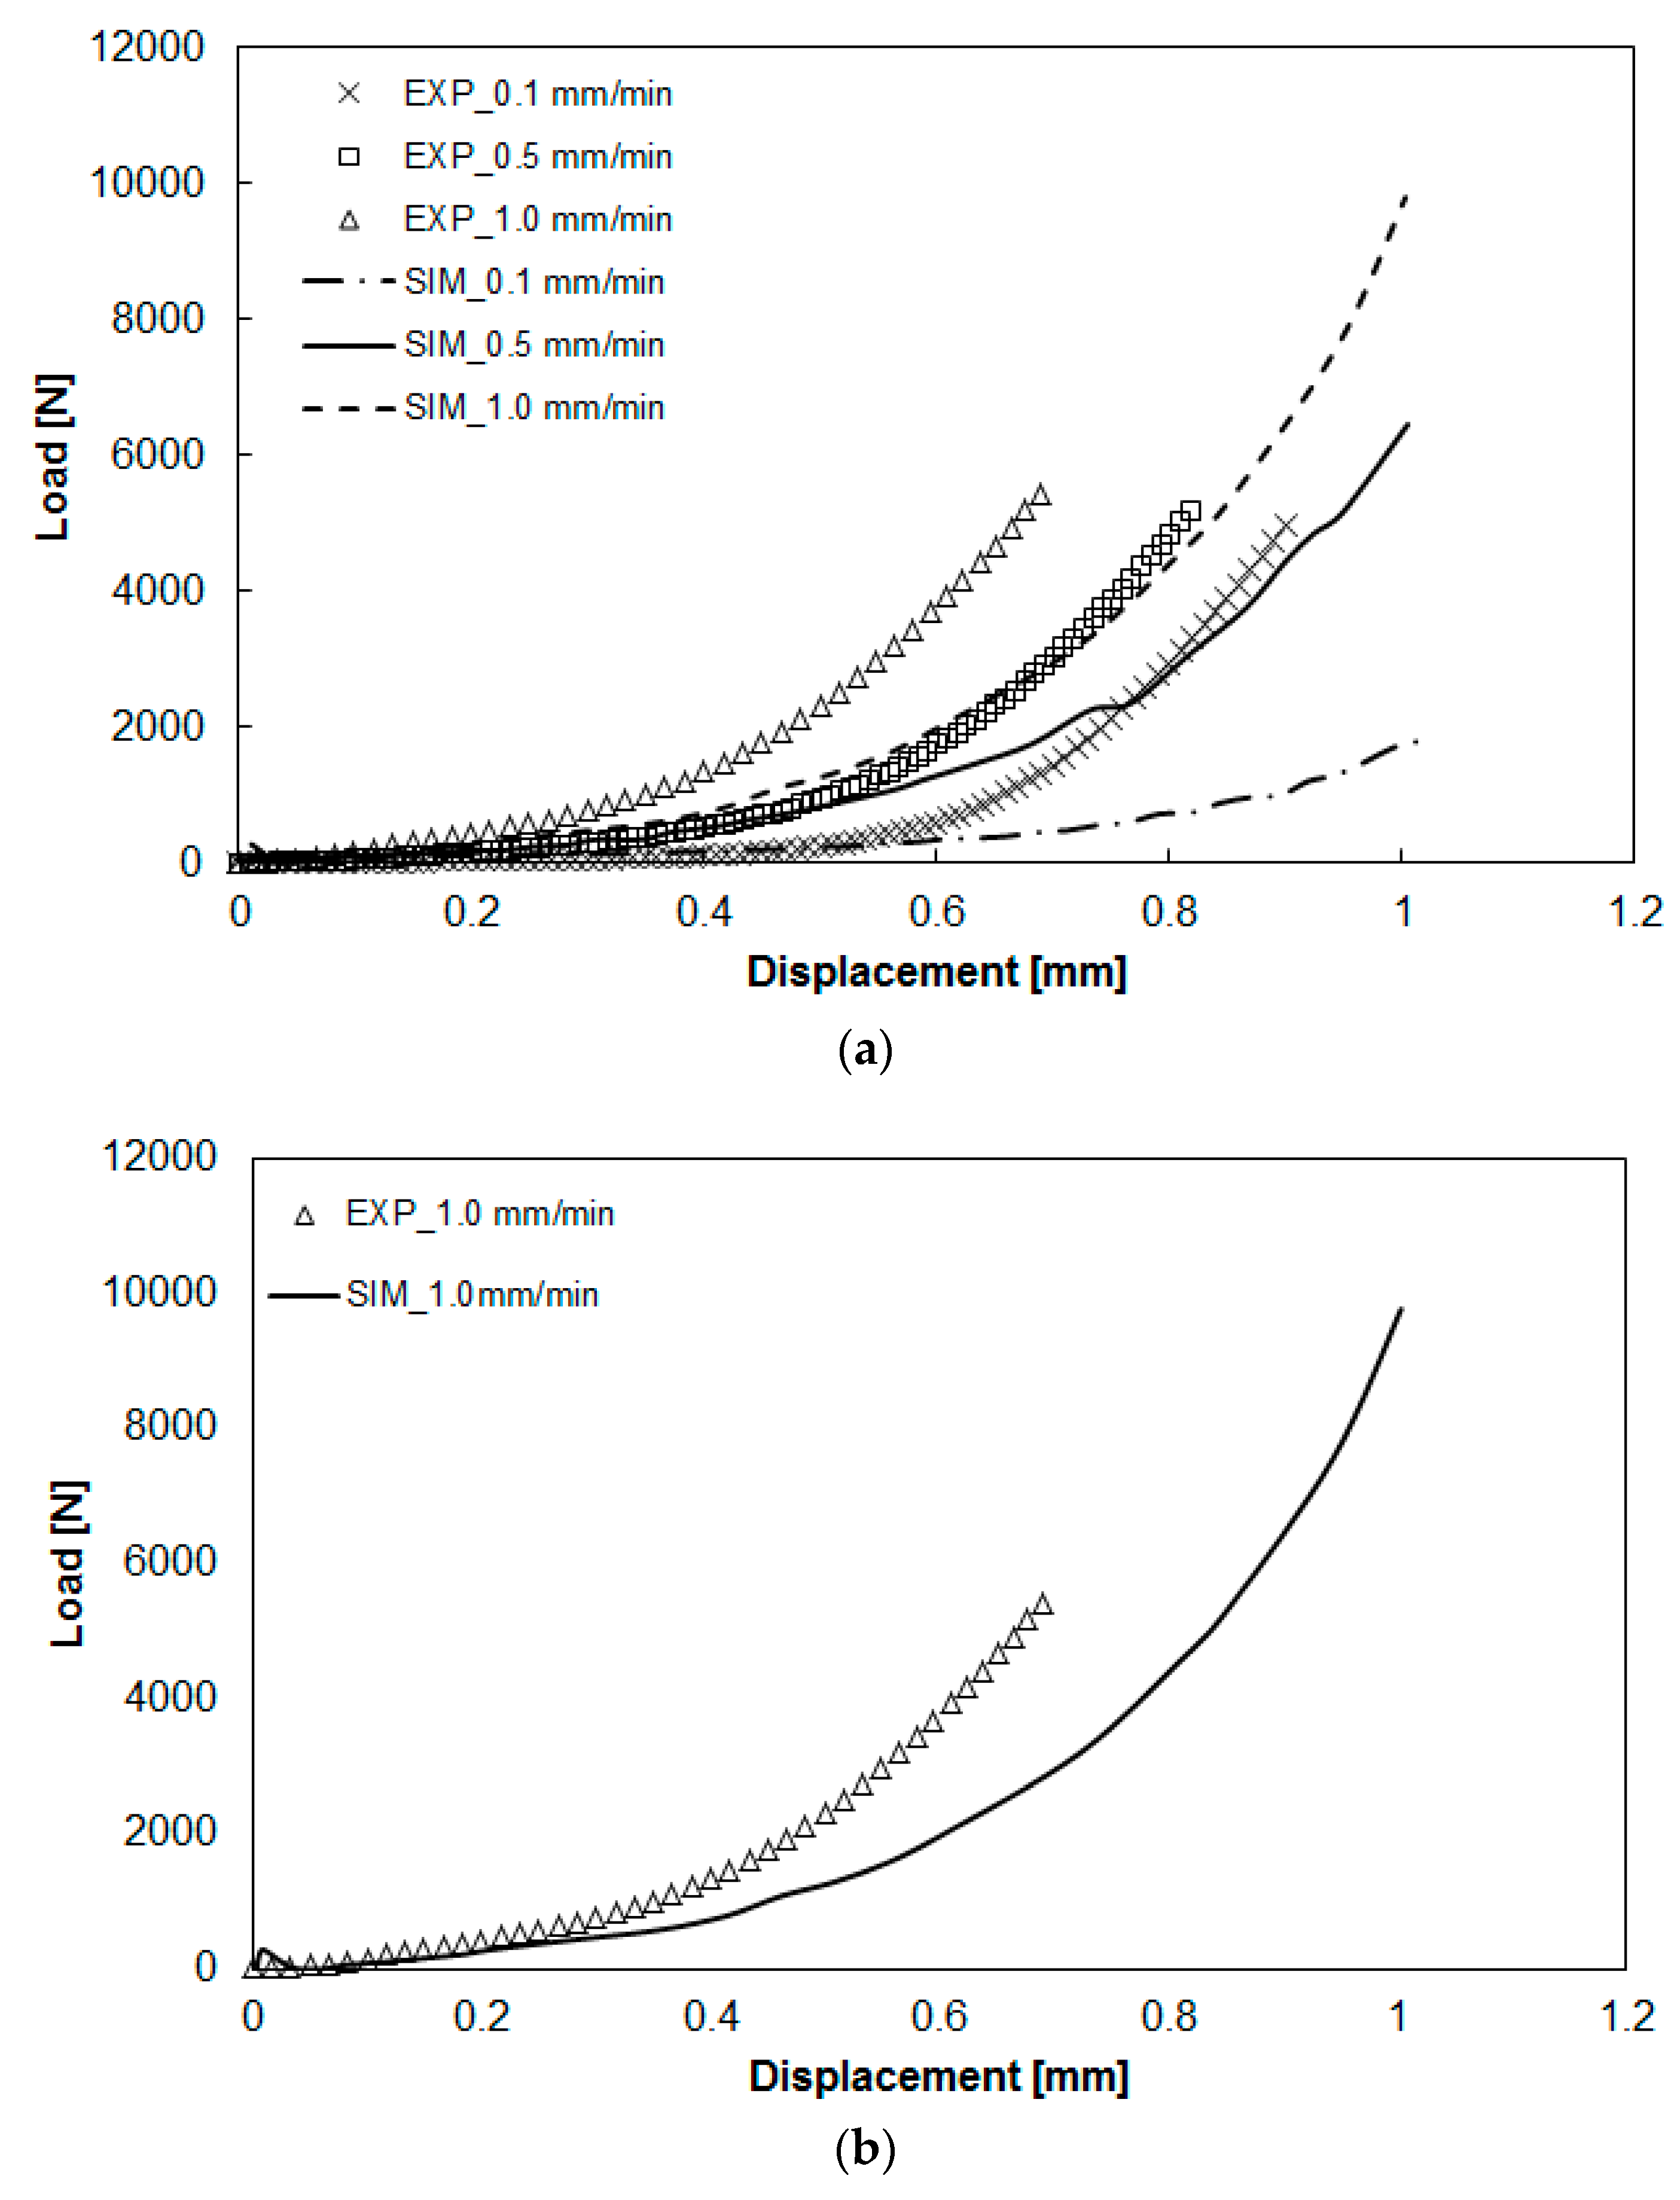
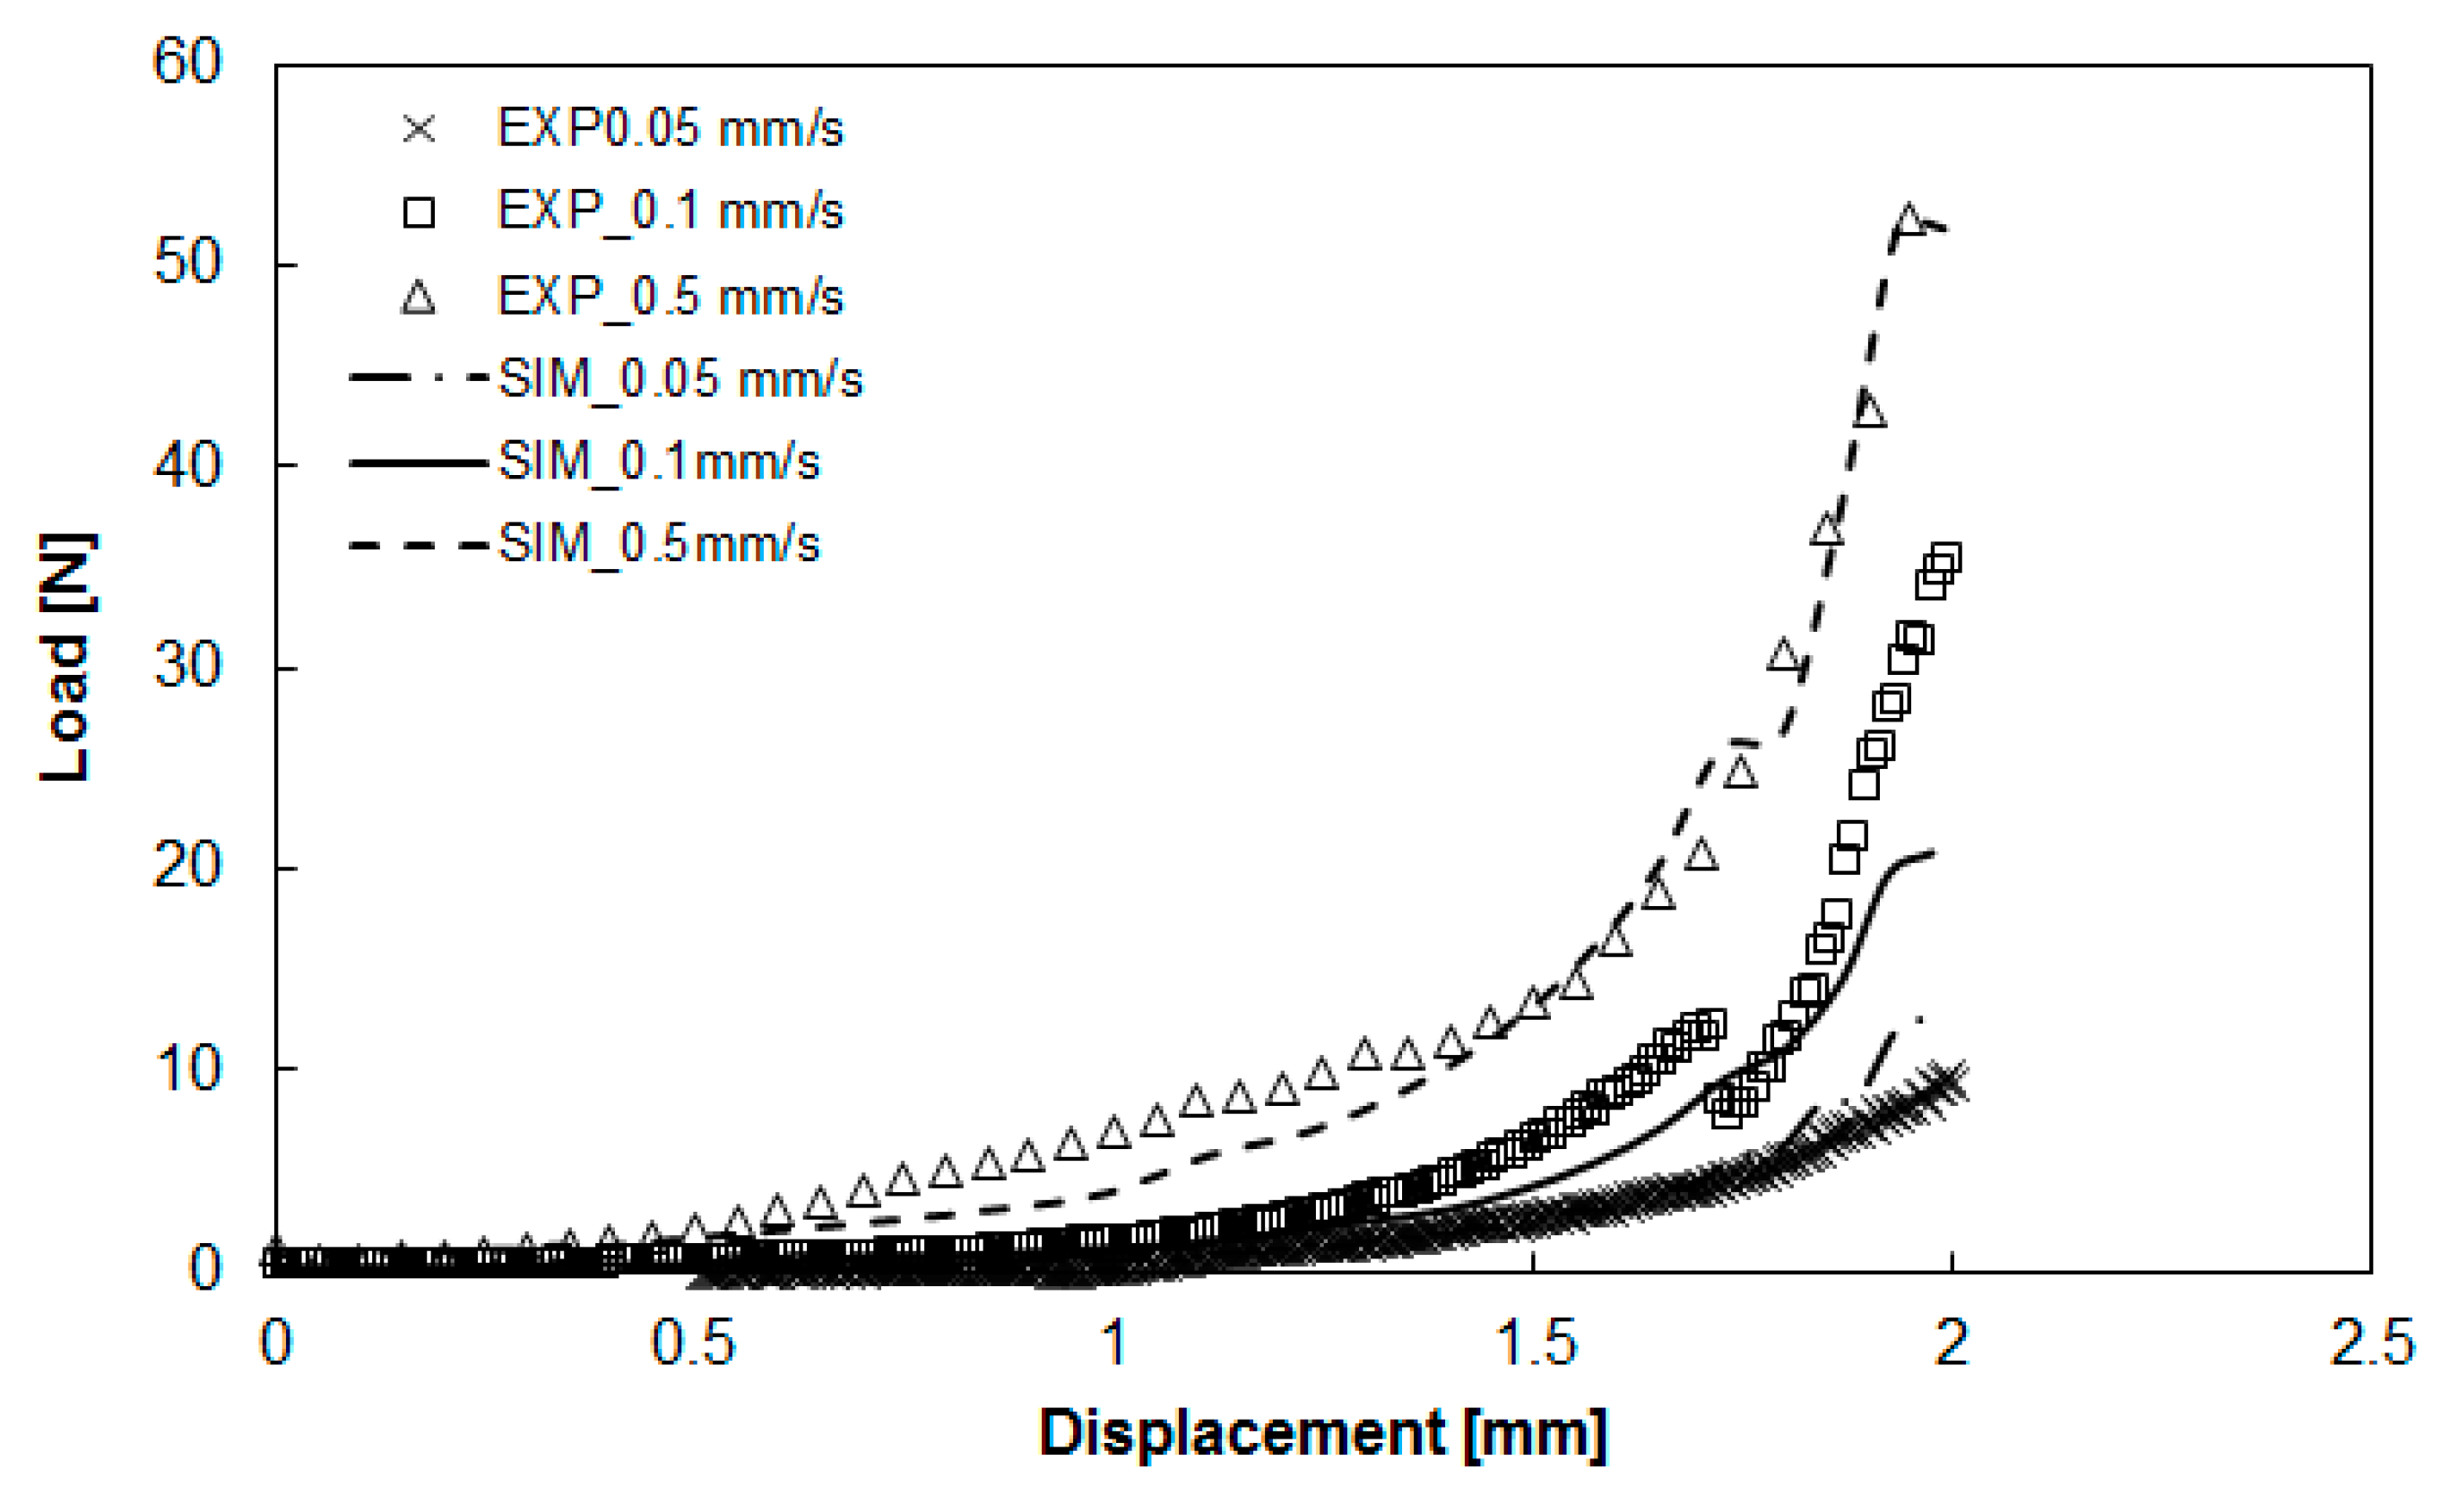
3.2. Deviations between Numerical Simulation and Experimental Study
3.3. Search for the Mechanism Responsible of the Deviation
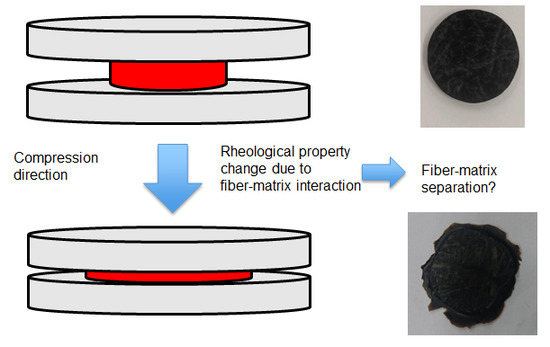
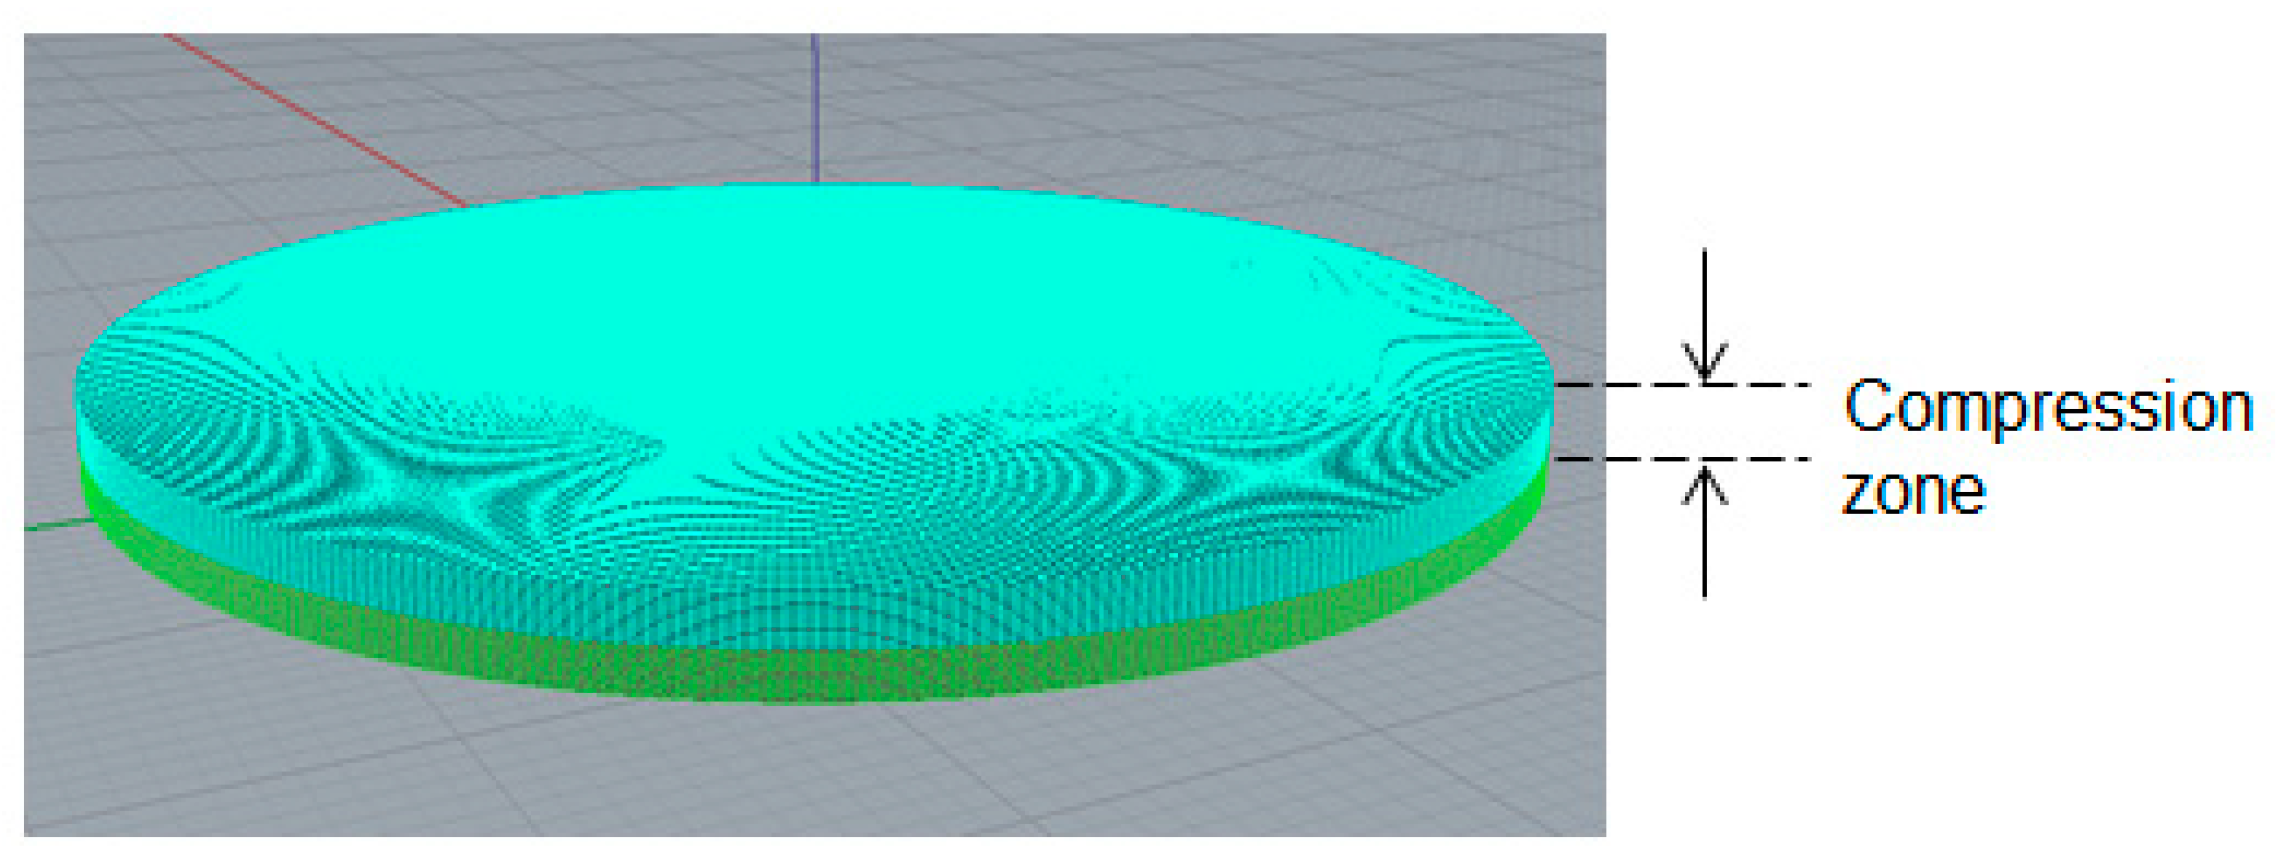
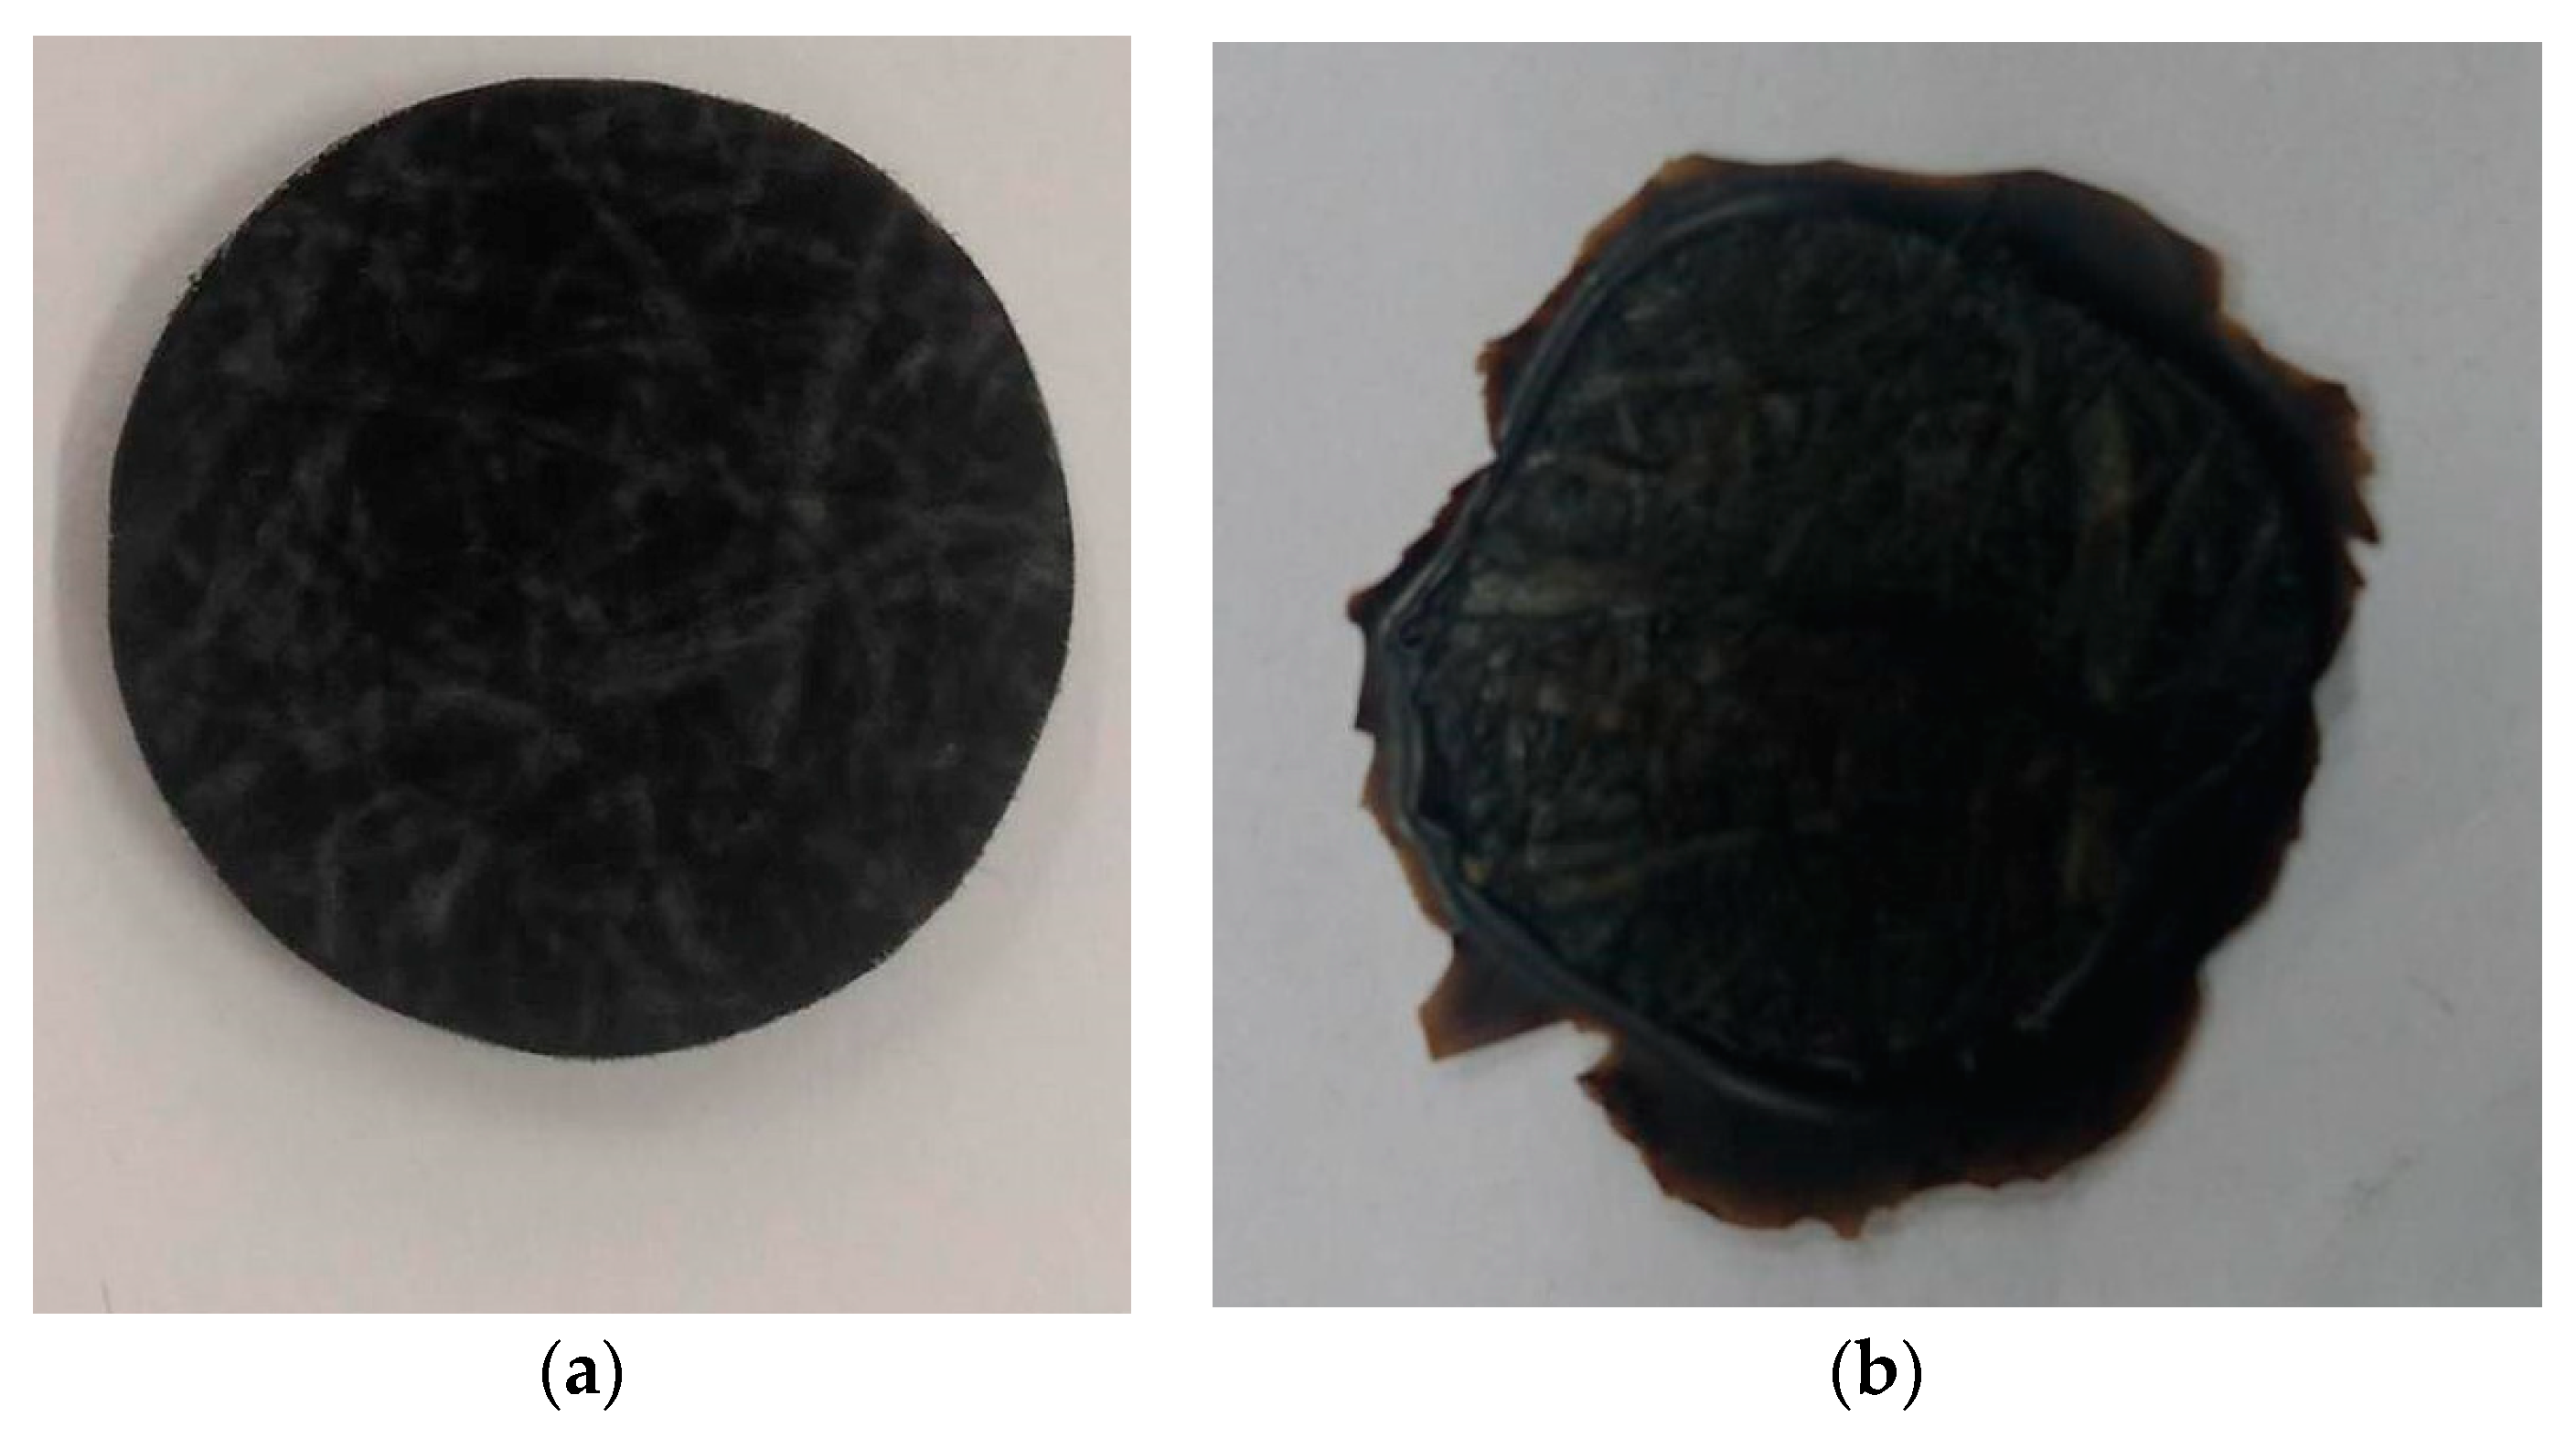
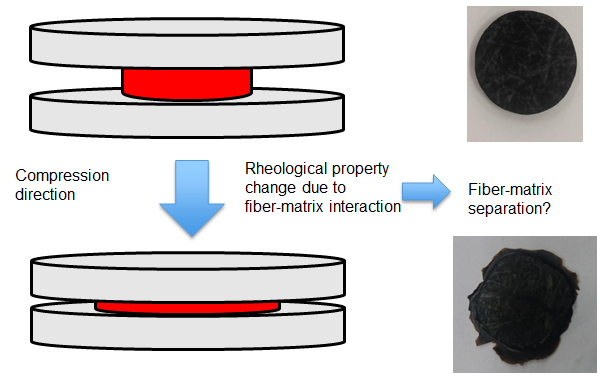
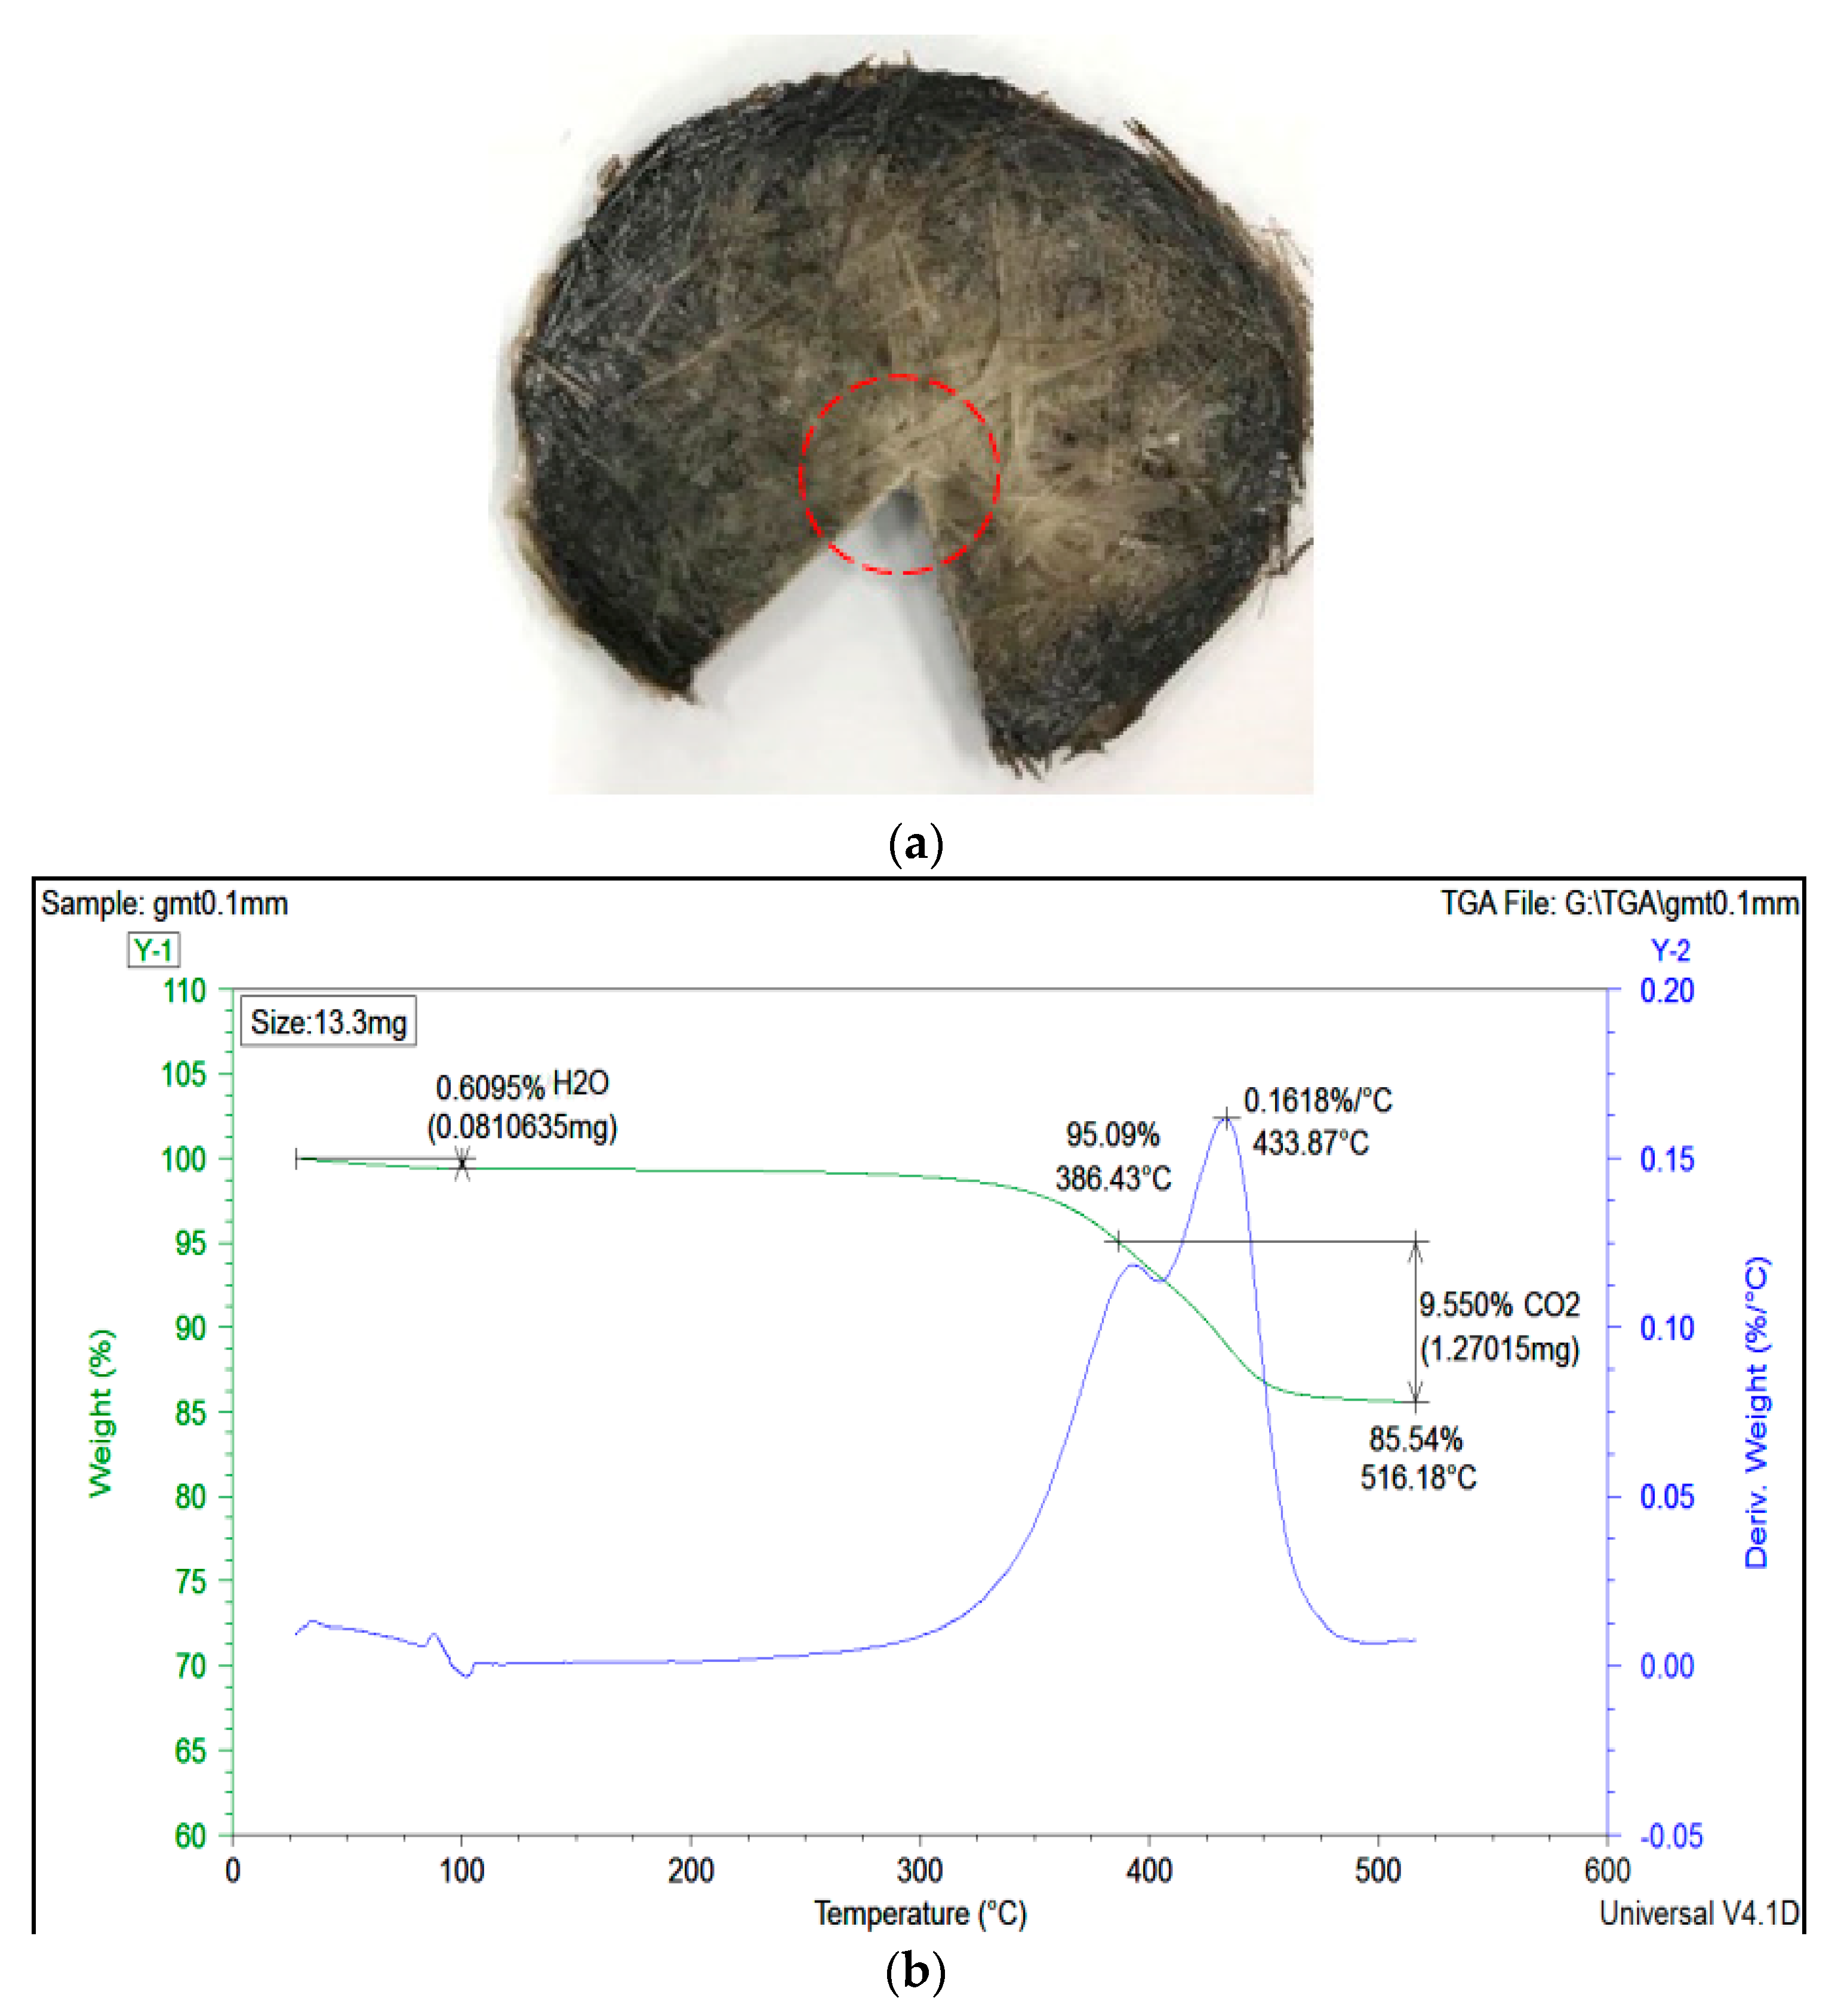
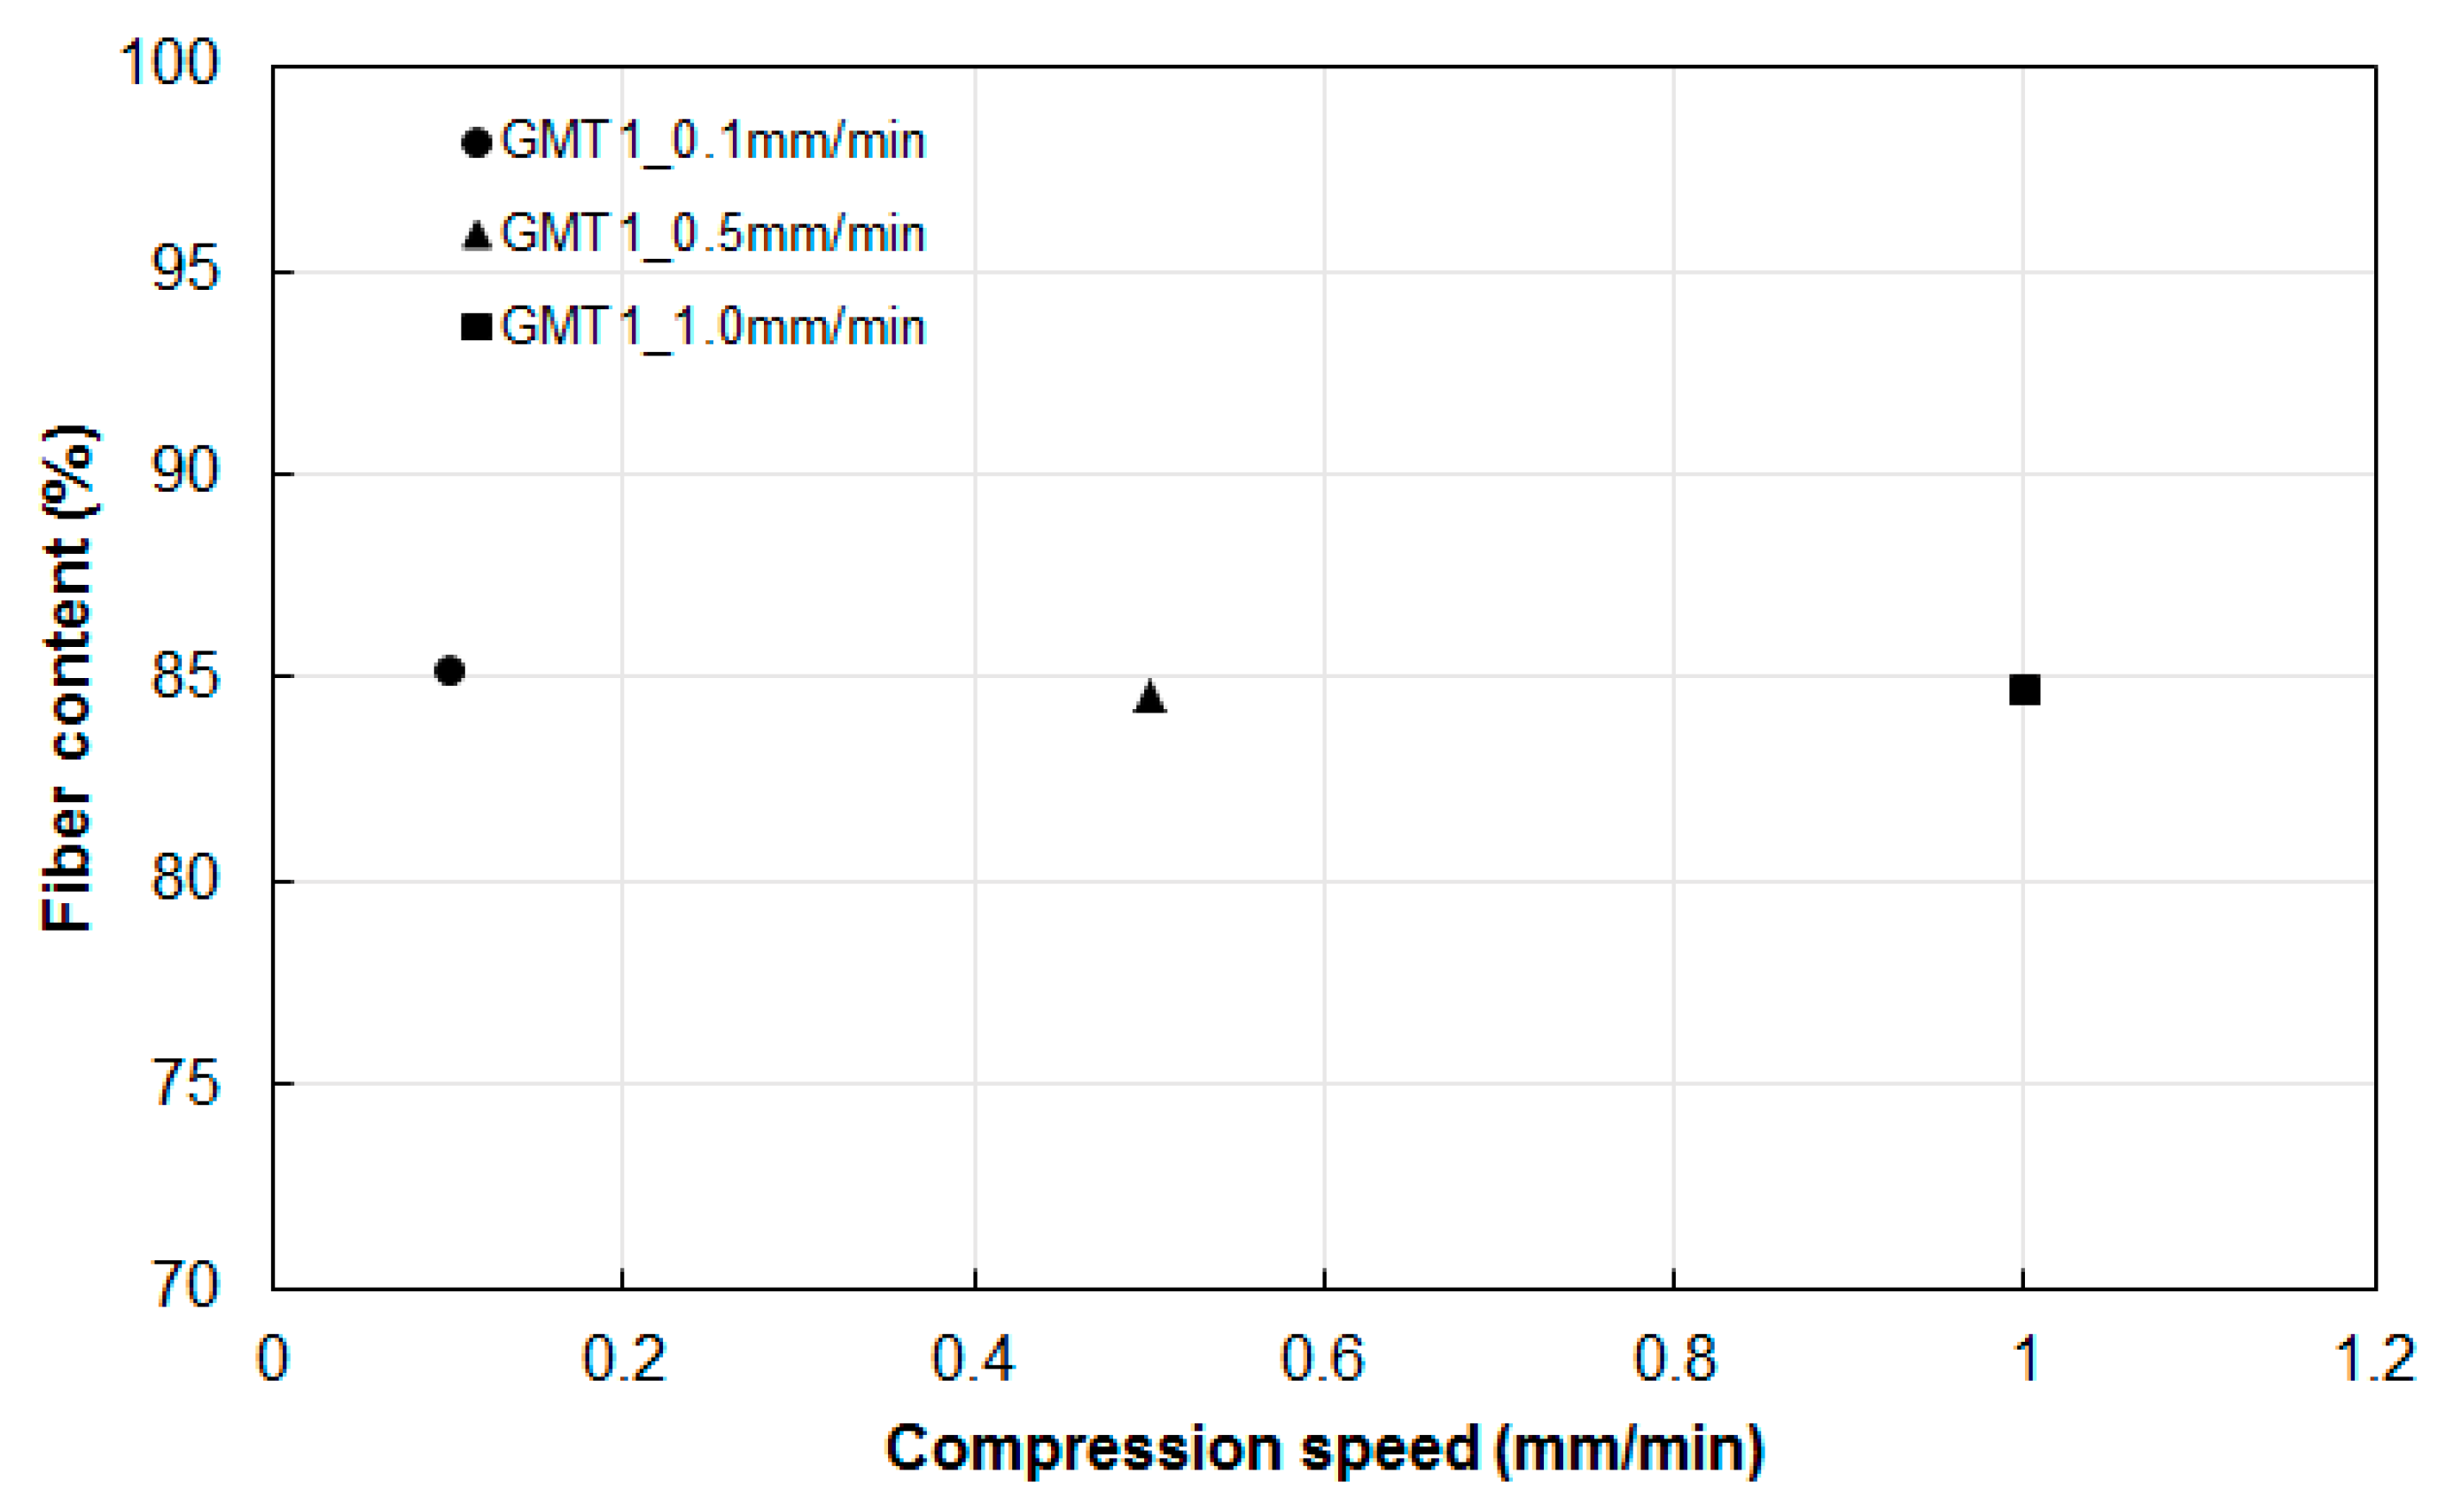
3.3.1. Fiber–Polymer Matrix Separation Effect
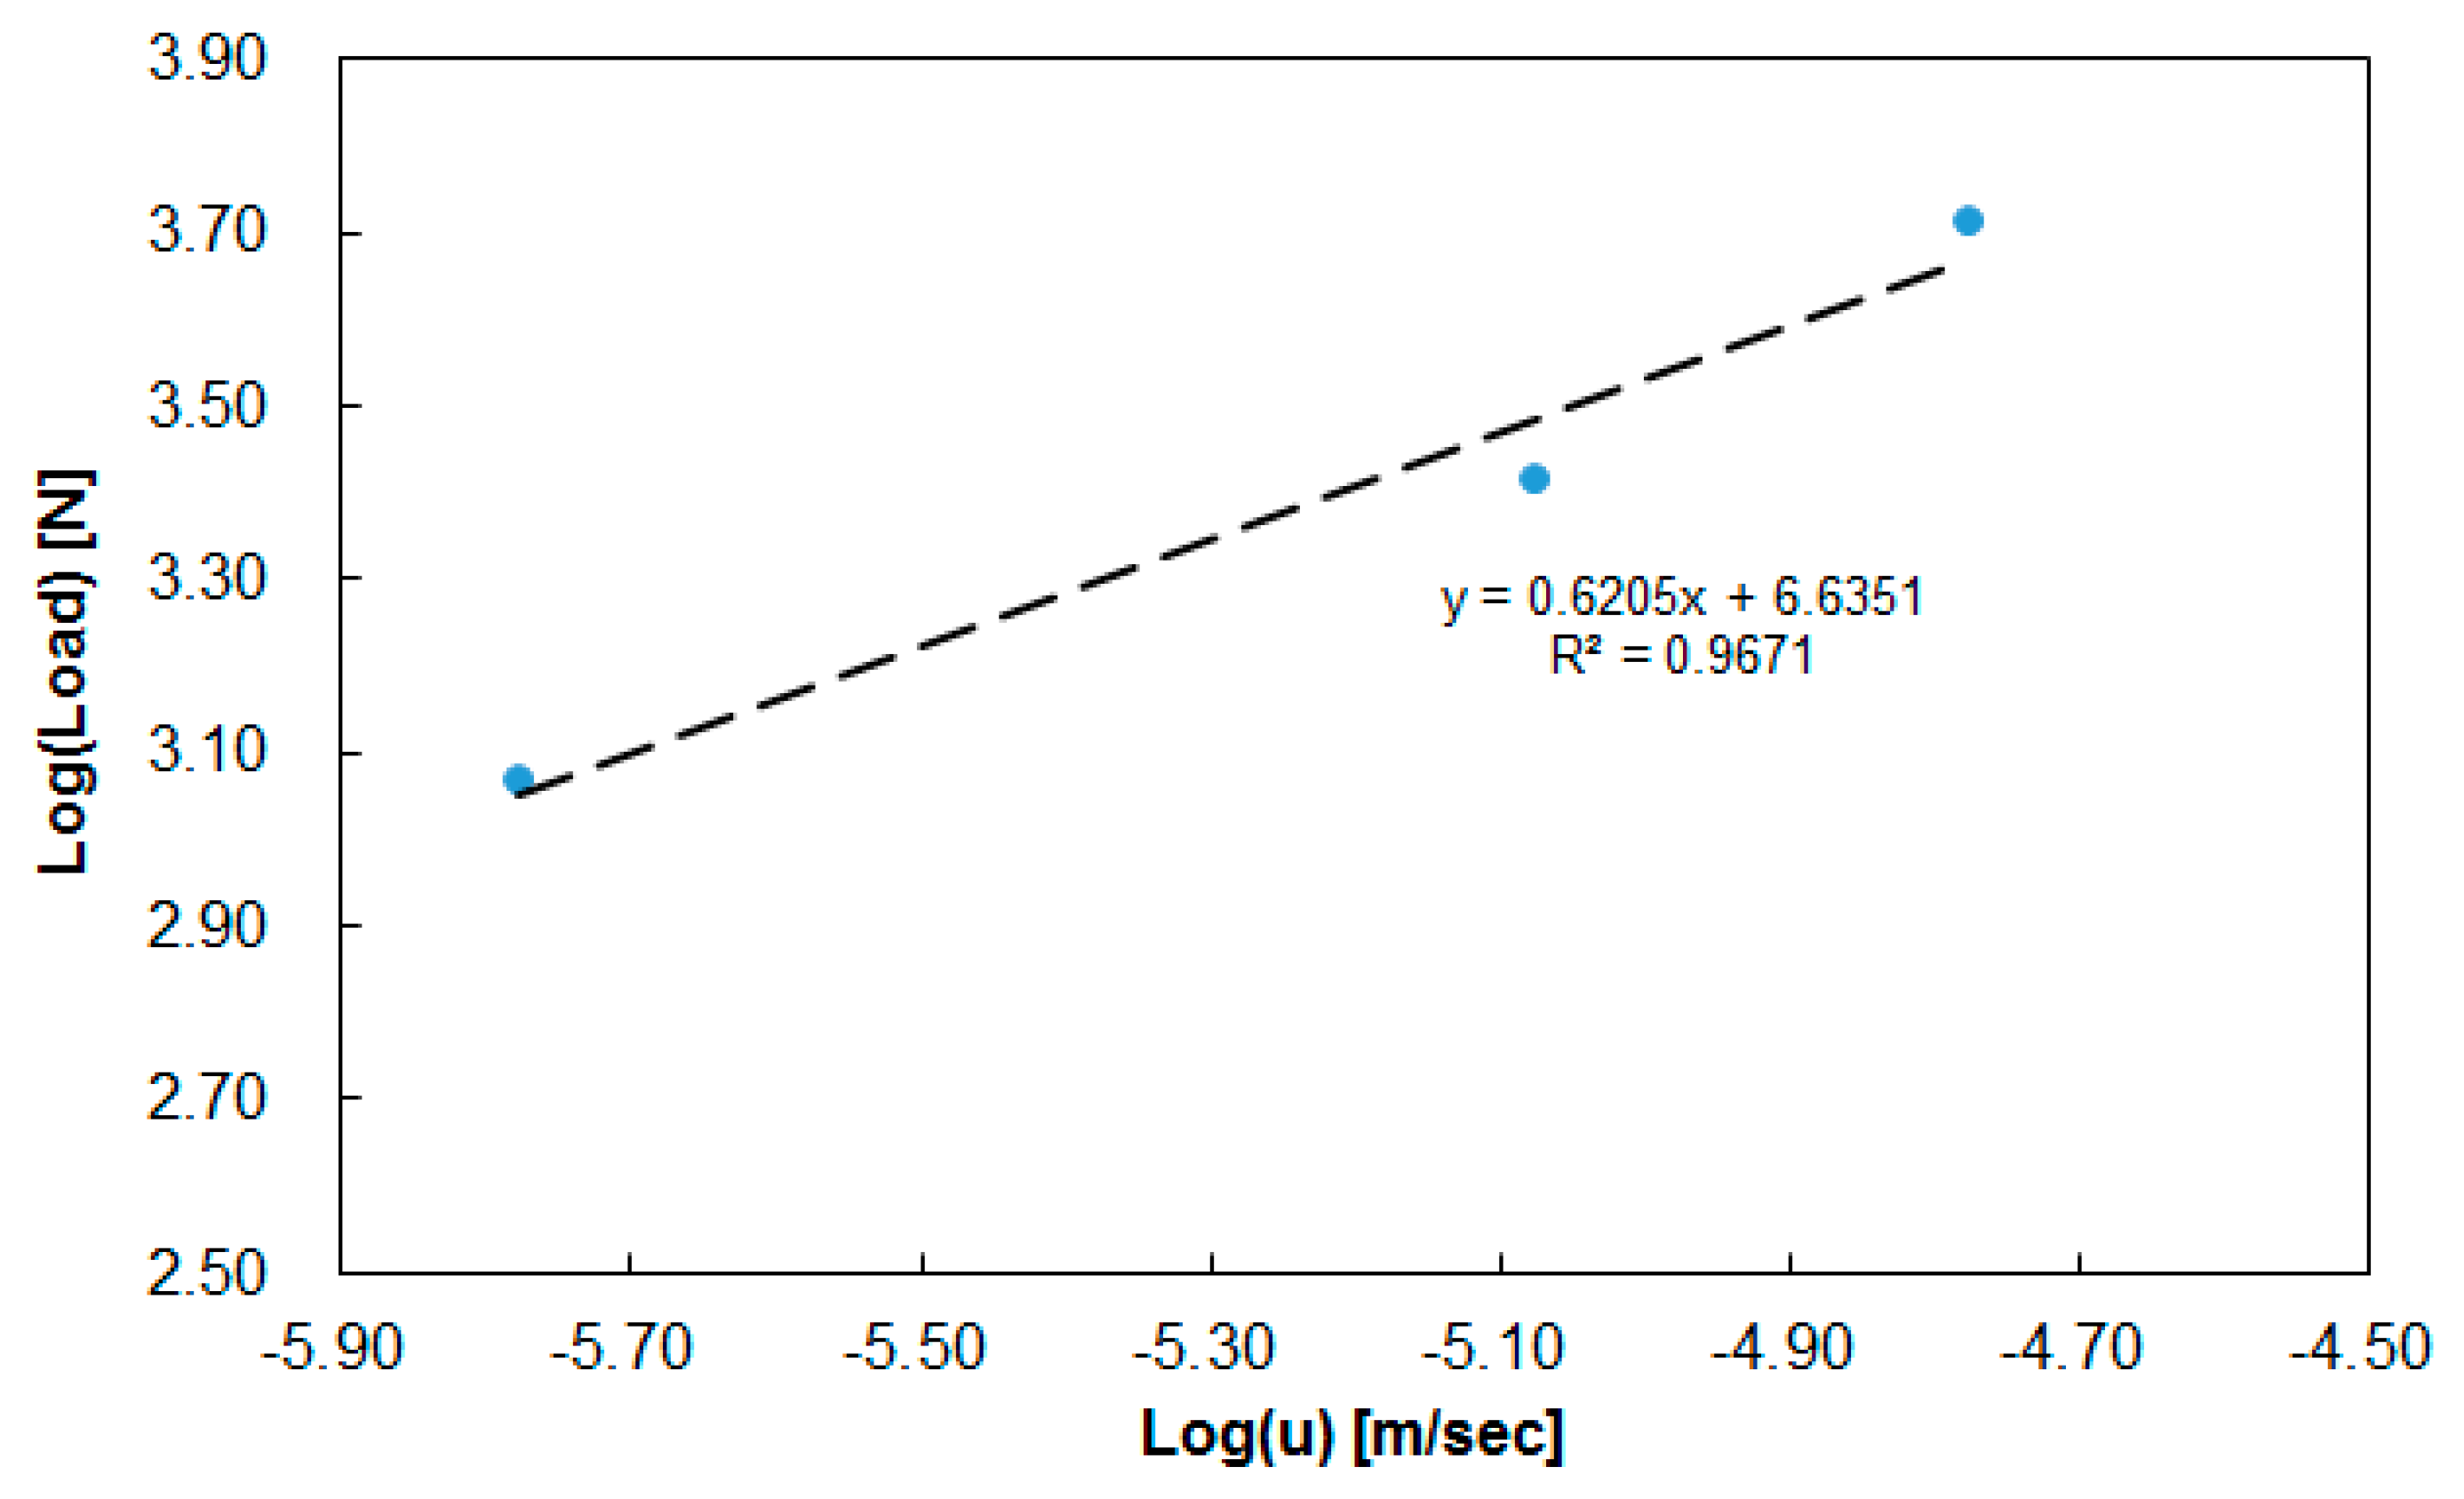
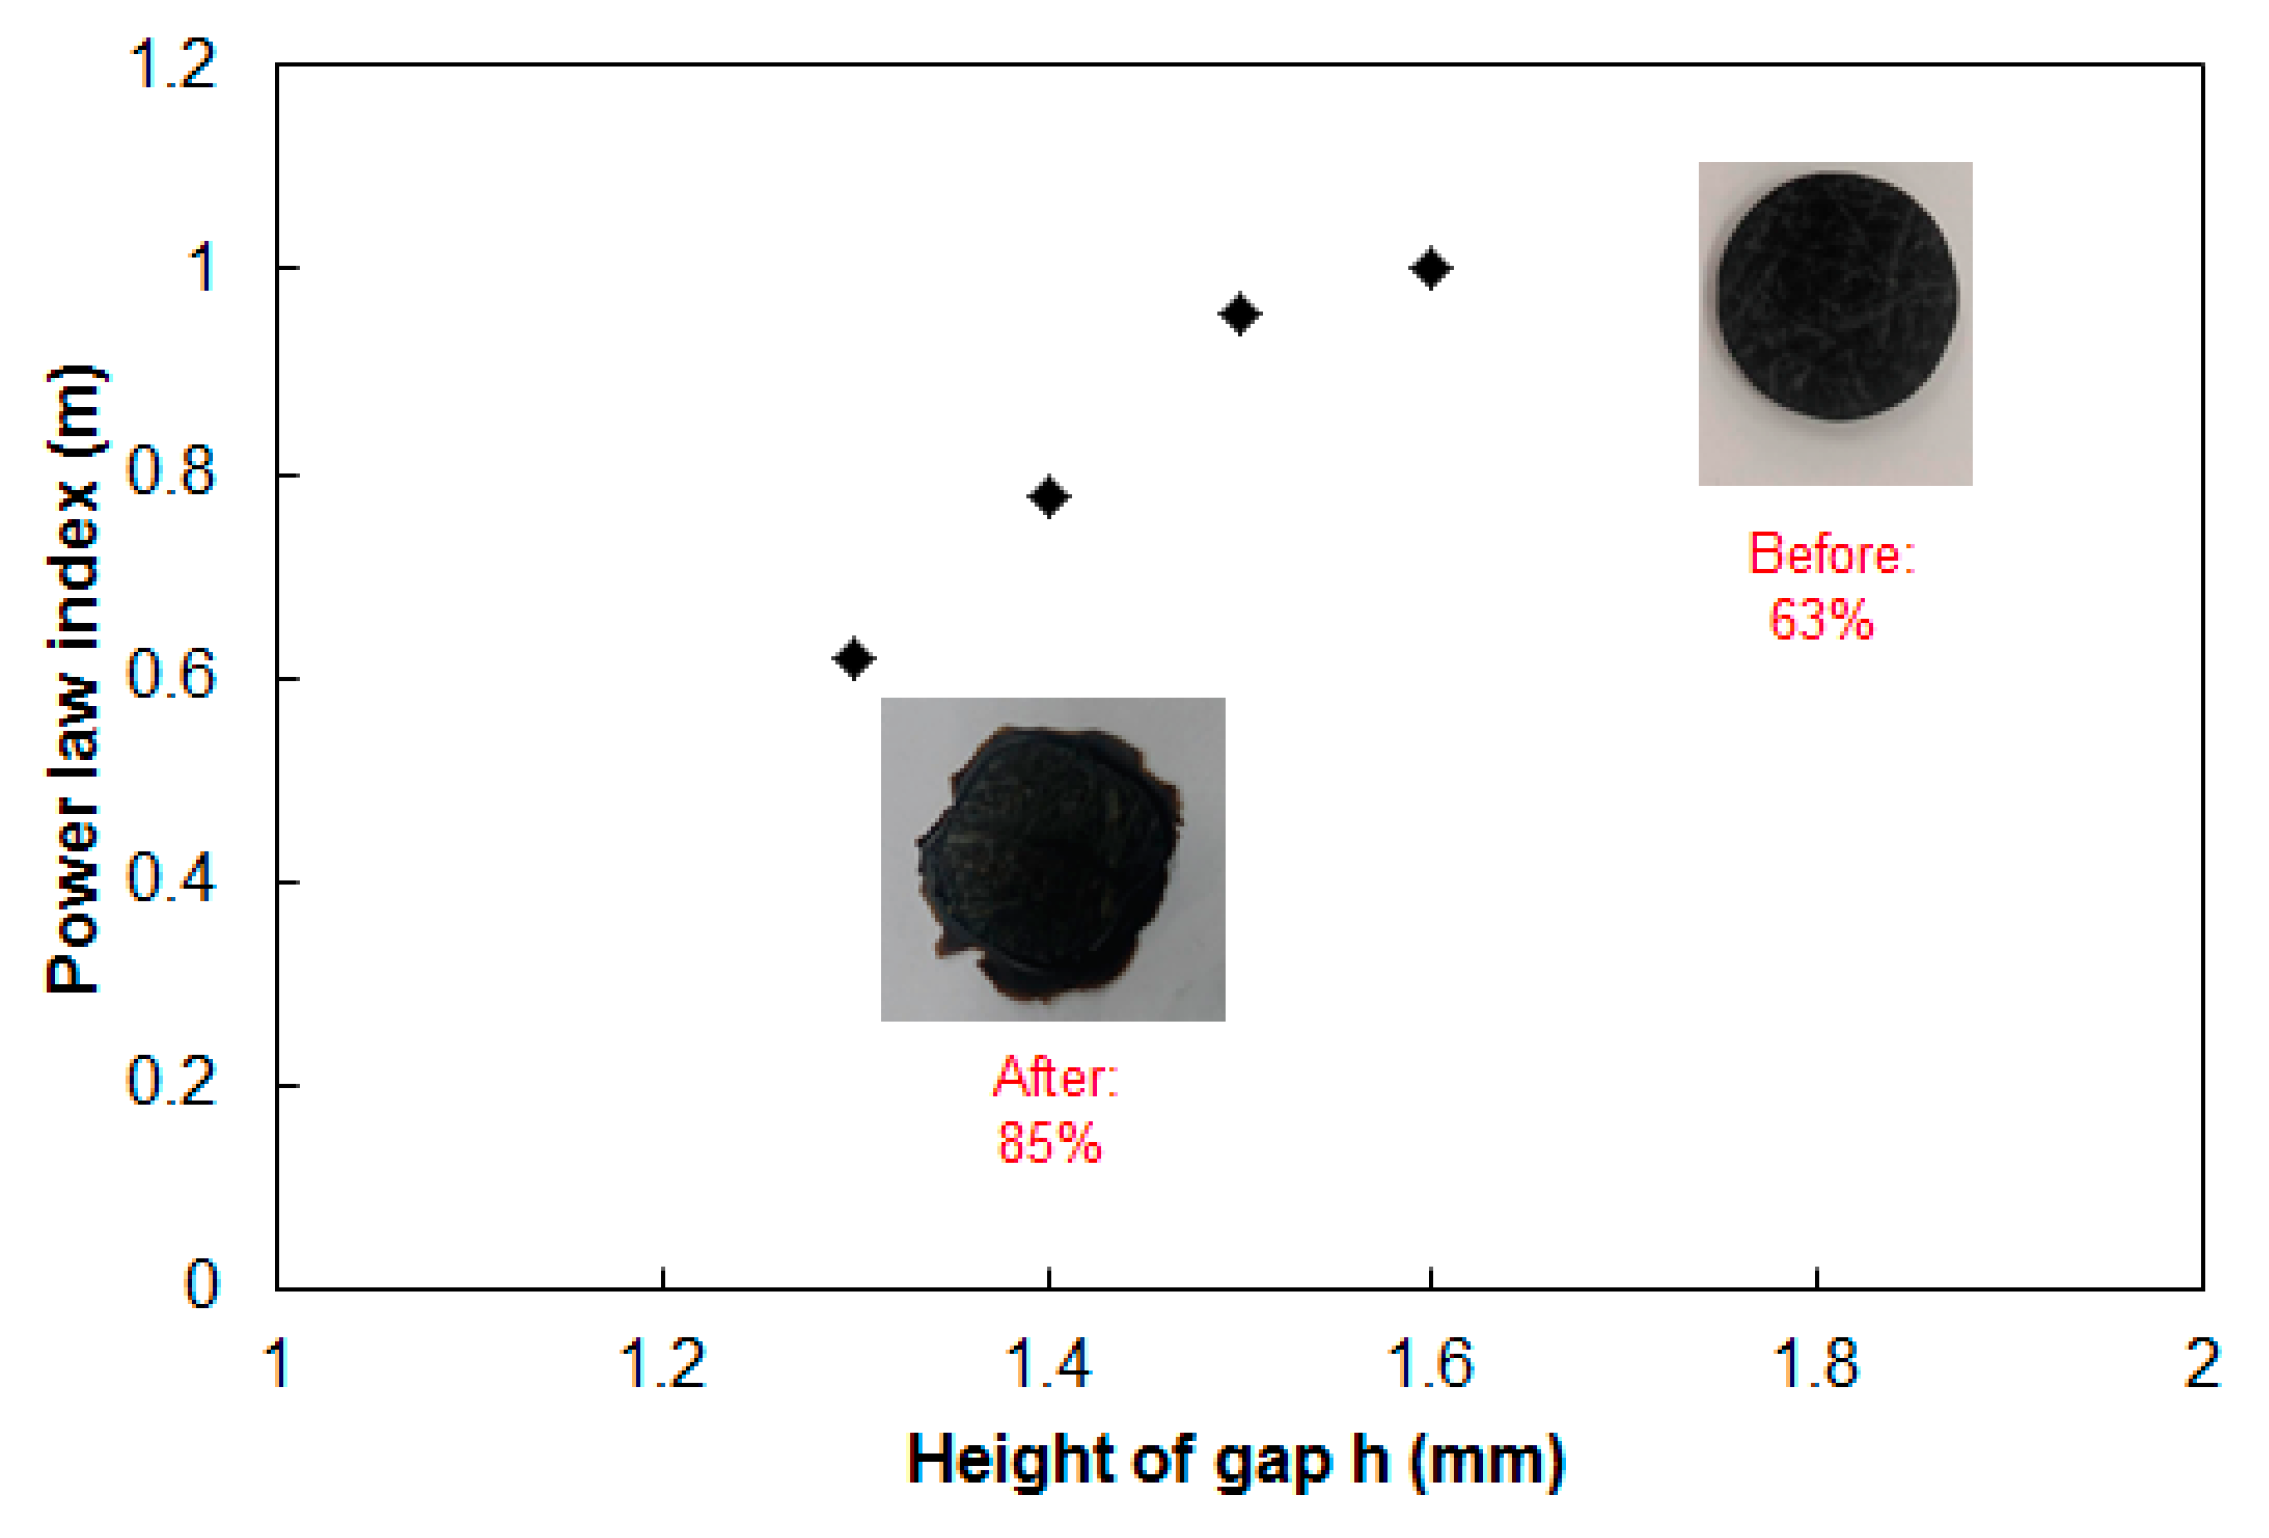
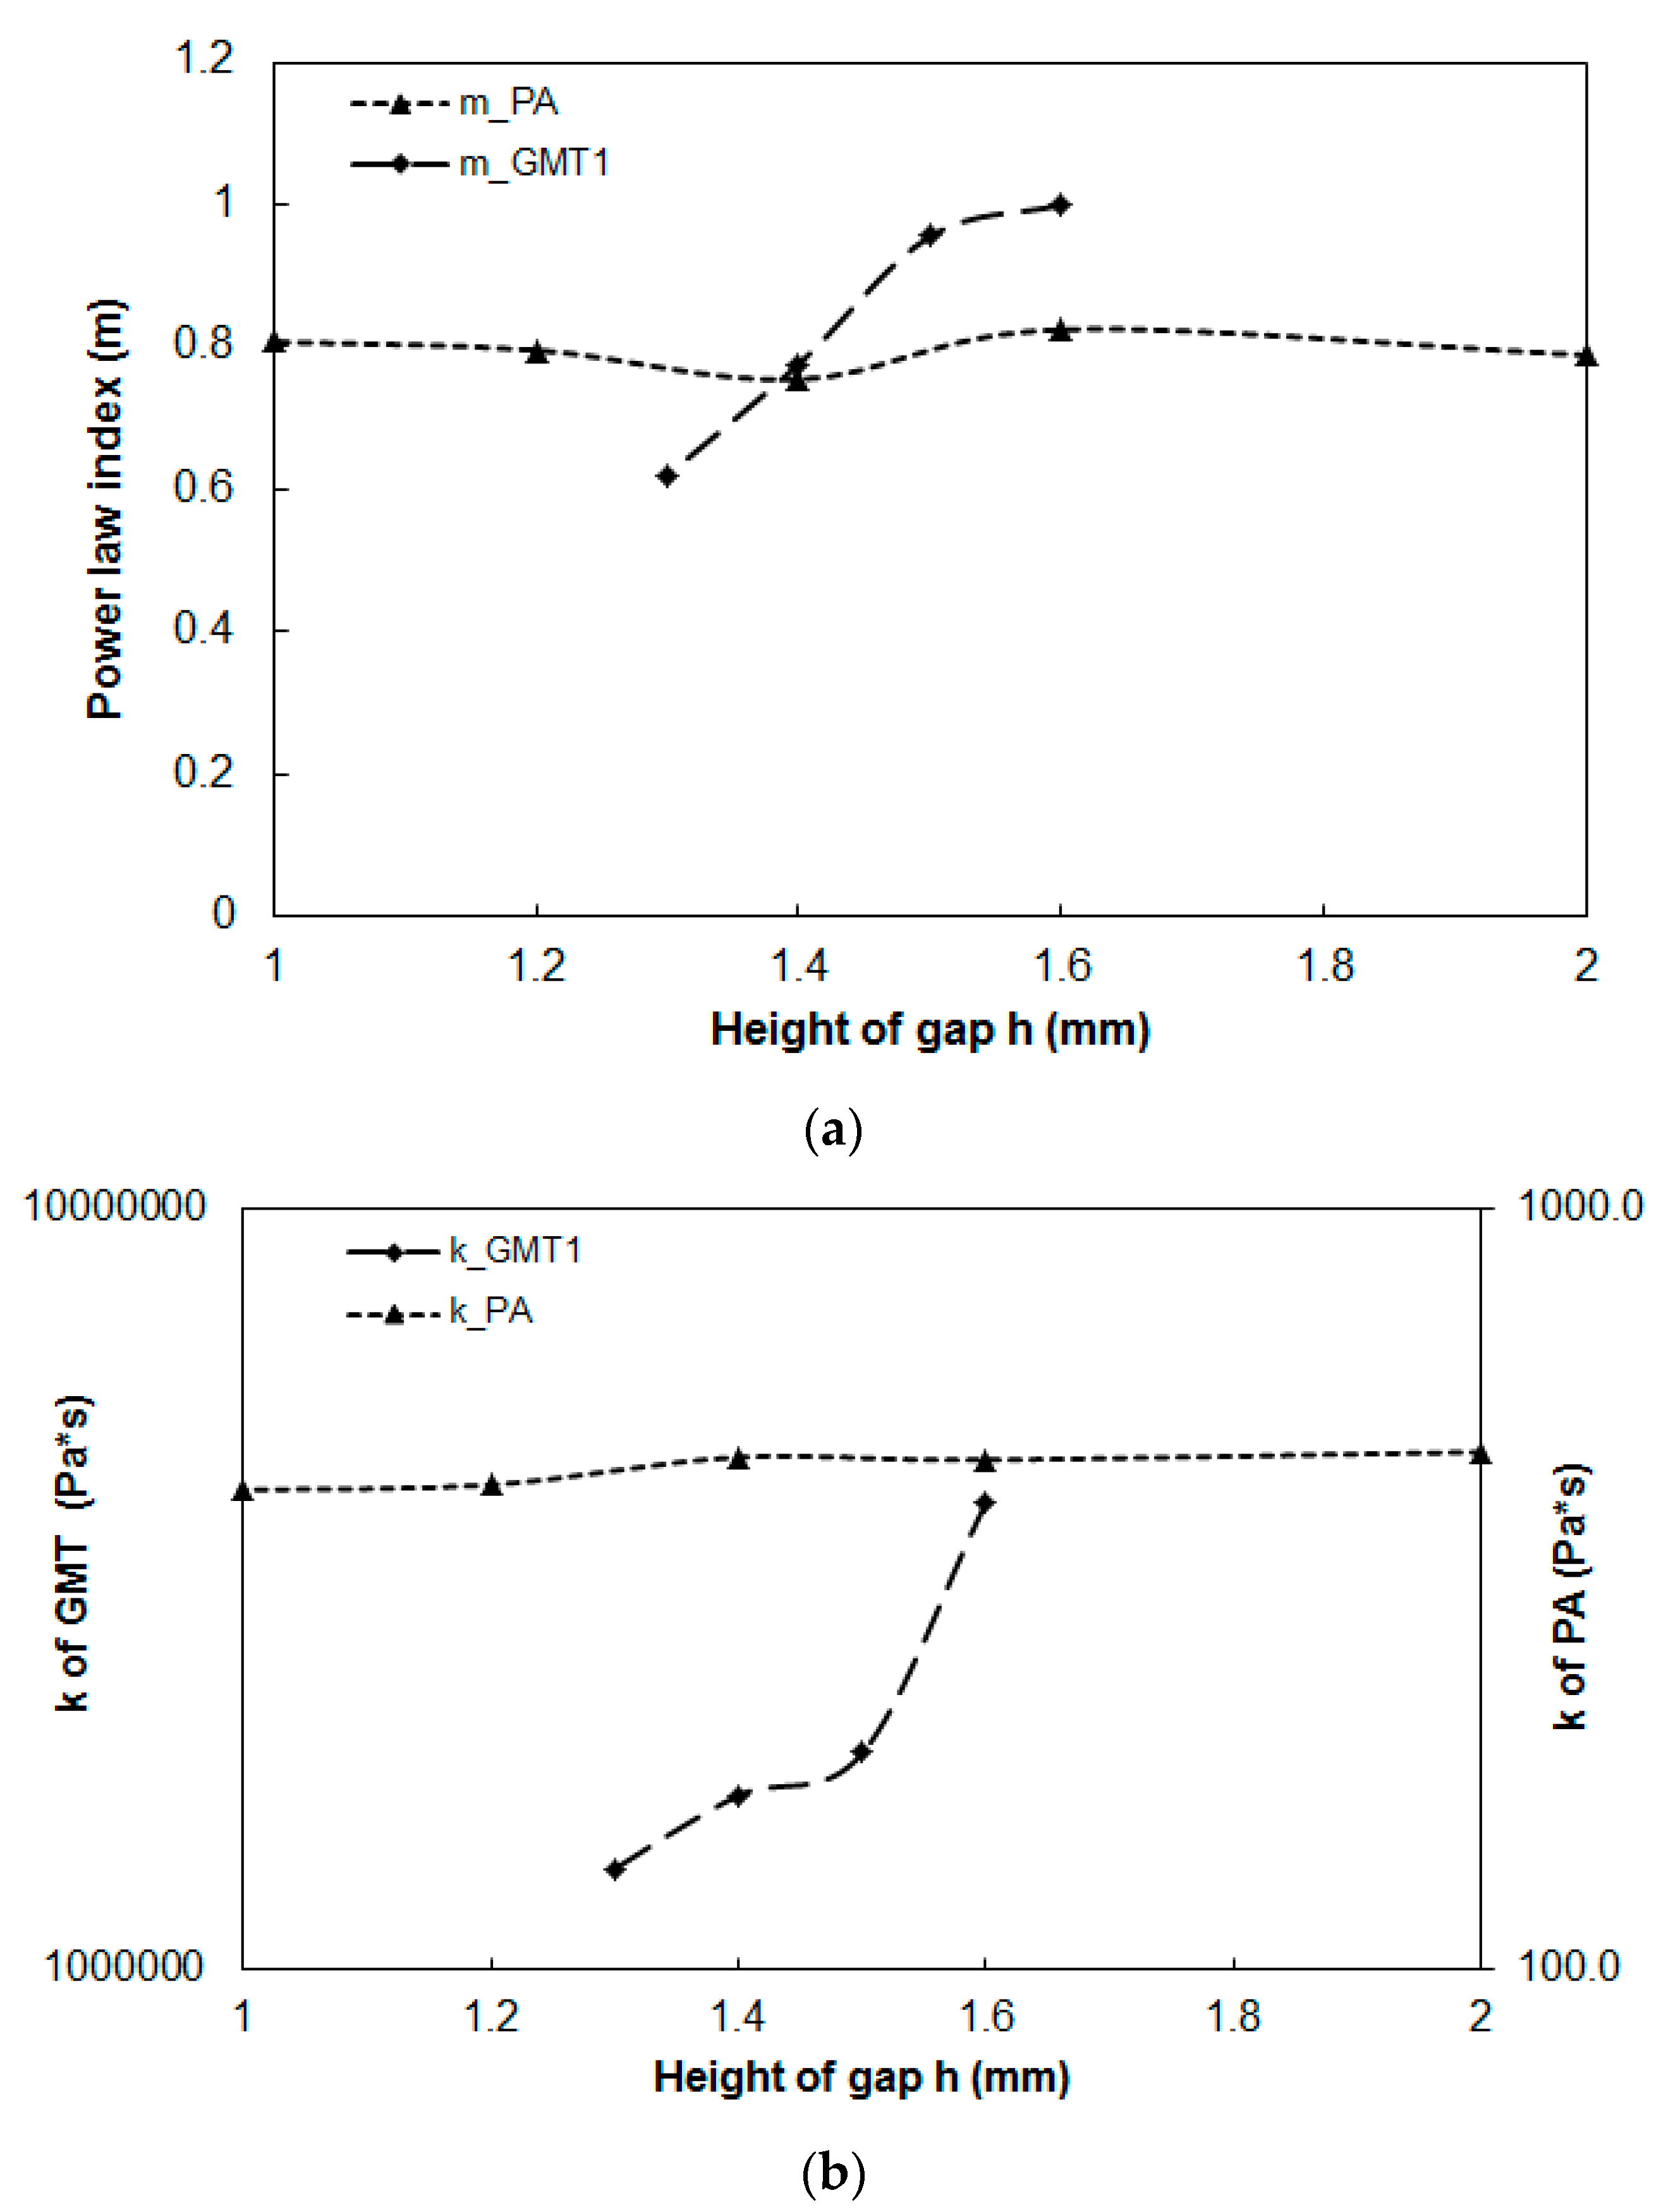
3.3.2. Power-Law Index Estimation in Continuous-Fiber GMT
3.3.3. Power-Law Index Estimation in Pure PA
4. Conclusions
Author Contributions
Funding
Acknowledgments
Conflicts of Interest
References
- Thomason, J.; Vlug, M. Influence of fibre length and concentration on the properties of glass fibre-reinforced polypropylene: 1. Tensile and flexural modulus. Compos. A Appl. Sci. Manuf. 1996, 27, 477–484. [Google Scholar] [CrossRef]
- Thomason, J. The influence of fibre length and concentration on the properties of glass fibre reinforced polypropylene: 7. Interface strength and fibre strain in injection moulded long fibre PP at high fibre content. Compos. A Appl. Sci. Manuf. 2007, 38, 210–216. [Google Scholar] [CrossRef]
- Goris, S.; Gandhi, U.; Song, Y.-Y.; Osswald, T.A. Analysis of the process-induced microstructure in injection molding of long glass fiber-reinforced thermoplastics. In Proceedings of the SPE Technical Papers, ANTEC2016, Indianapolis, IN, USA, 23–25 May 2016. [Google Scholar]
- Huang, C.-T.; Tseng, H.-C.; Huang, C.; Tseng, H. Simulation prediction of the fiber breakage history in regular and barrier structure screws in injection molding. Polym. Eng. Sci. 2017, 58, 452–459. [Google Scholar] [CrossRef]
- Thattaiparthasarathy, K.B.; Pillay, S.; Ning, H.; Vaidya, U. Process simulation, design and manufacturing of a long fiber thermoplastic composite for mass transit application. Compos. A Appl. Sci. Manuf. 2008, 39, 1512–1521. [Google Scholar] [CrossRef]
- Malnati, P. Reinforced thermoplastics: LFRT vs. GMT. Available online: https://www.compositesworld.com/articles/reinforced-thermoplastics-lfrt-vs-gmt (accessed on 1 October 2017).
- Howell, D.; Fukumoto, S. Compression molding of long chopped fiber thermoplastic composite. In Proceedings of the CAMX Conference Proceedings, Orlando, FL, USA, 13–16 October 2014. [Google Scholar]
- Gandhi, U.; Sebastian, D.B.; Kunc, V.; Song, Y. Method to measure orientation of discontinuous fiber embedded in the polymer matrix from computerized tomography scan data. J. Thermoplast. Compos. Mater. 2015, 29, 1696–1709. [Google Scholar] [CrossRef]
- Kotsikos, G.; Bland, J.H.; Gibson, A.G. Squeeze flow testing of glass mar thermoplastic material. Compos. A Appl. Sci. Manuf. 1996, 27, 1195–1200. [Google Scholar] [CrossRef]
- Dweib, M.A.; Brádaigh, C.M.Ó. Anisotropic modeling of isothermal squeezing flow of Glass-Mat reinforced thermoplastics (GMT). Polym. Compos. 1998, 19, 588–599. [Google Scholar] [CrossRef]
- Dweib, M.; Óbrádaigh, C. Extensional and shearing flow of a glass-mat-reinforced thermoplastics (GMT) material as a non-Newtonian viscous fluid. Compos. Sci. Technol. 1999, 59, 1399–1410. [Google Scholar] [CrossRef]
- Dweib, M.A.; Brádaigh, C.M.Ó. Compression molding of glass reinforced thermoplastics: Modeling and experiments. Polym. Compos. 2000, 21, 832–845. [Google Scholar] [CrossRef]
- Tornqvist, R.; Sunderland, P.; Manson, T.-A.E. Determination of the rheological properties of thermoplastic composites for compression floe molding. Polym. Compos. 2000, 20, 779–788. [Google Scholar] [CrossRef]
- Sherwood, J.; Durban, D. Squeeze flow of a power-law viscoplastic solid. J. Non-Newtonian Fluid Mech. 1996, 62, 35–54. [Google Scholar] [CrossRef]
- Chan, T.W.; Baird, D.G. An evaluation of a squeeze flow rheometer for the rheological characterization of a filled polymer with a yield stress. Rheol. Acta 2002, 41, 245–256. [Google Scholar] [CrossRef]
- Servais, C.; Luciani, A.; Månson, J.-A.E. Squeeze flow of concentrated long fibre suspensions: experiments and model. J. Non-Newtonian Fluid Mech. 2002, 104, 165–184. [Google Scholar] [CrossRef]
- Walter, I.; Taeger, O.; Osswald, T.A.; Kuhn, C. Experimental and Numerical Analysis of Fiber Matrix Separation during Compression Molding of Long Fiber Reinforced Thermoplastics. J. Compos. Sci. 2017, 1, 2. [Google Scholar]


| Temperature [°C] | 290−300 |
| Compression Speed [mm/min] | 0.1−1.0 |
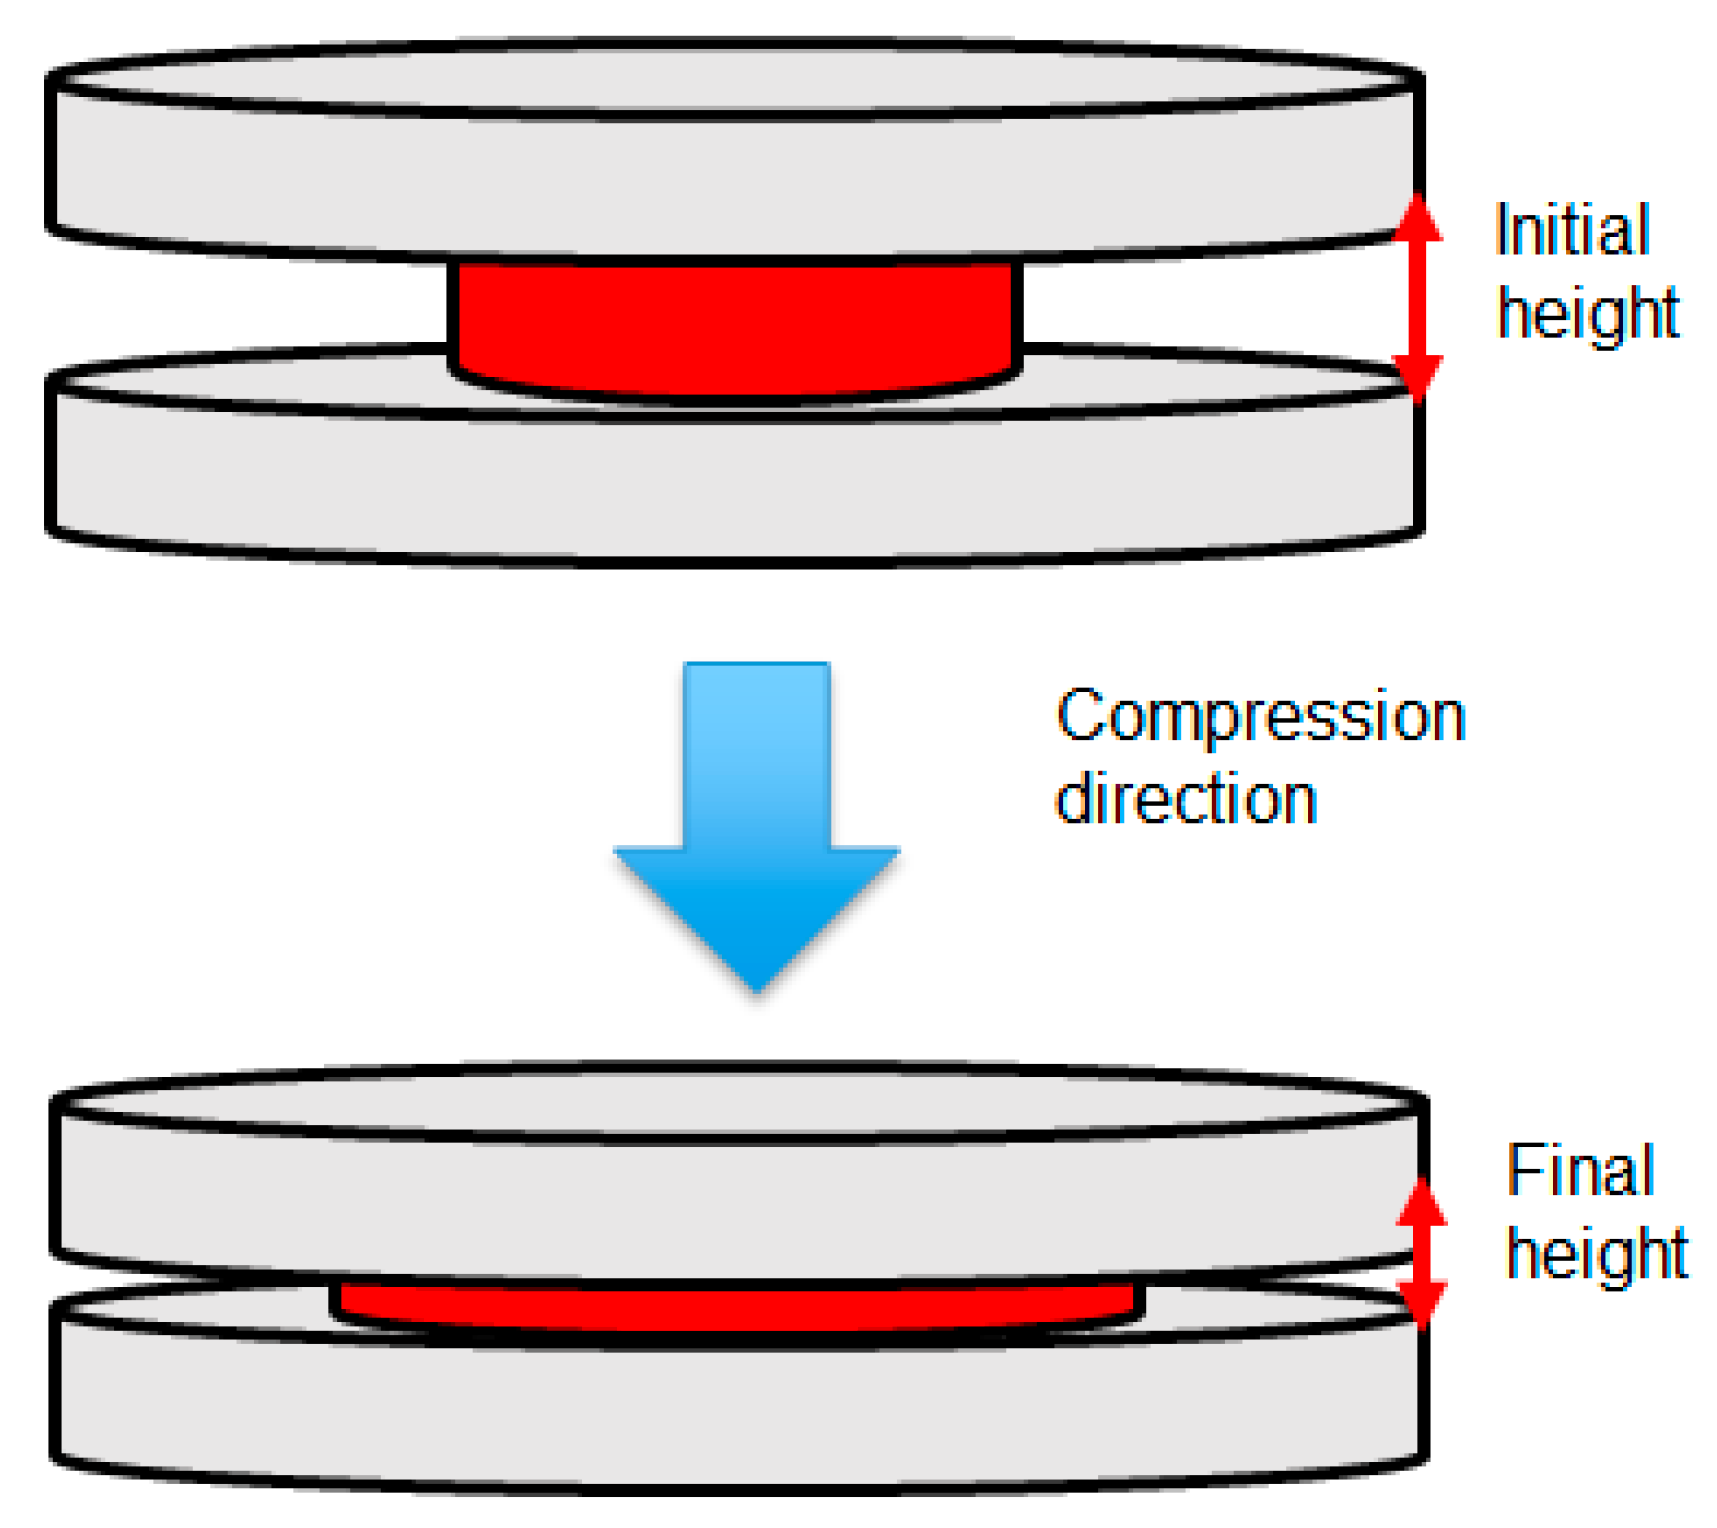
| Initial Location [mm] | 2 |
| Final Location [mm] | 1 |
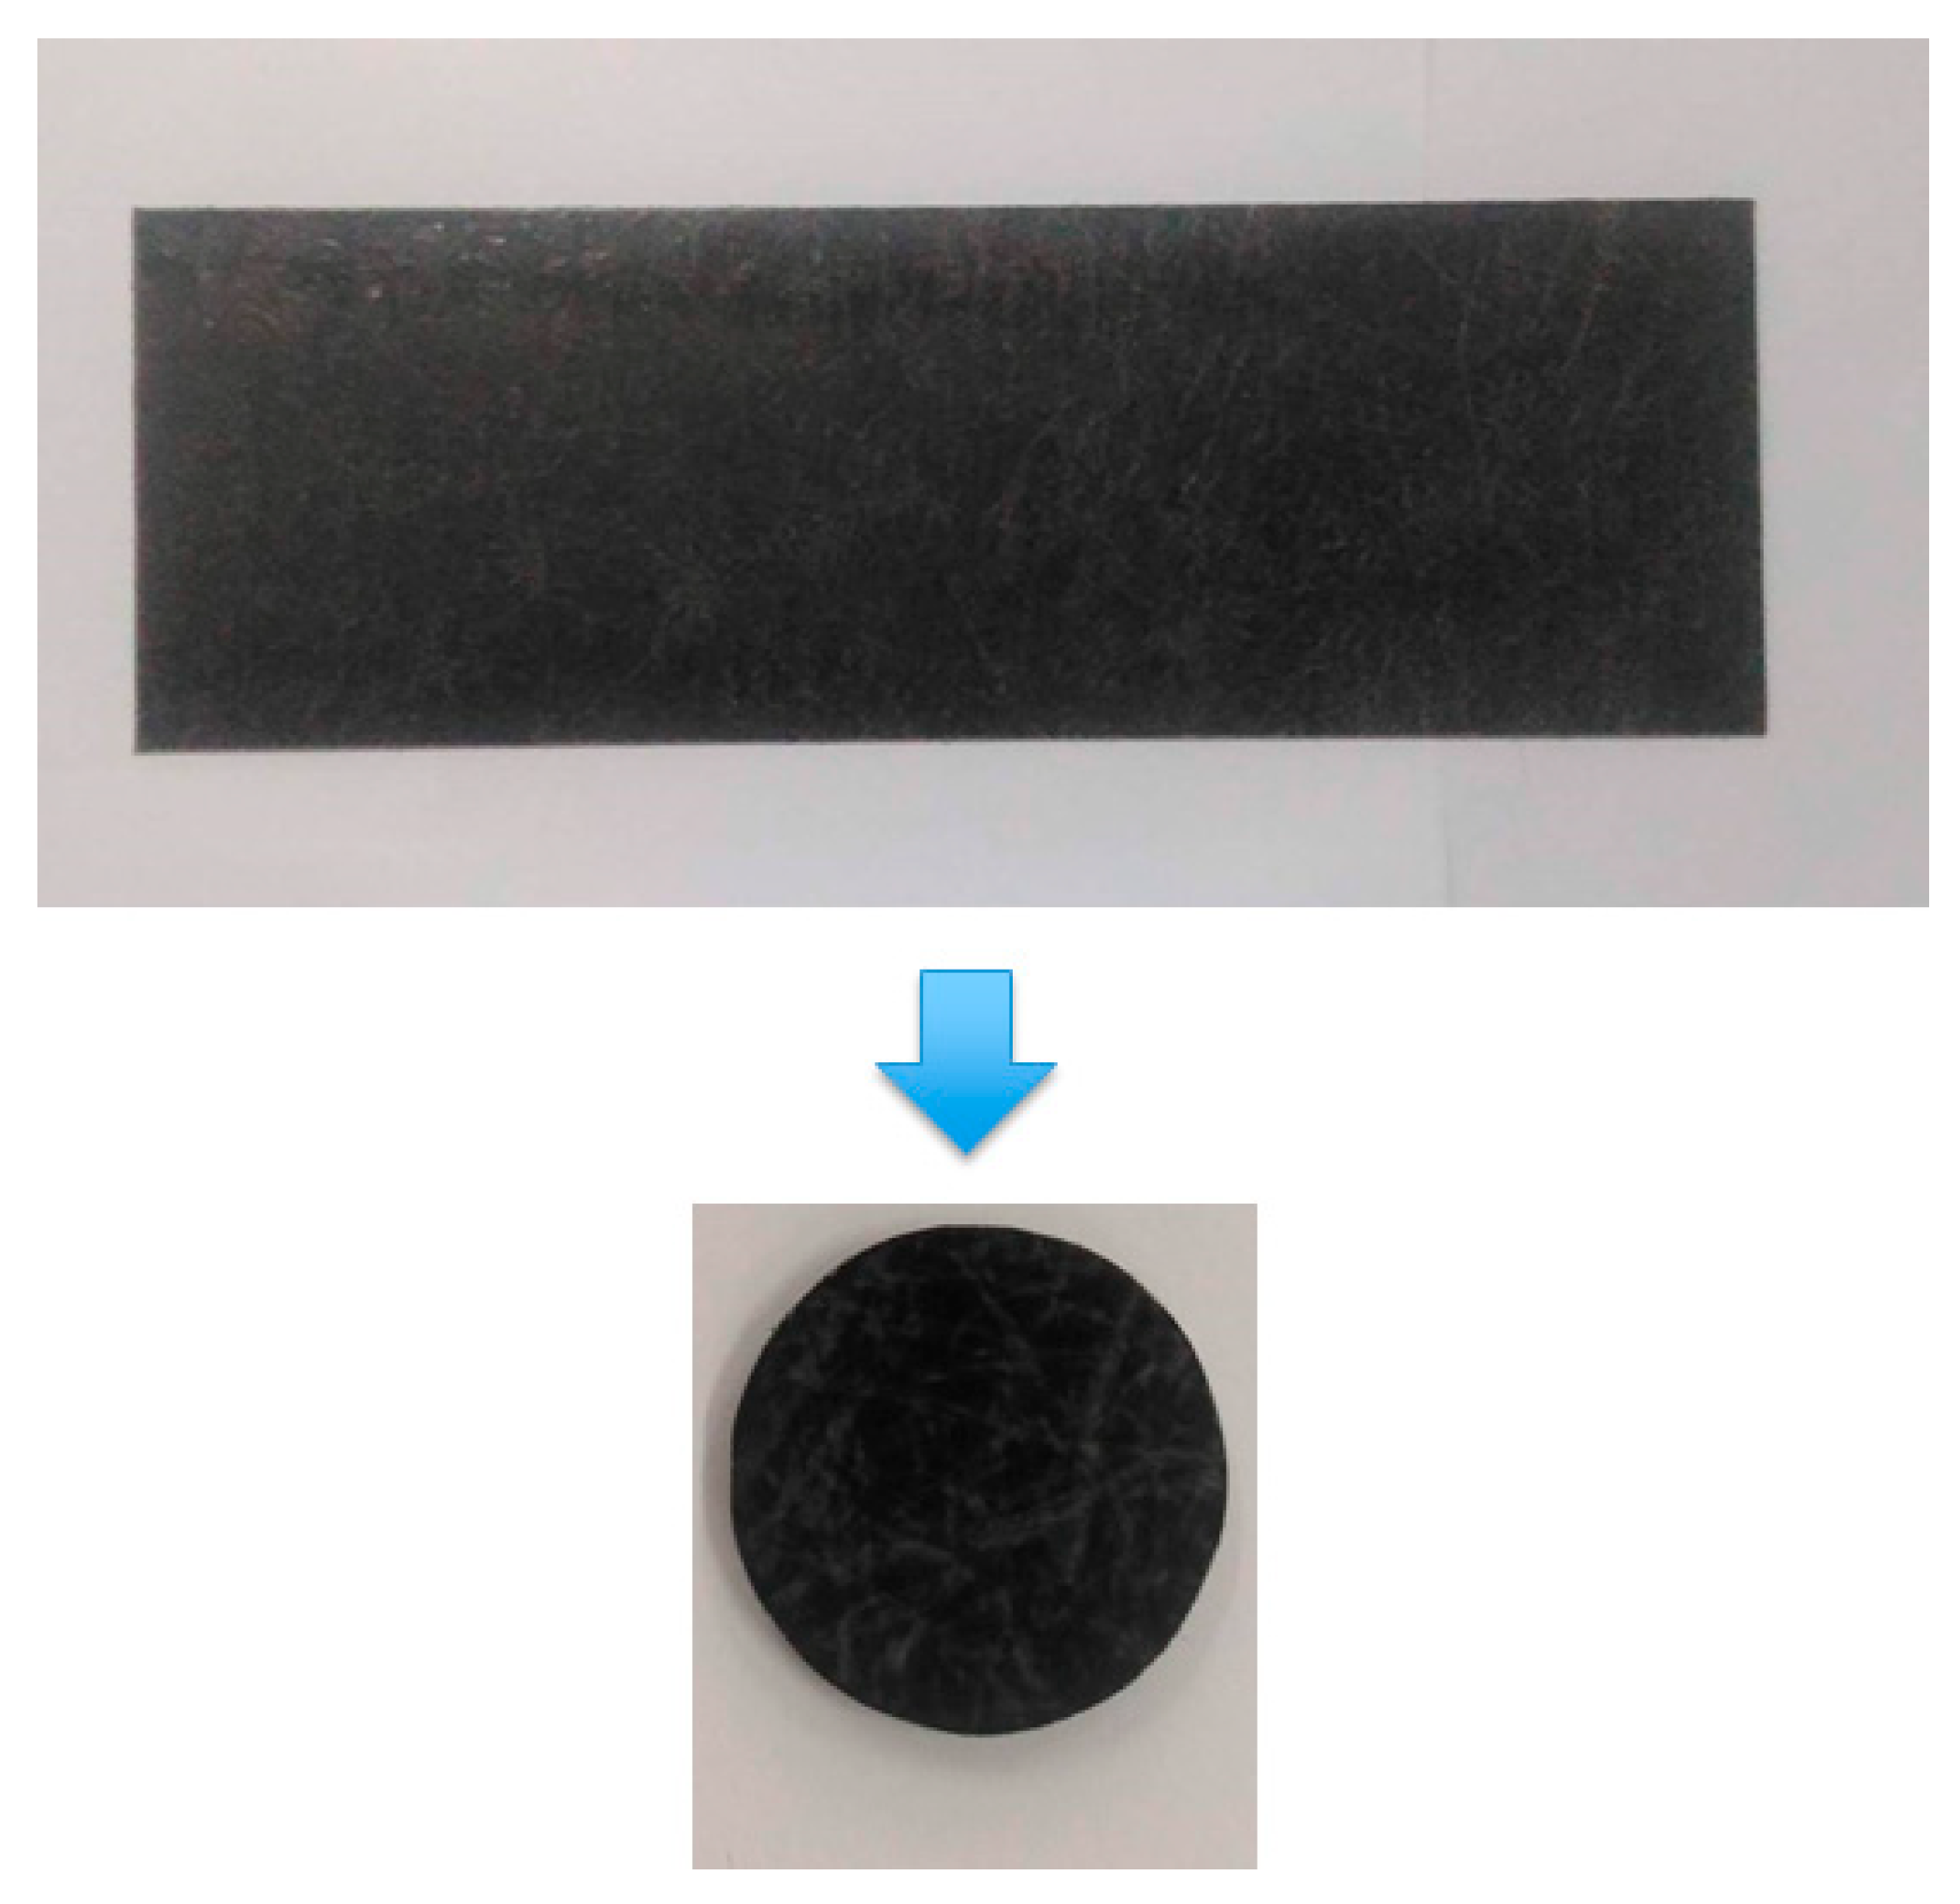
| Sample Diameter [mm] | 25 |
| Sample Thickness [mm] | 2 |
| Temperature [°C] | 280–300 |
| Compression Speed [mm/s] | 0.1–1.5 |
| Initial Location [mm] | 3 |
| Final Location [mm] | 1 |
| Sample Diameter [mm] | 25 |
| Sample Thickness [mm] | 3 |
© 2019 by the authors. Licensee MDPI, Basel, Switzerland. This article is an open access article distributed under the terms and conditions of the Creative Commons Attribution (CC BY) license (http://creativecommons.org/licenses/by/4.0/).
Share and Cite
Huang, C.-T.; Chen, L.-J.; Chien, T.-Y. Investigation of the Viscoelastic Behavior Variation of Glass Mat Thermoplastics (GMT) in Compression Molding. Polymers 2019, 11, 335. https://doi.org/10.3390/polym11020335
Huang C-T, Chen L-J, Chien T-Y. Investigation of the Viscoelastic Behavior Variation of Glass Mat Thermoplastics (GMT) in Compression Molding. Polymers. 2019; 11(2):335. https://doi.org/10.3390/polym11020335
Chicago/Turabian StyleHuang, Chao-Tsai, Ling-Jue Chen, and Tse-Yu Chien. 2019. "Investigation of the Viscoelastic Behavior Variation of Glass Mat Thermoplastics (GMT) in Compression Molding" Polymers 11, no. 2: 335. https://doi.org/10.3390/polym11020335
APA StyleHuang, C.-T., Chen, L.-J., & Chien, T.-Y. (2019). Investigation of the Viscoelastic Behavior Variation of Glass Mat Thermoplastics (GMT) in Compression Molding. Polymers, 11(2), 335. https://doi.org/10.3390/polym11020335