Carbon Nanoparticles’ Impact on Processability and Physical Properties of Epoxy Resins—A Comprehensive Study Covering Rheological, Electrical, Thermo-Mechanical, and Fracture Properties (Mode I and II)

 , , , , and
Abstract
:
1. Introduction
2. Materials and Methods
2.1. Epoxy Resins
2.2. Carbon Nanoparticles
2.3. Dispersion
2.4. Rheology
2.5. Electrical Conductivity
2.6. Dynamic Mechanical Thermal Analysis
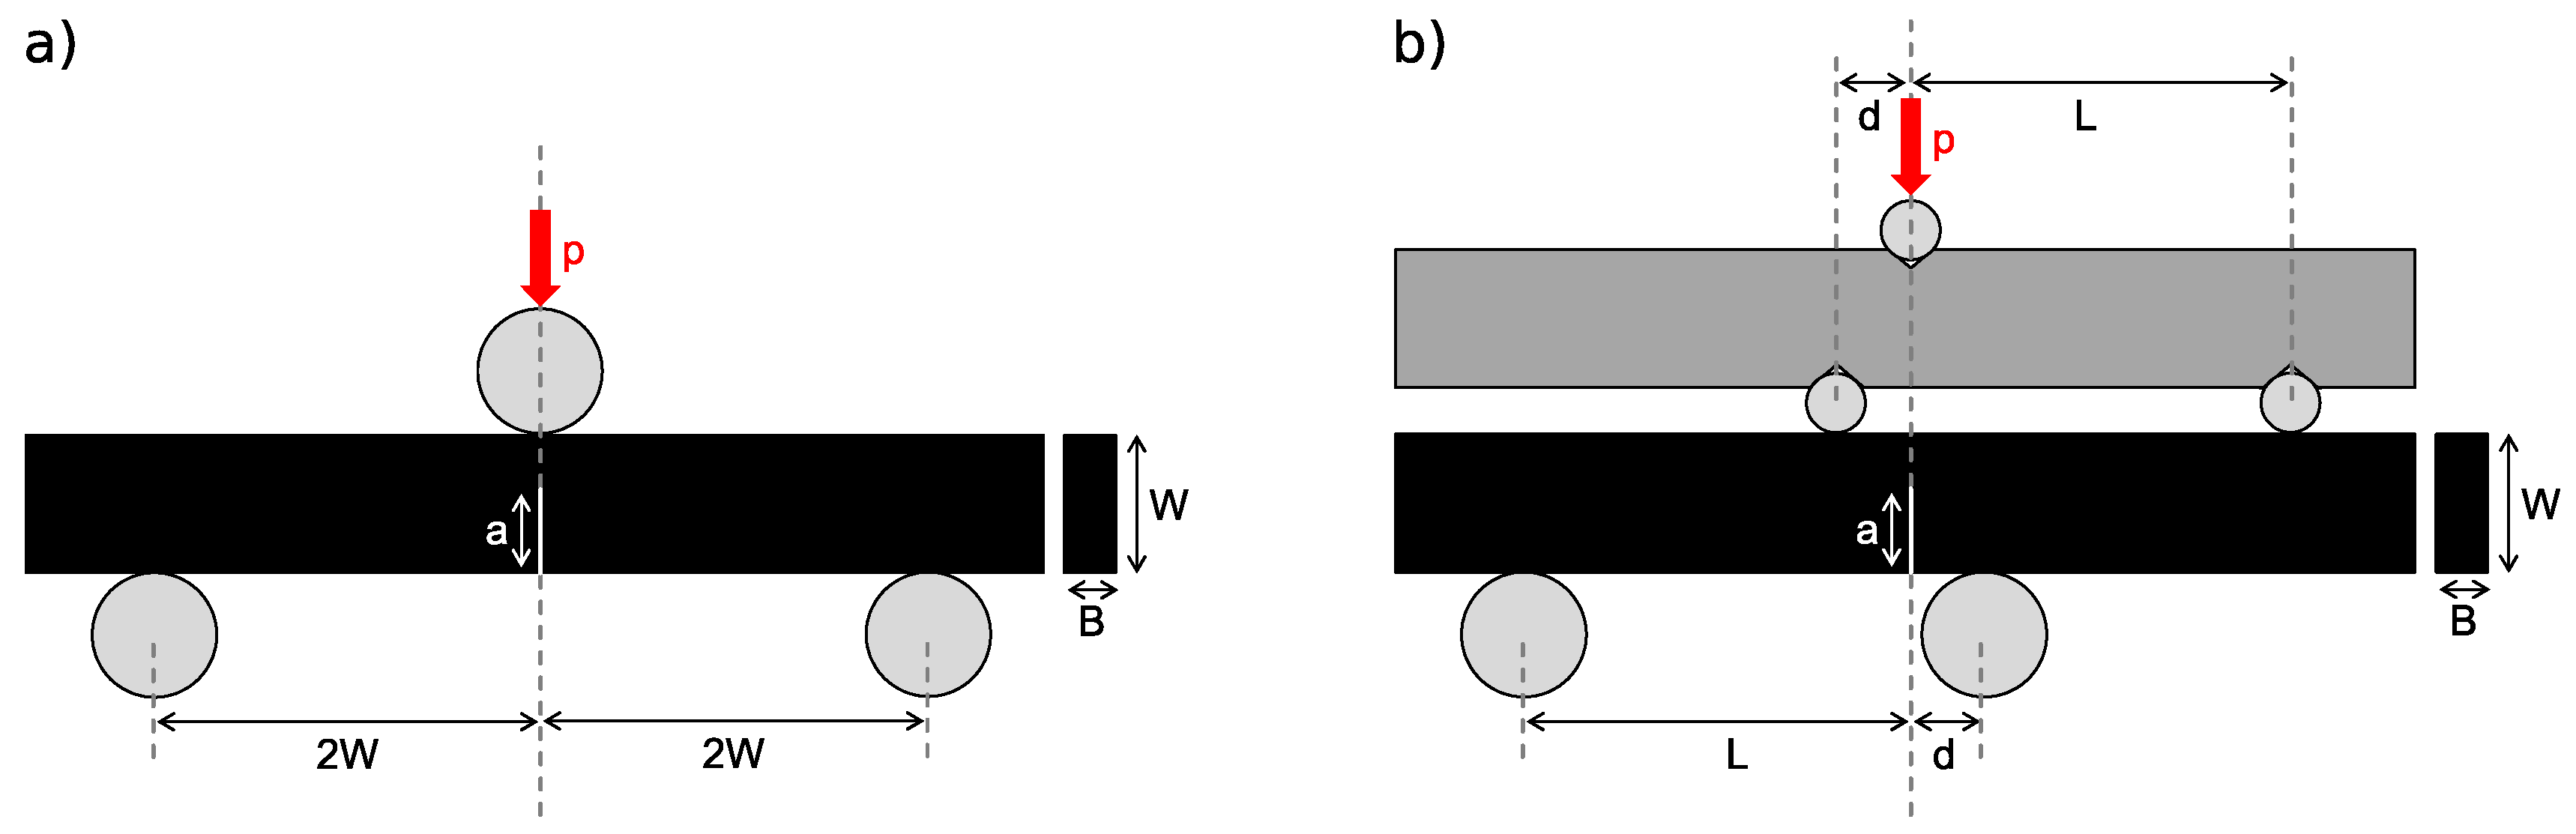
2.7. Fracture Toughness in Mode I and II
3. Results and Discussion
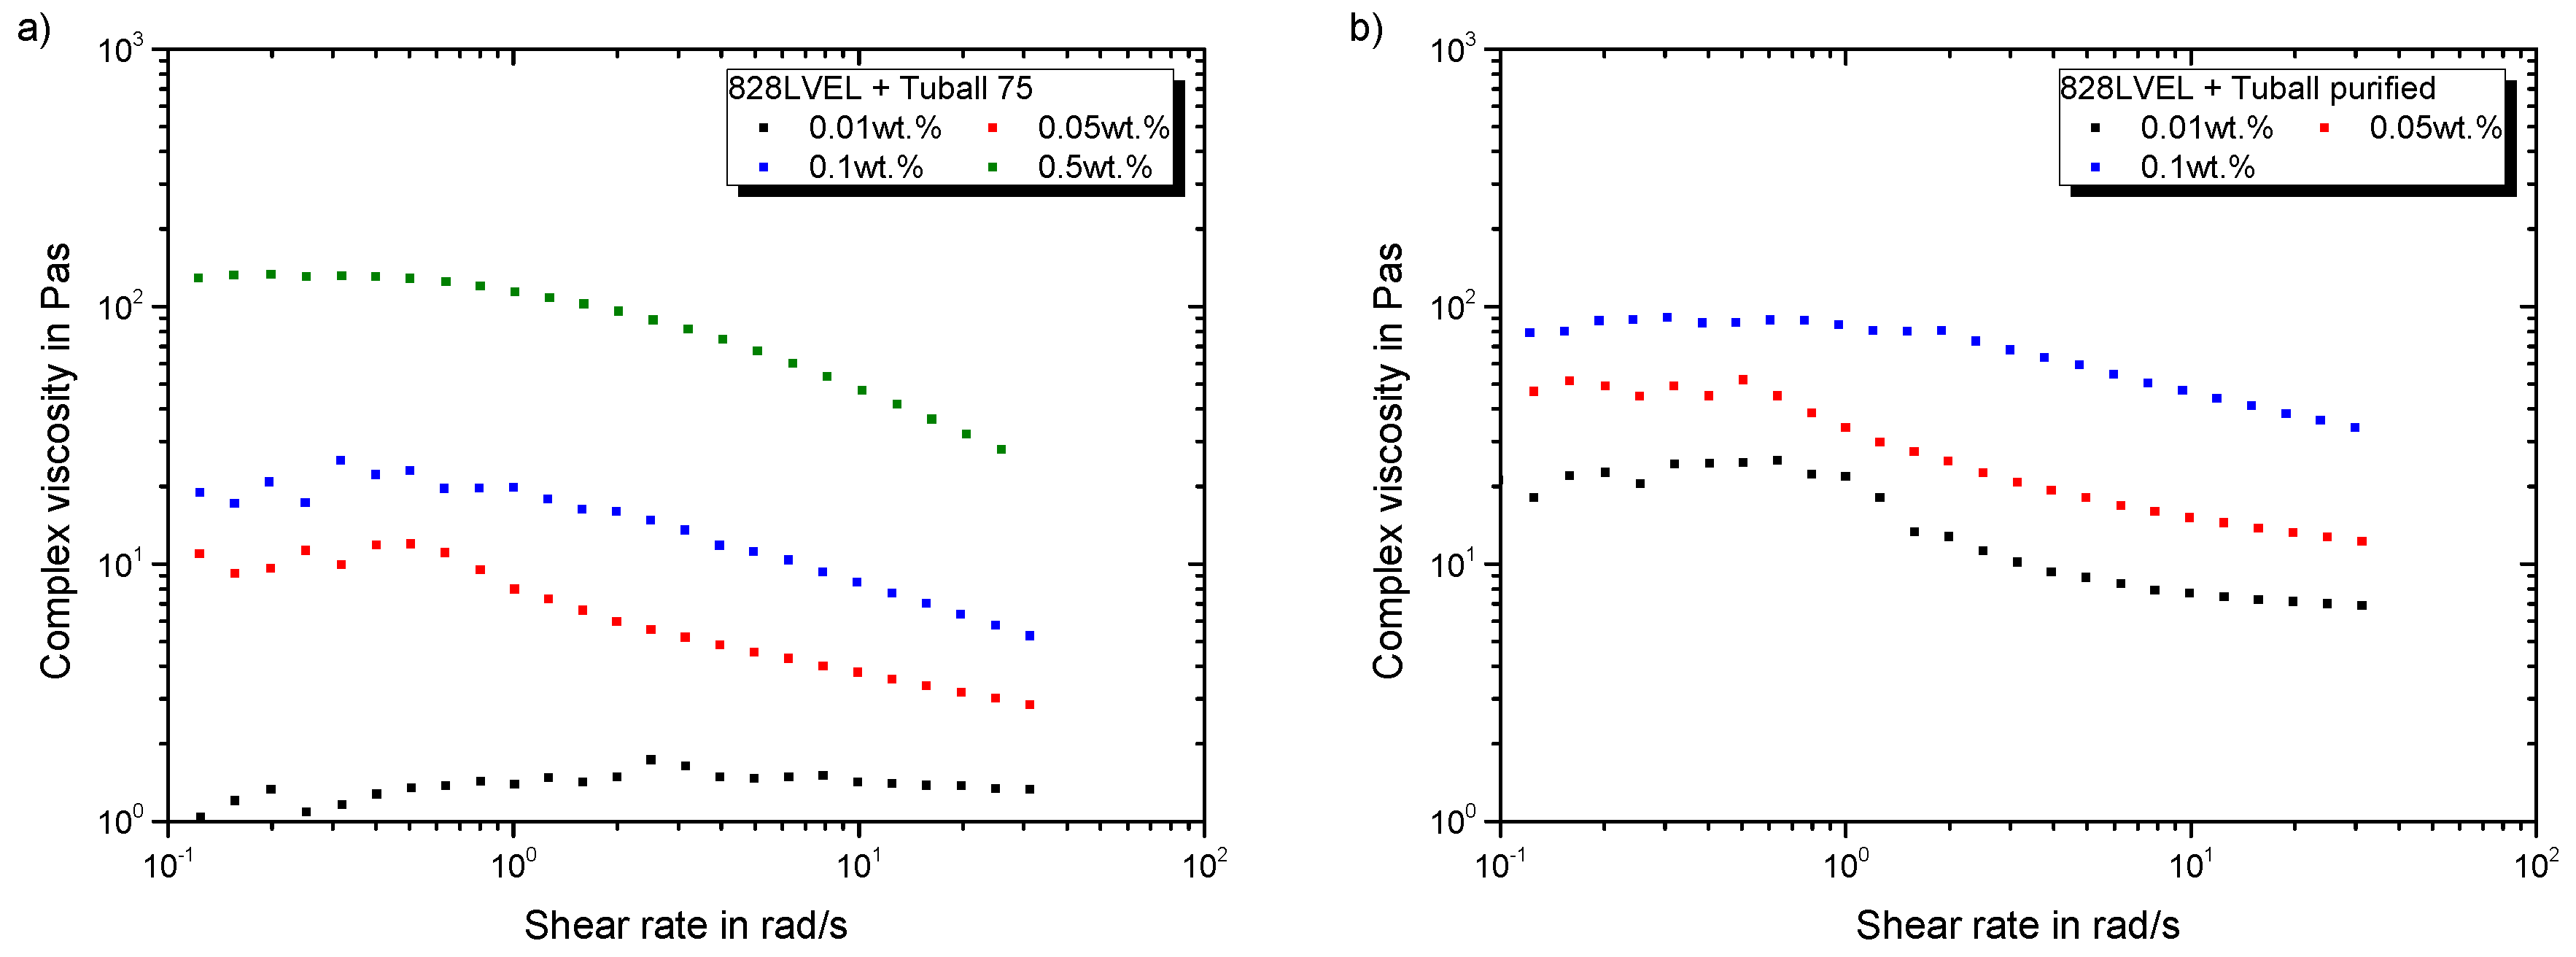
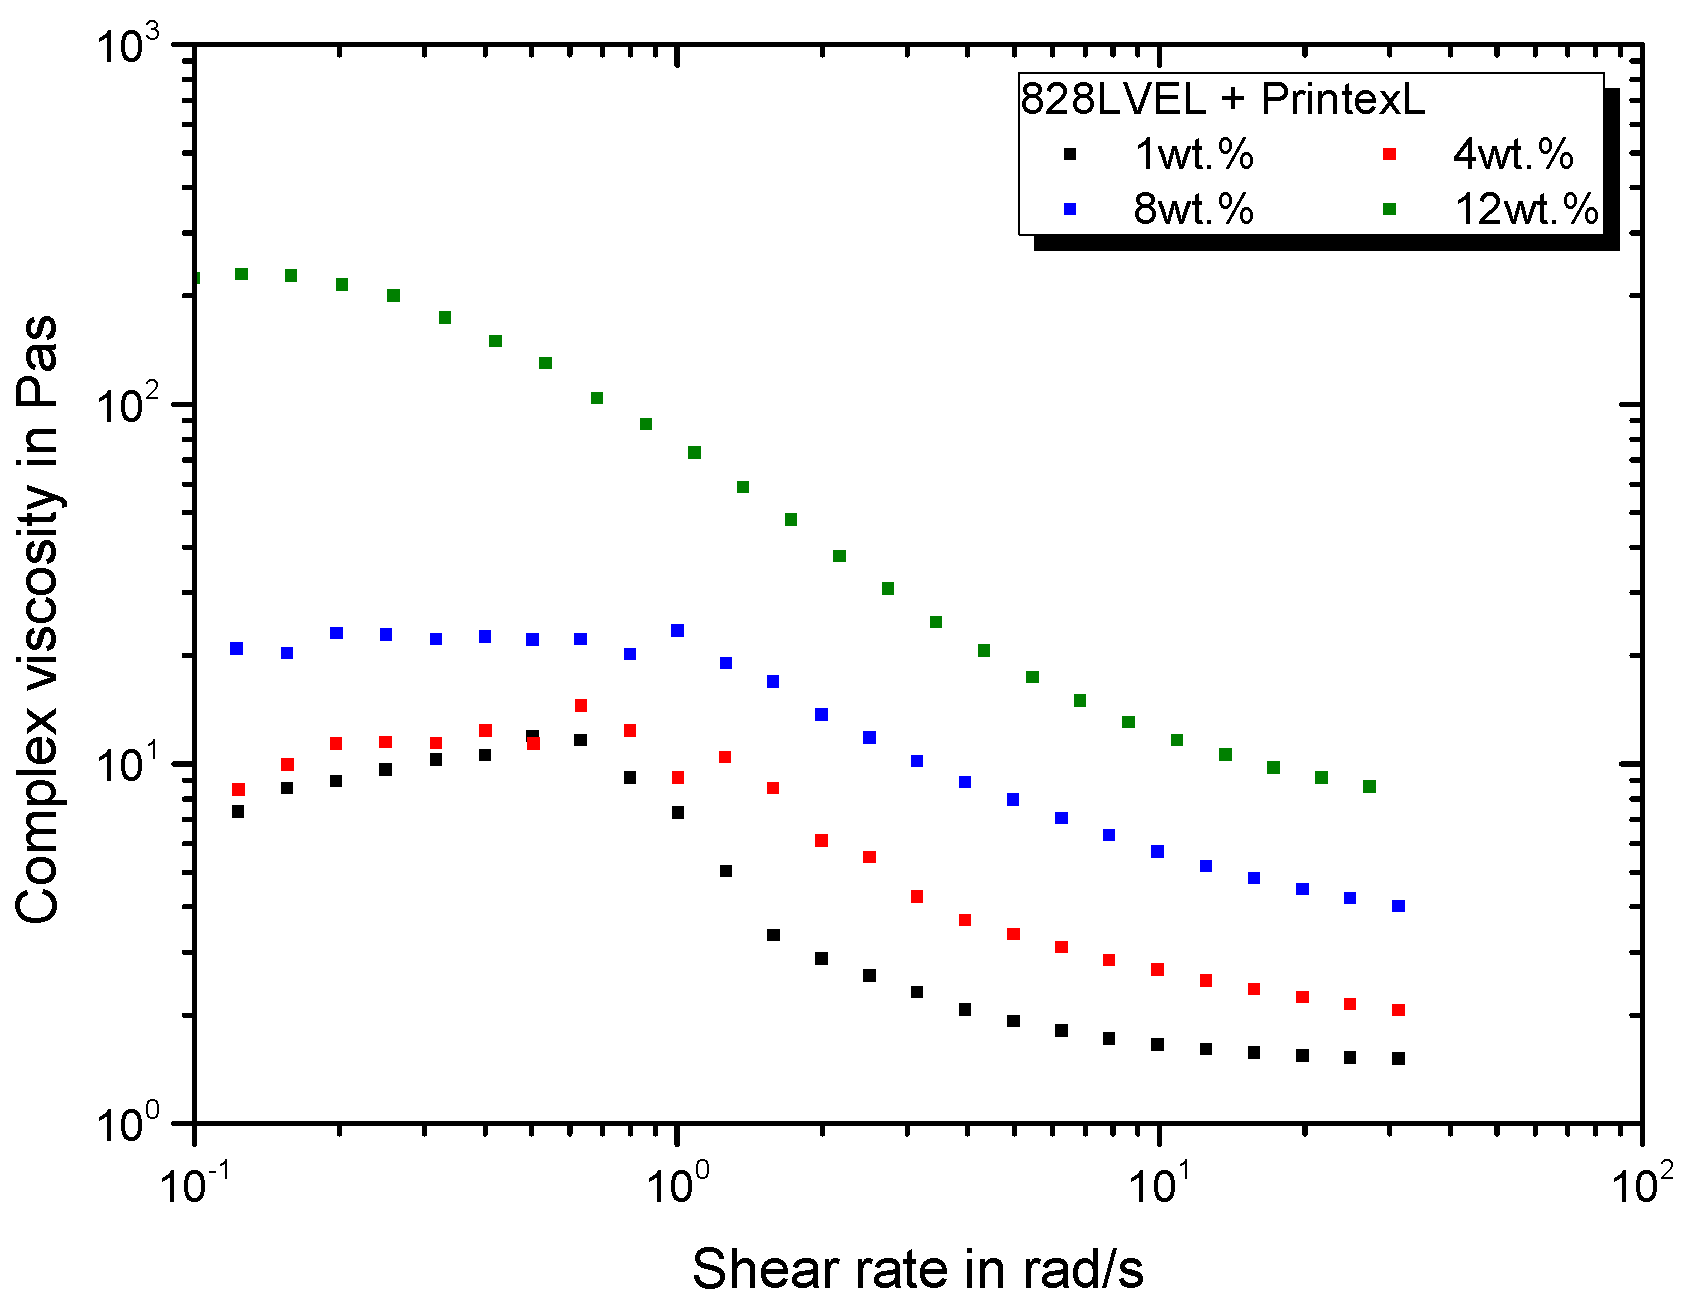
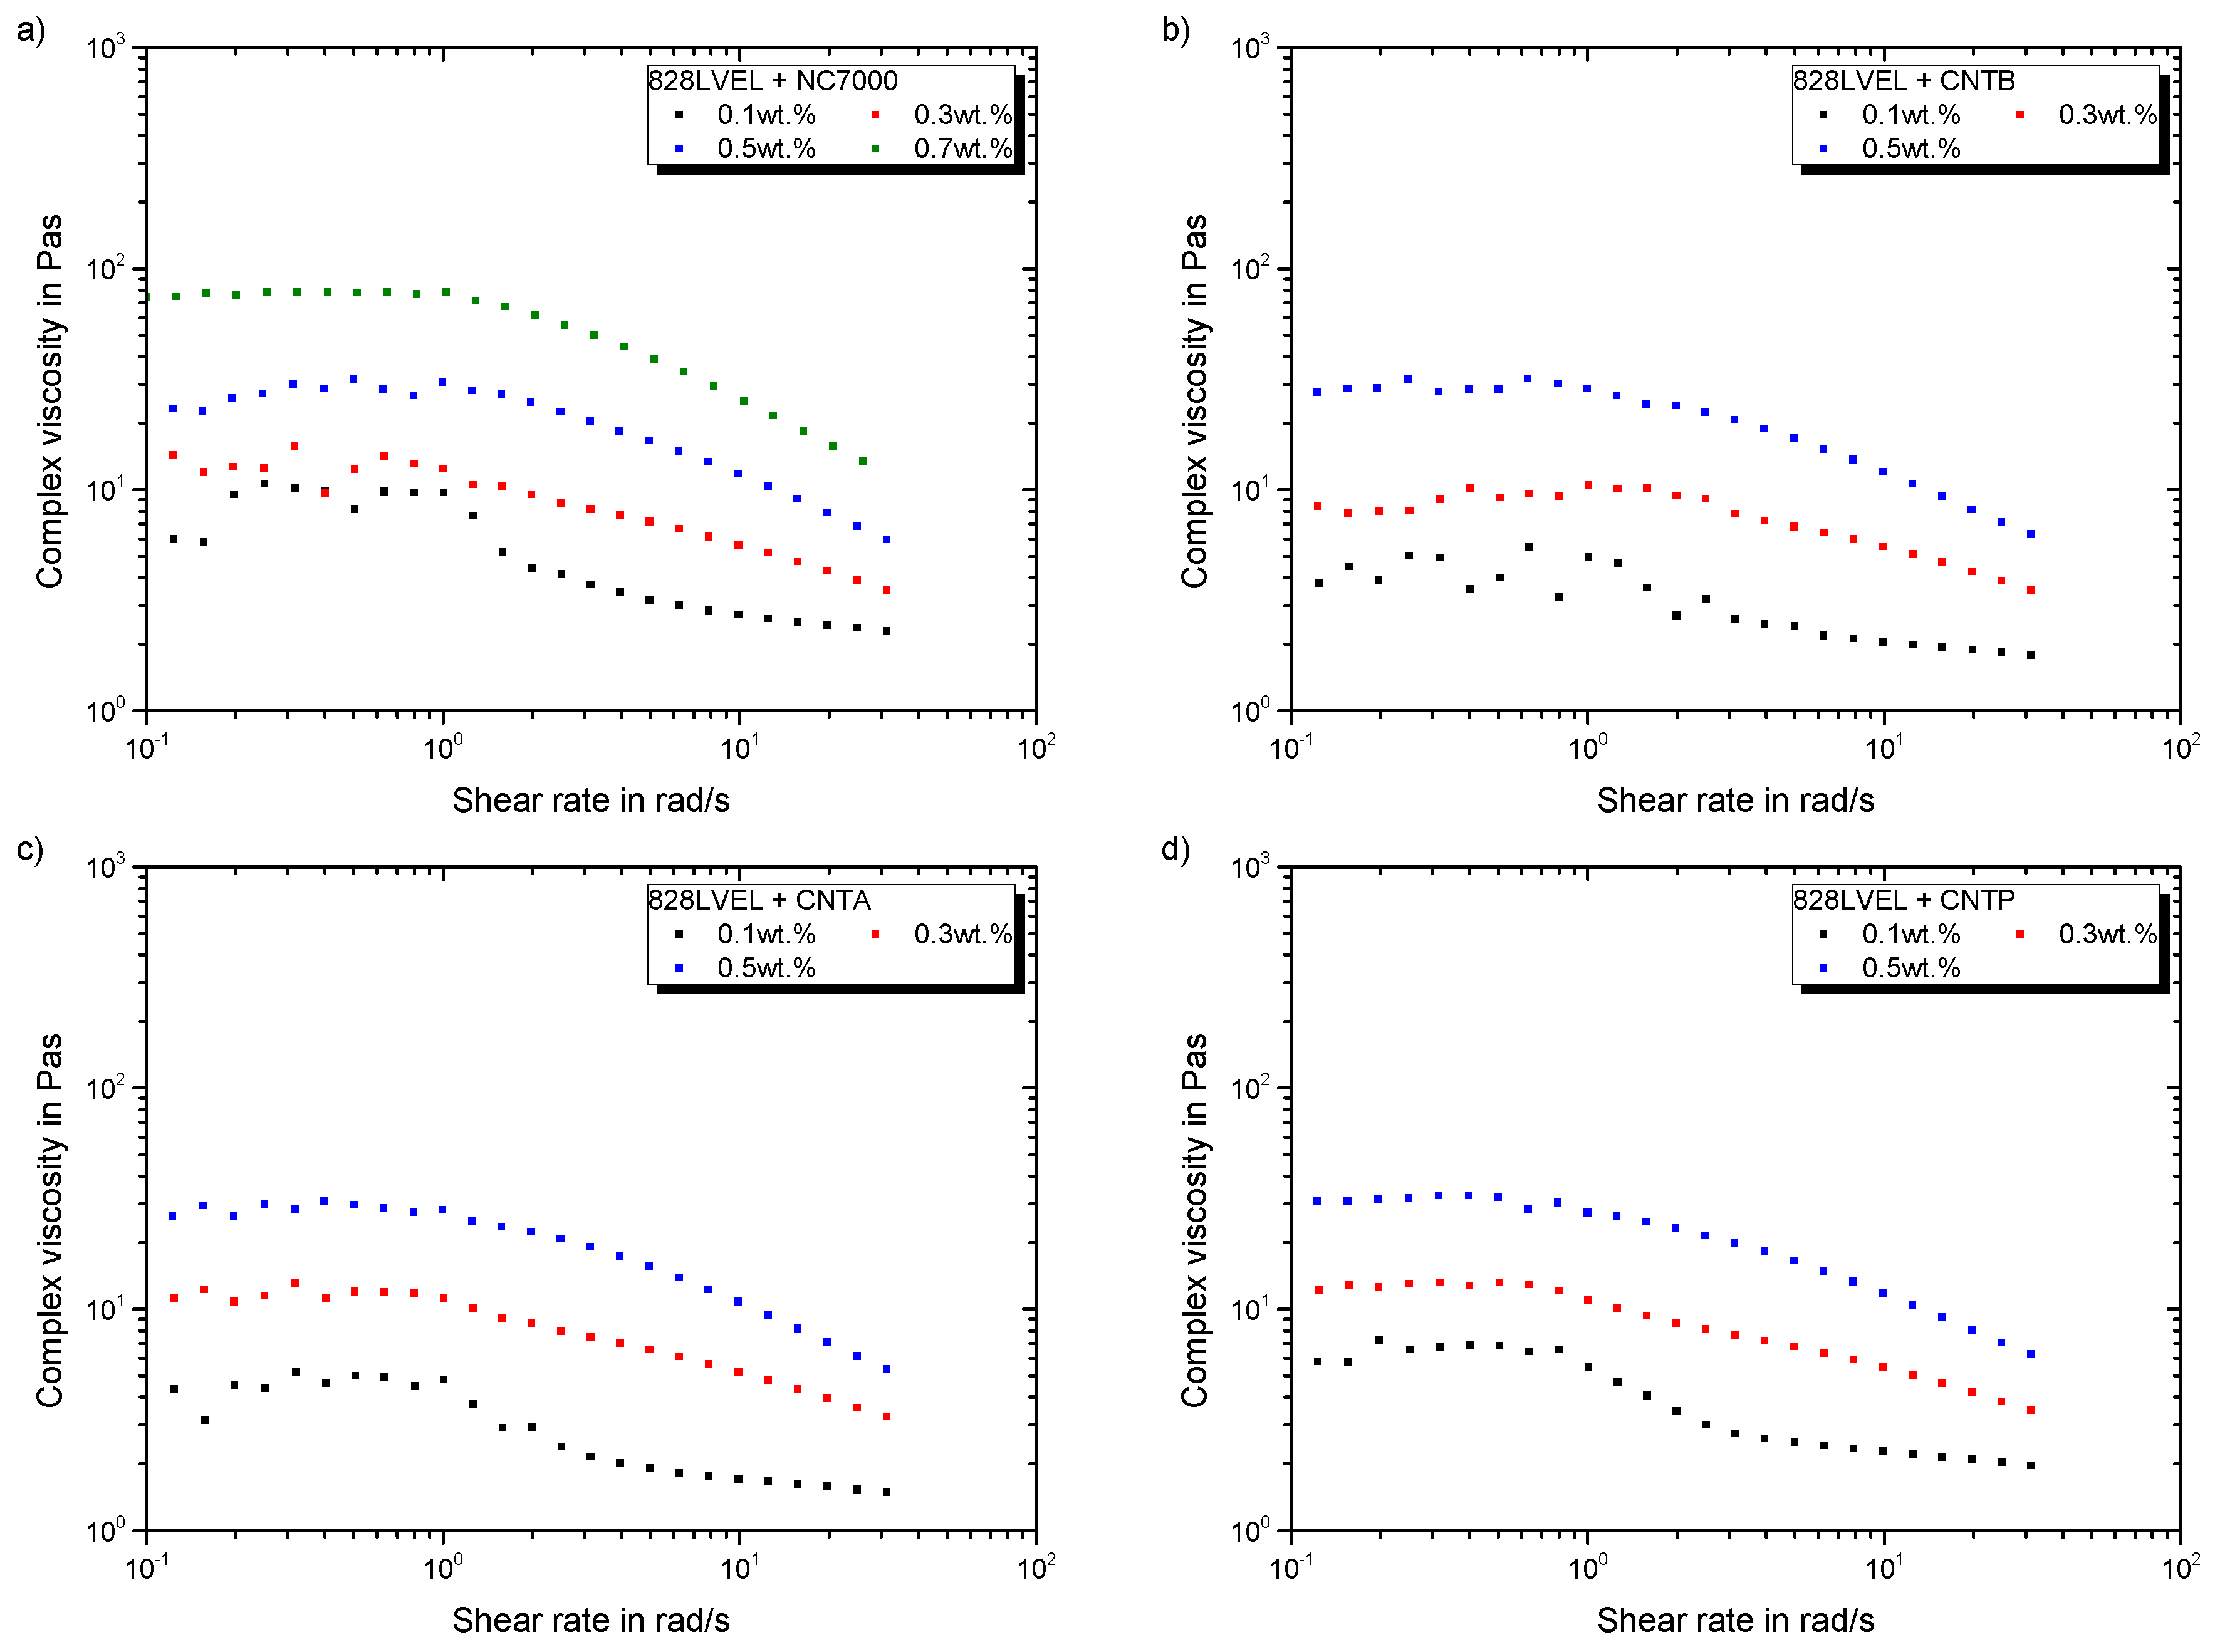
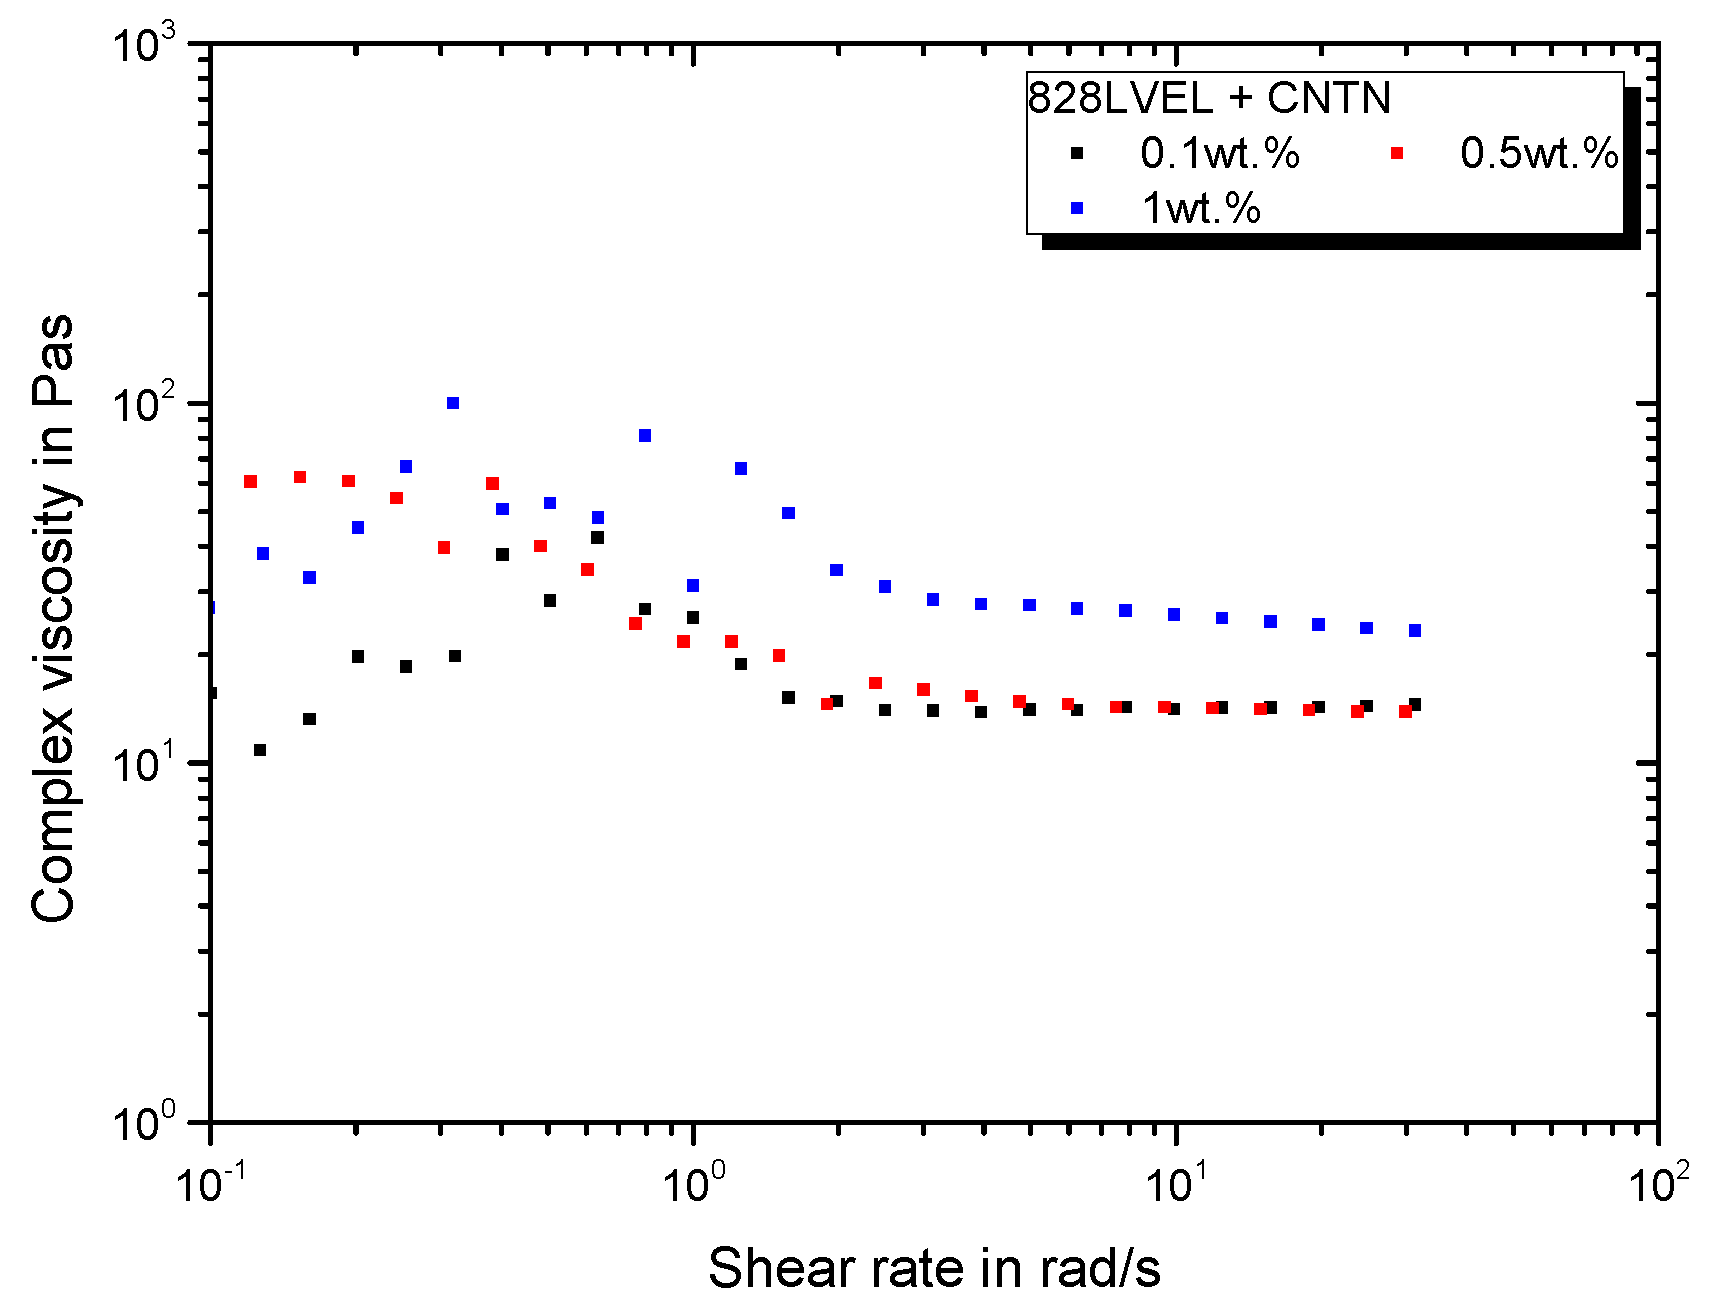
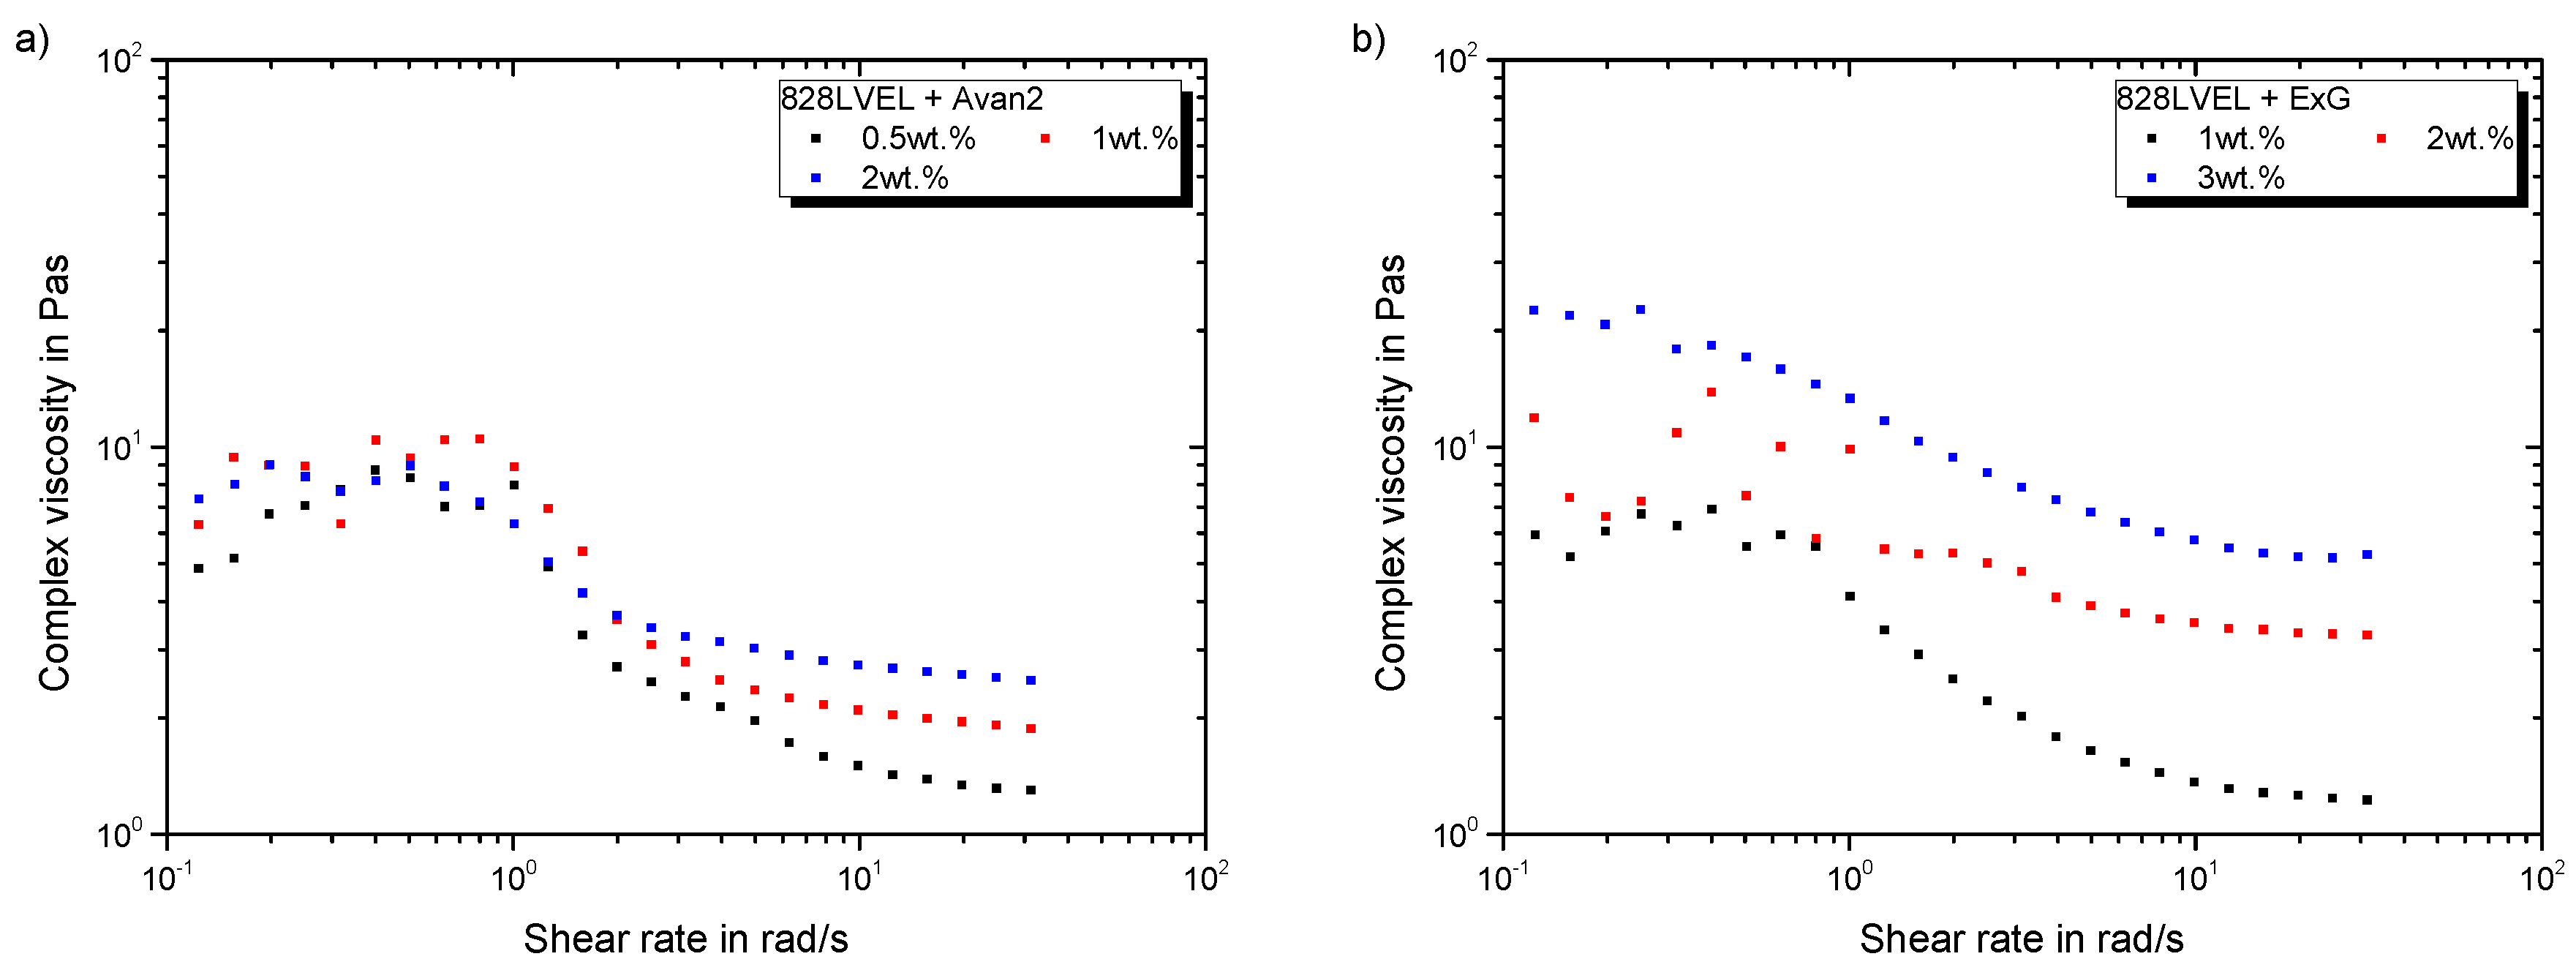
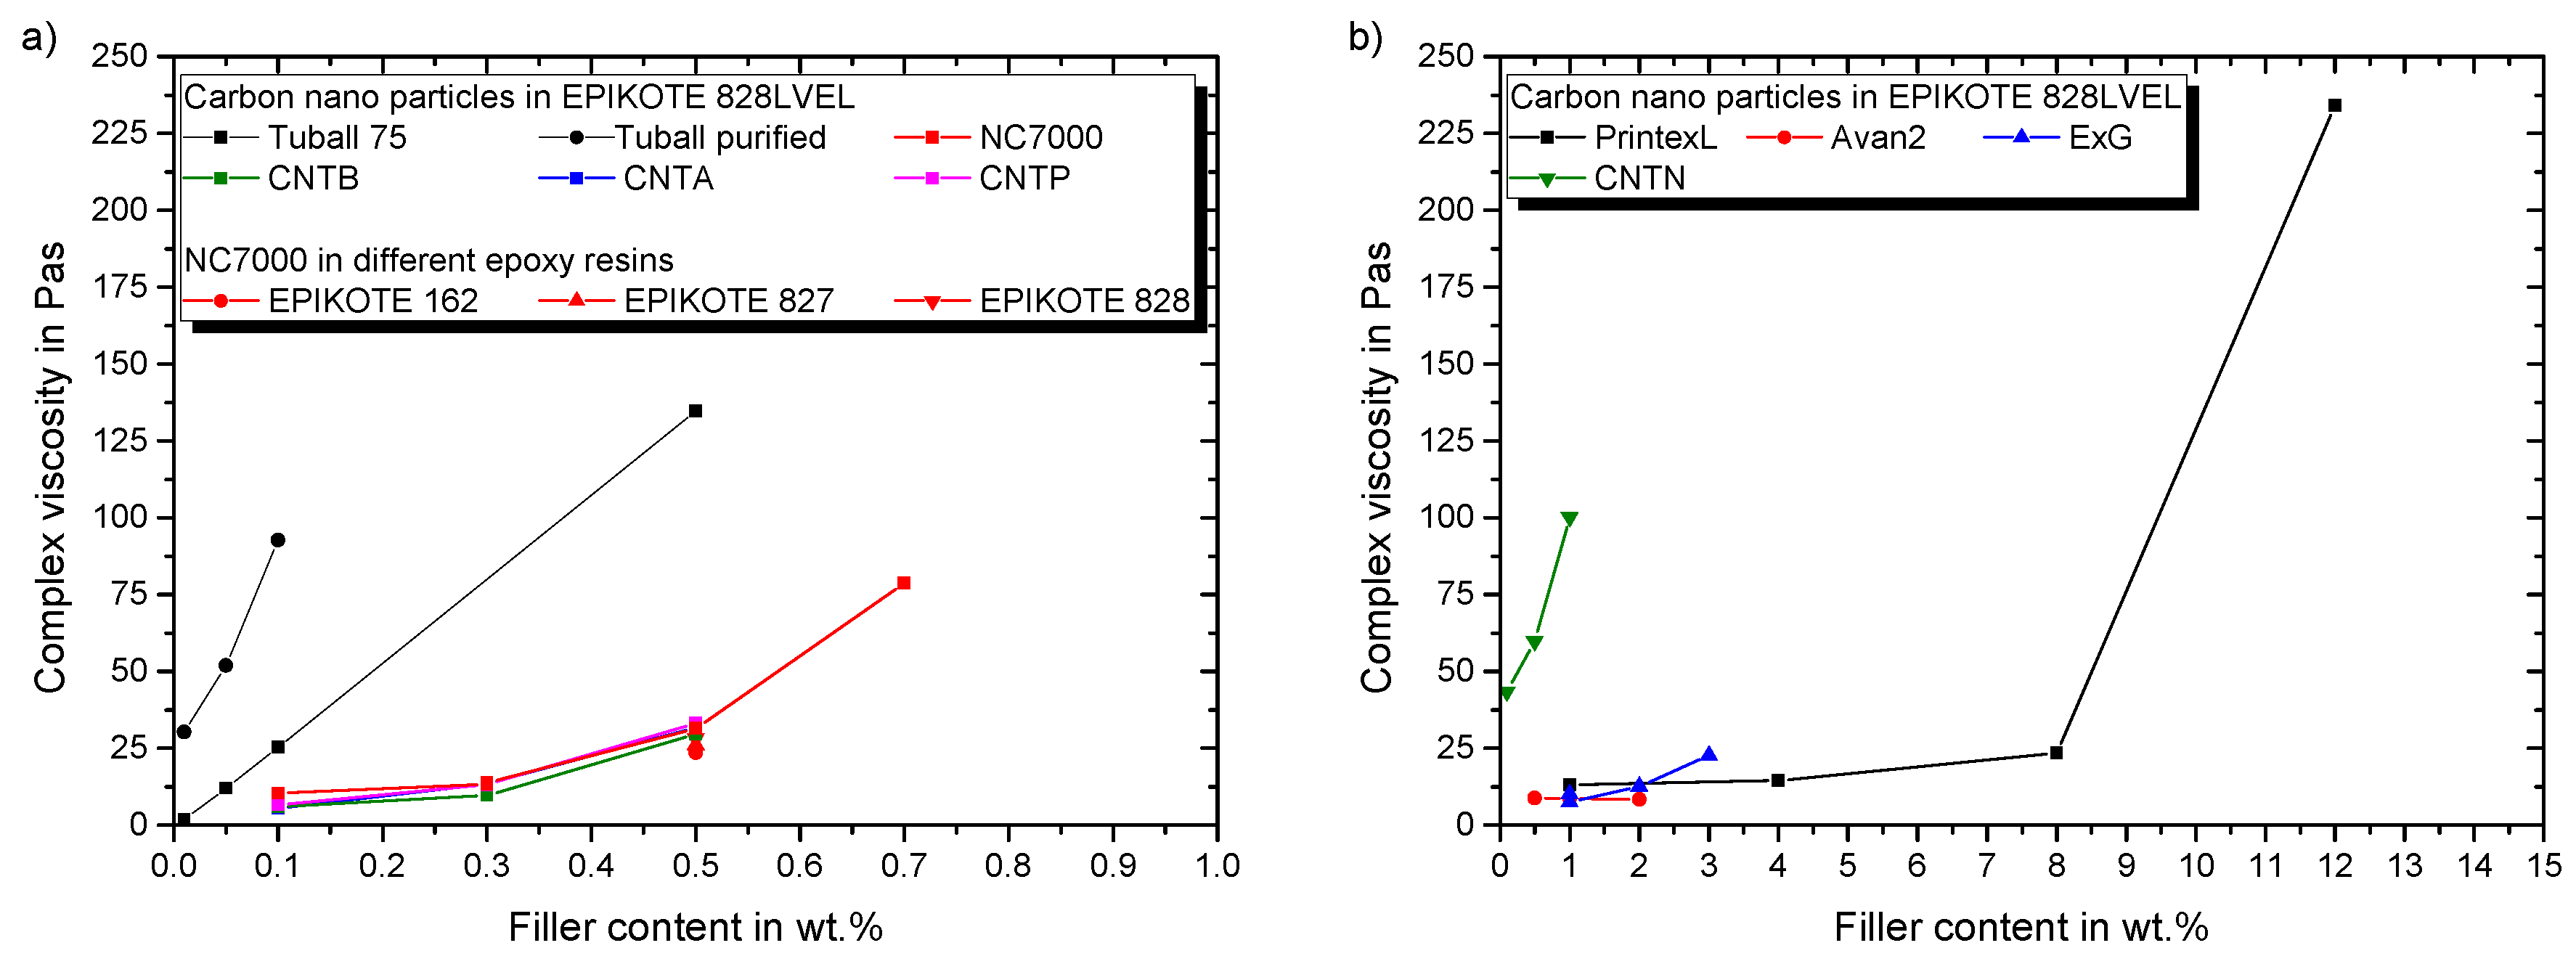
3.1. Rheology
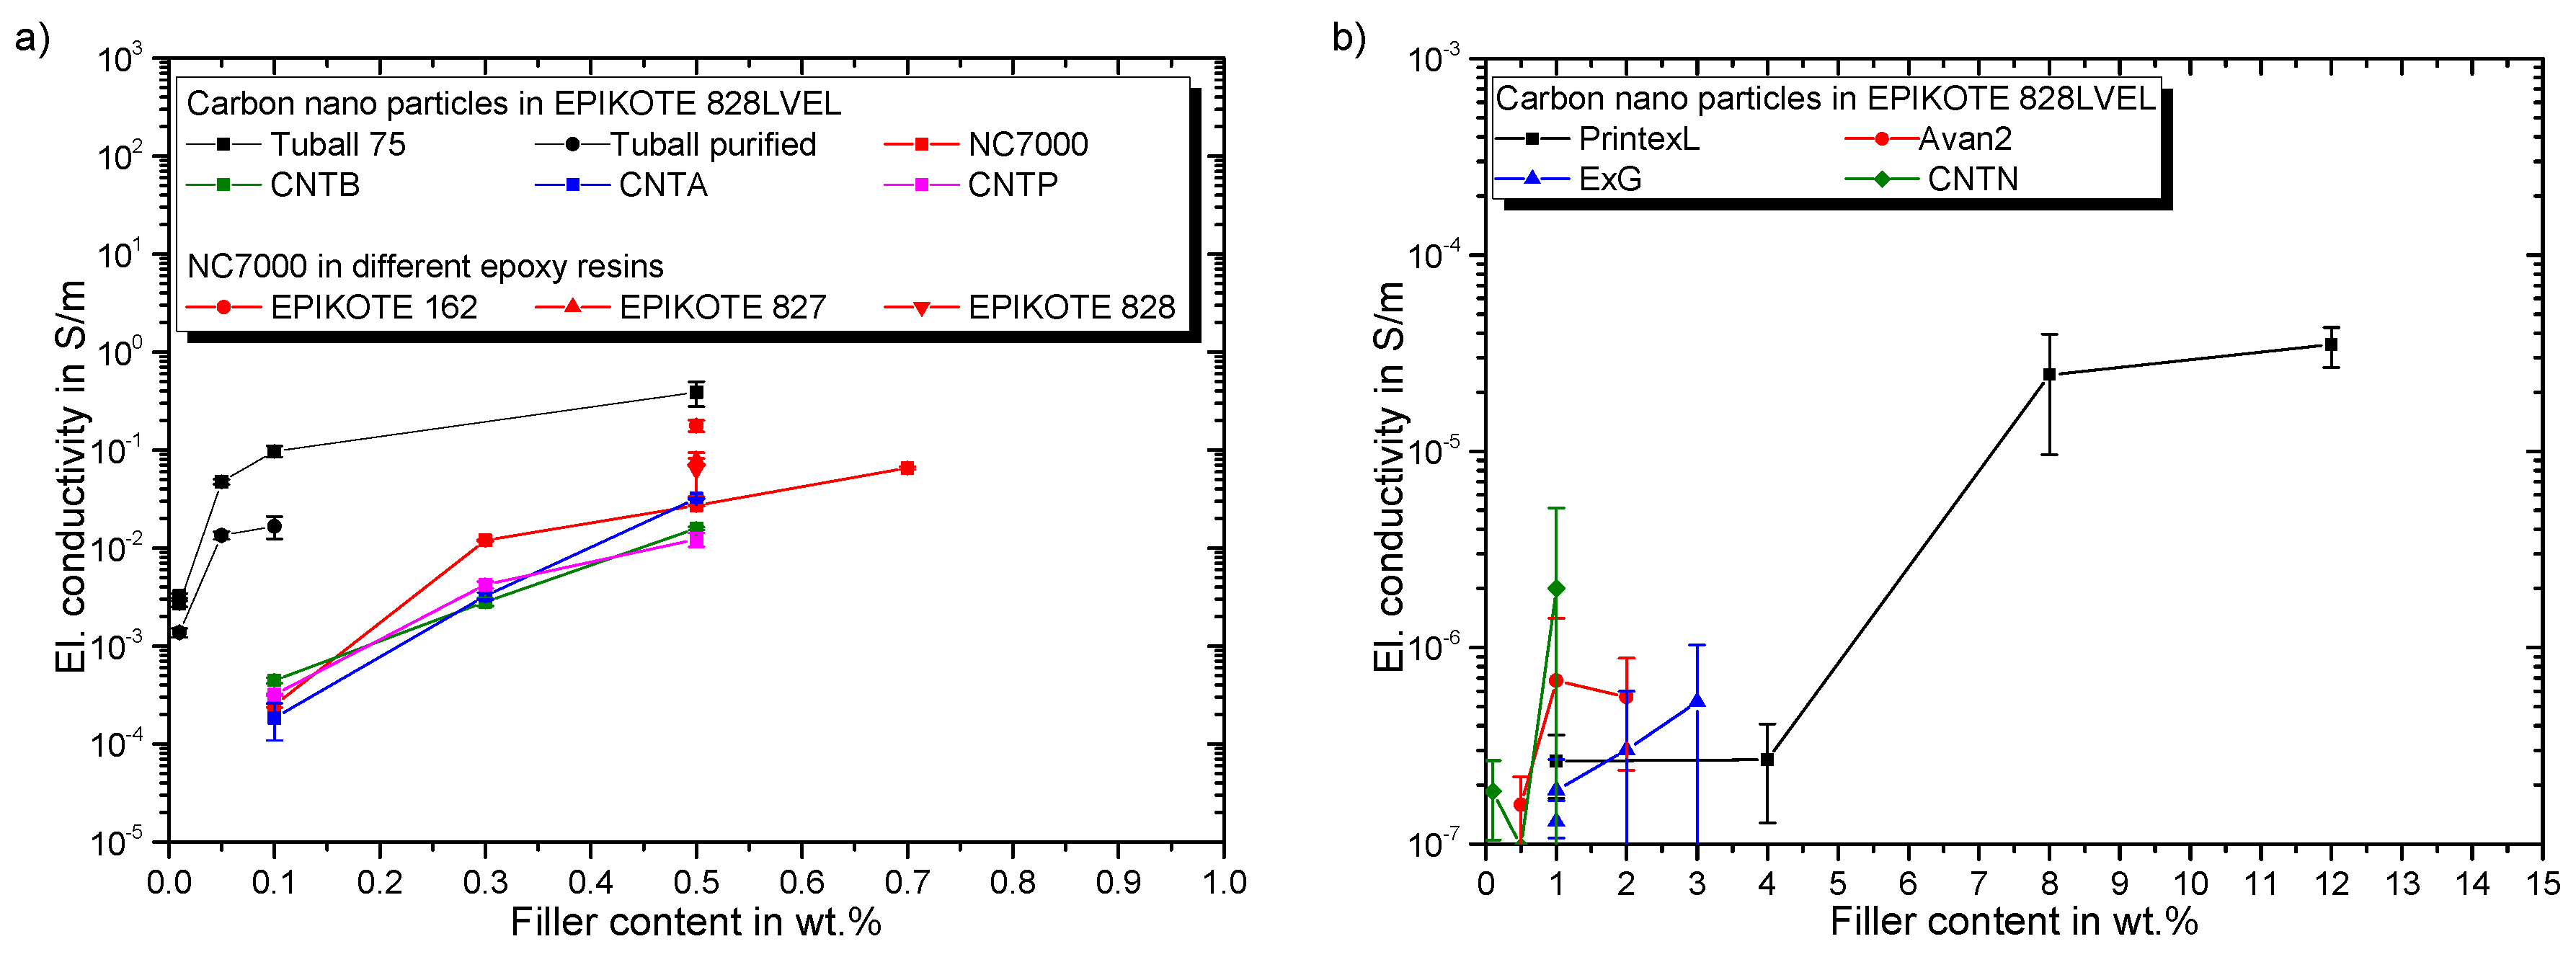
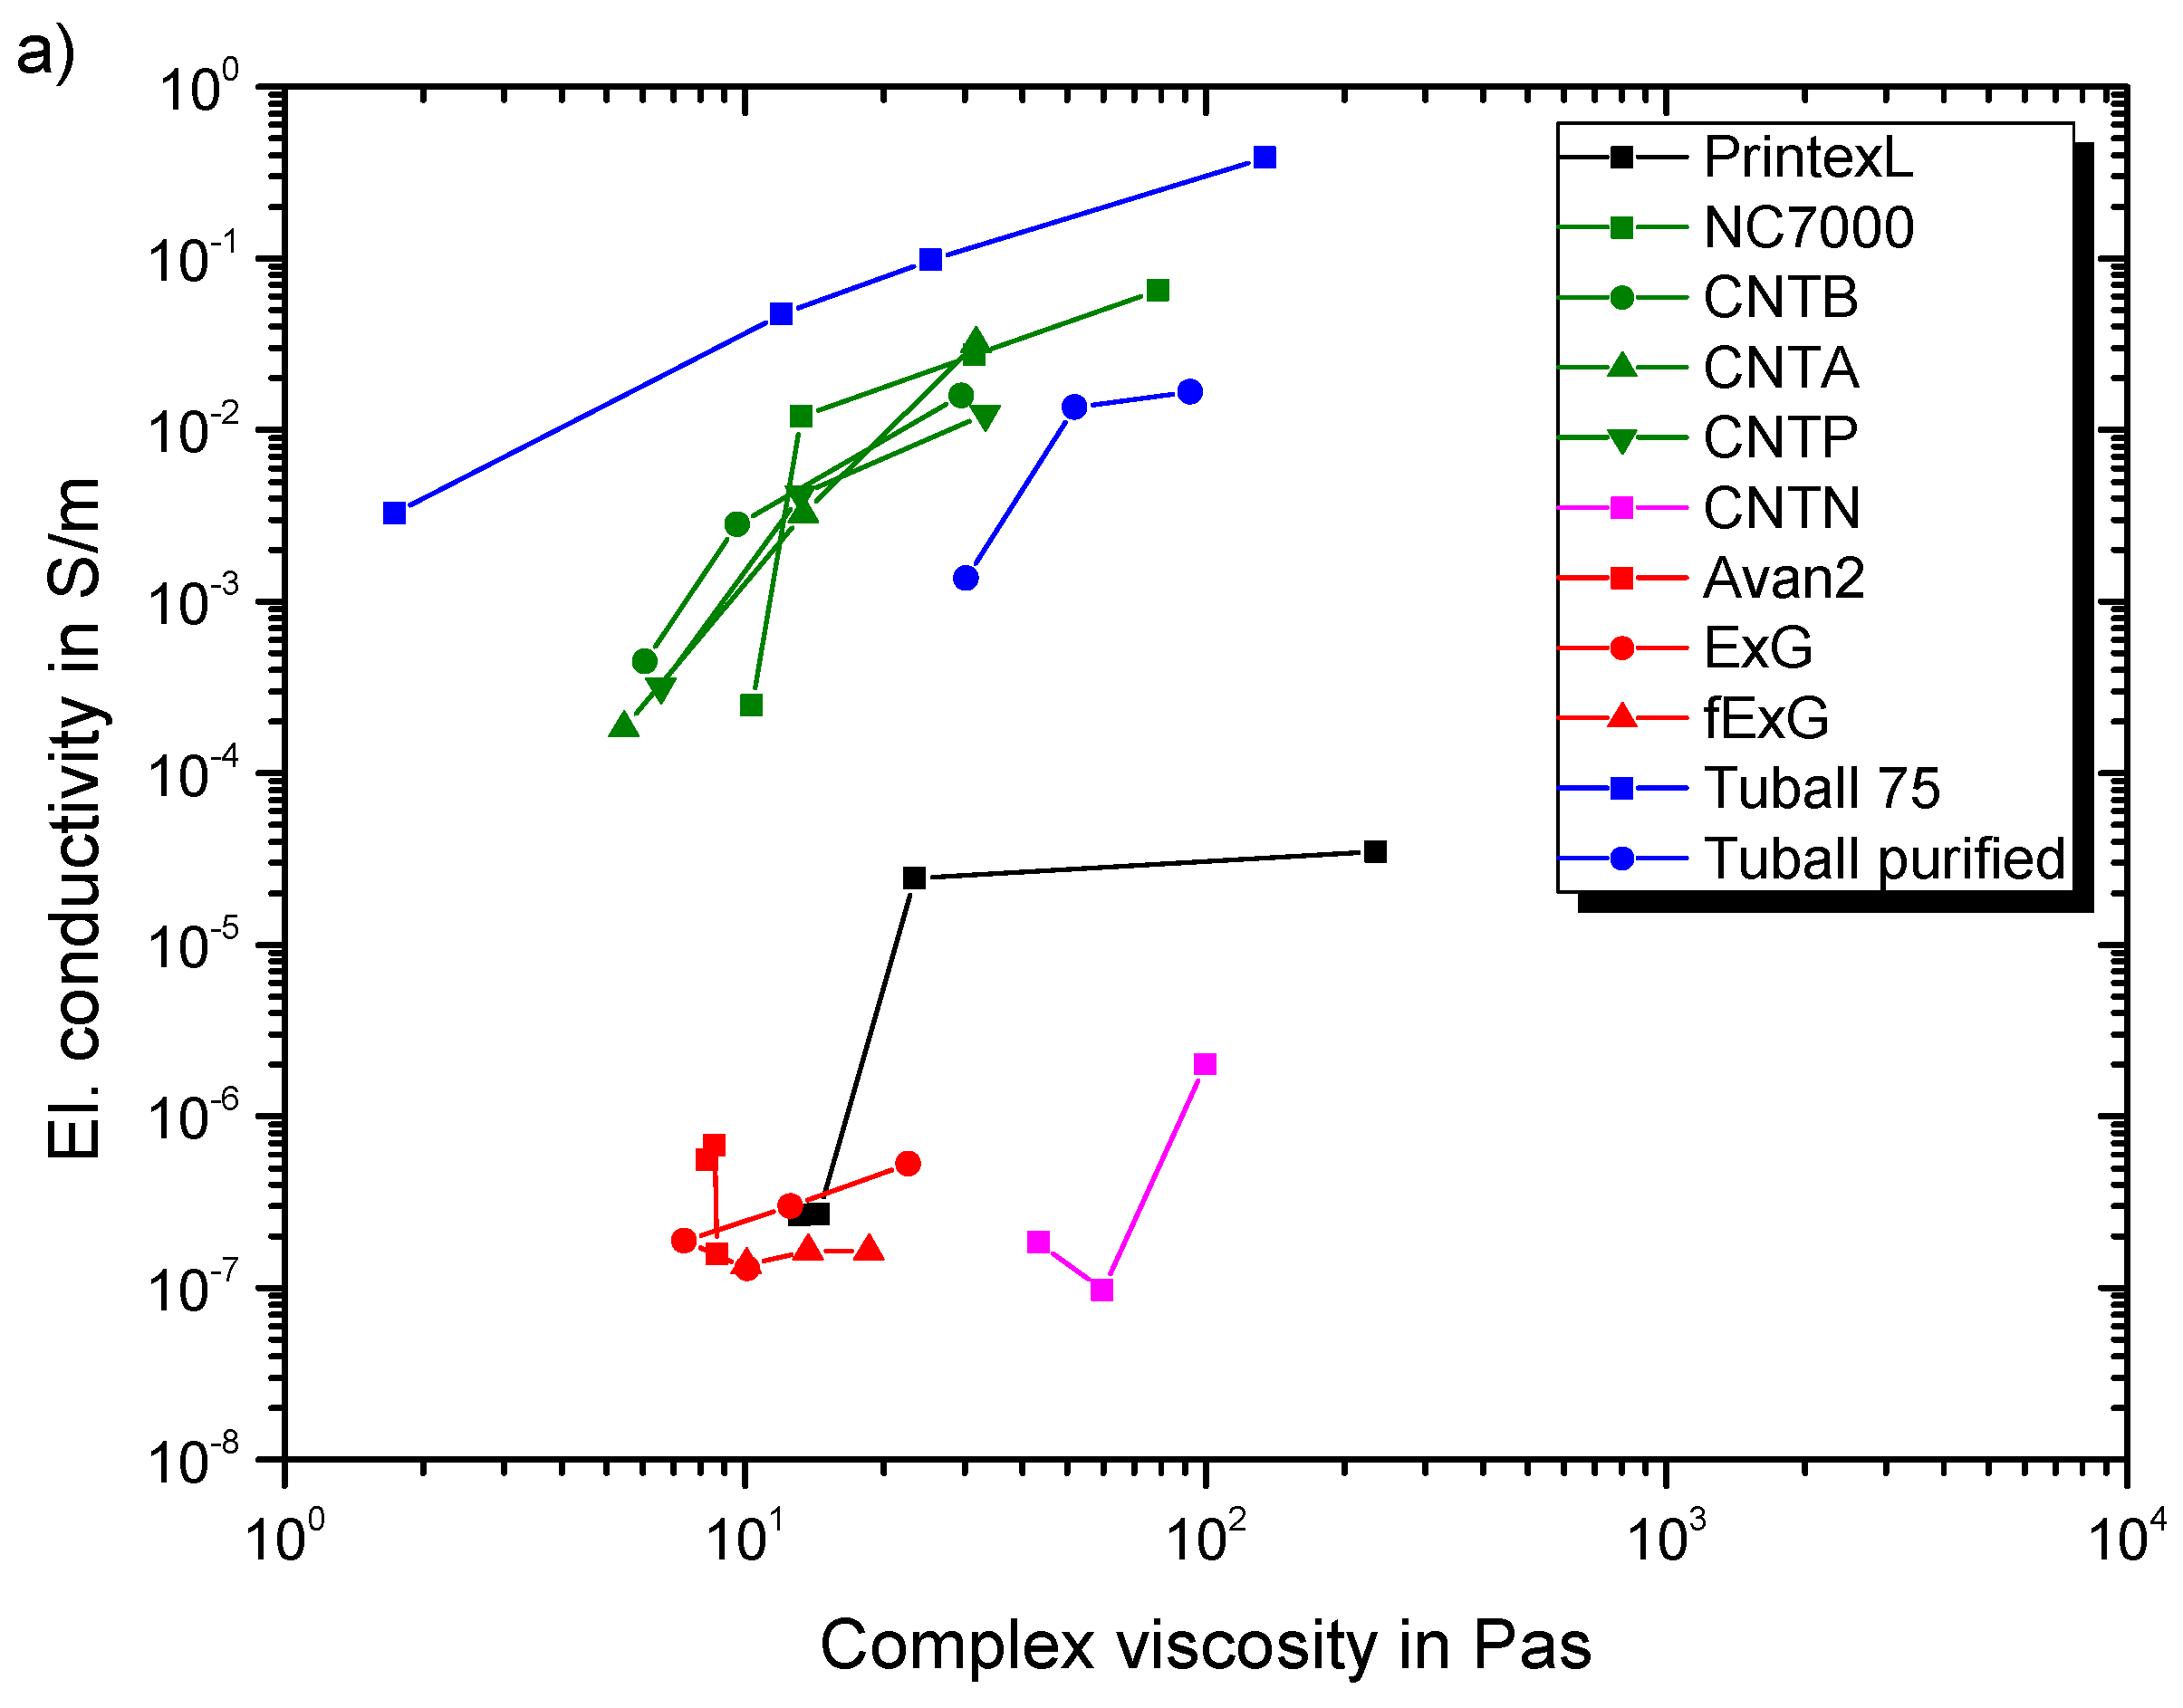
3.2. Conductivity
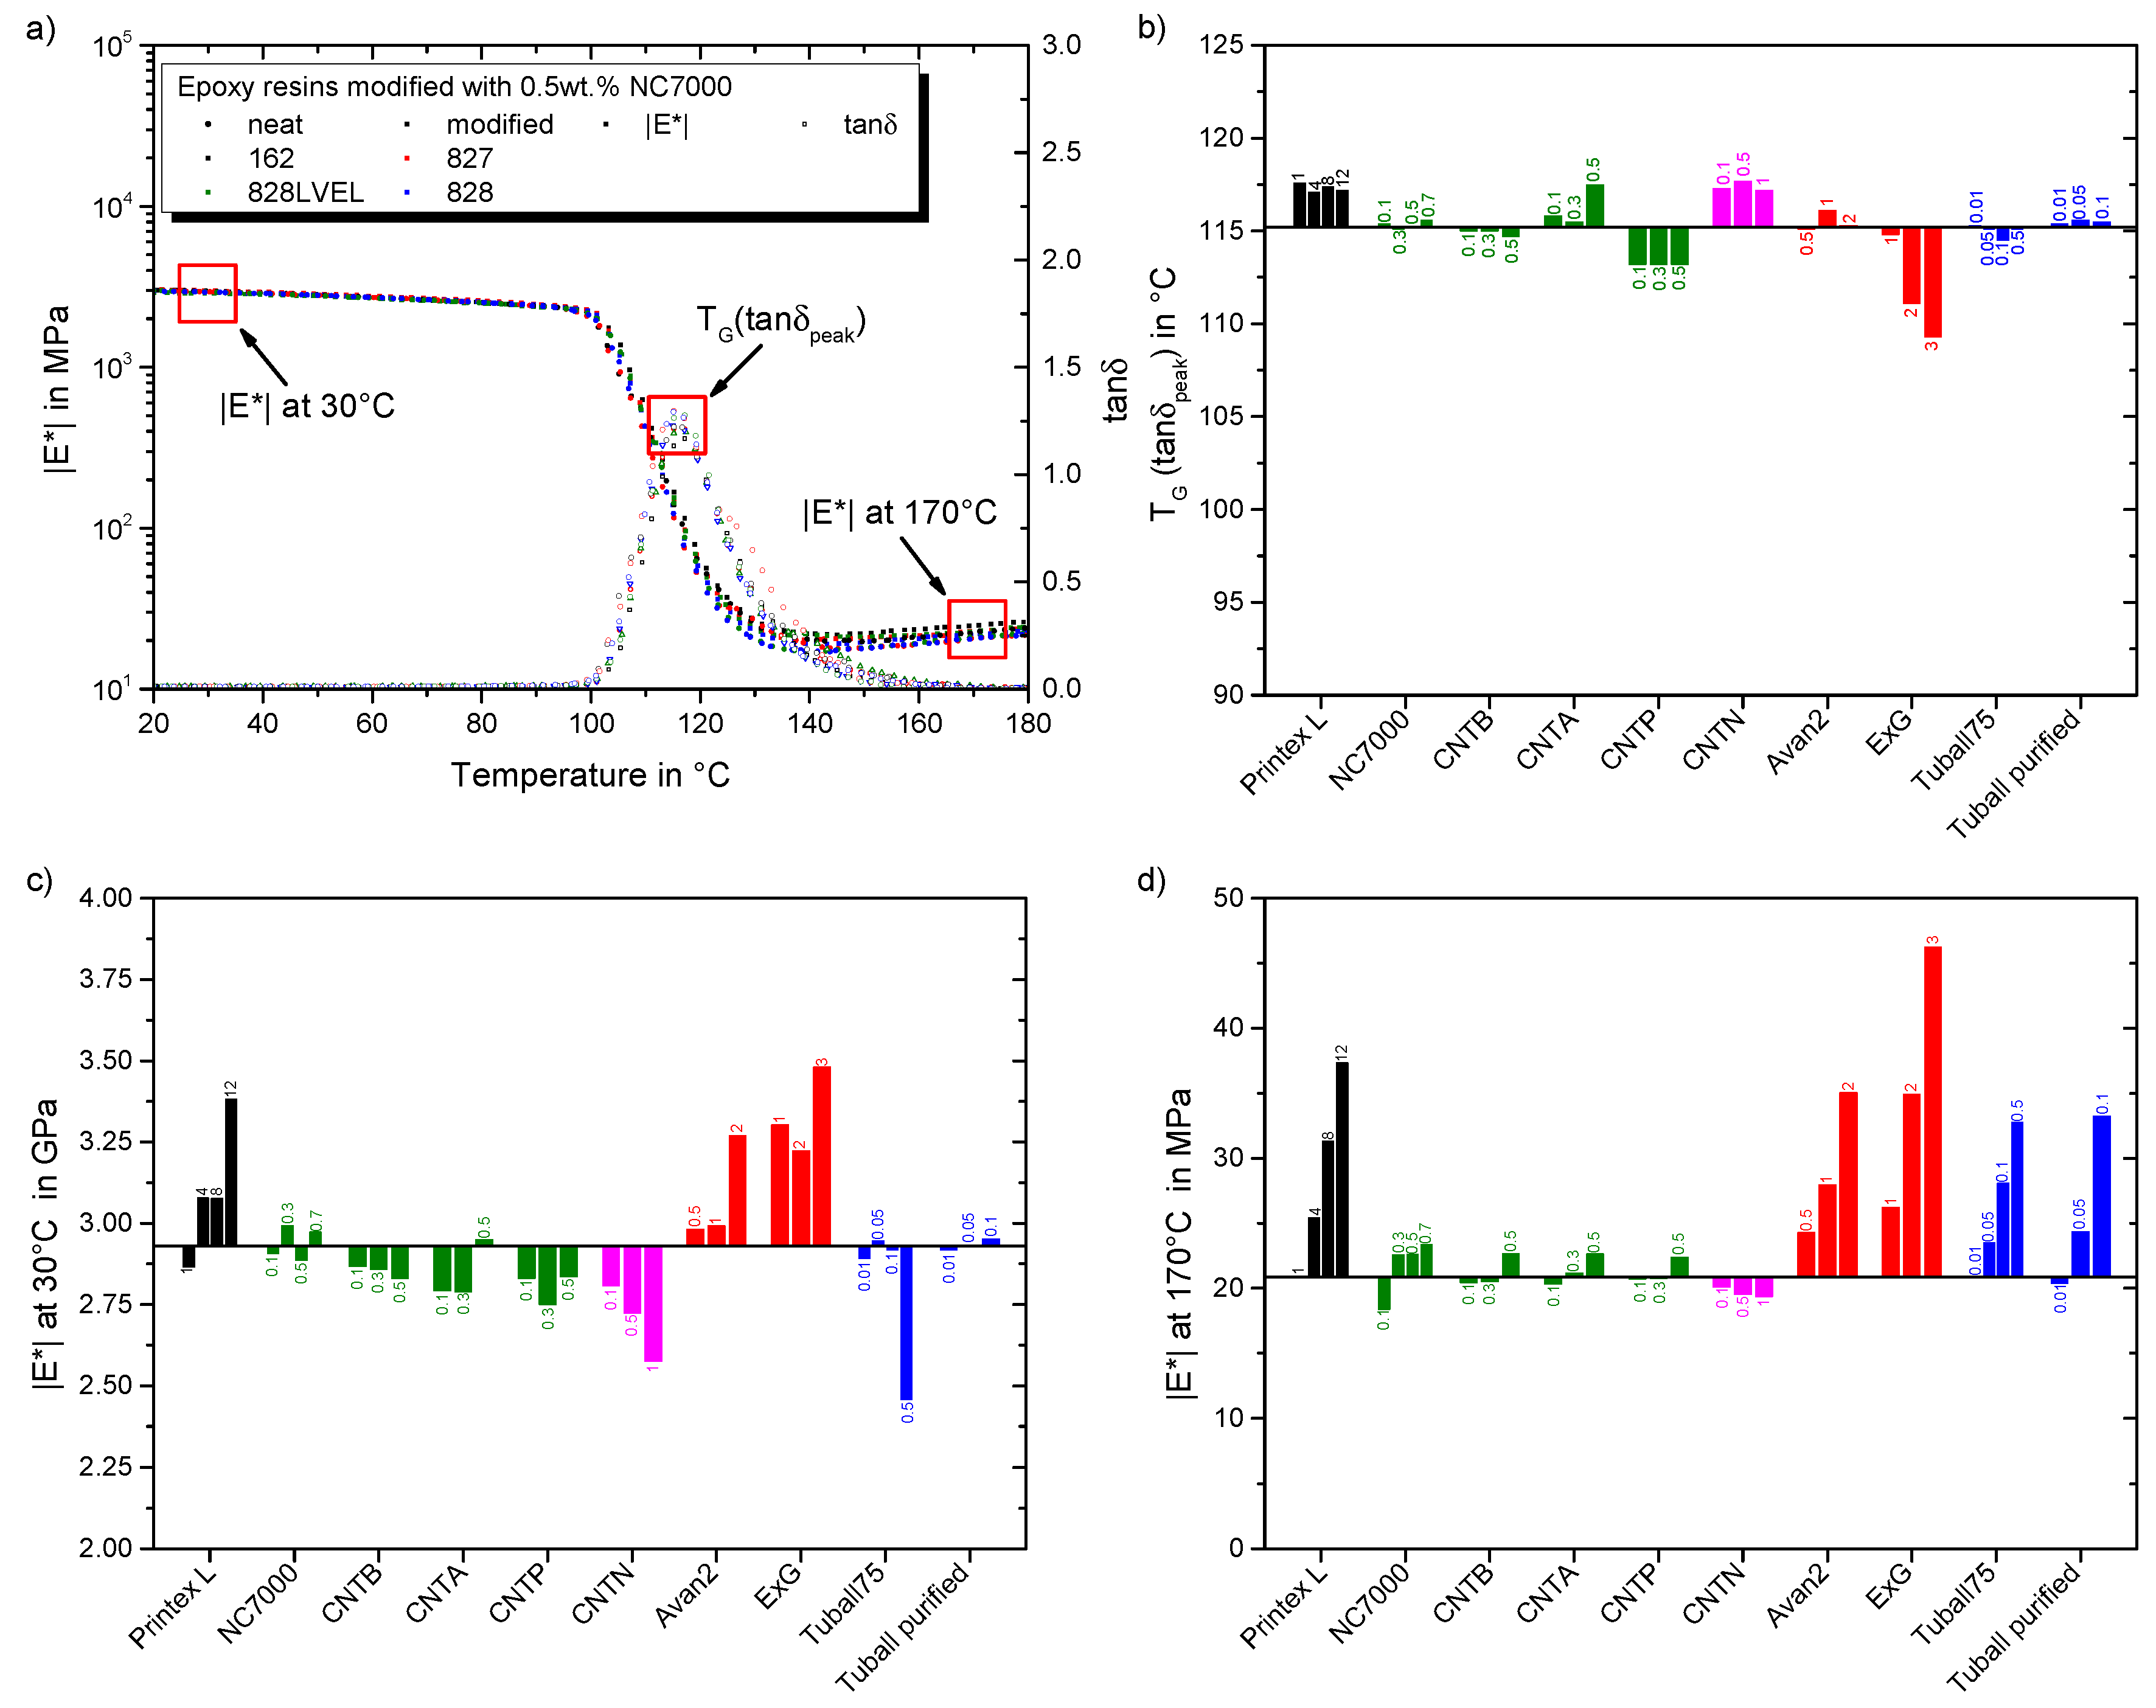
3.3. DMTA
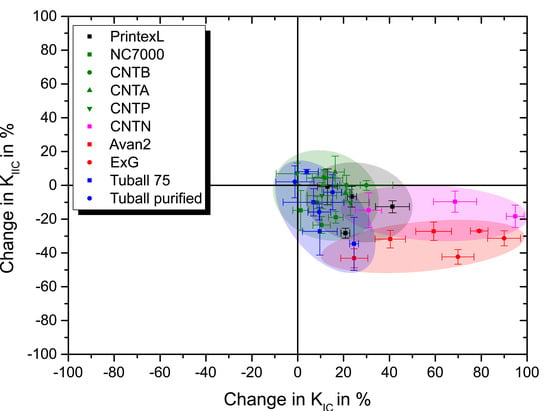
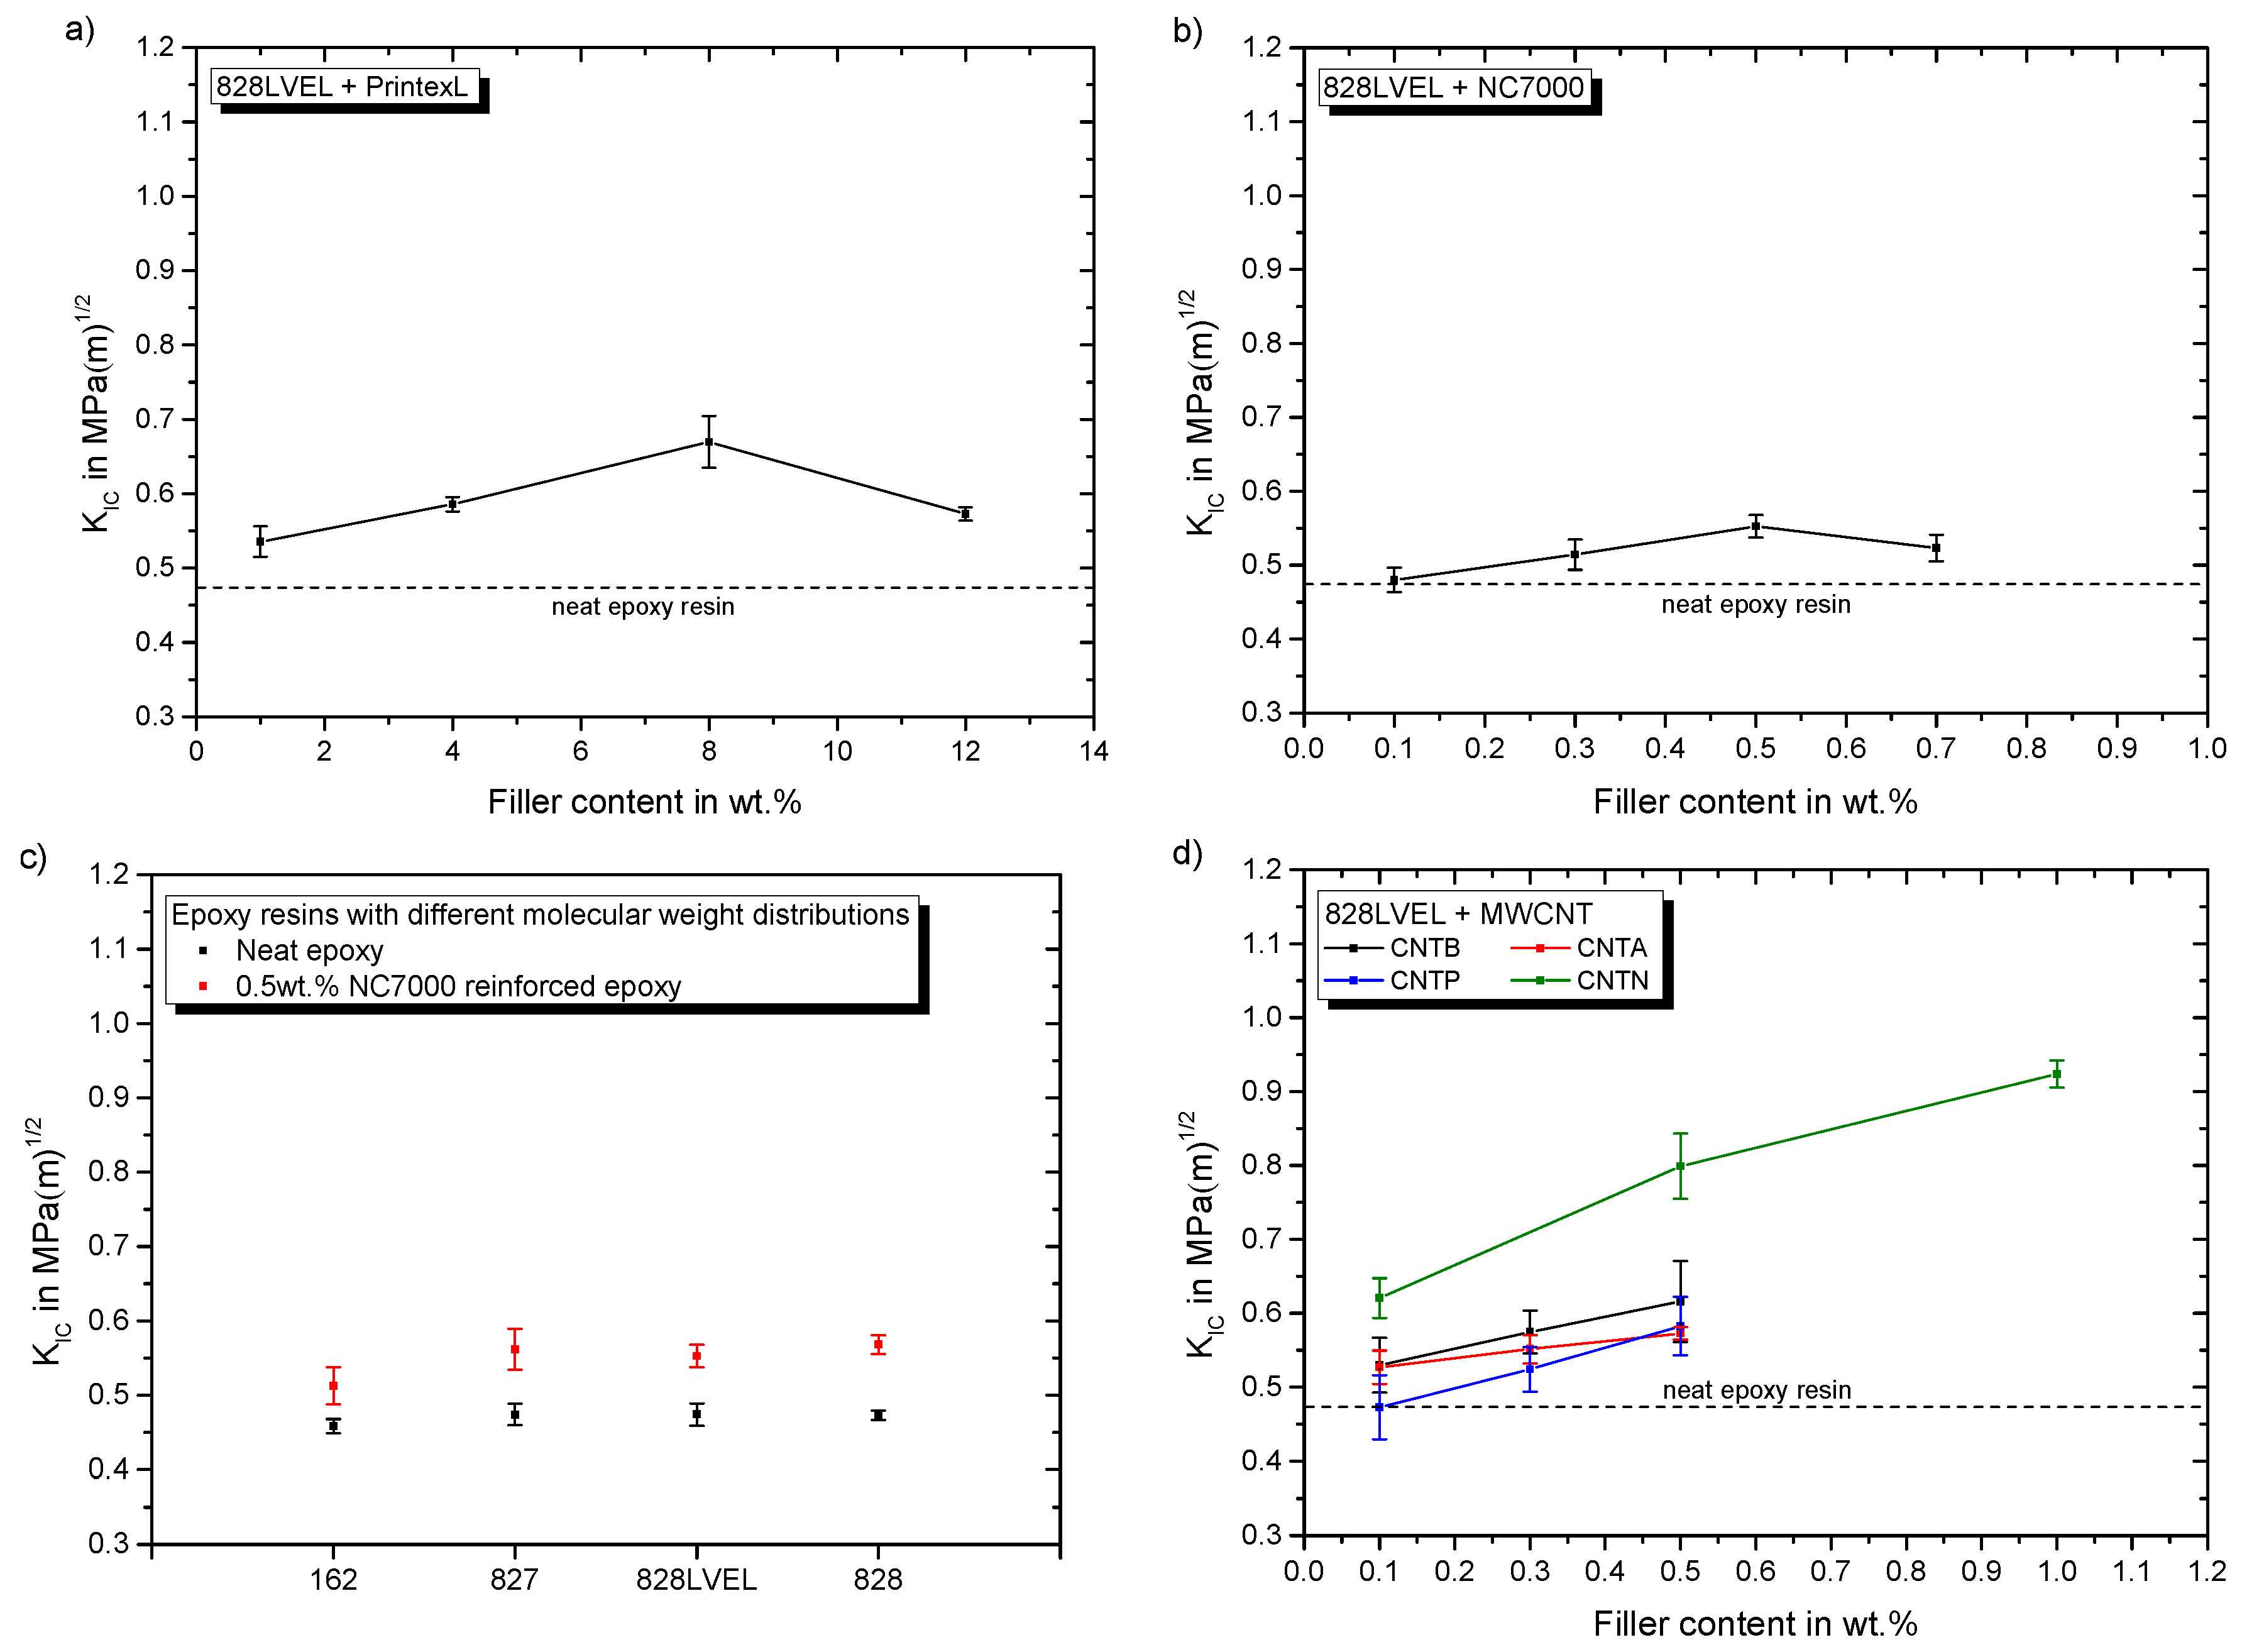
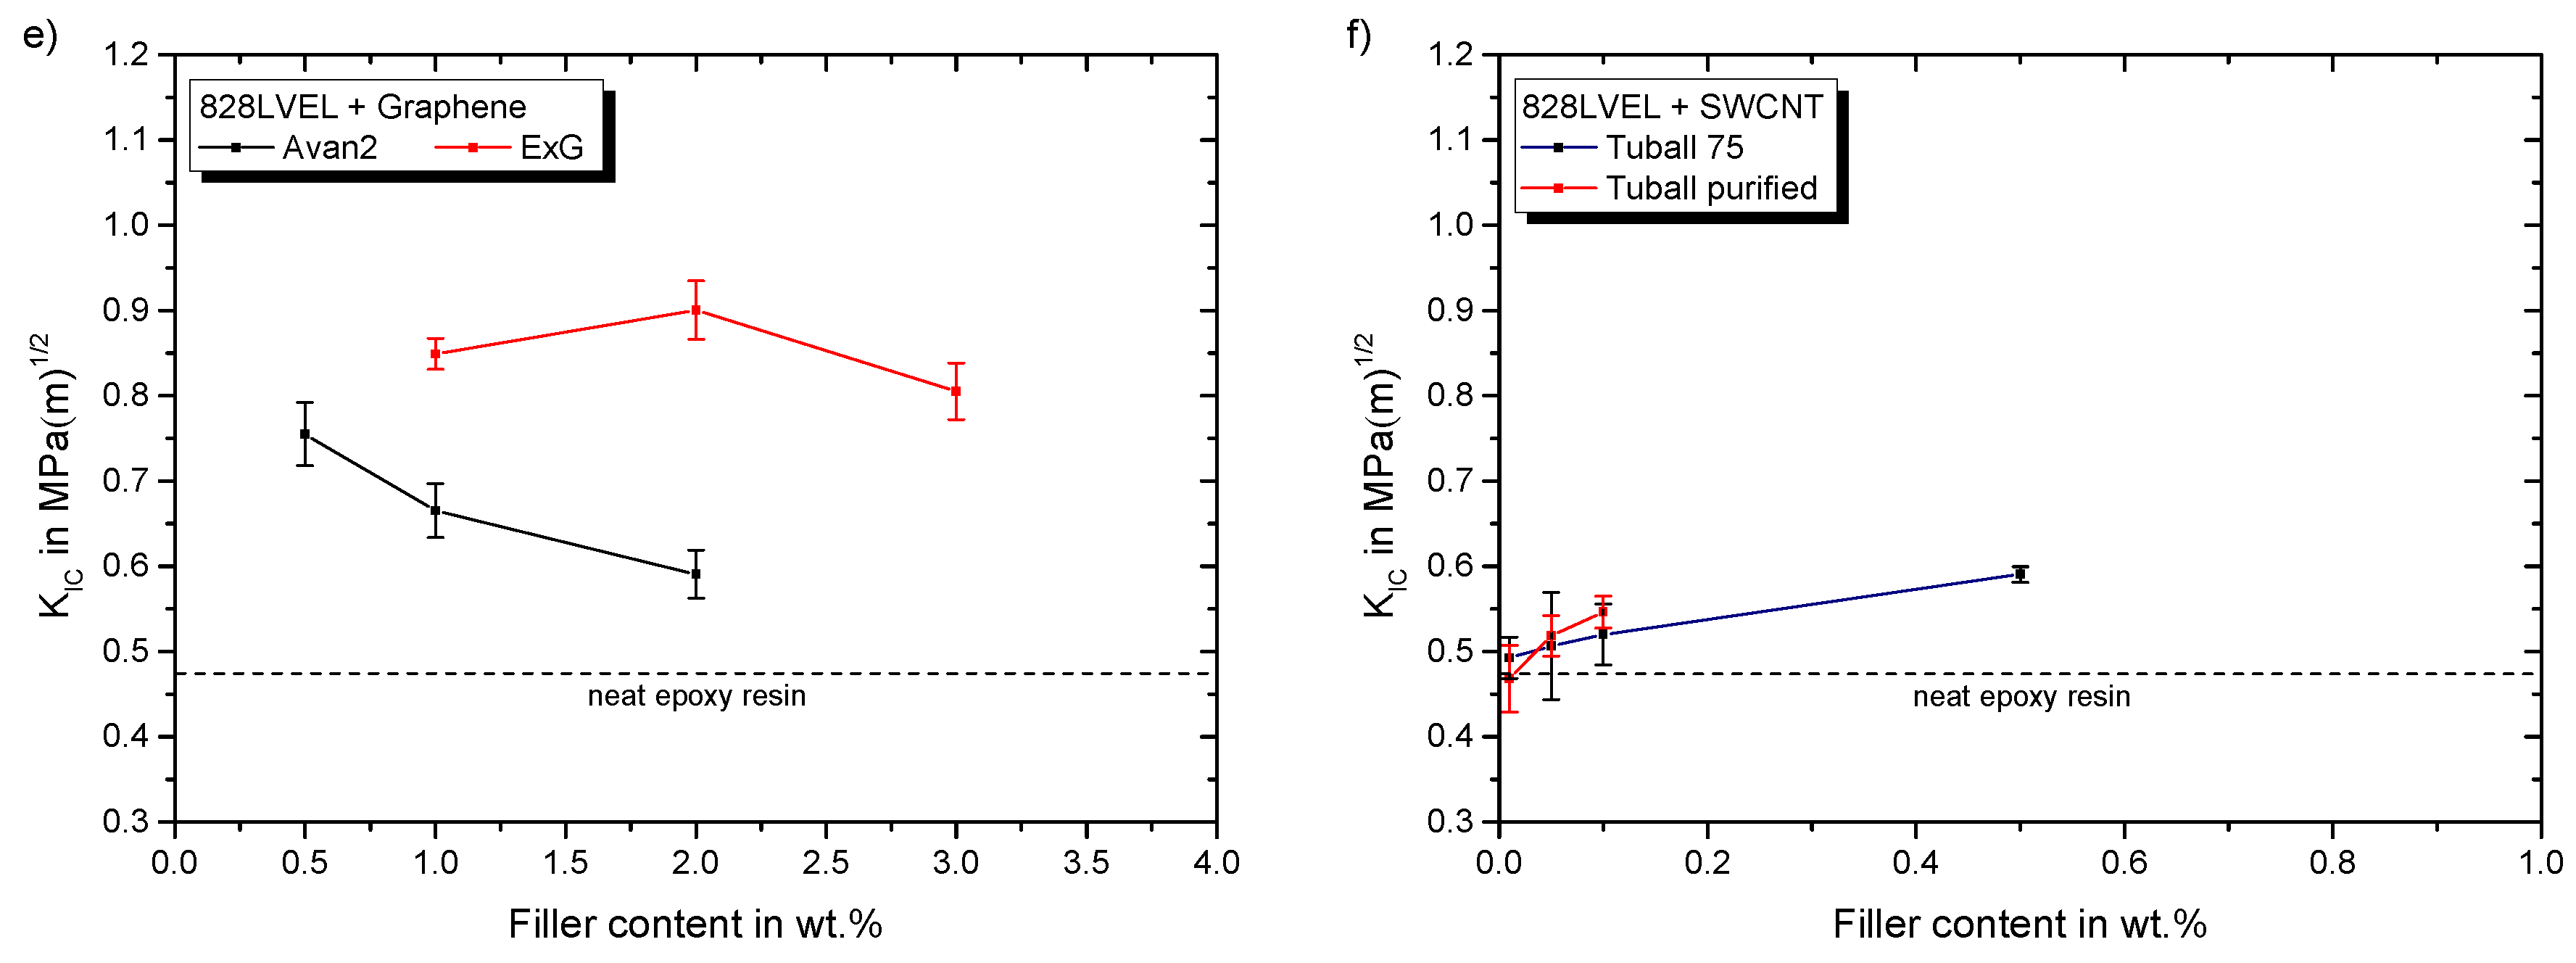
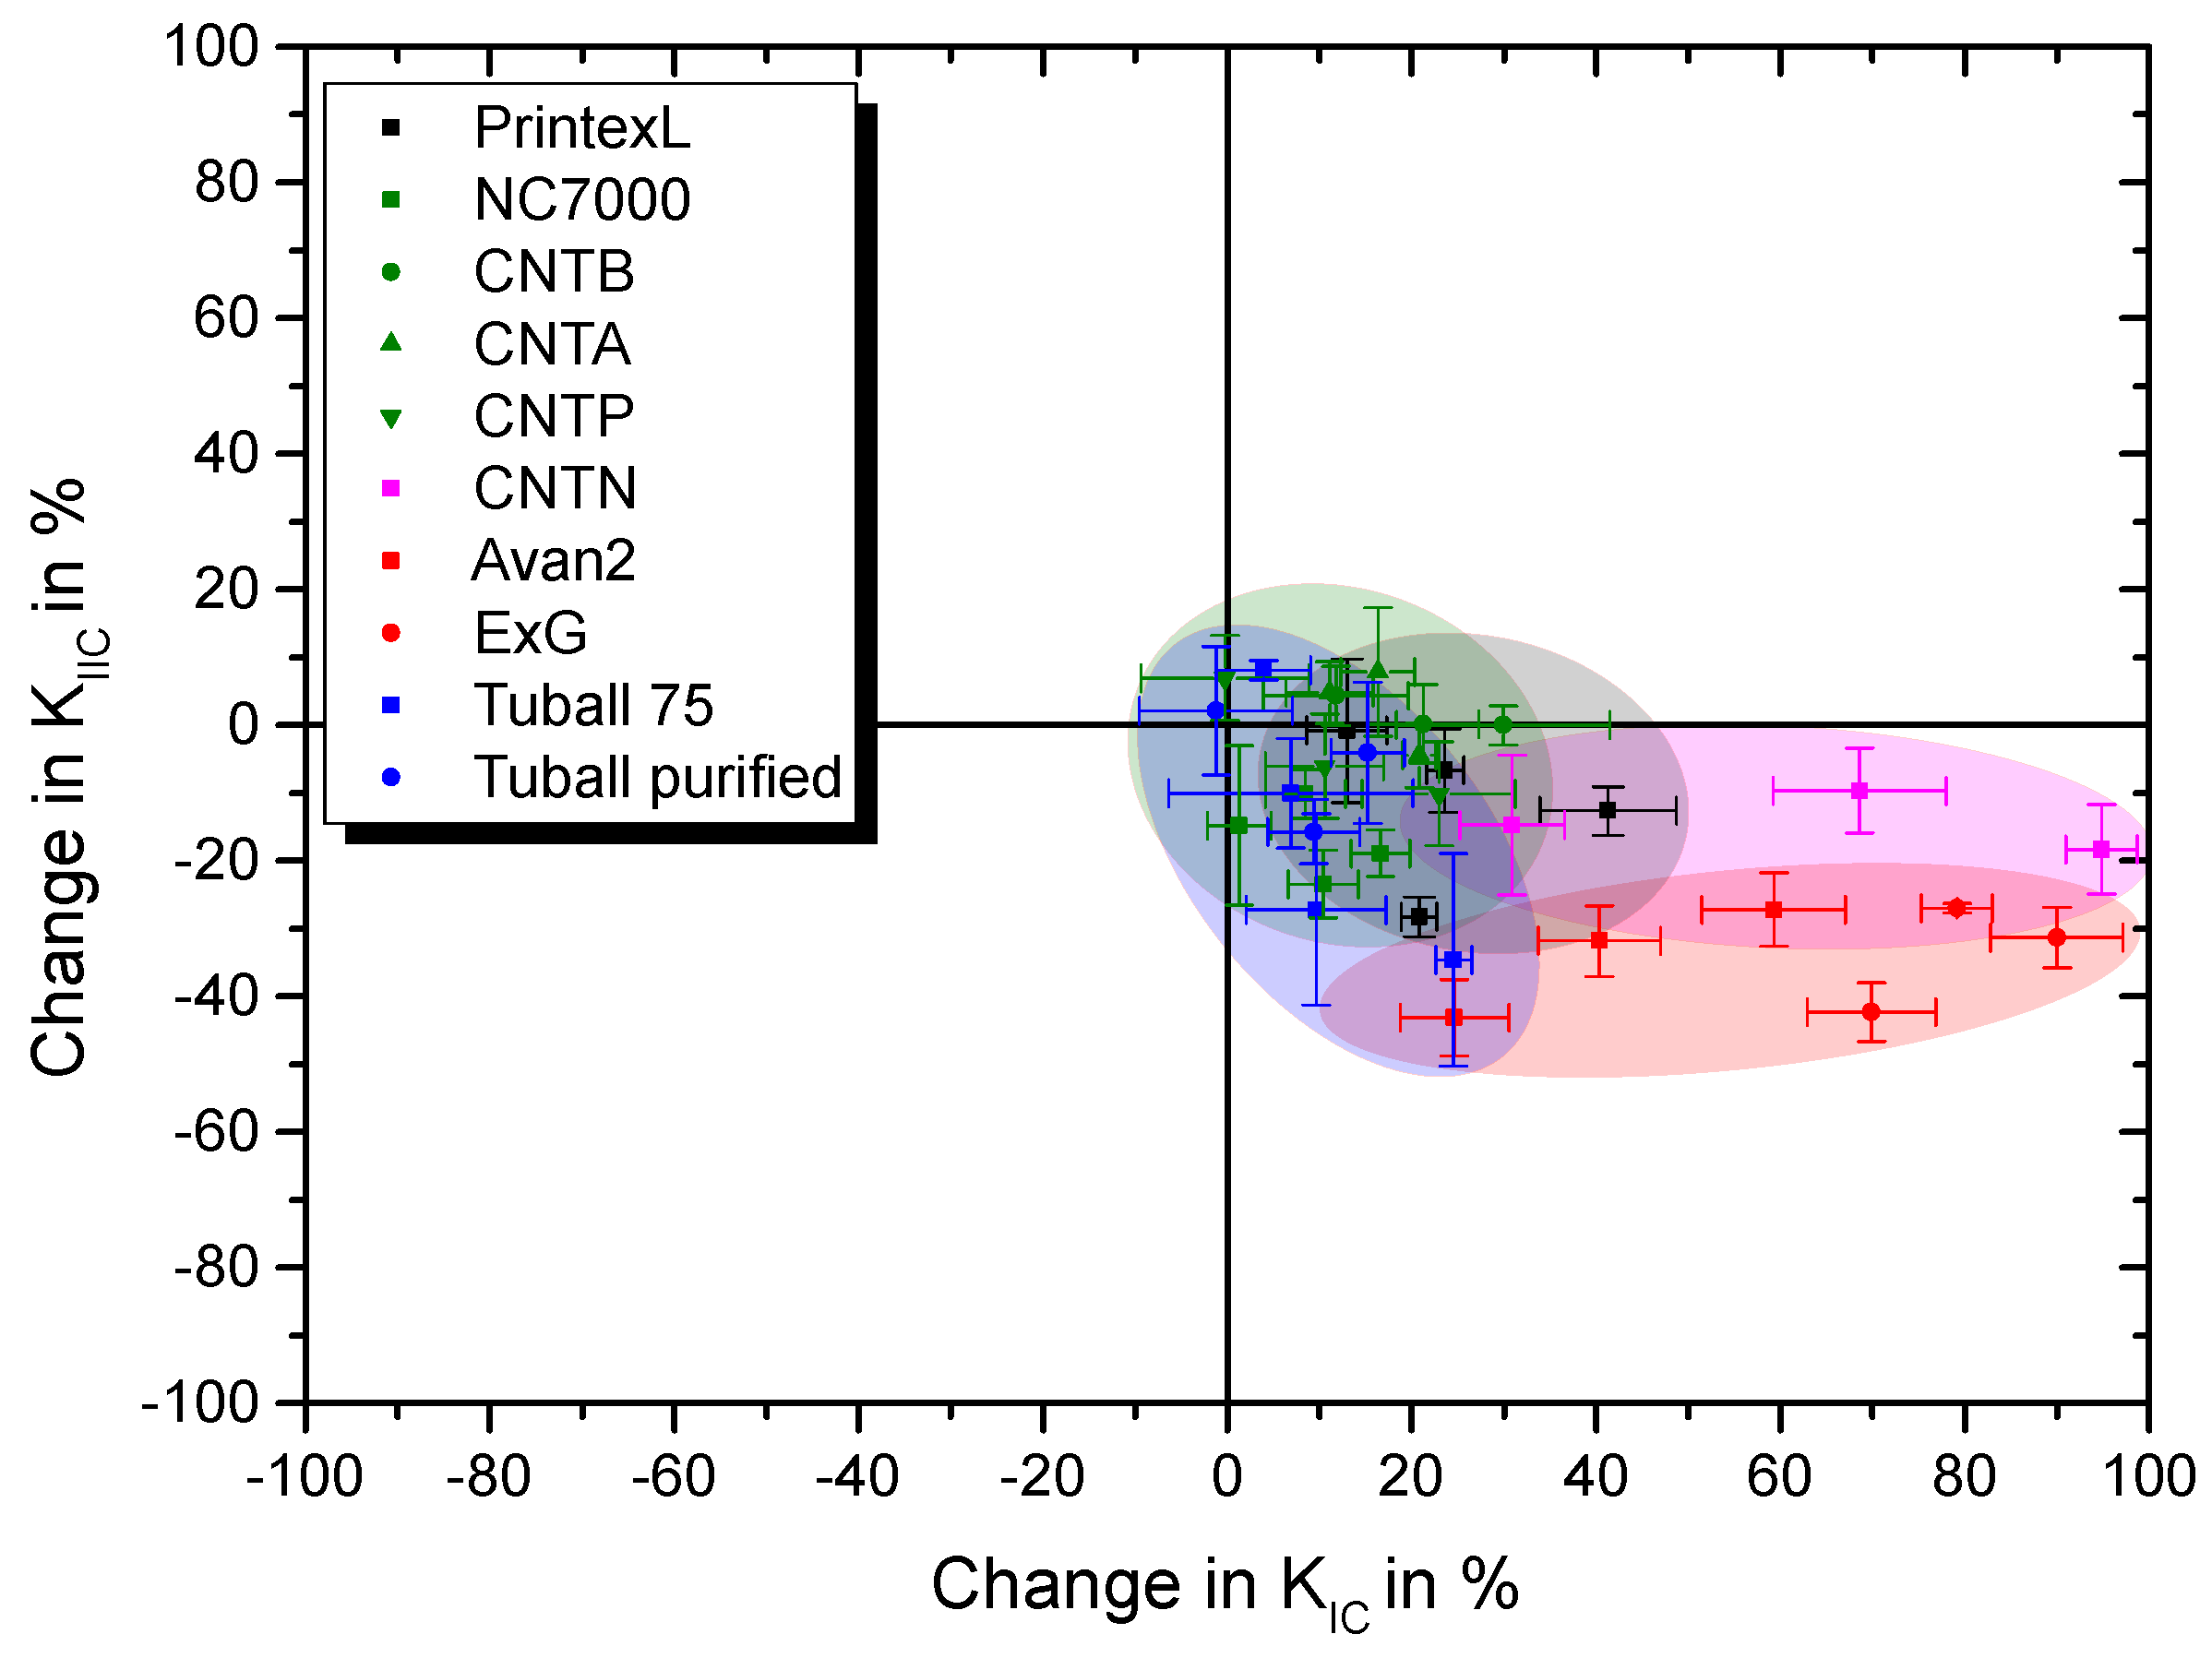
3.4. Fracture Toughness Mode I and II
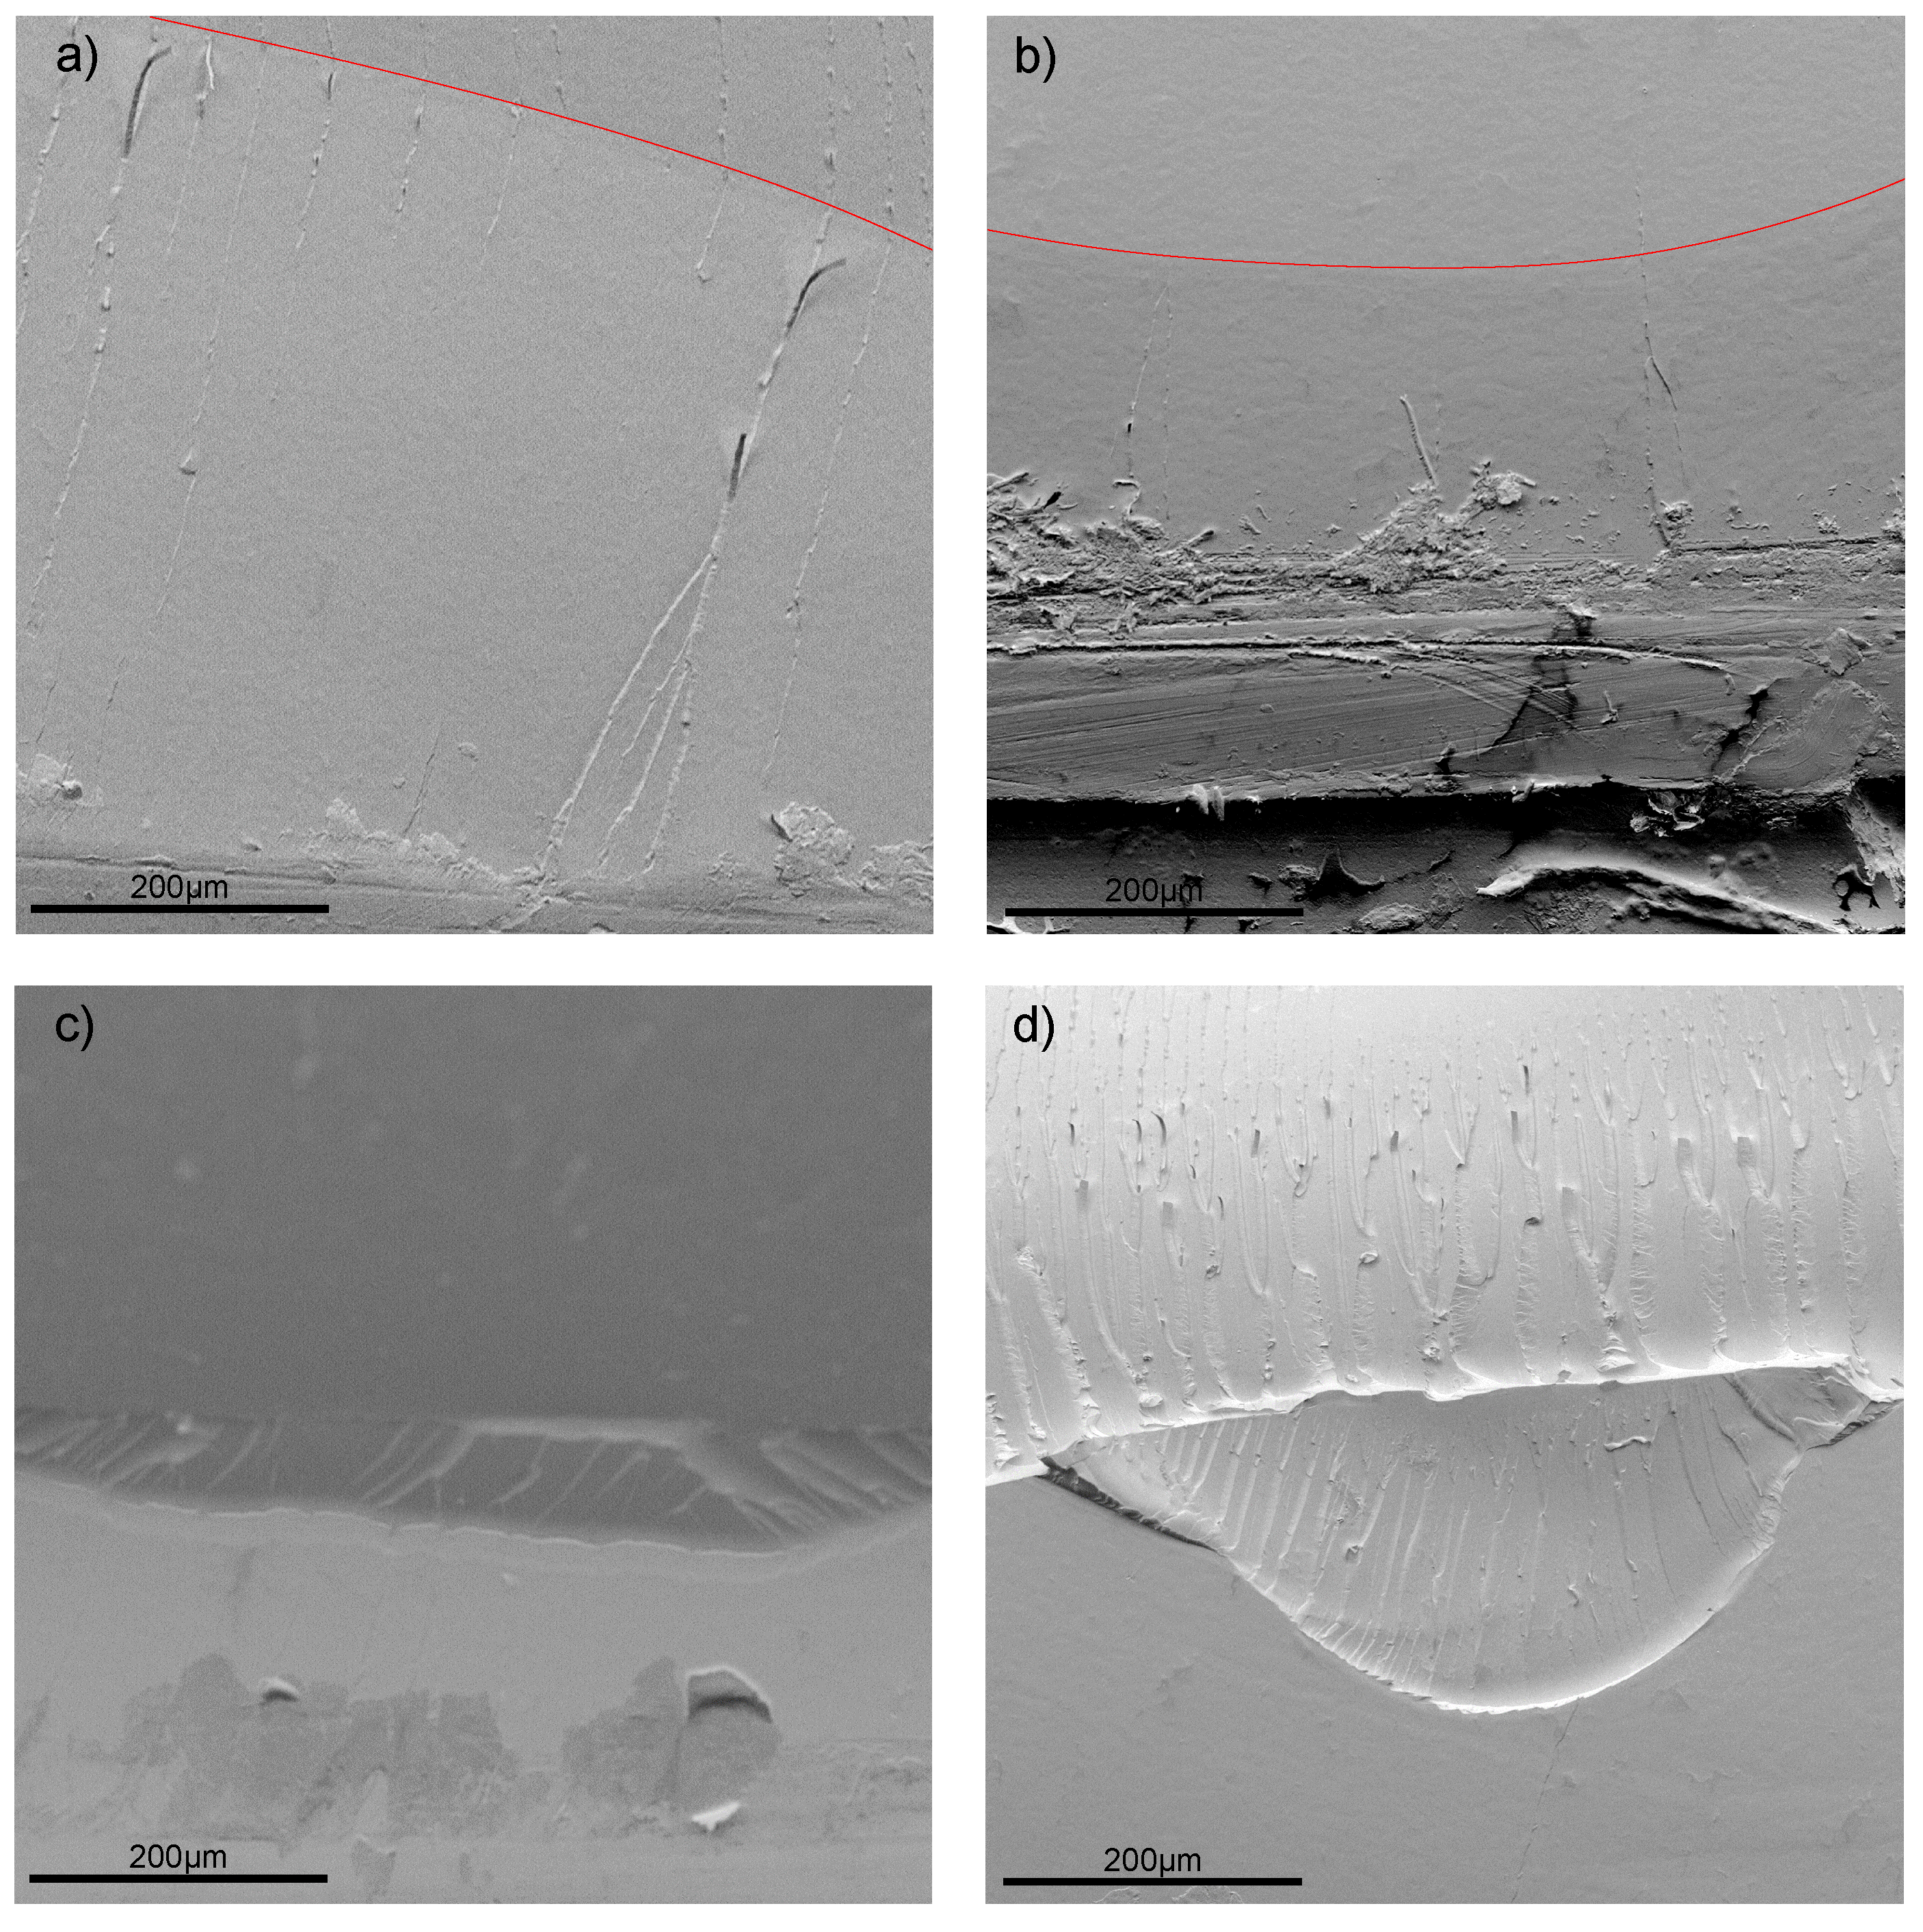
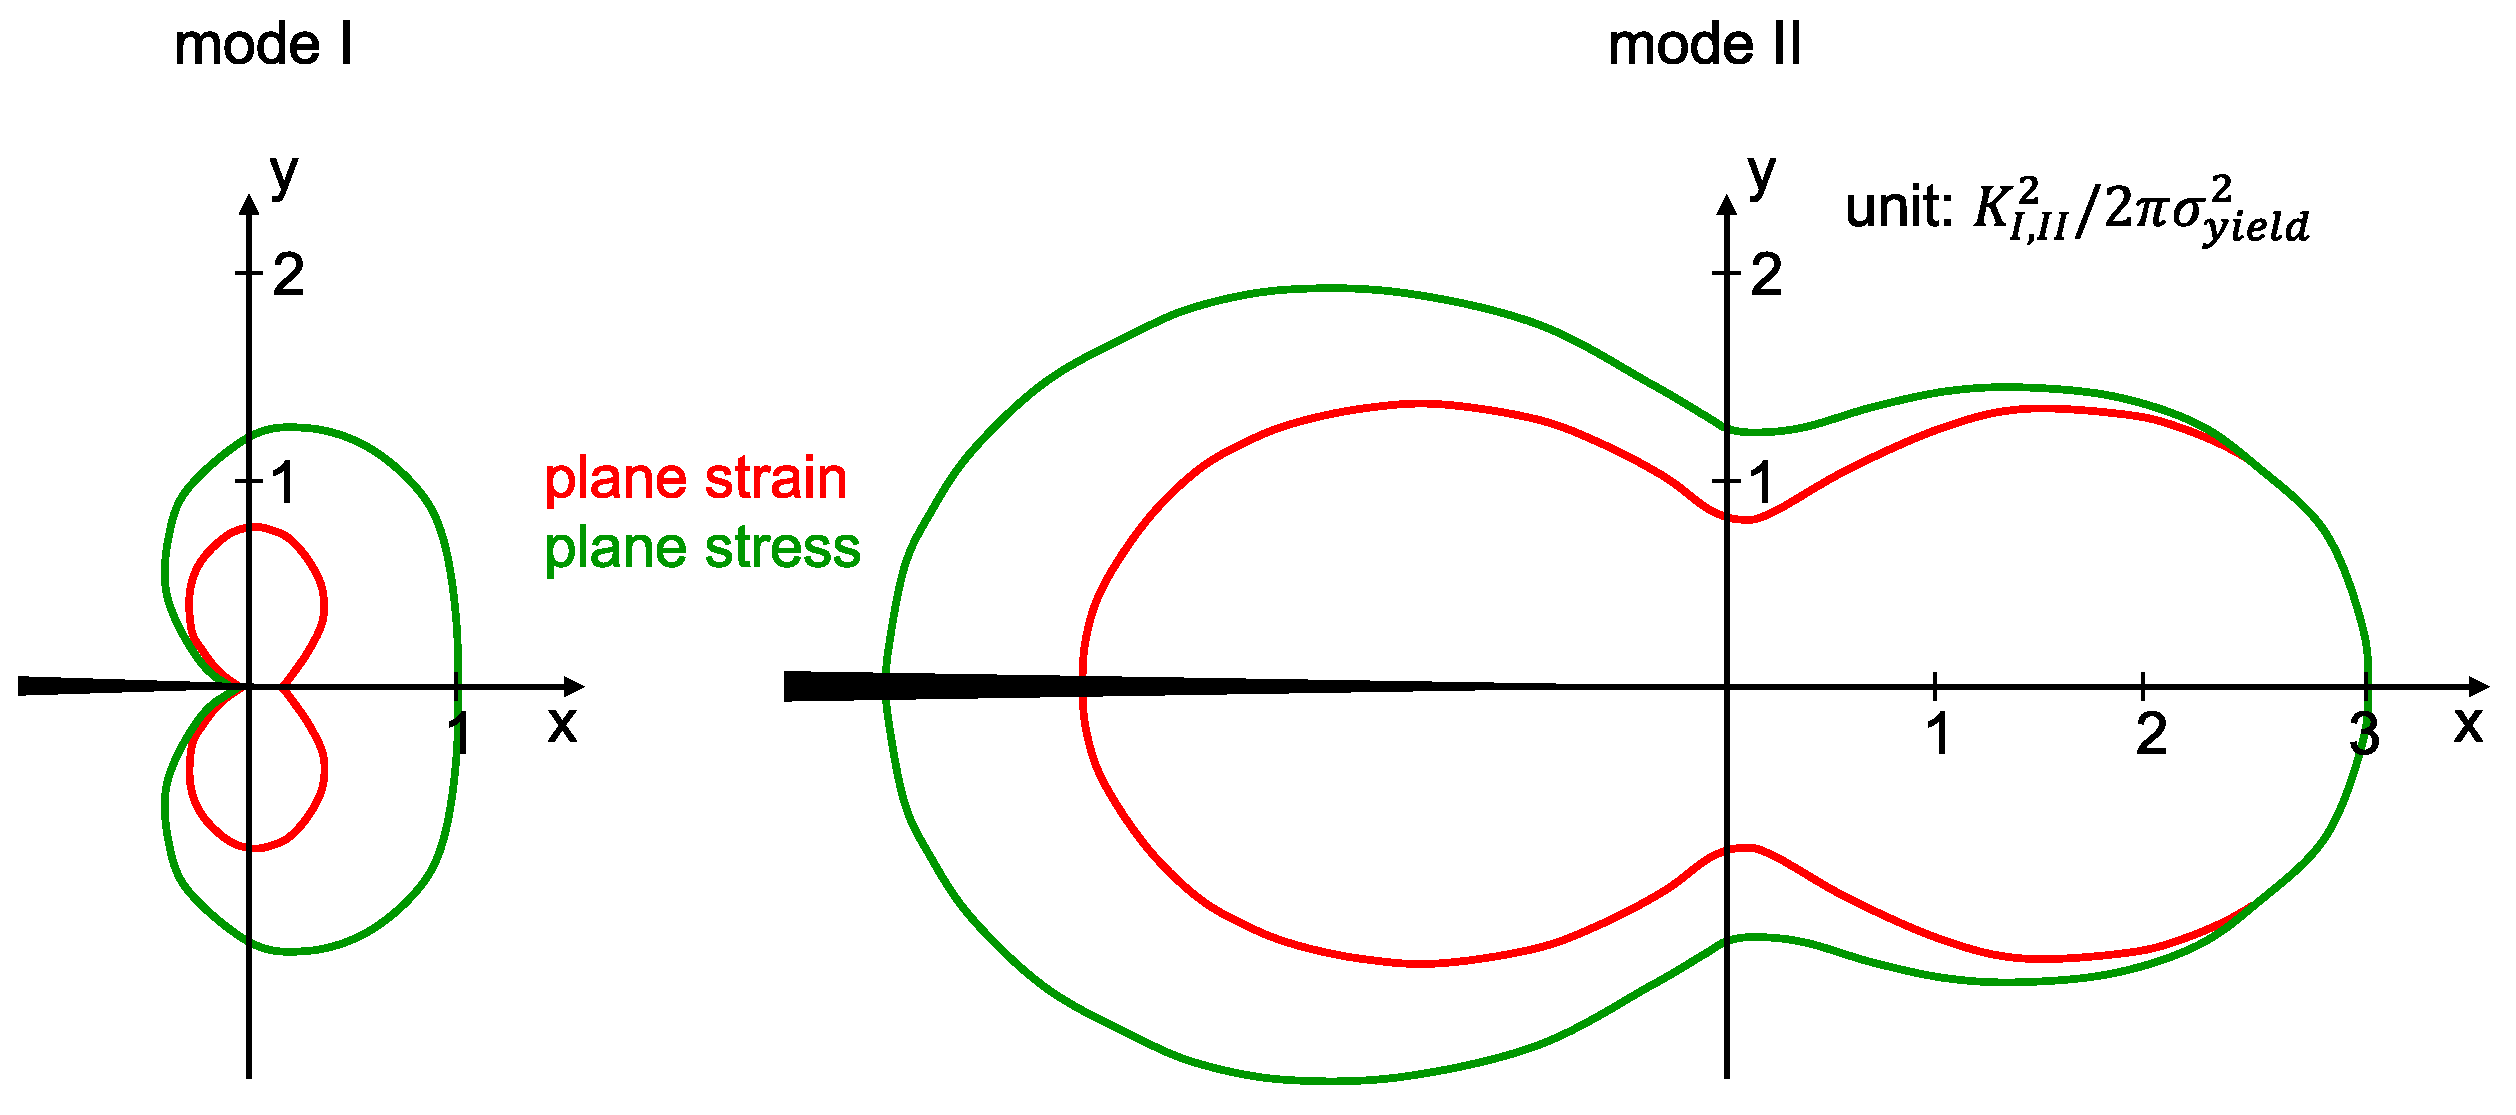
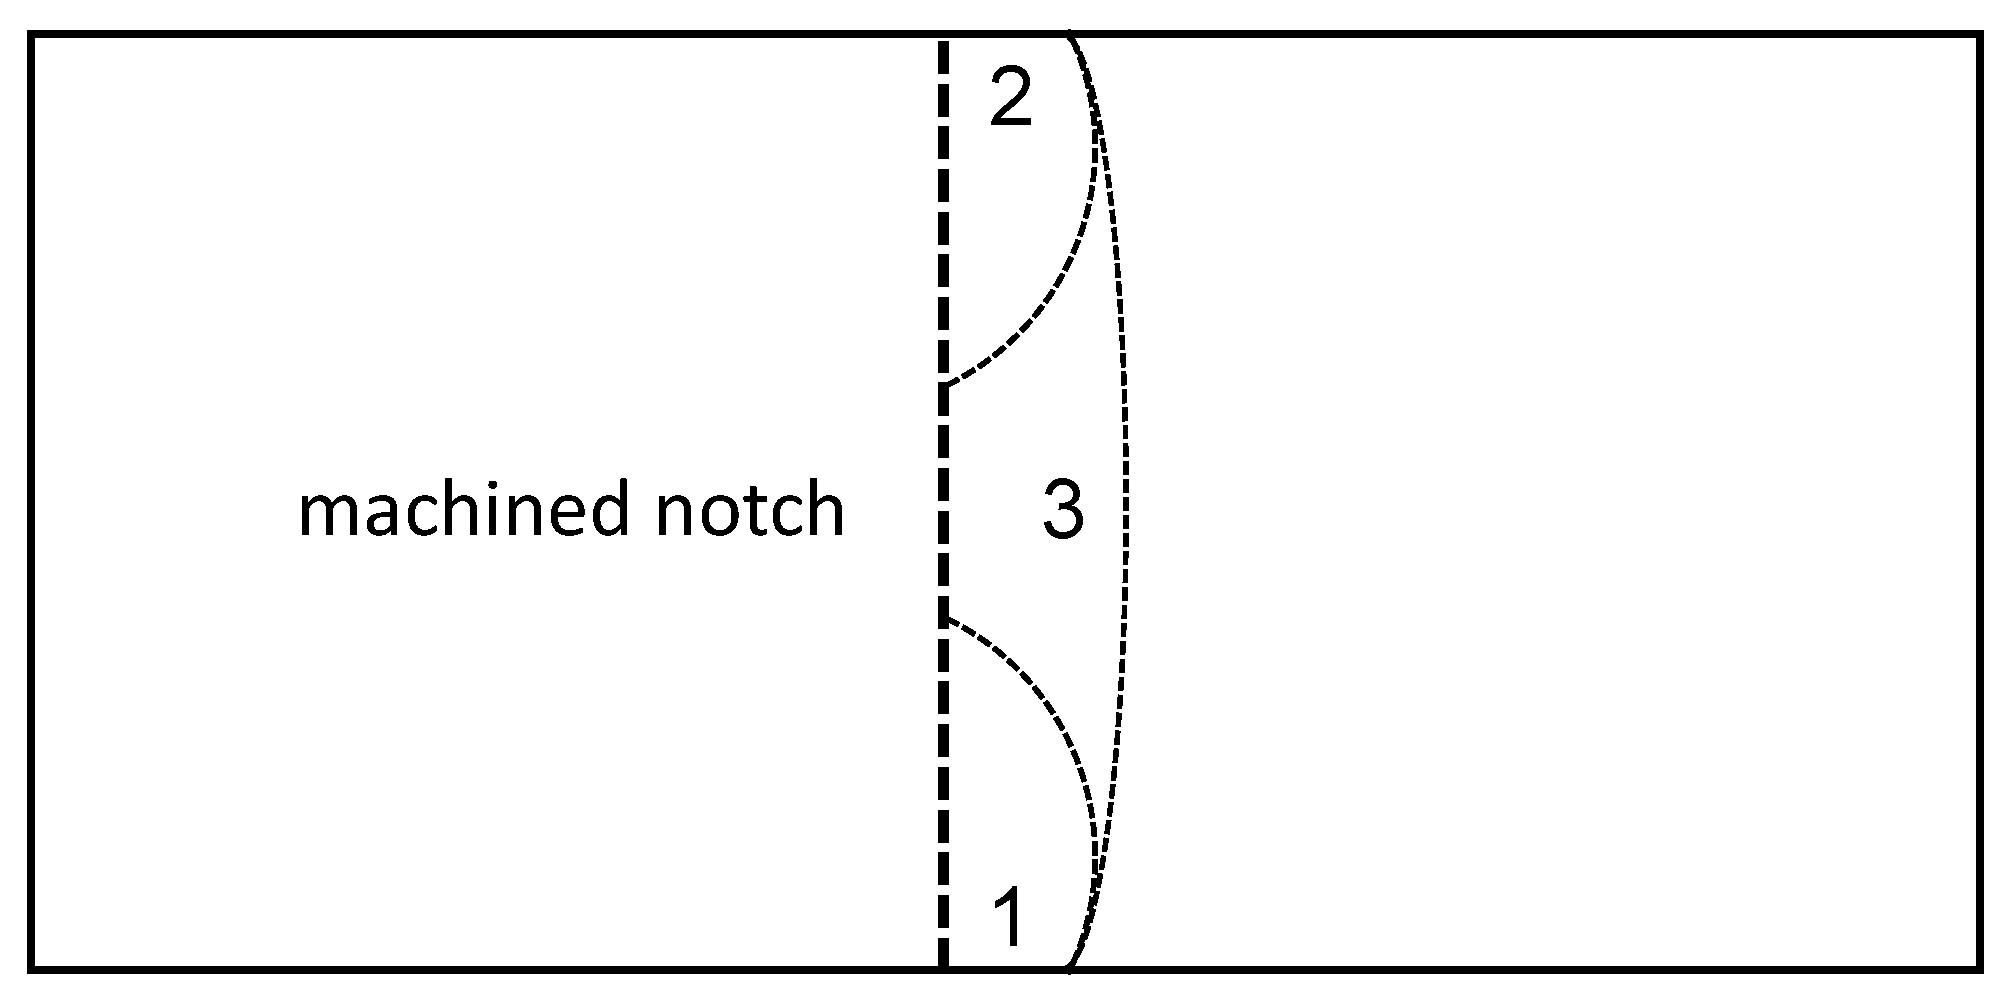
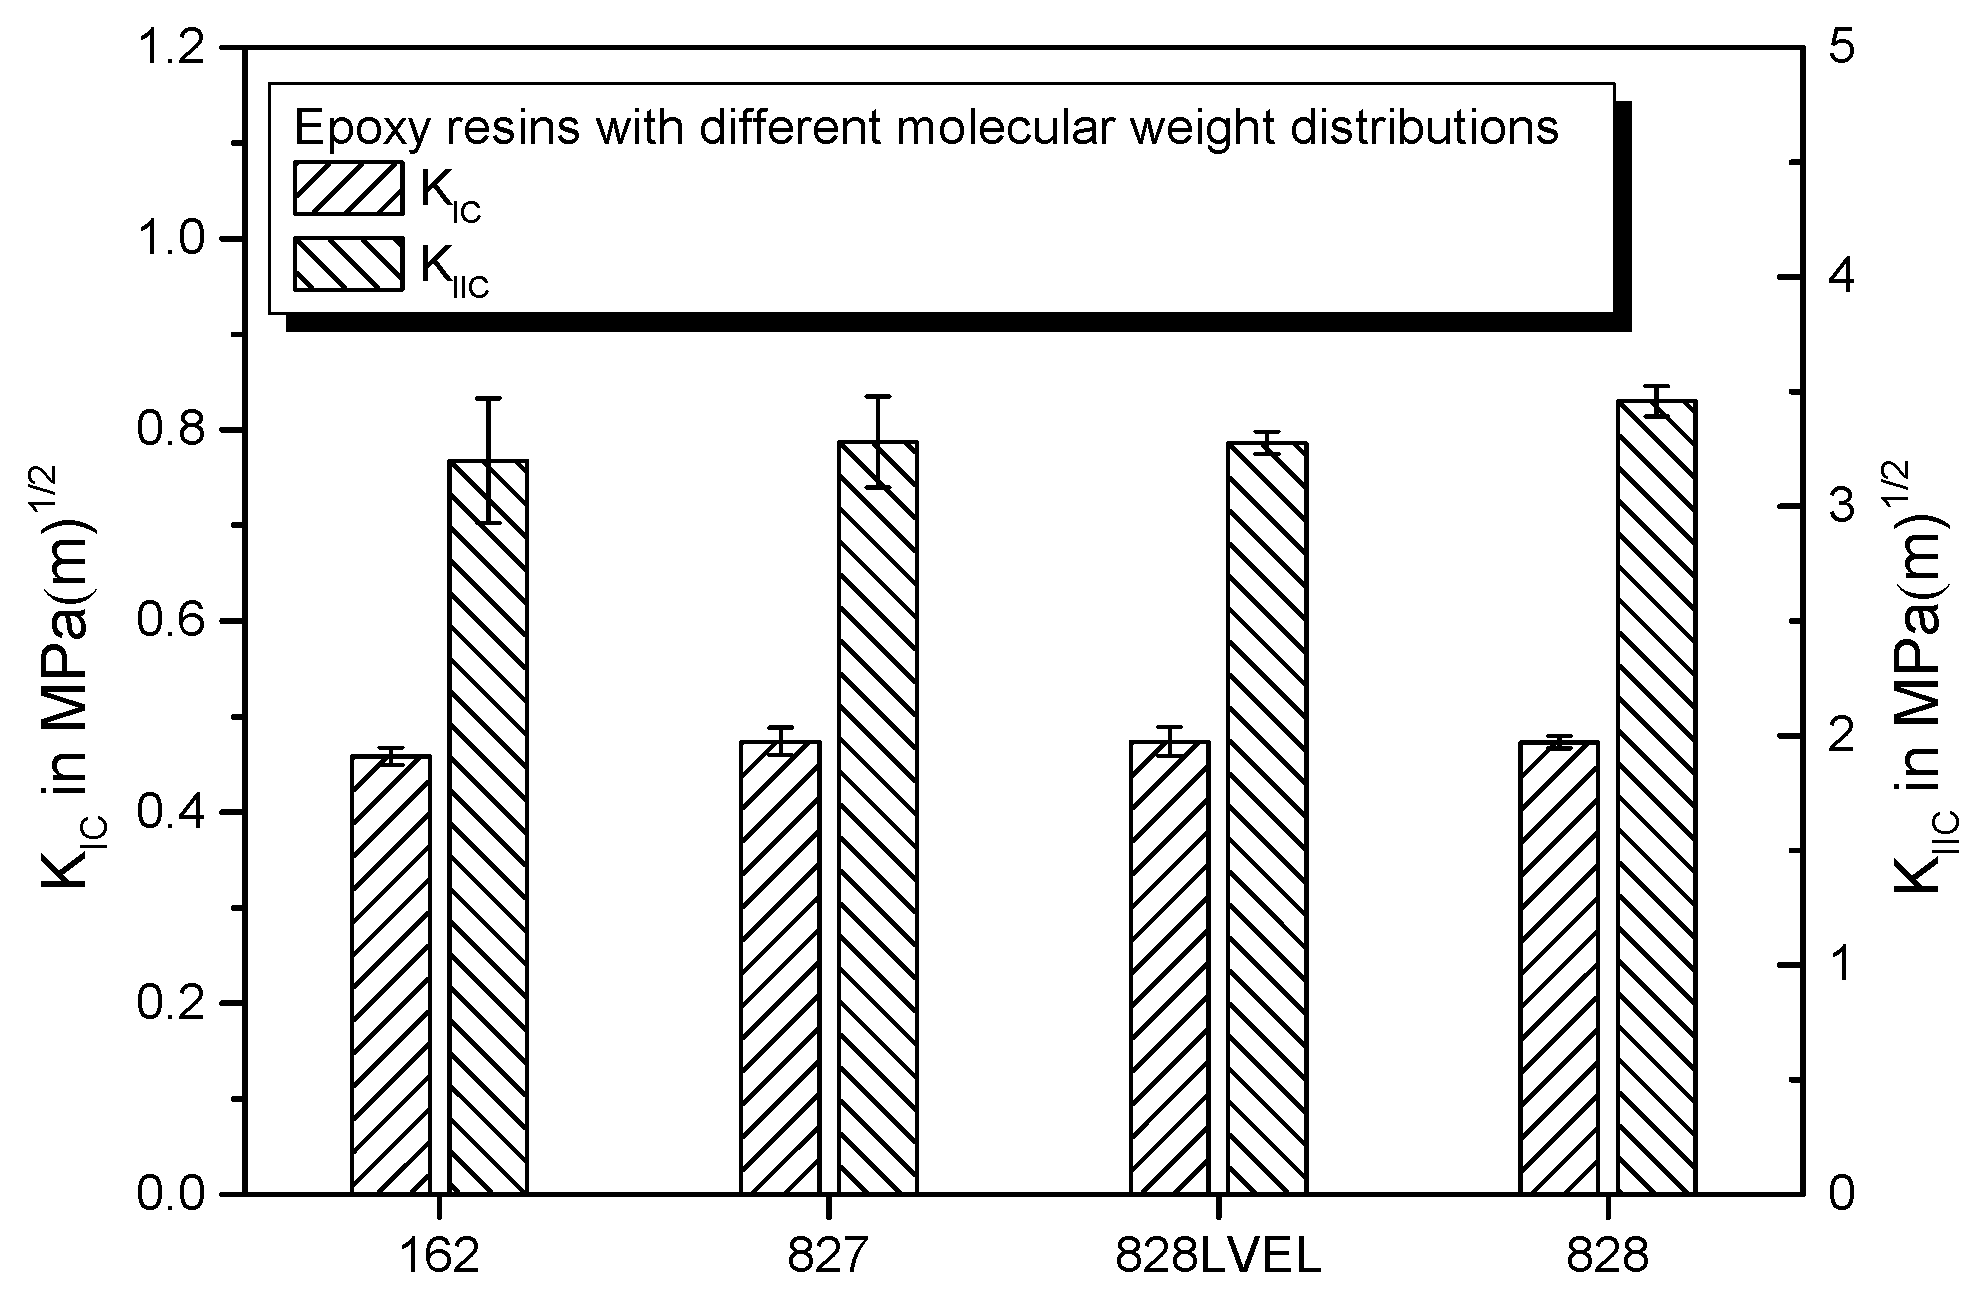
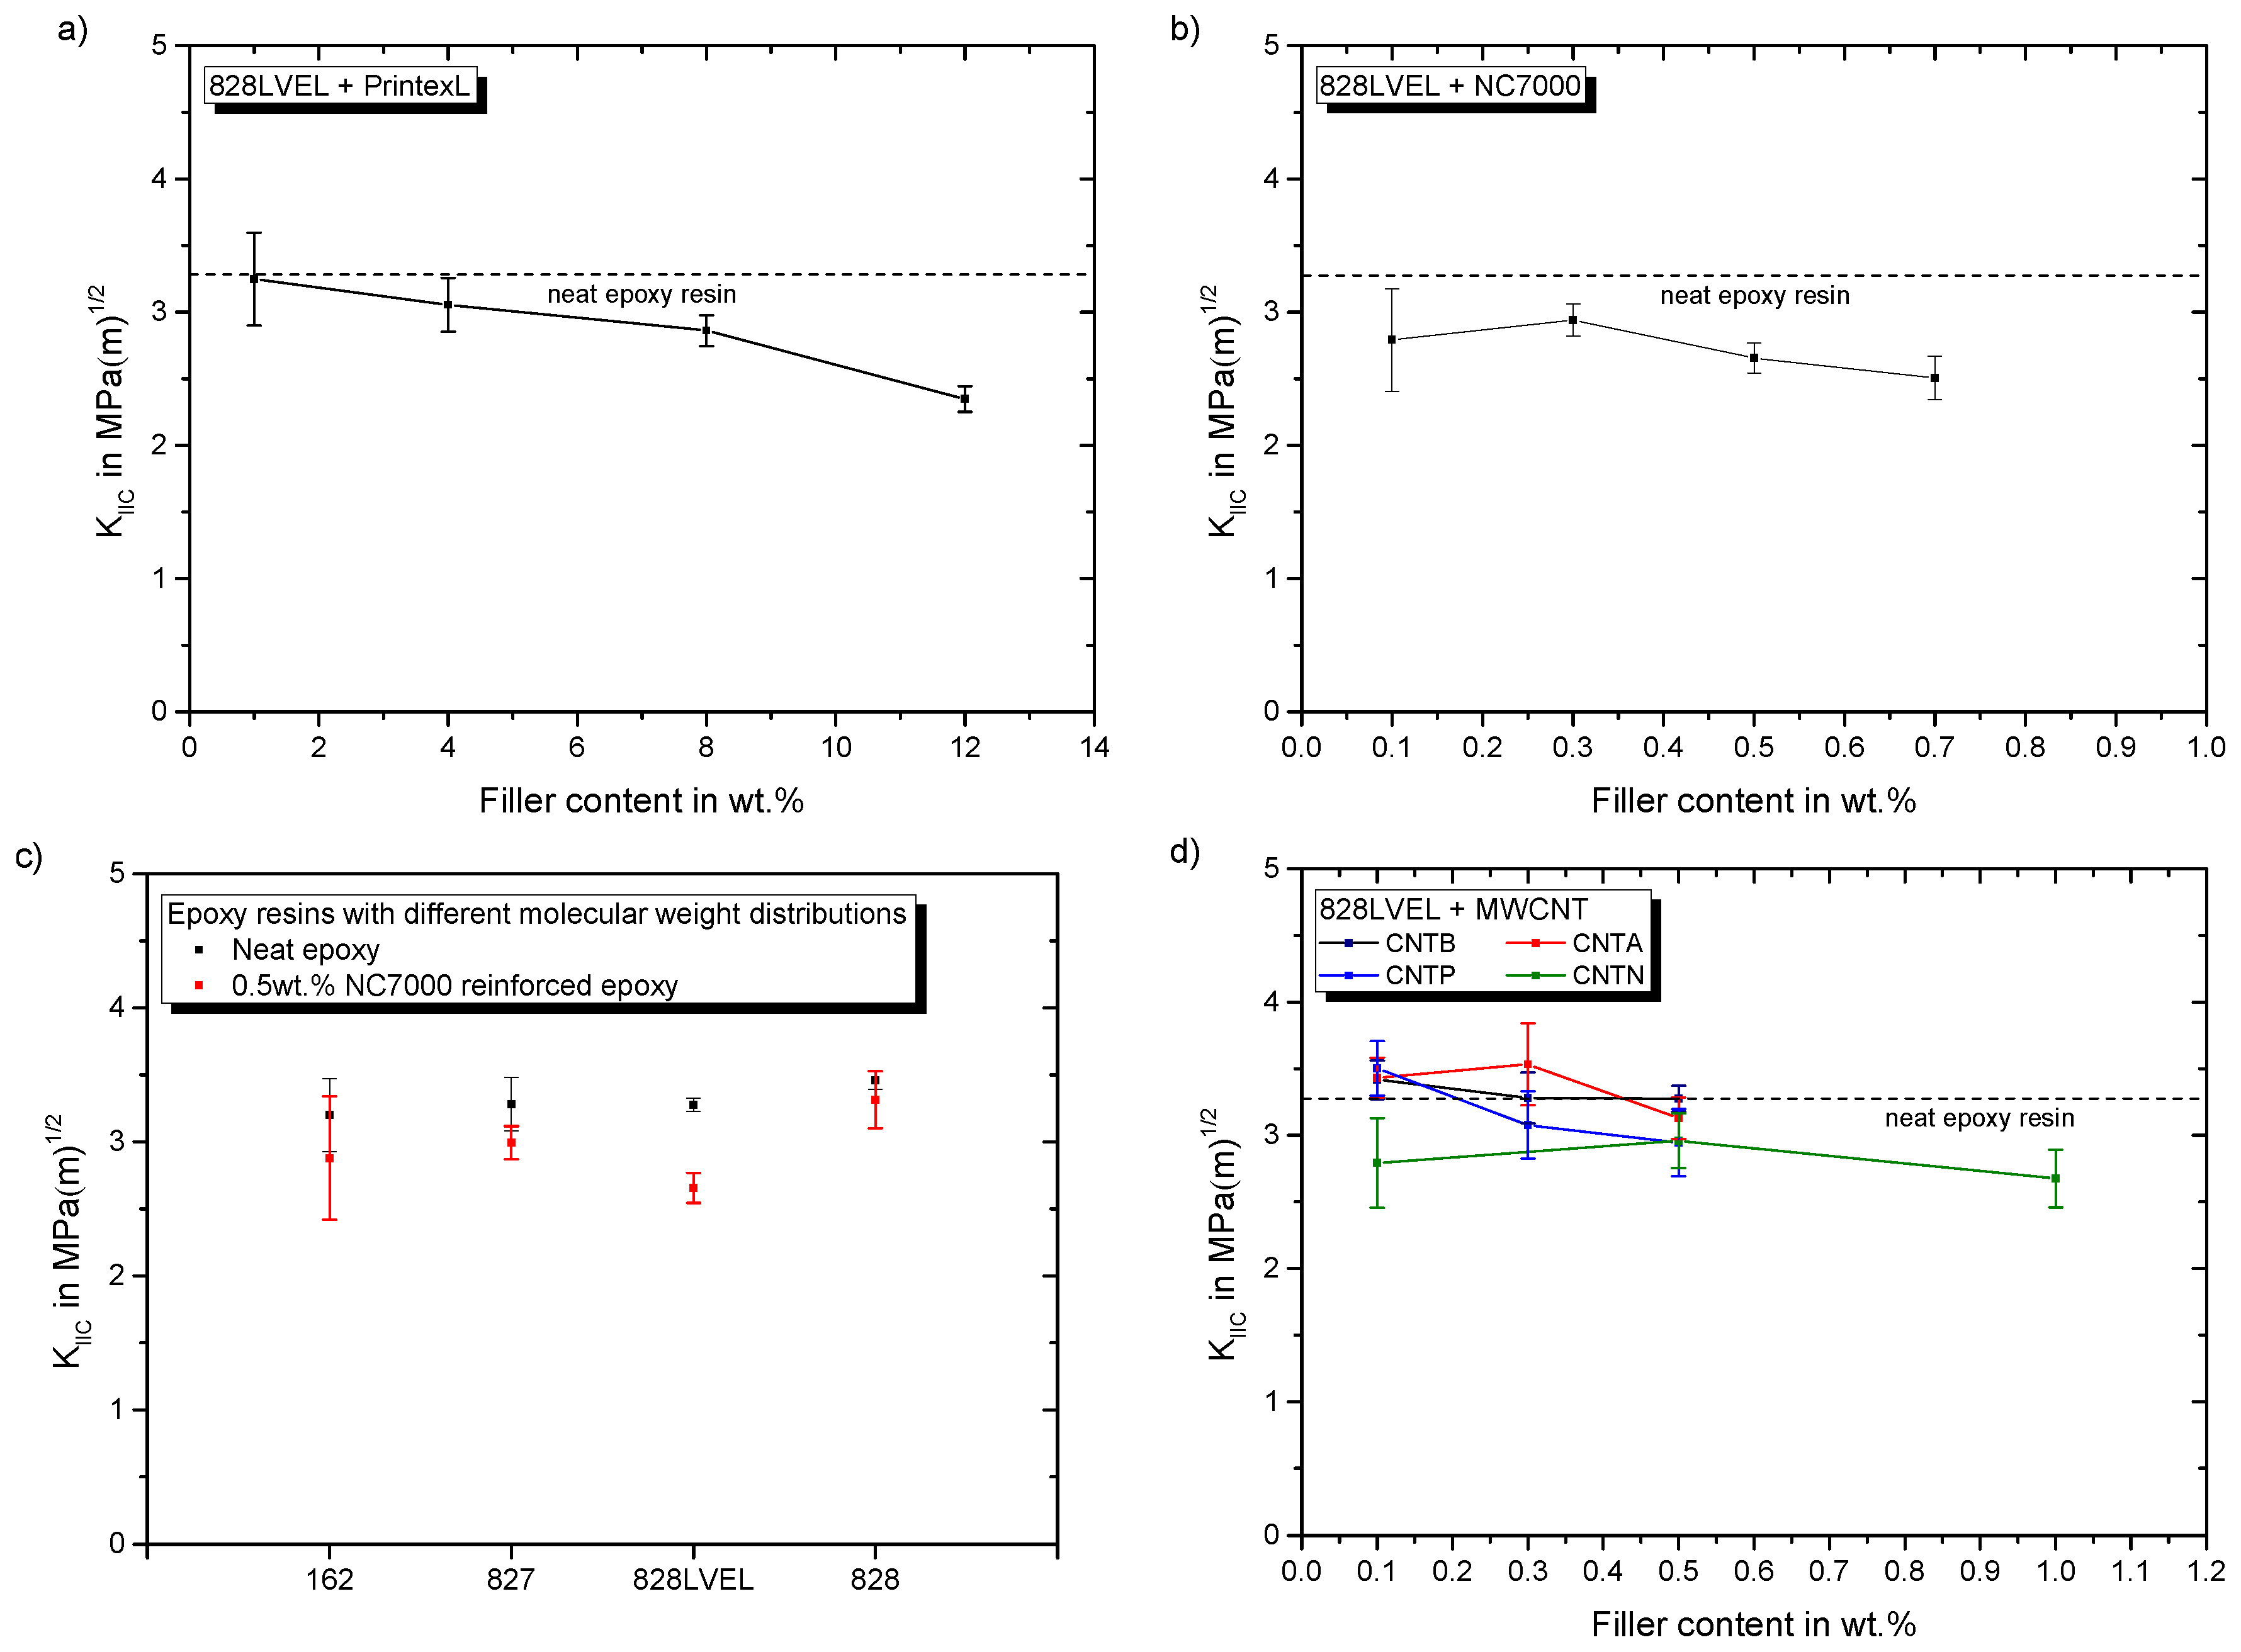
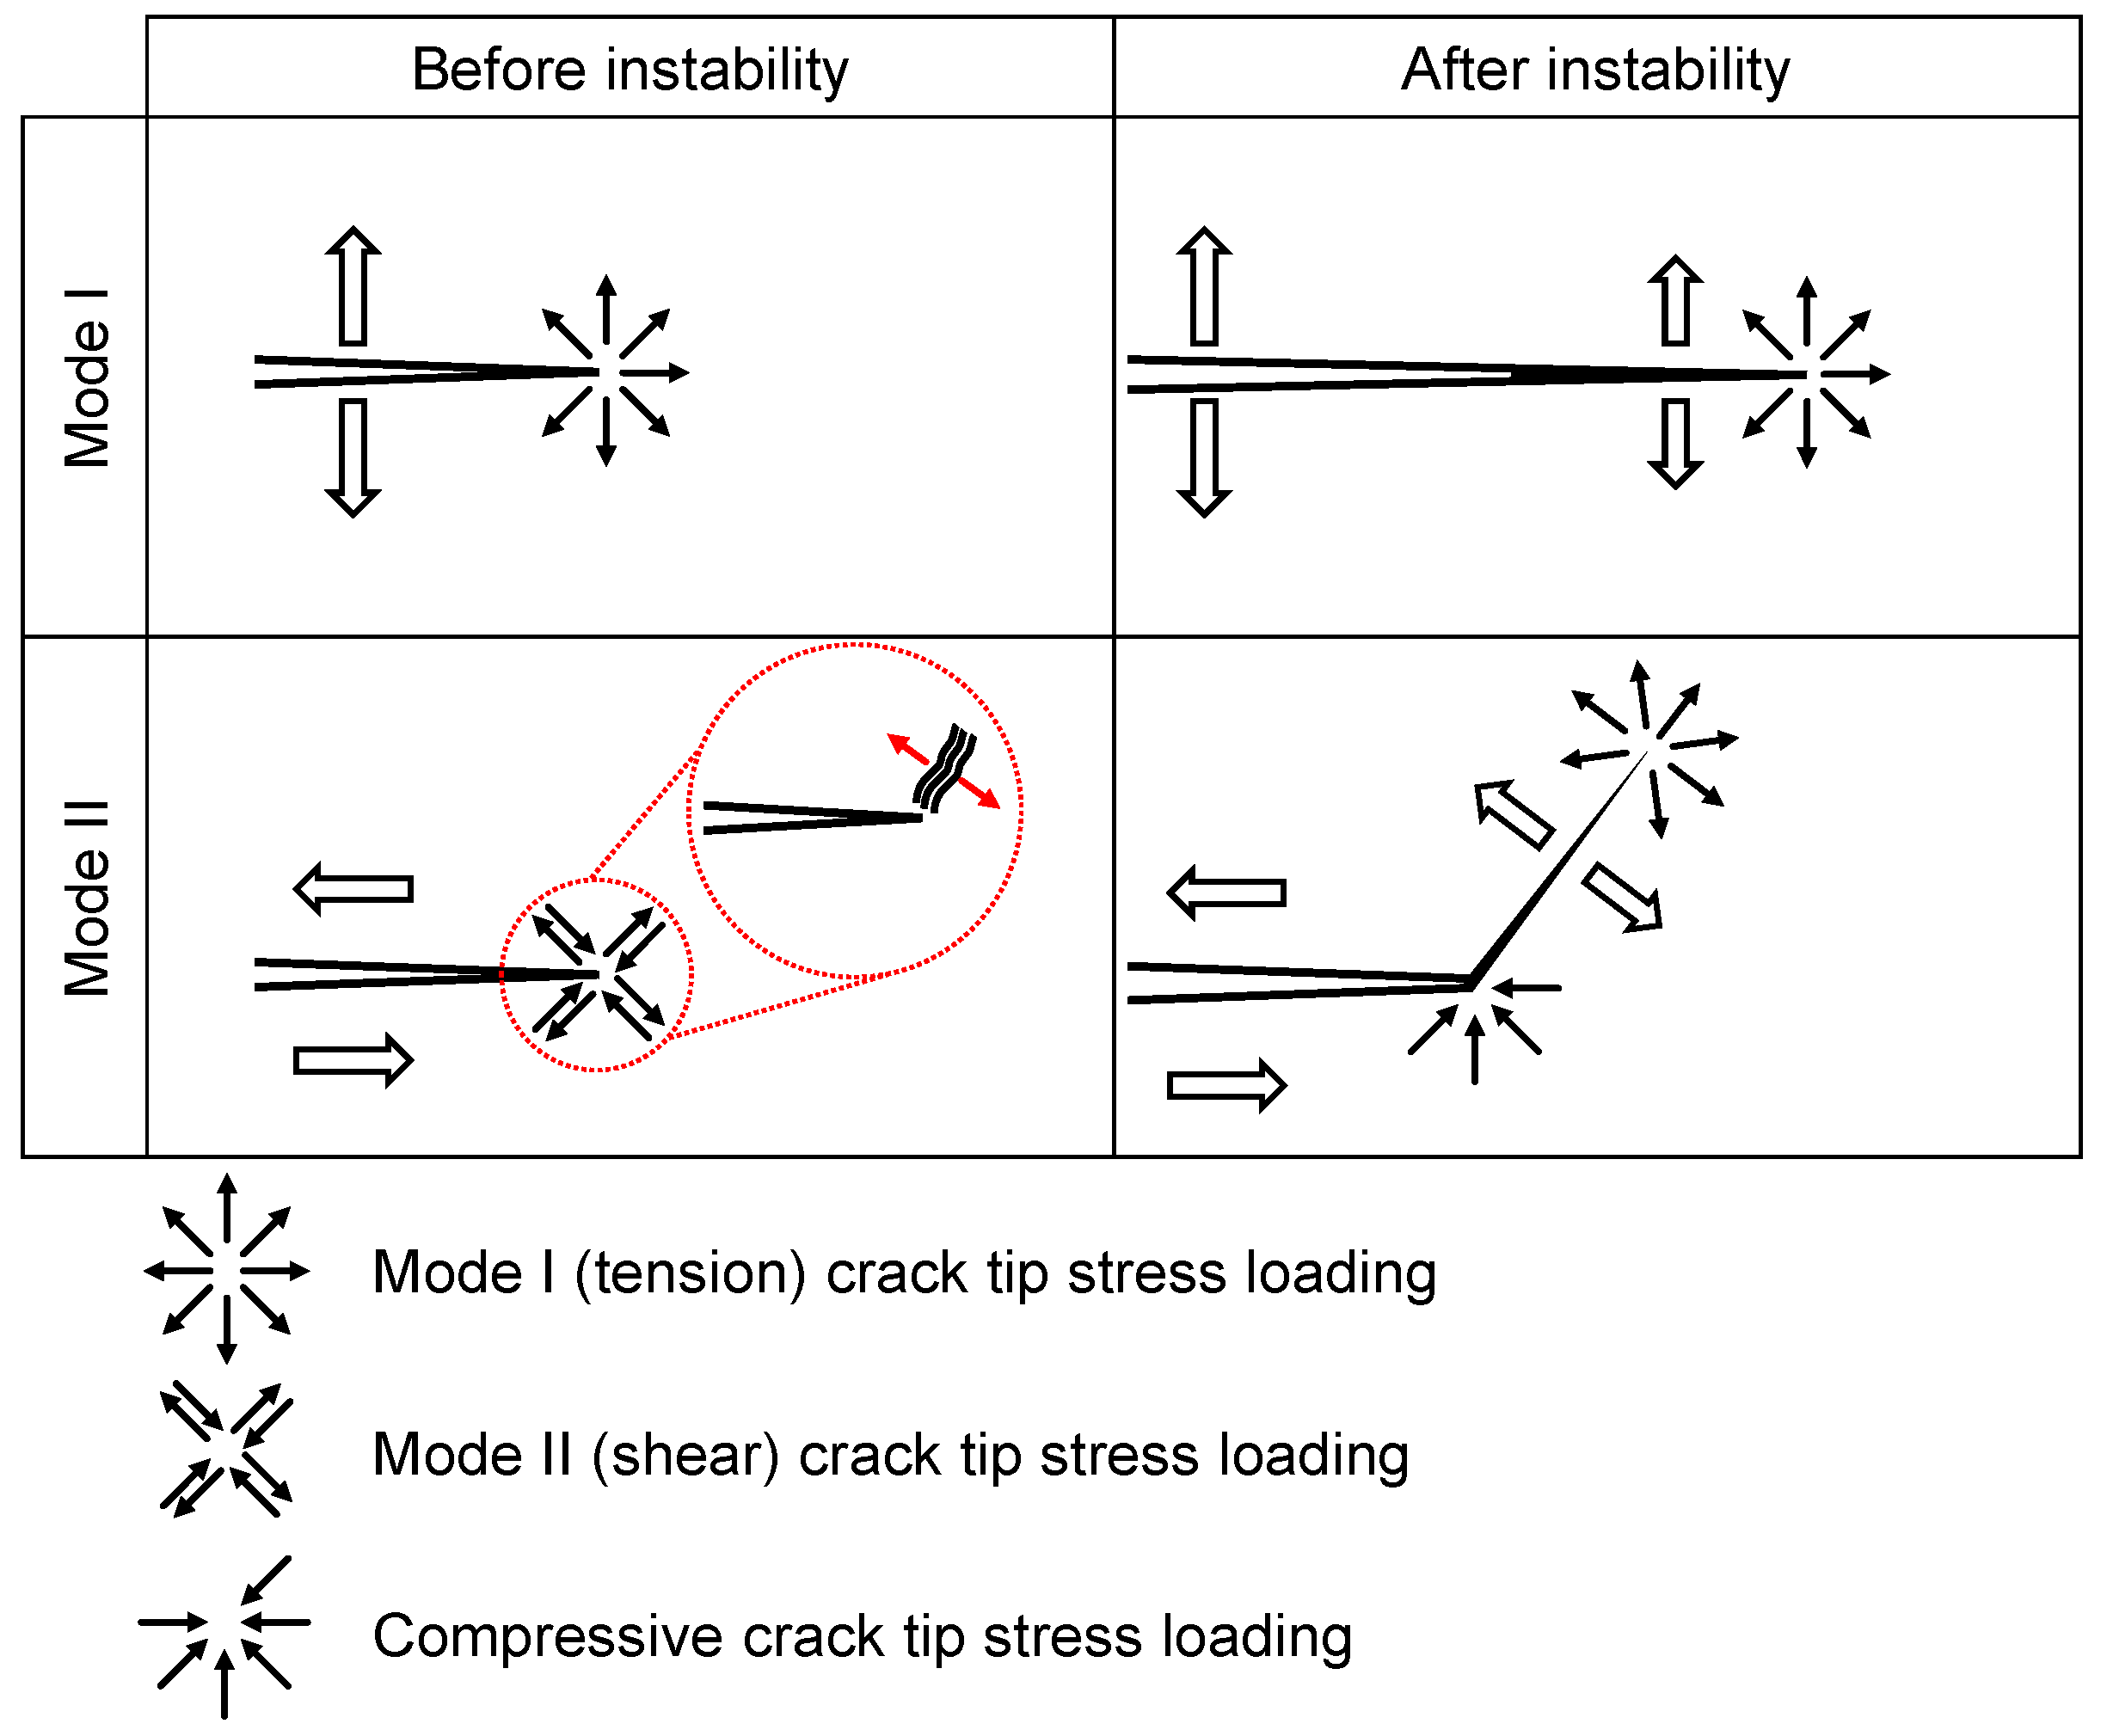
3.4.1. Mode I
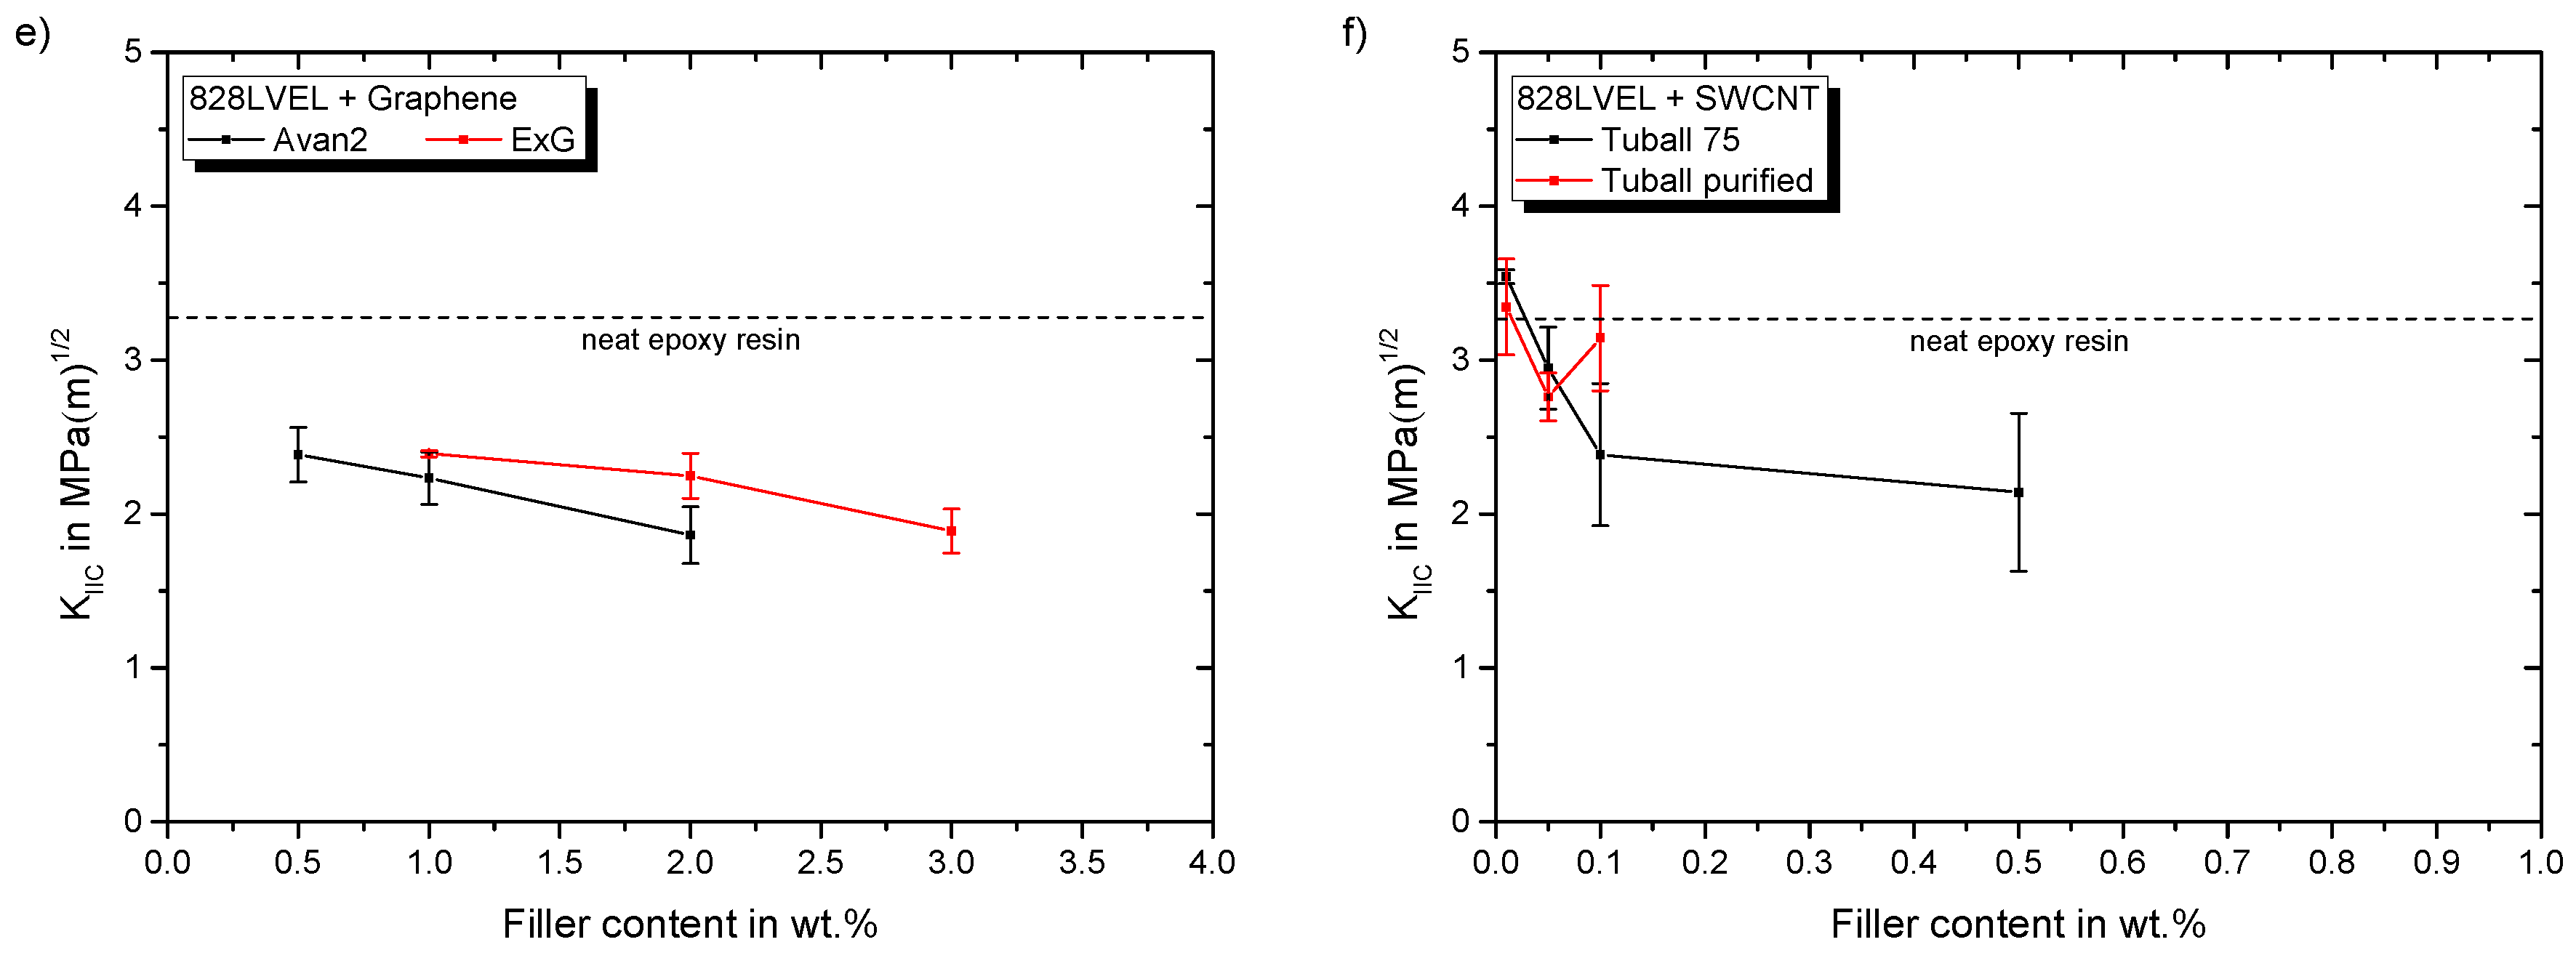
3.4.2. Mode II
4. Summary
5. Conclusions
Author Contributions
Funding
Acknowledgments
Conflicts of Interest
Abbreviations
| 3PBT | three-point bending test |
| 4PBT | four-point bending test |
| BET | Brunauer–Emmett–Teller theory |
| CB | carbon black |
| CNT | carbon nanotube |
| CNTA | argon plasma treated CNTB |
| CNTB | reference MWCNT |
| CNTN | CNTB equipped with elastomer side chains, which are amino-functionalized |
| CNTP | atmospheric plasma treated CNTB |
| ExG | electrochemically expanded graphite |
| FLG | few-layer graphene |
| MWCNT | multi-walled carbon nanotube |
| SEM | Scanning electron microscopy |
| SENB | single-edge notched bending |
| SWCNT | single-walled carbon nanotube |
| TEM | Transmission electron microscopy |
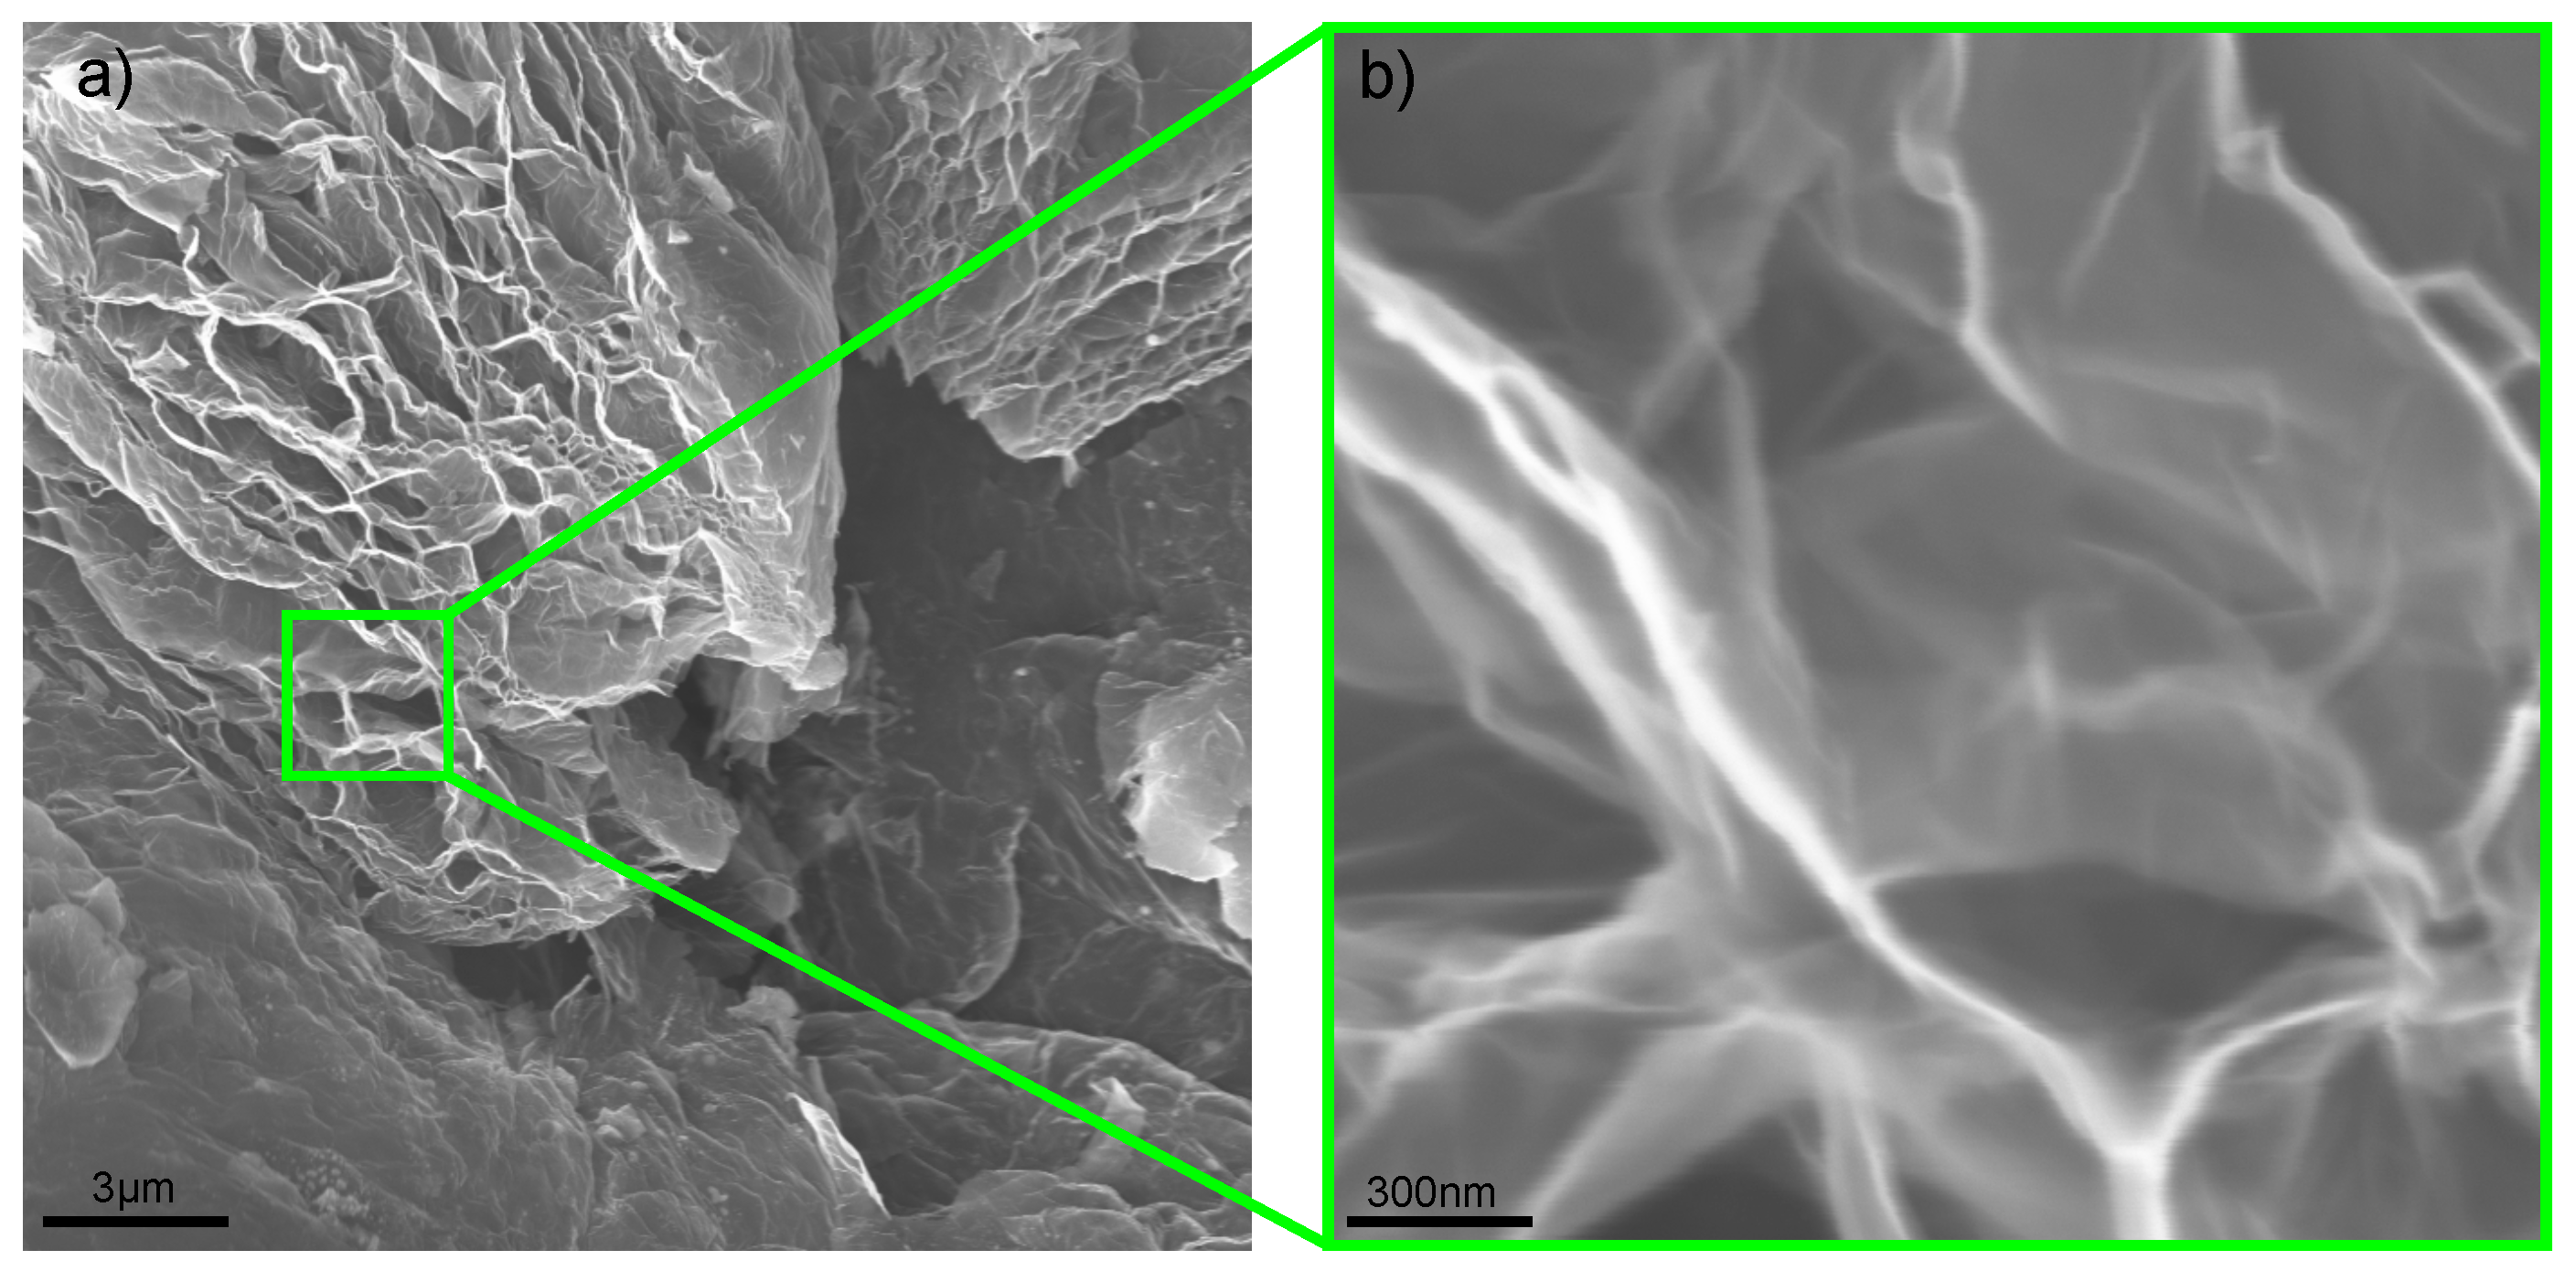
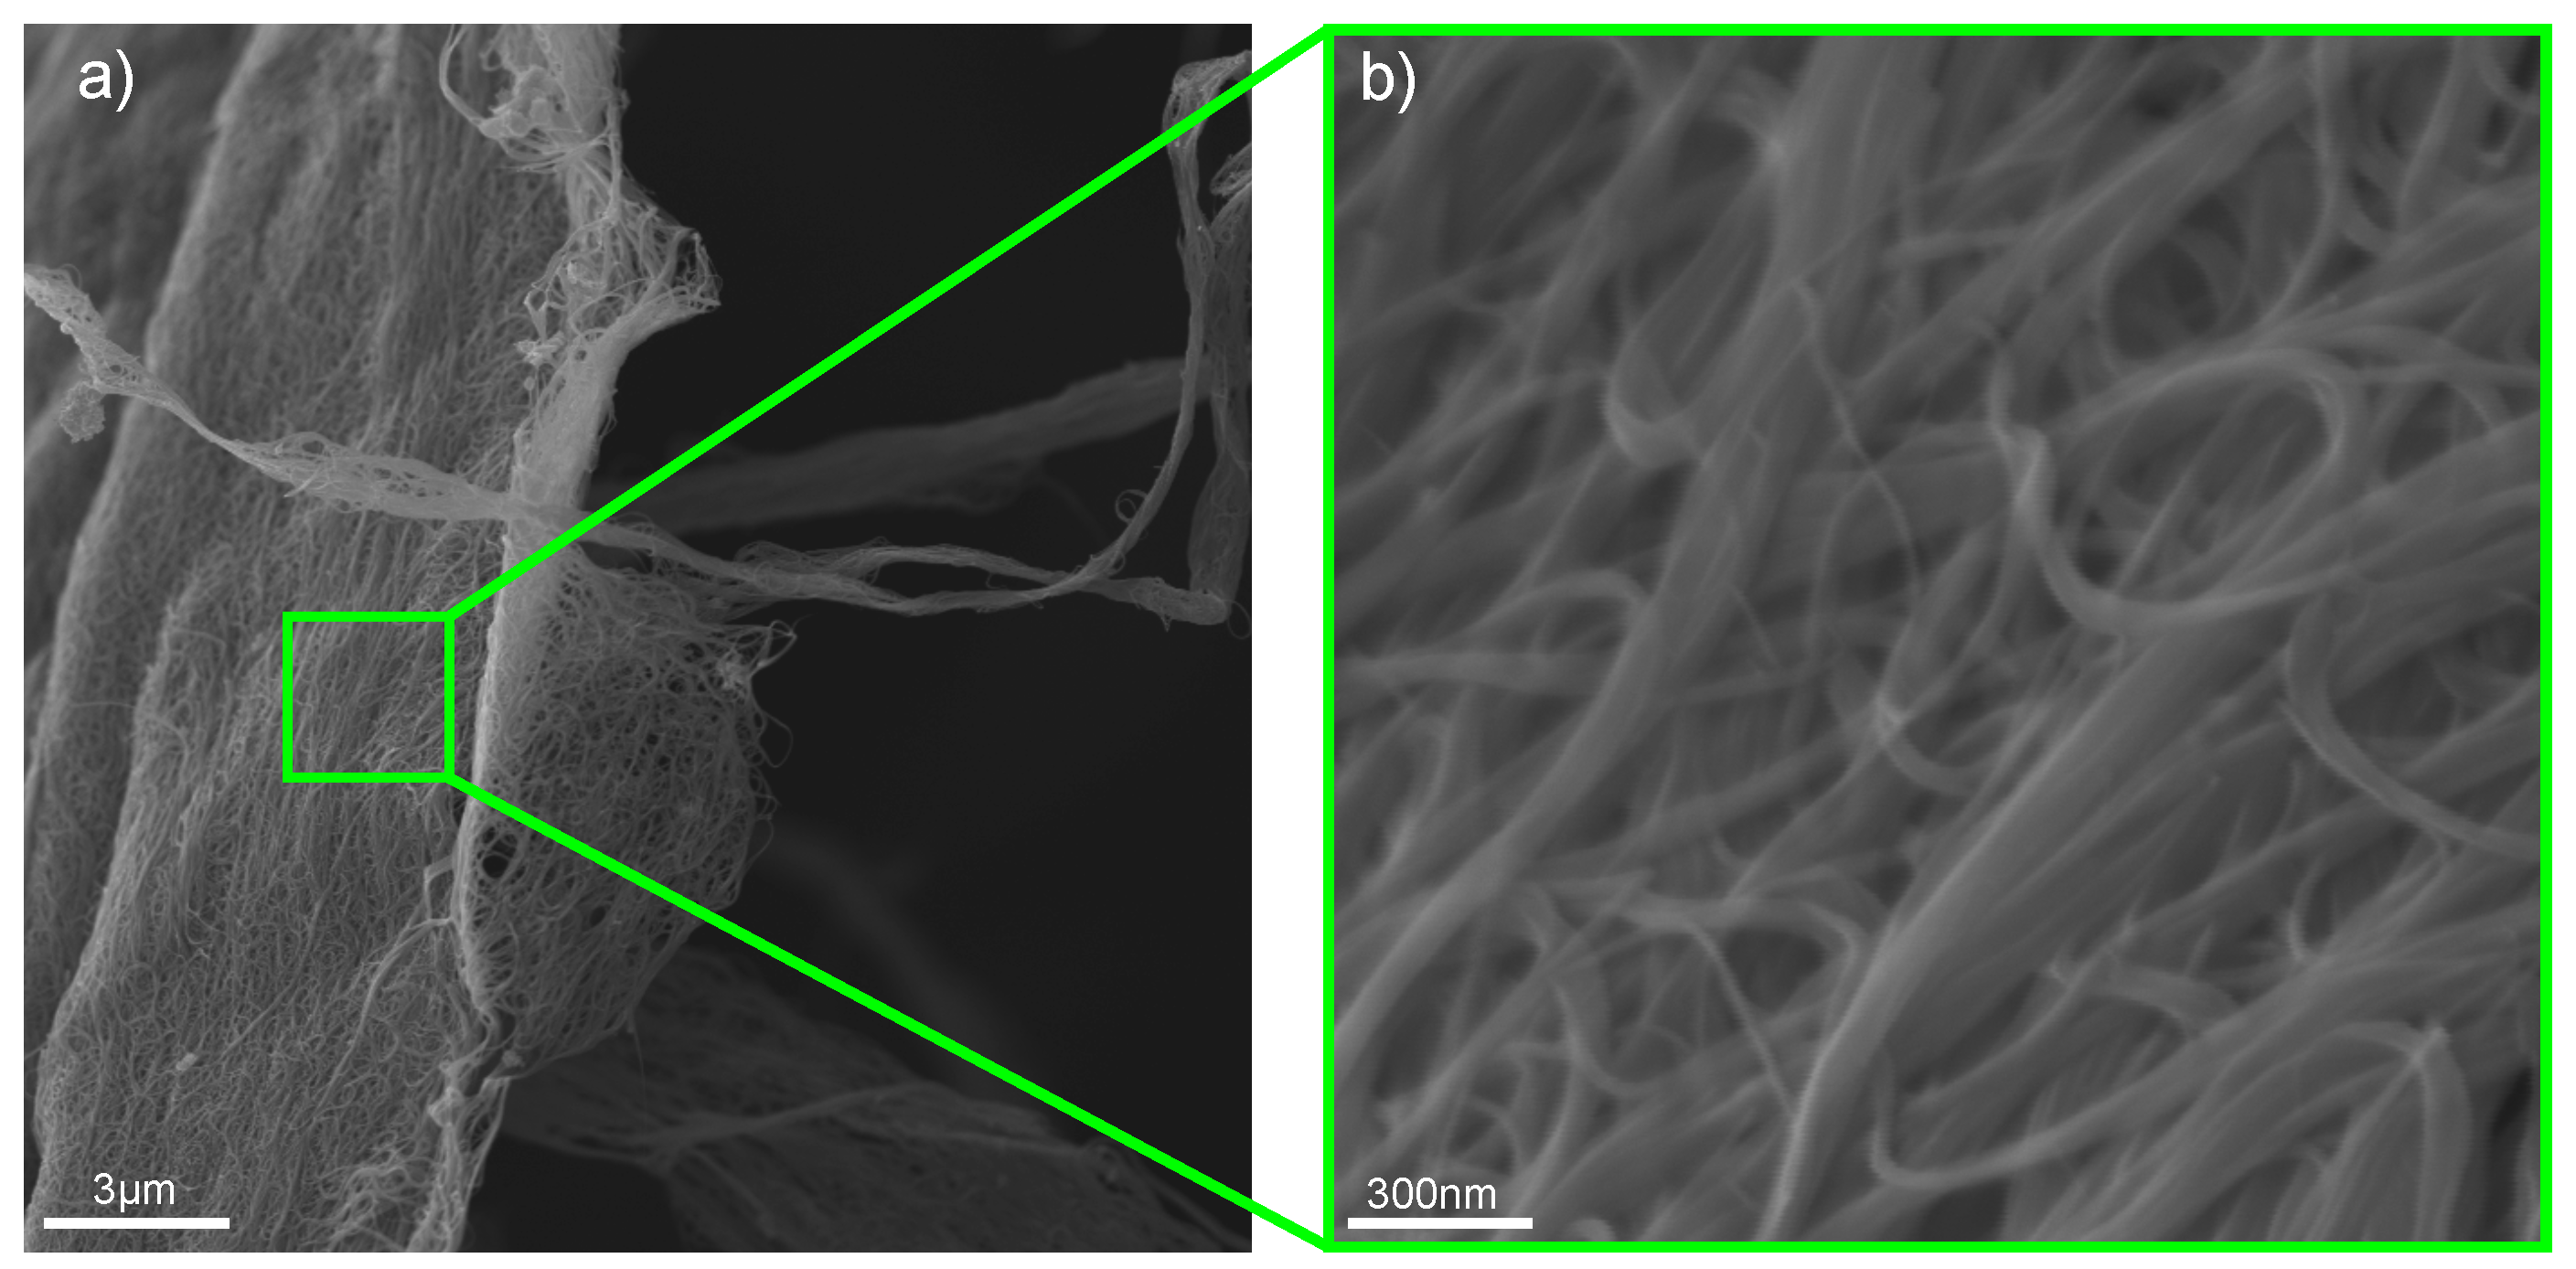
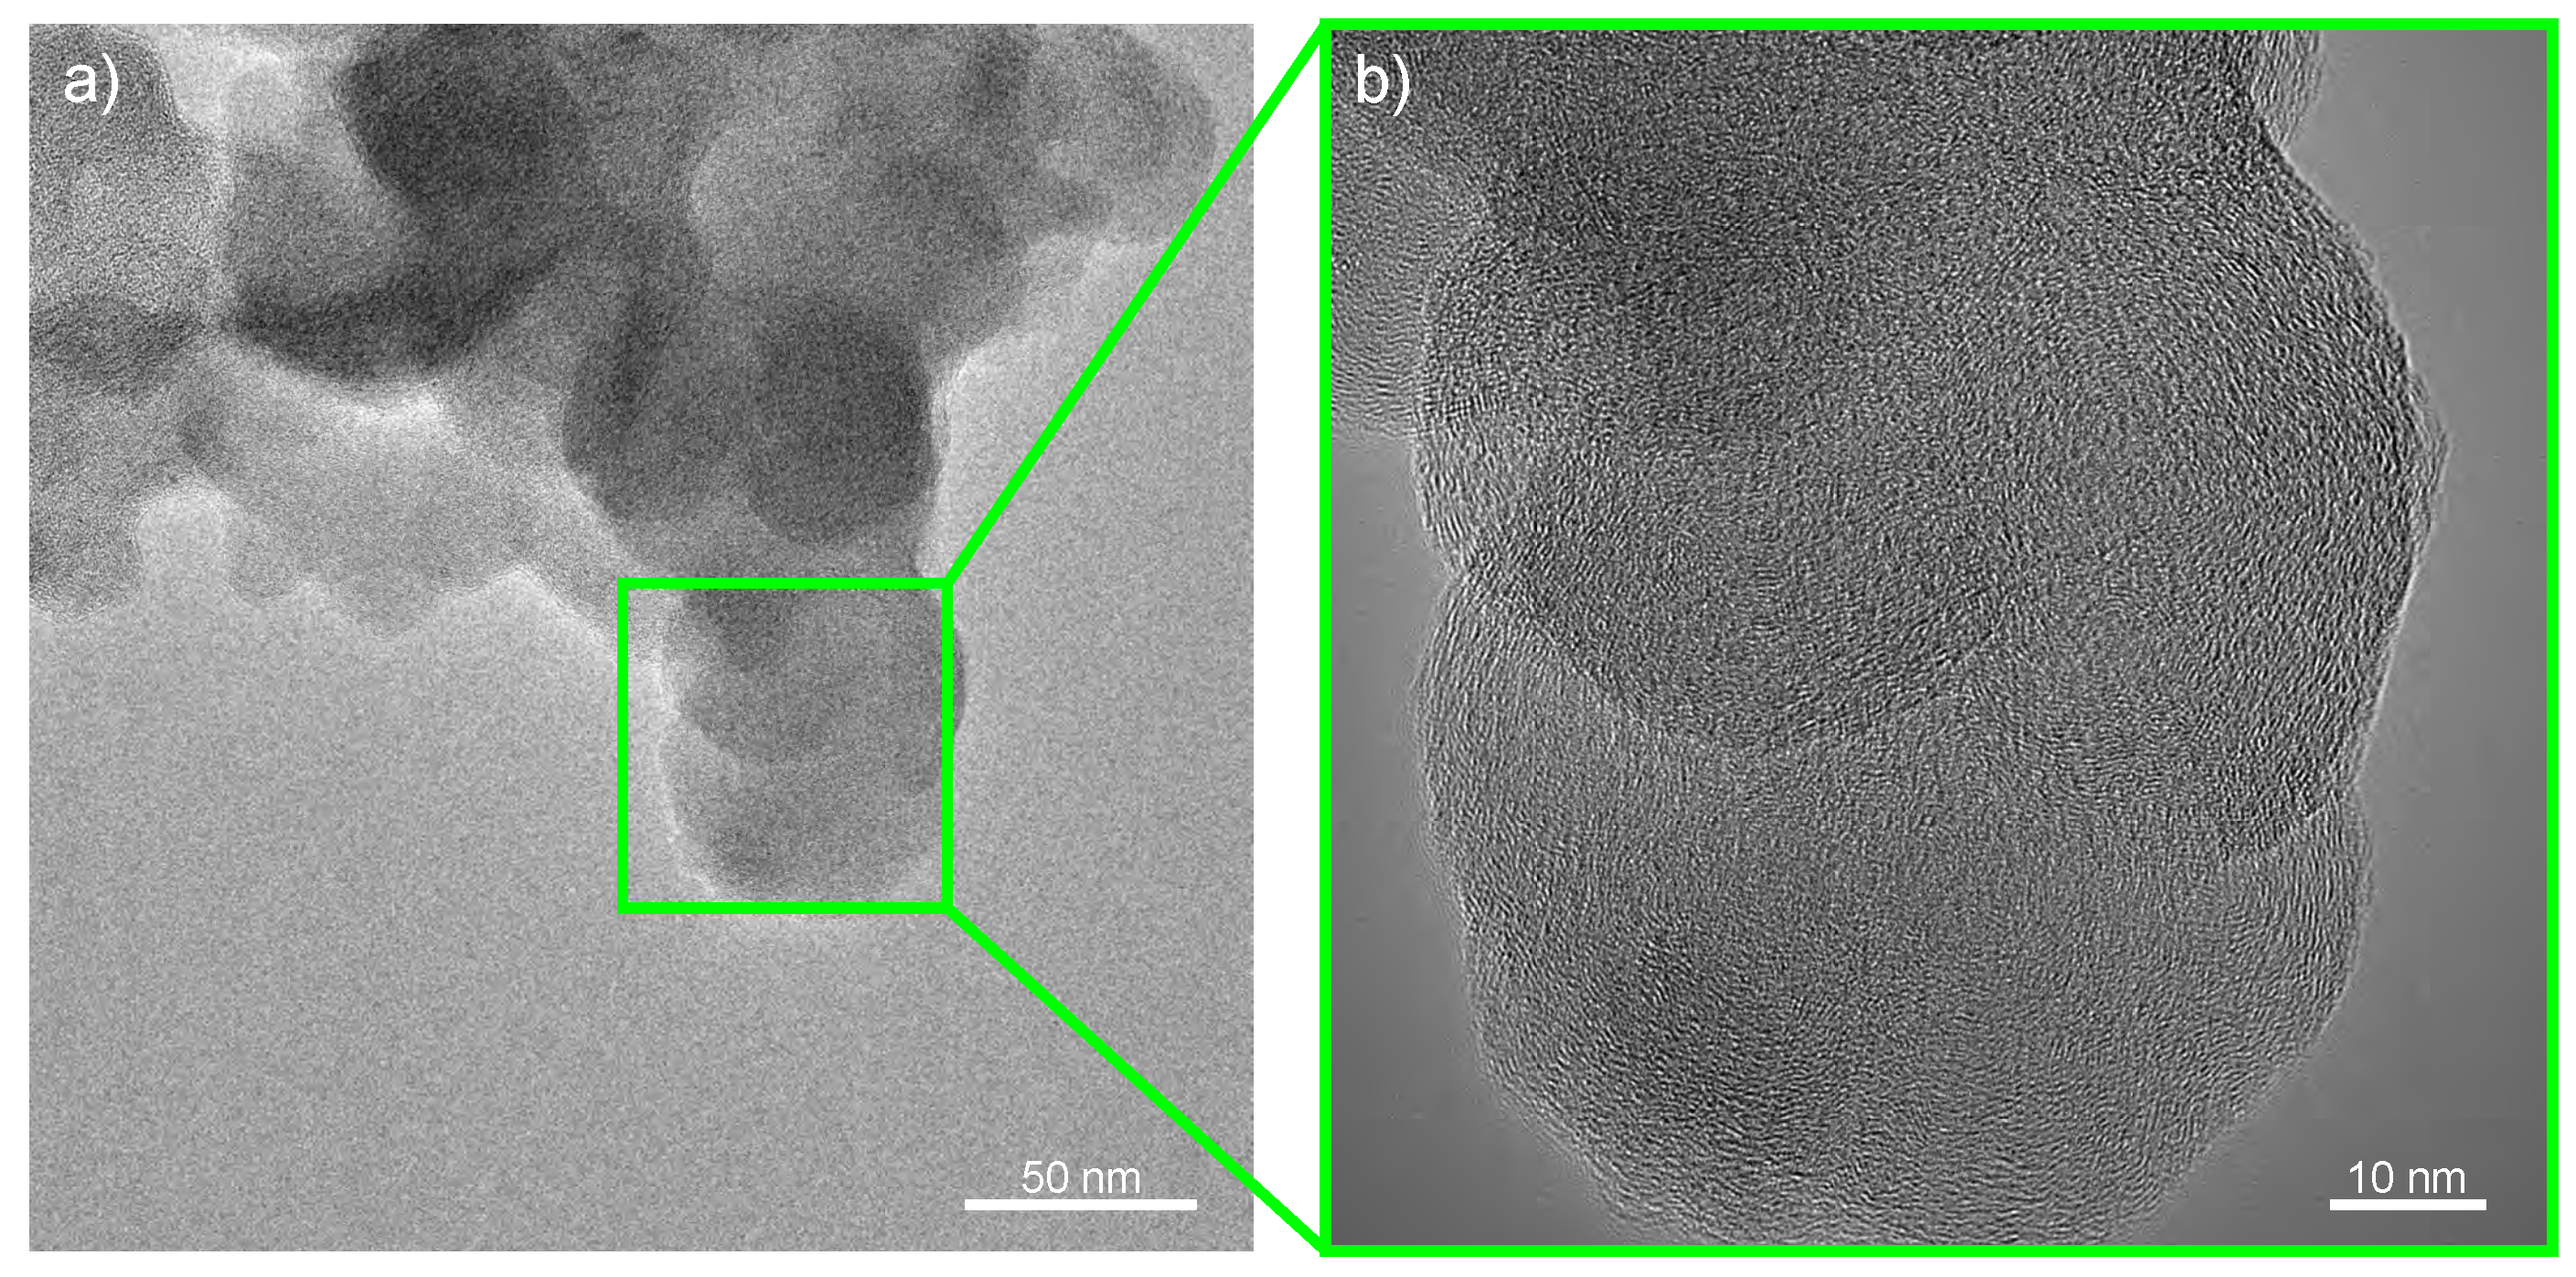
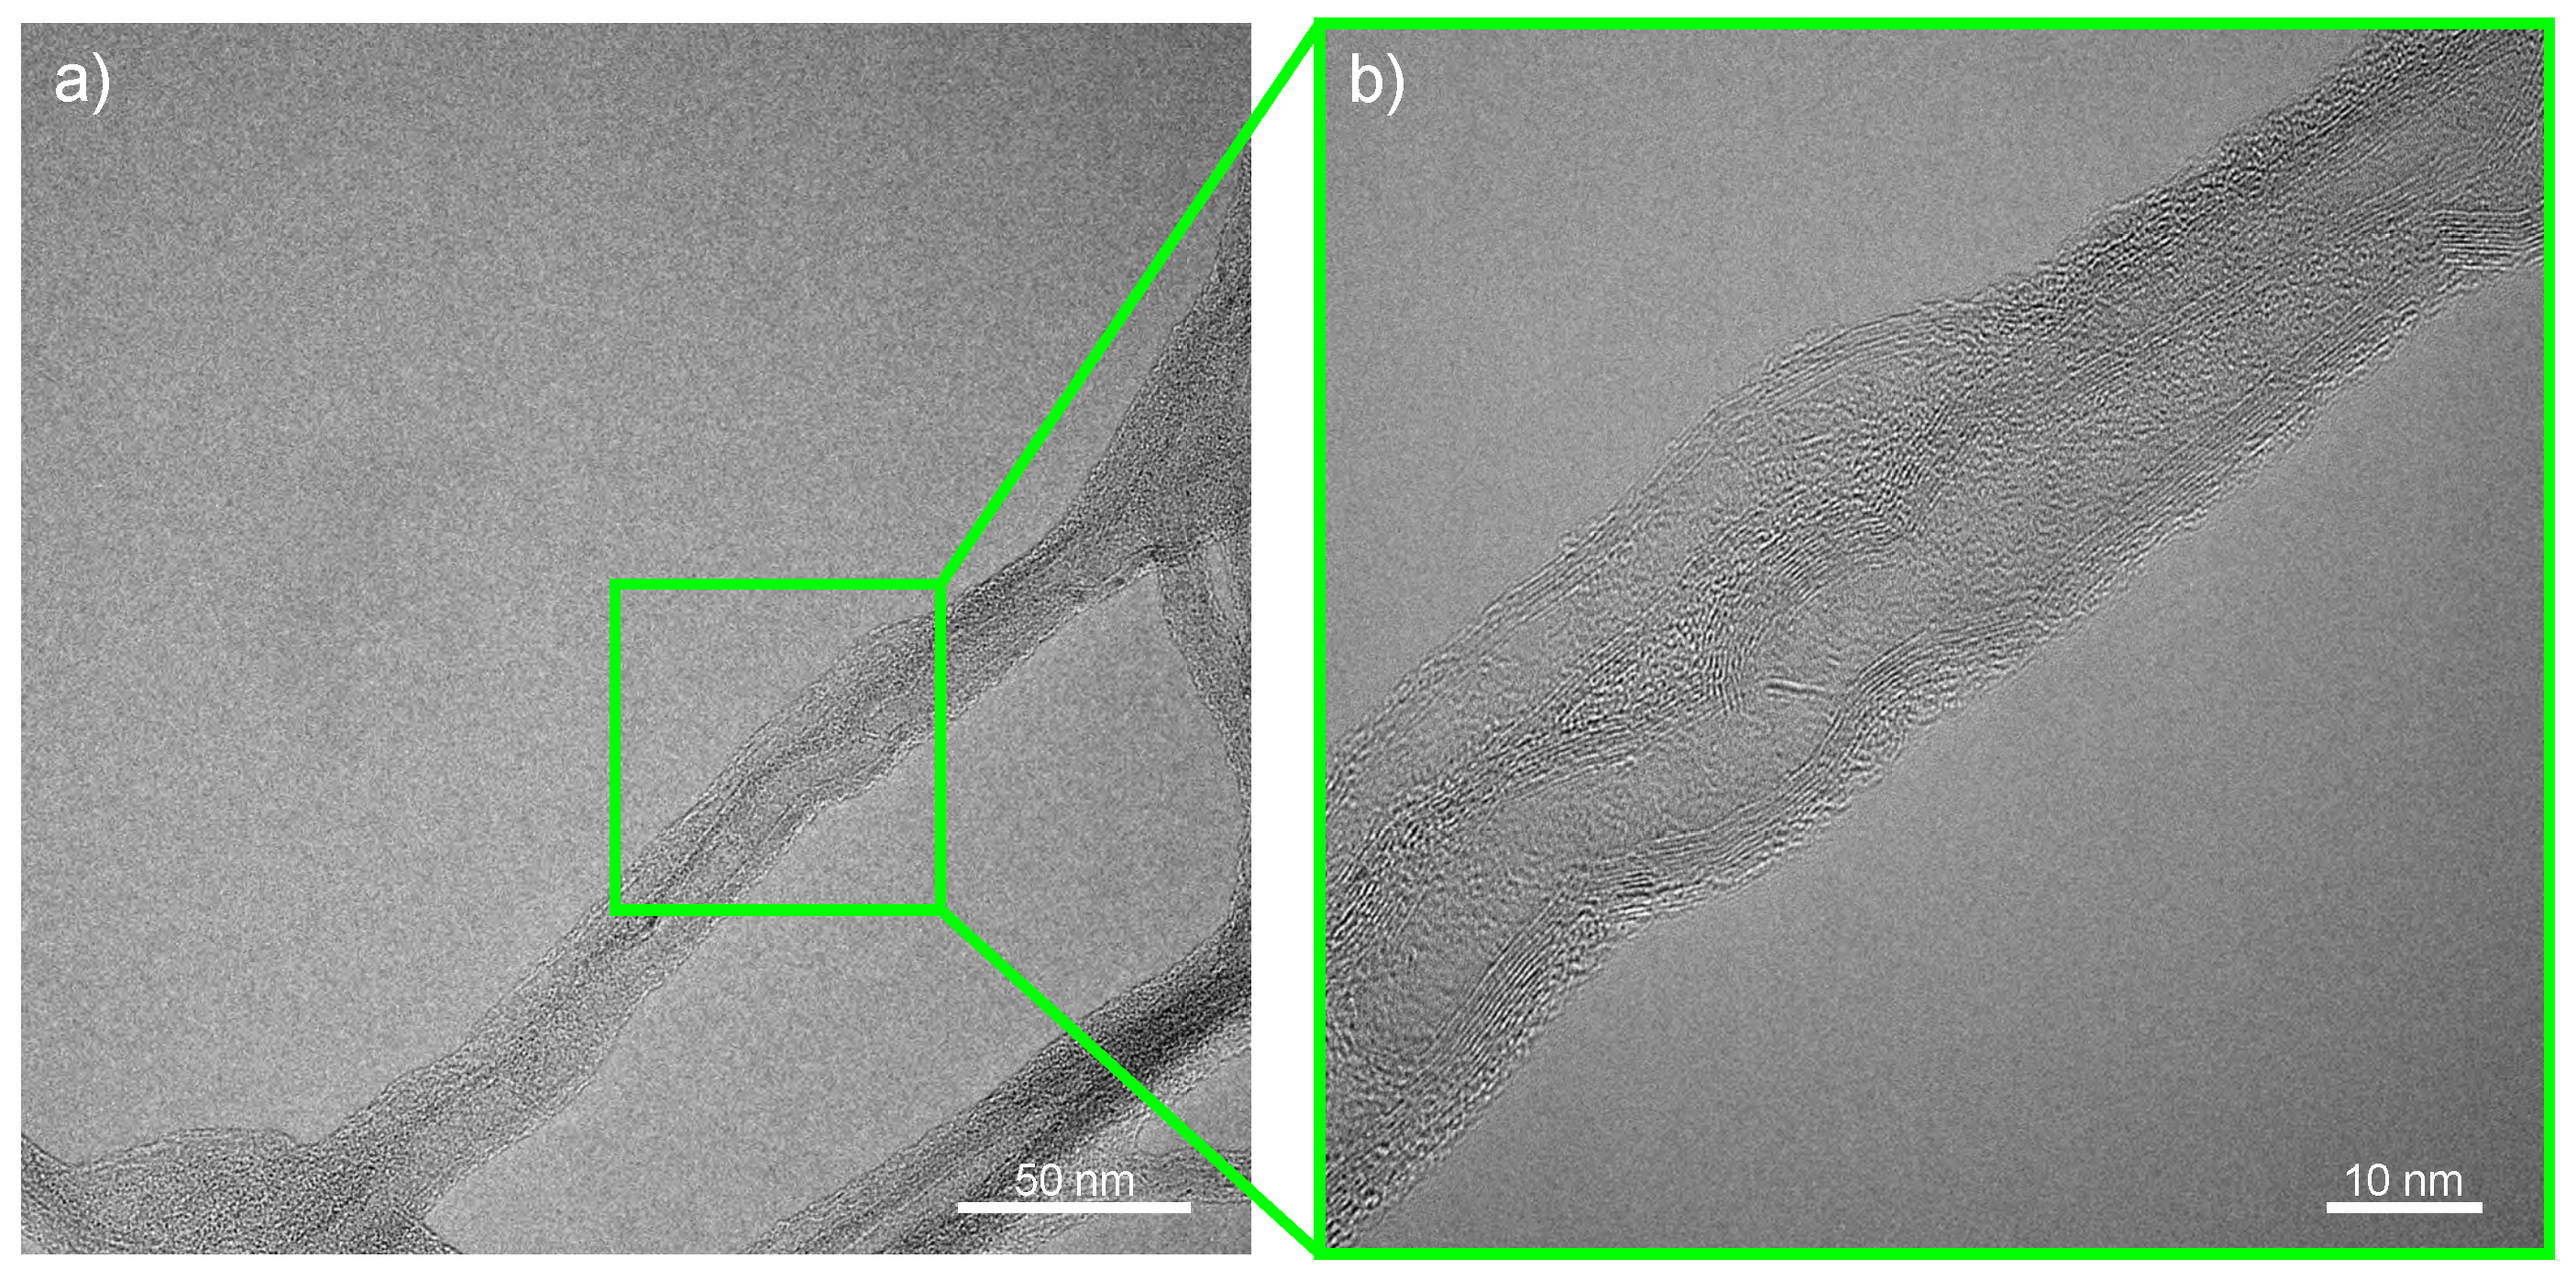
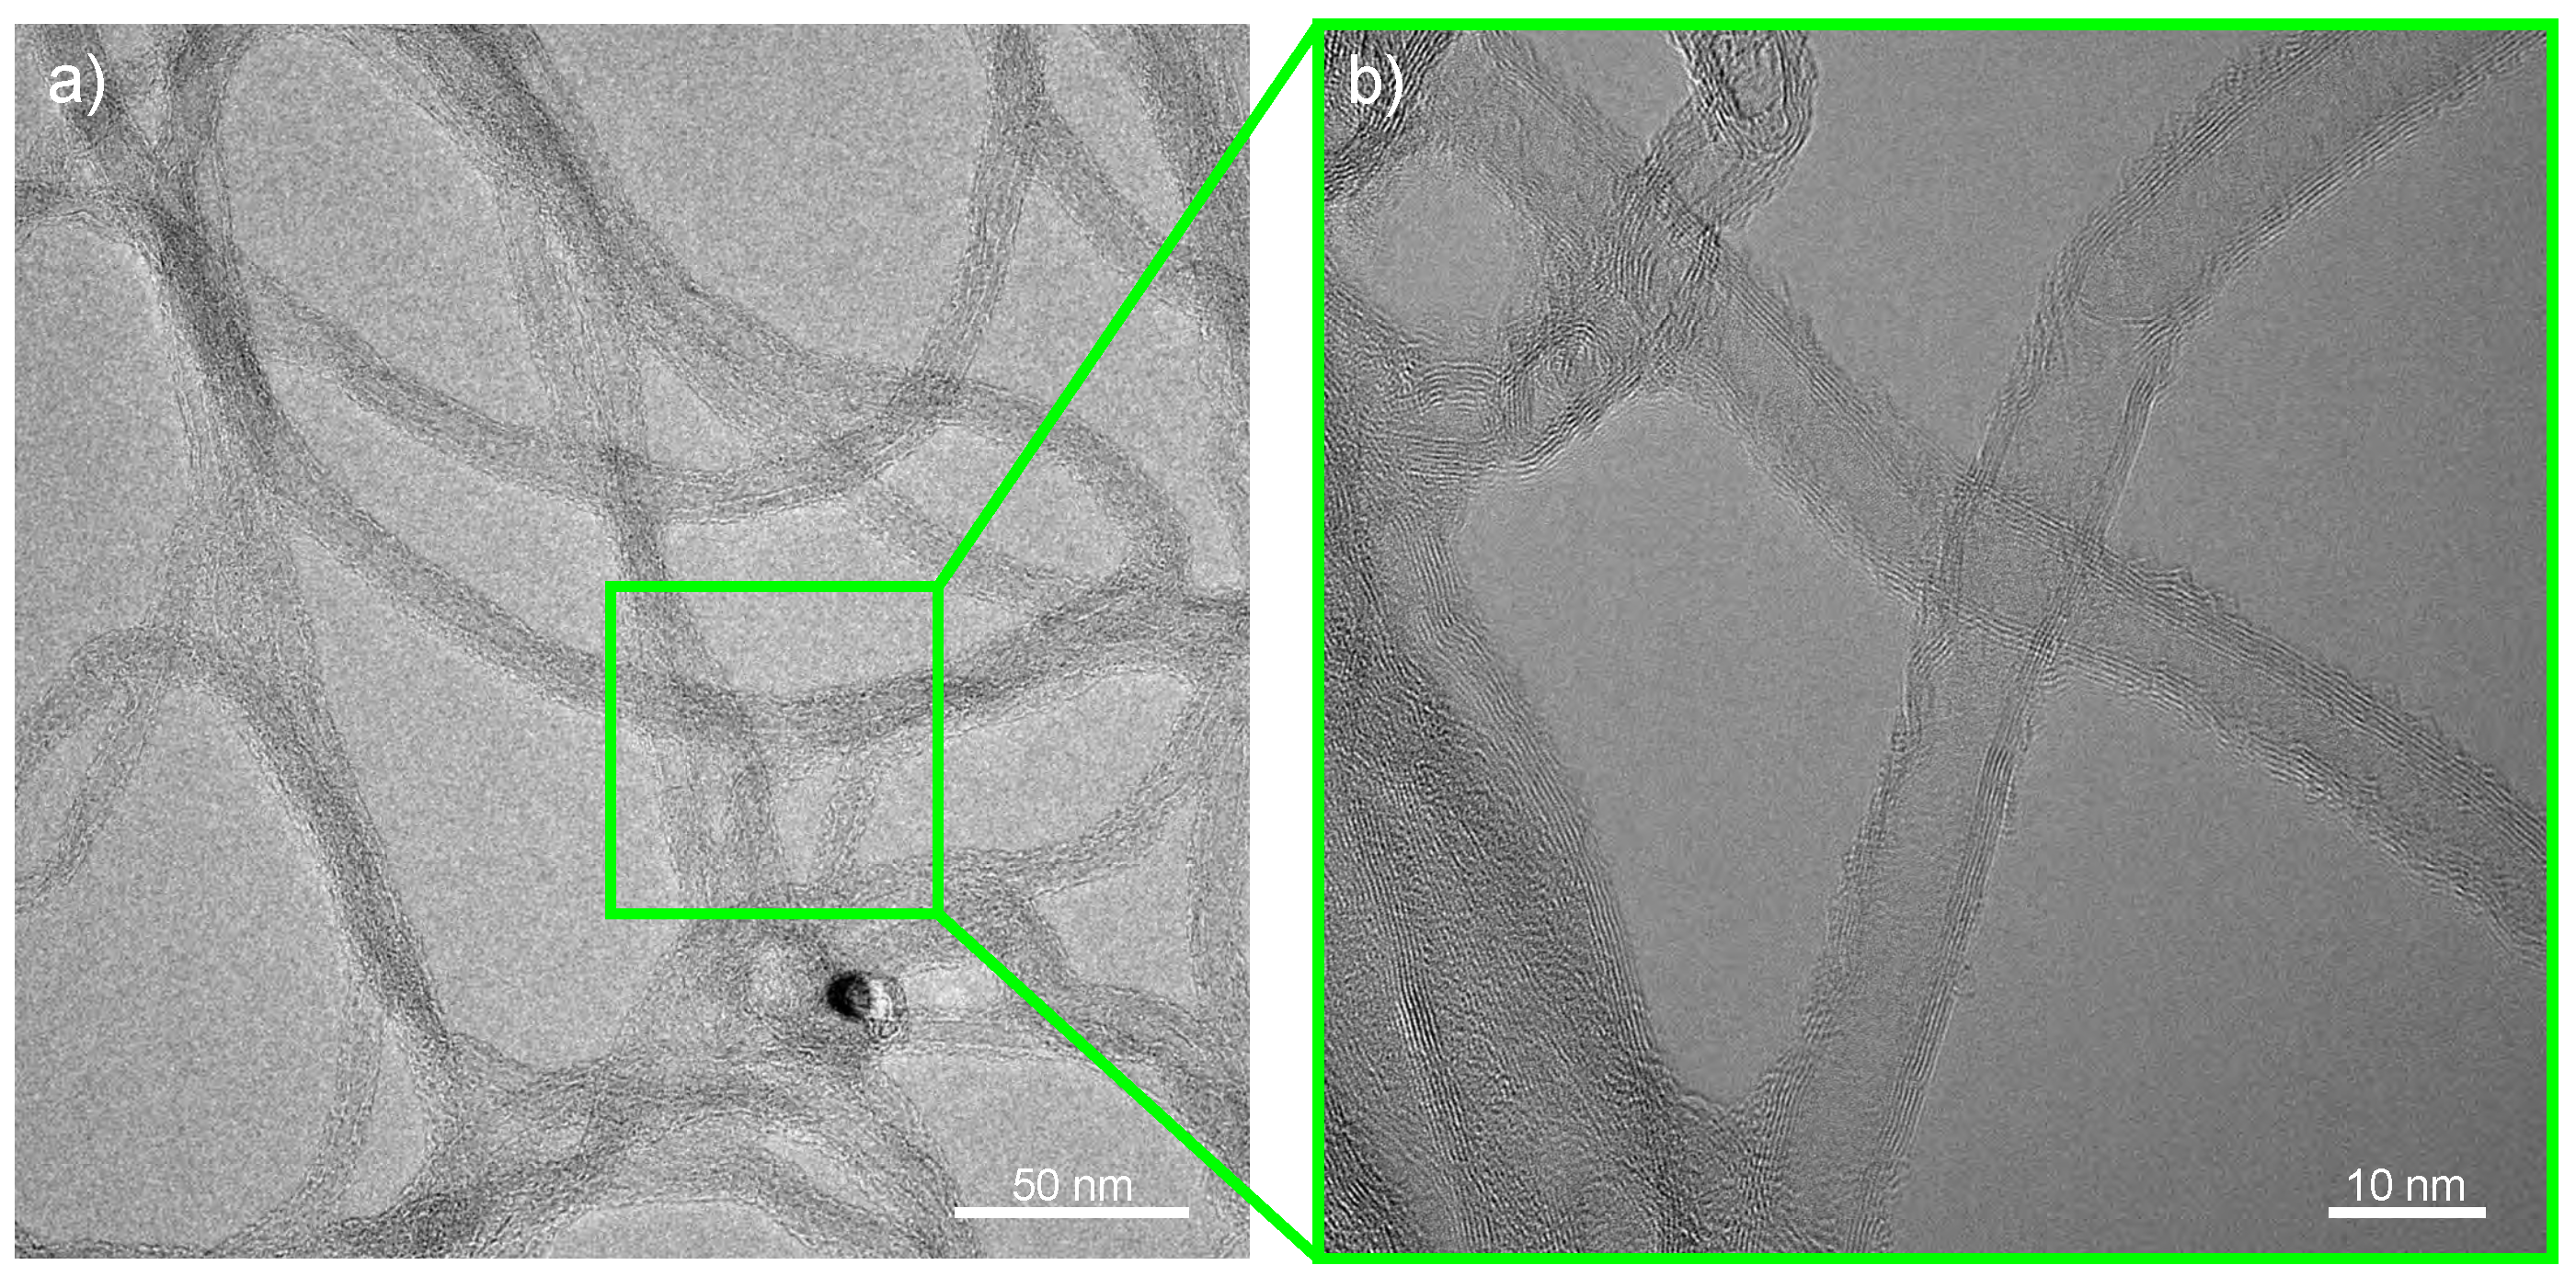
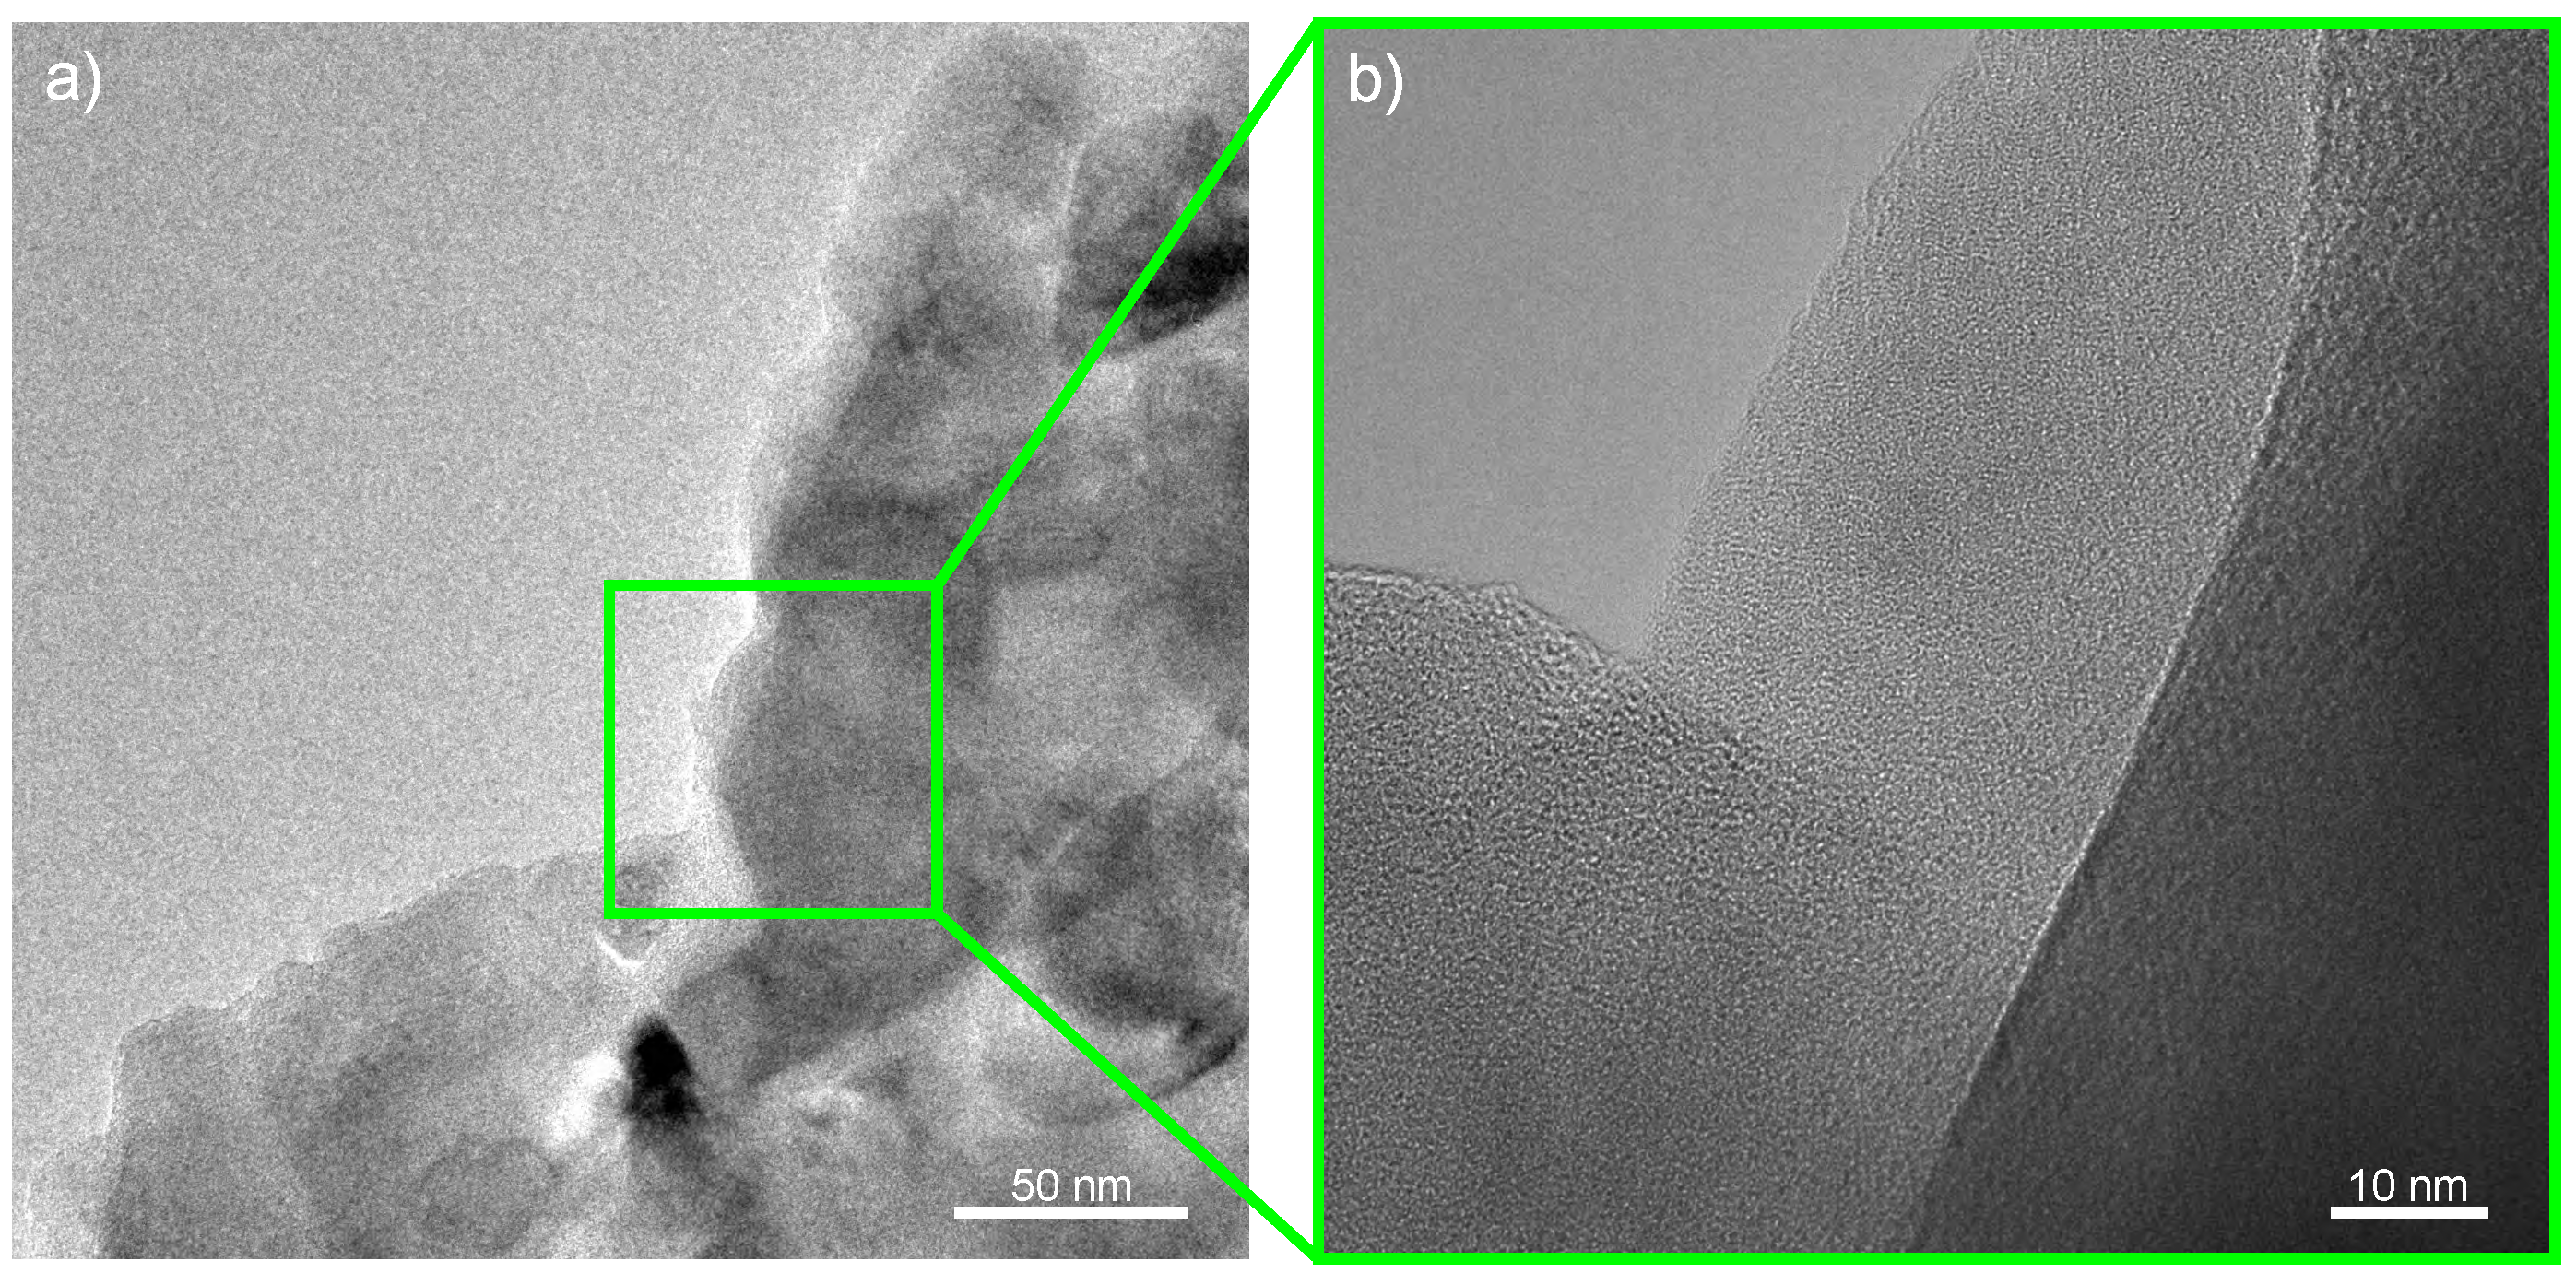
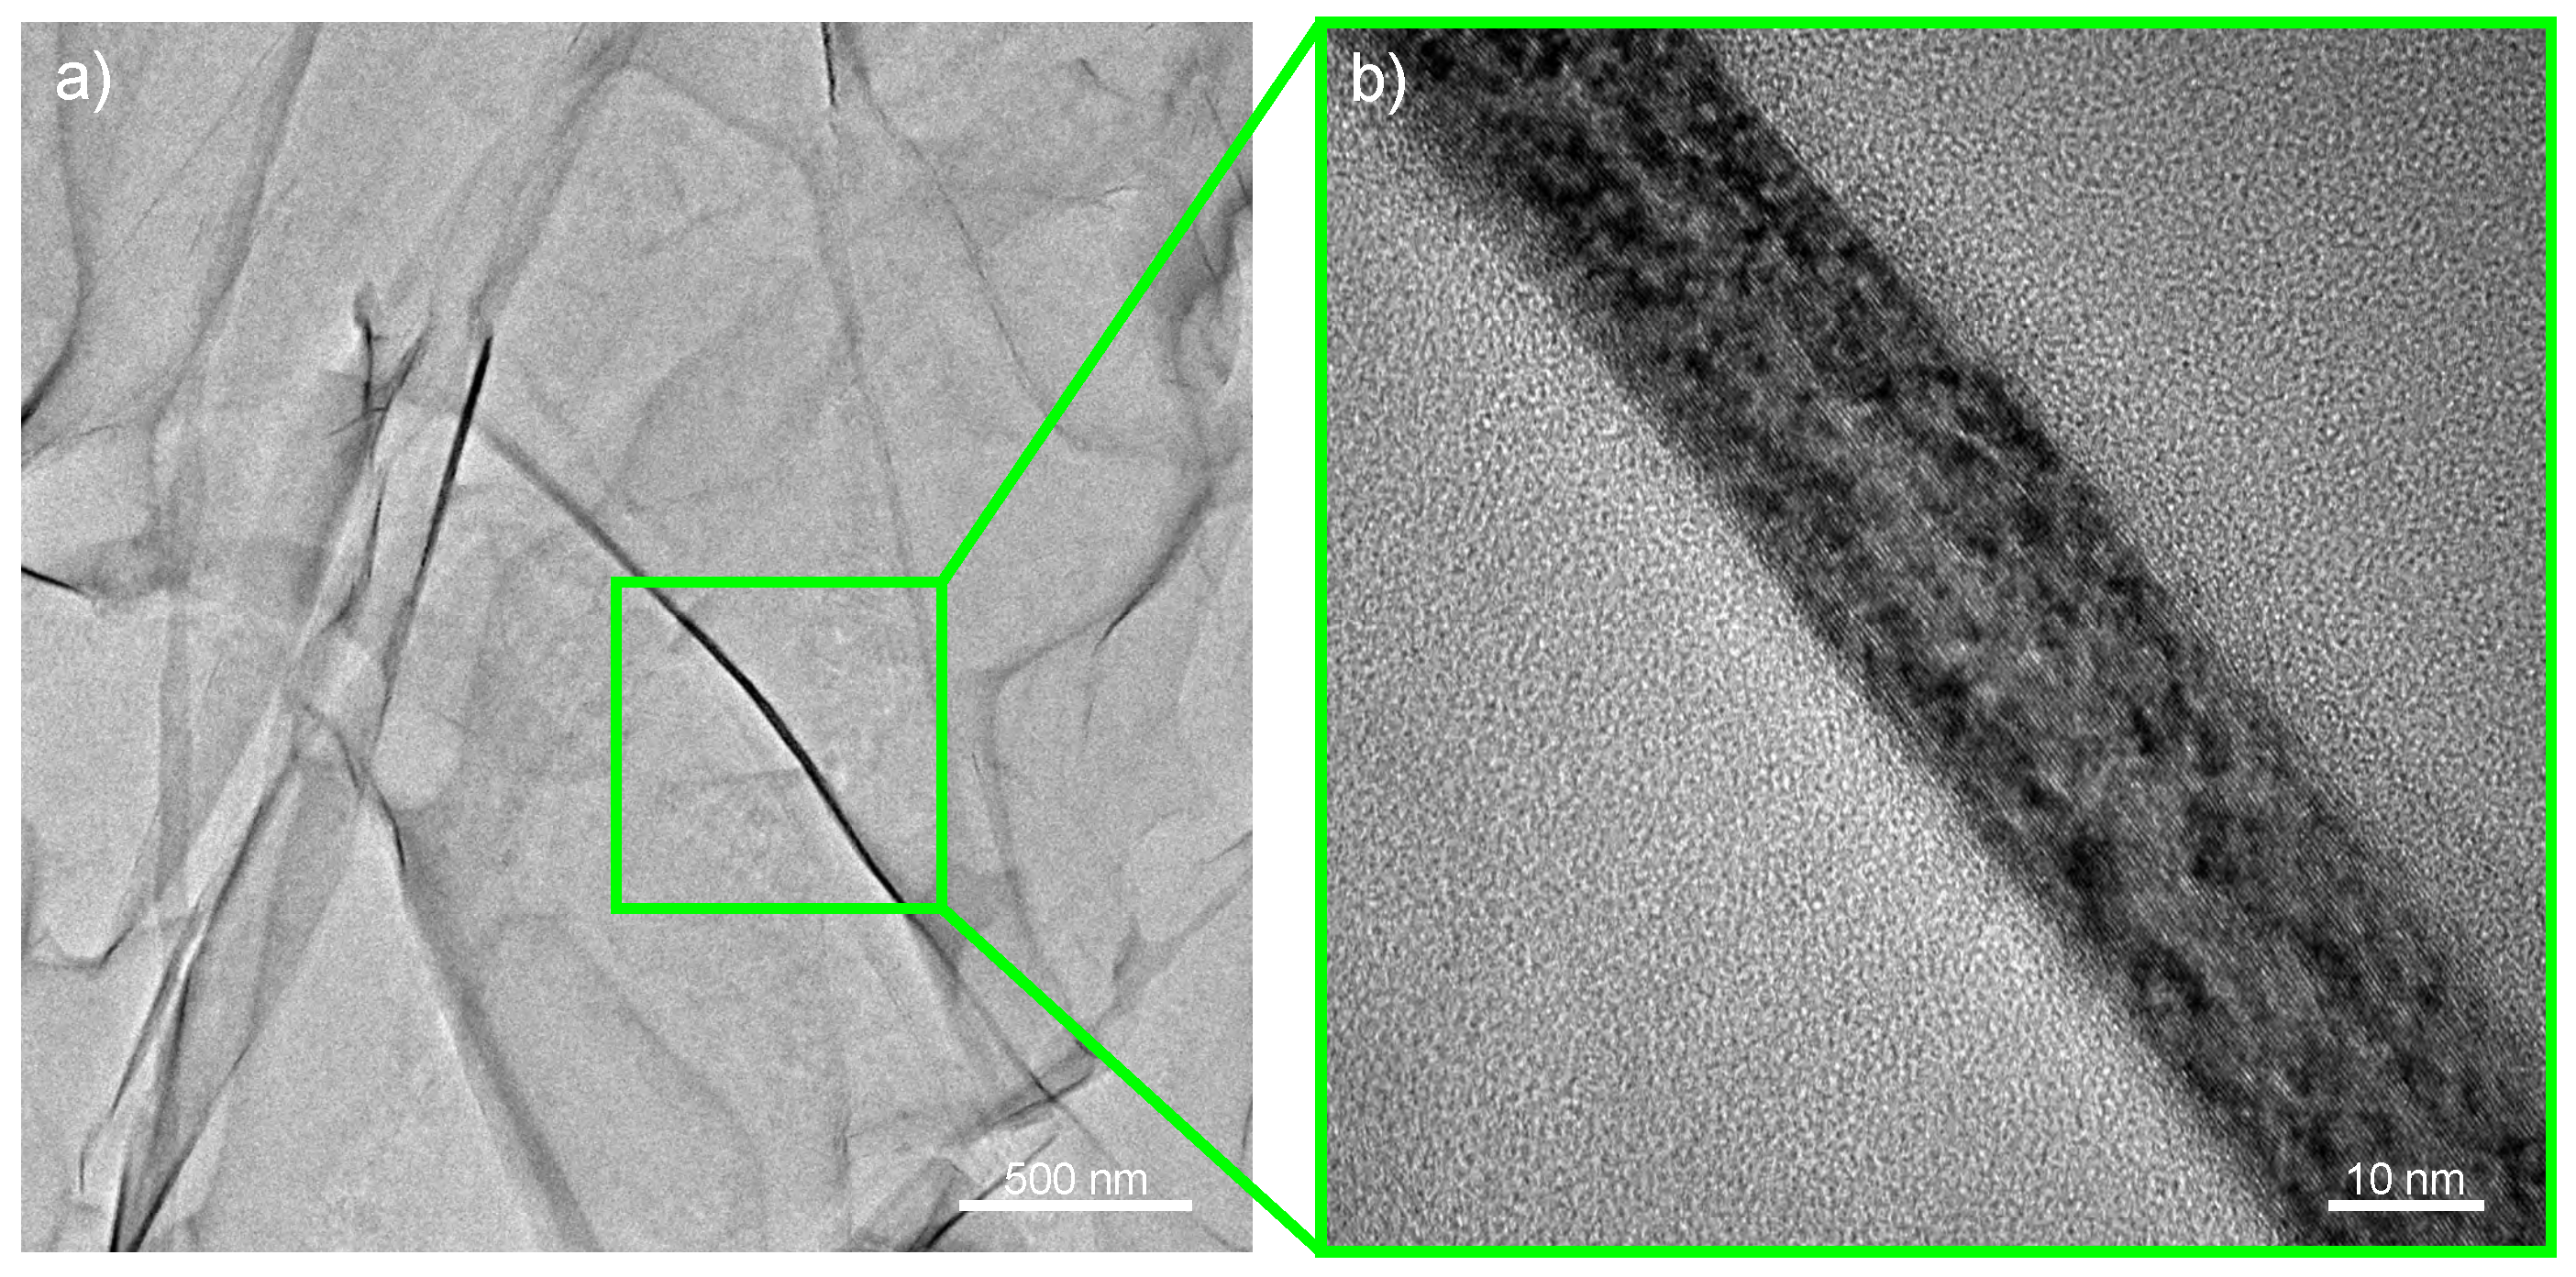
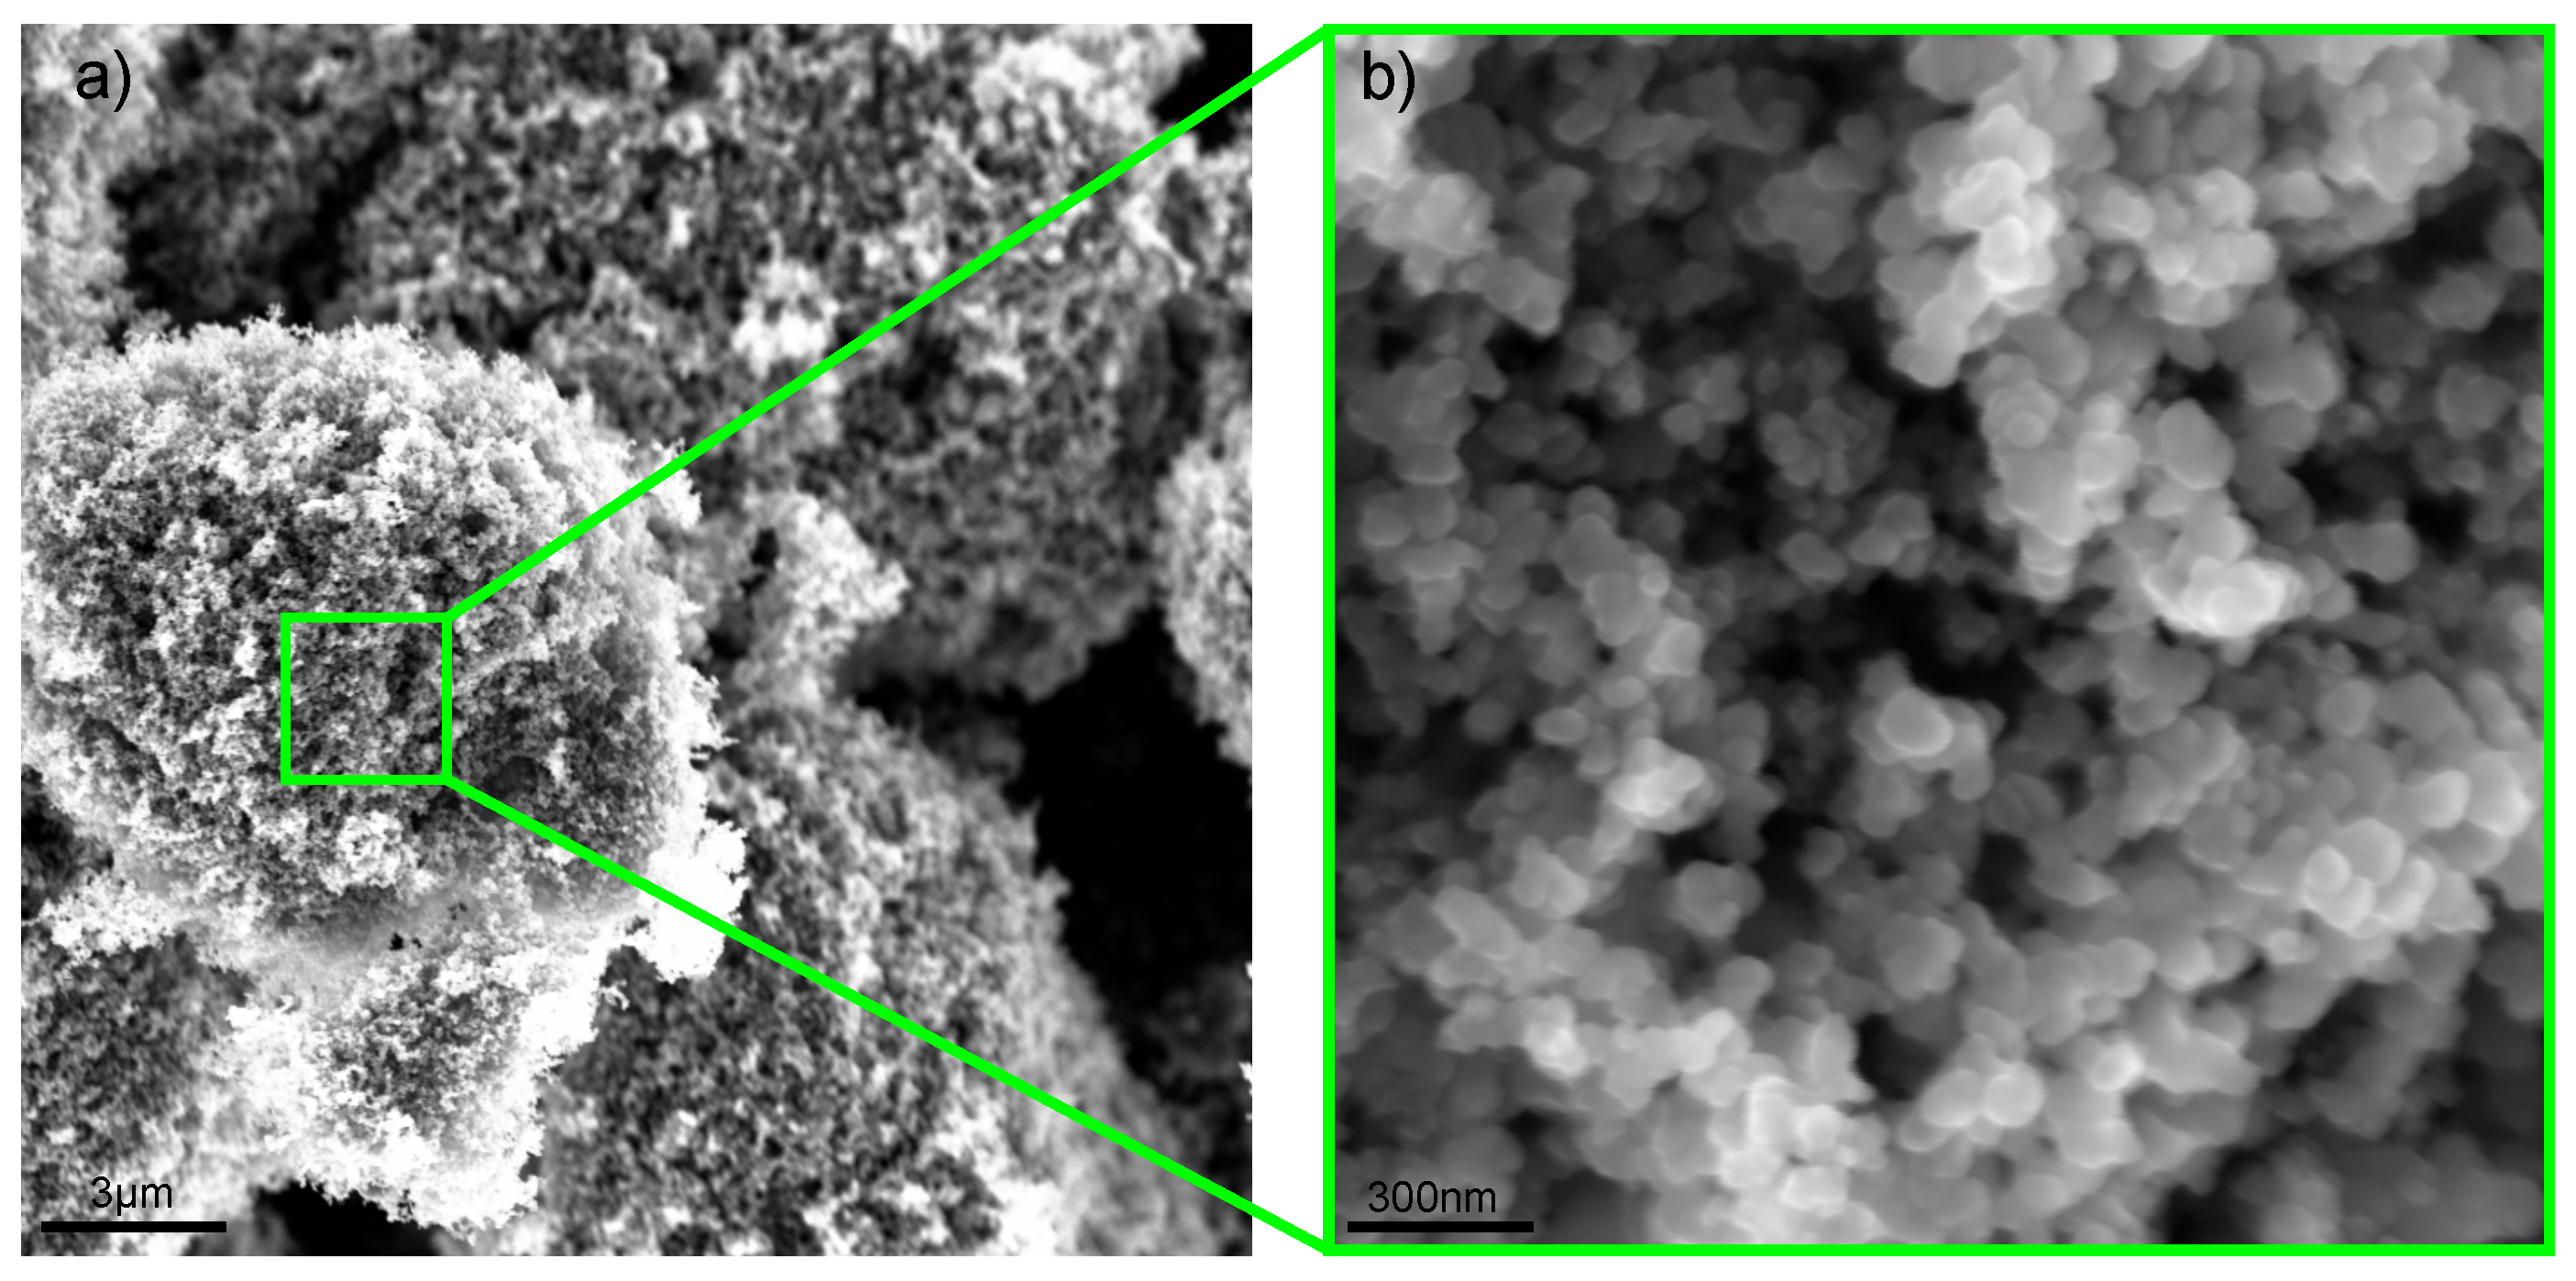
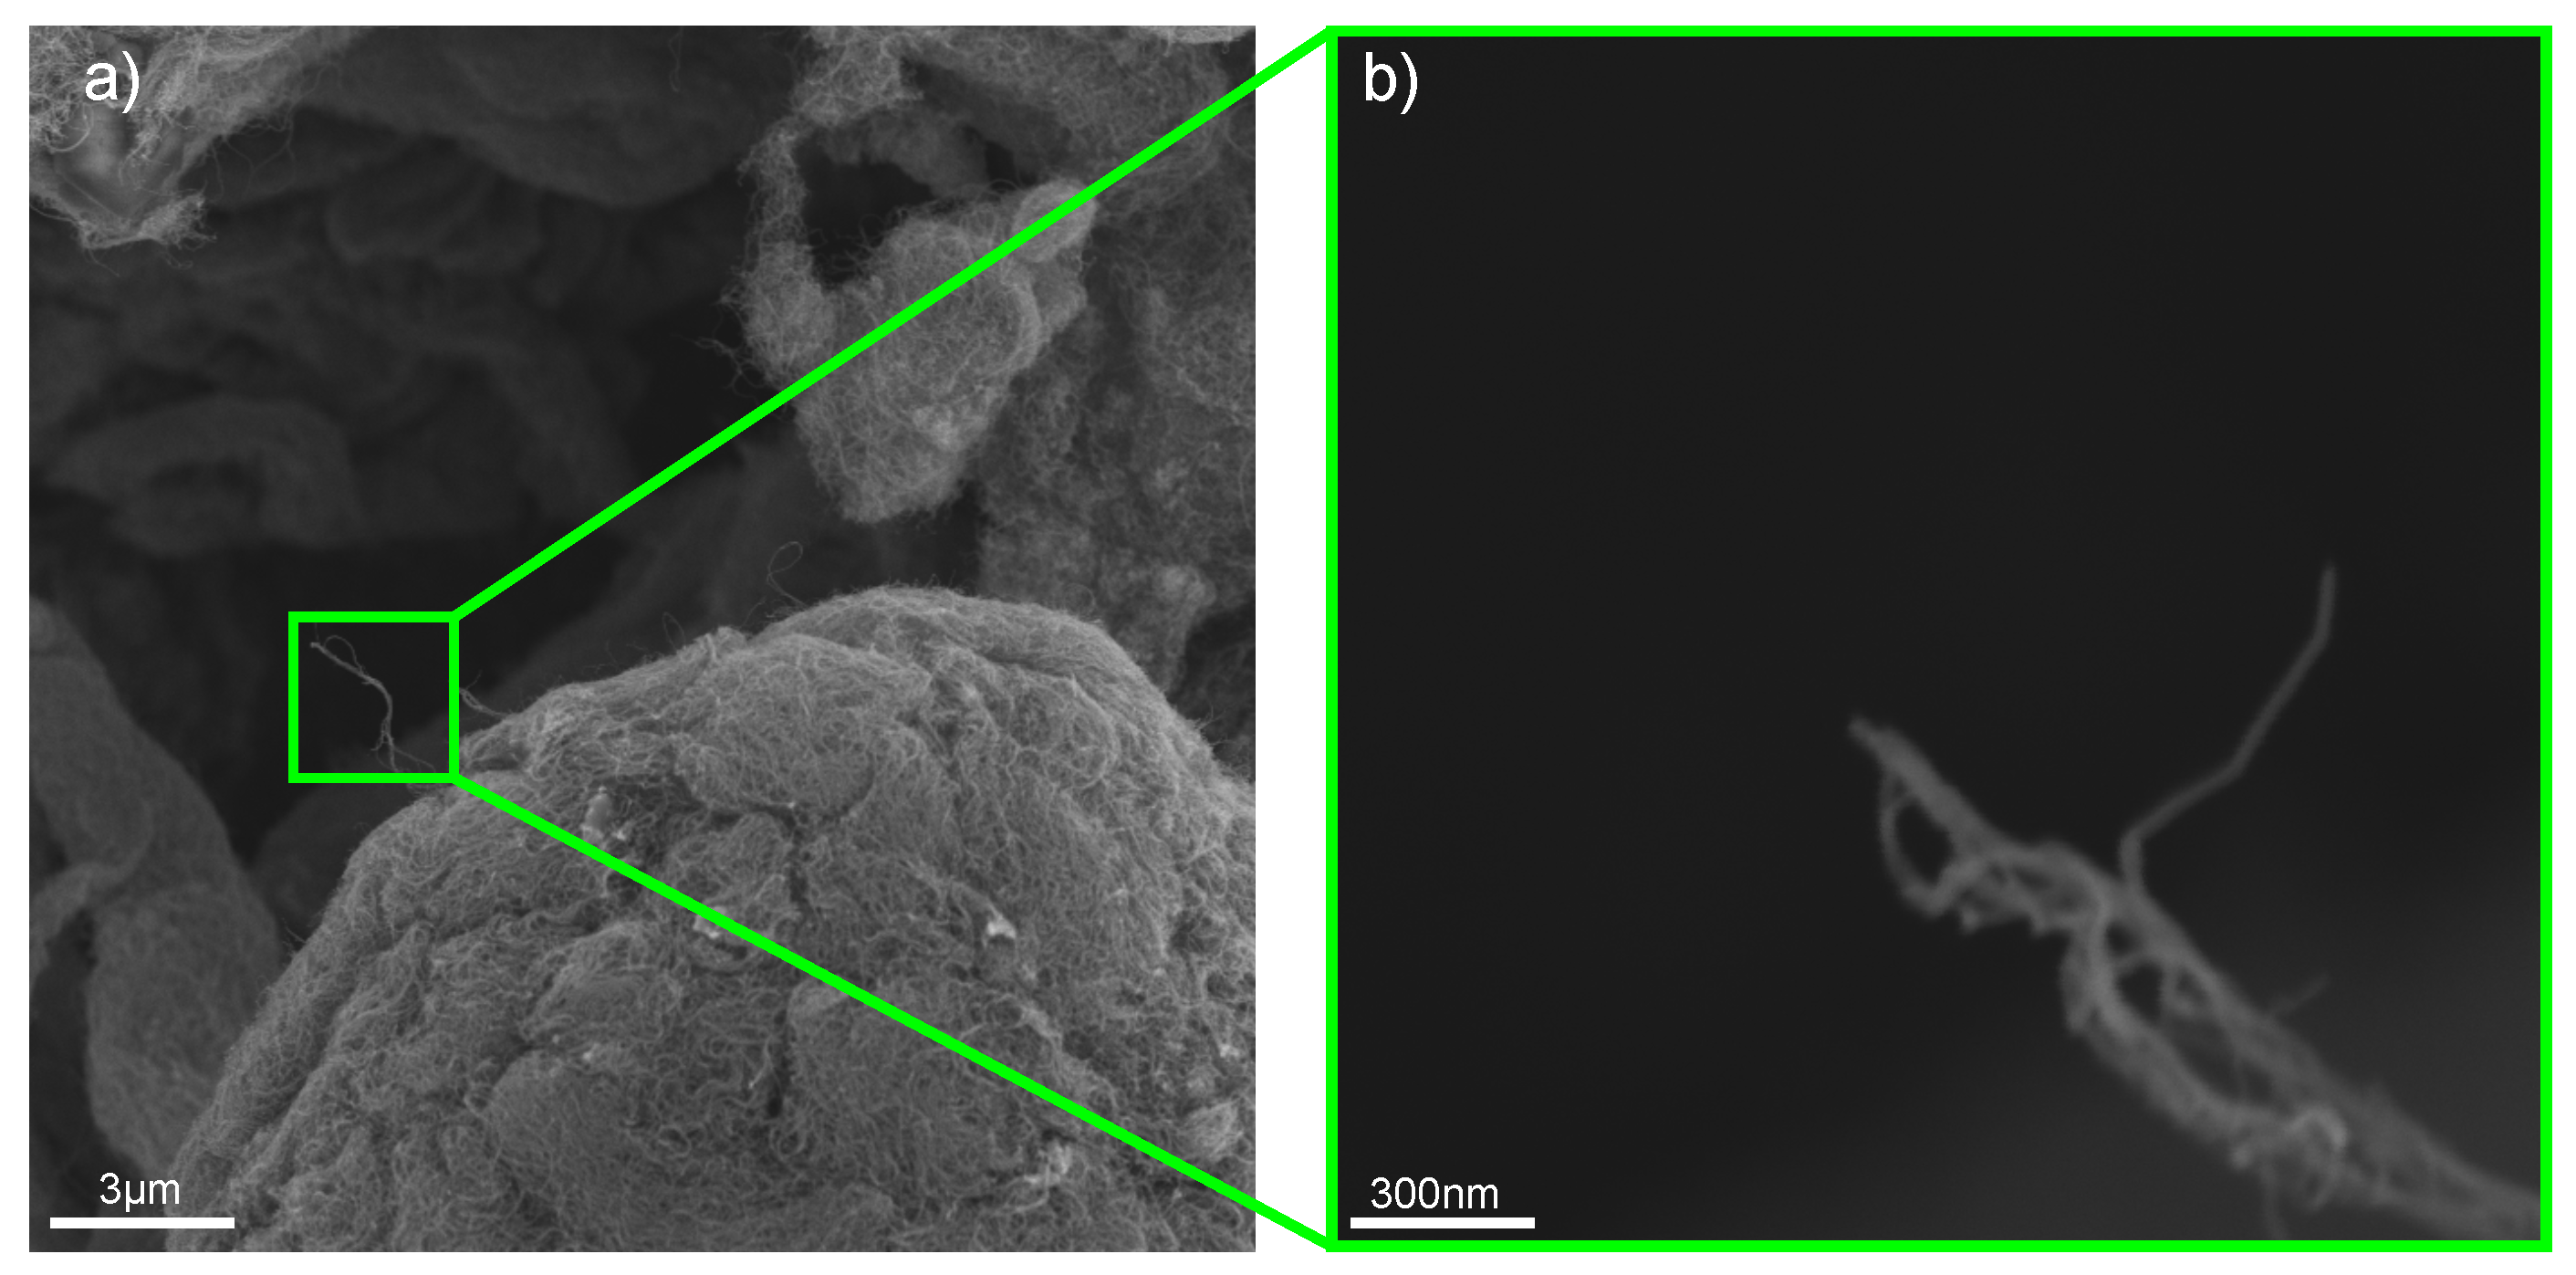
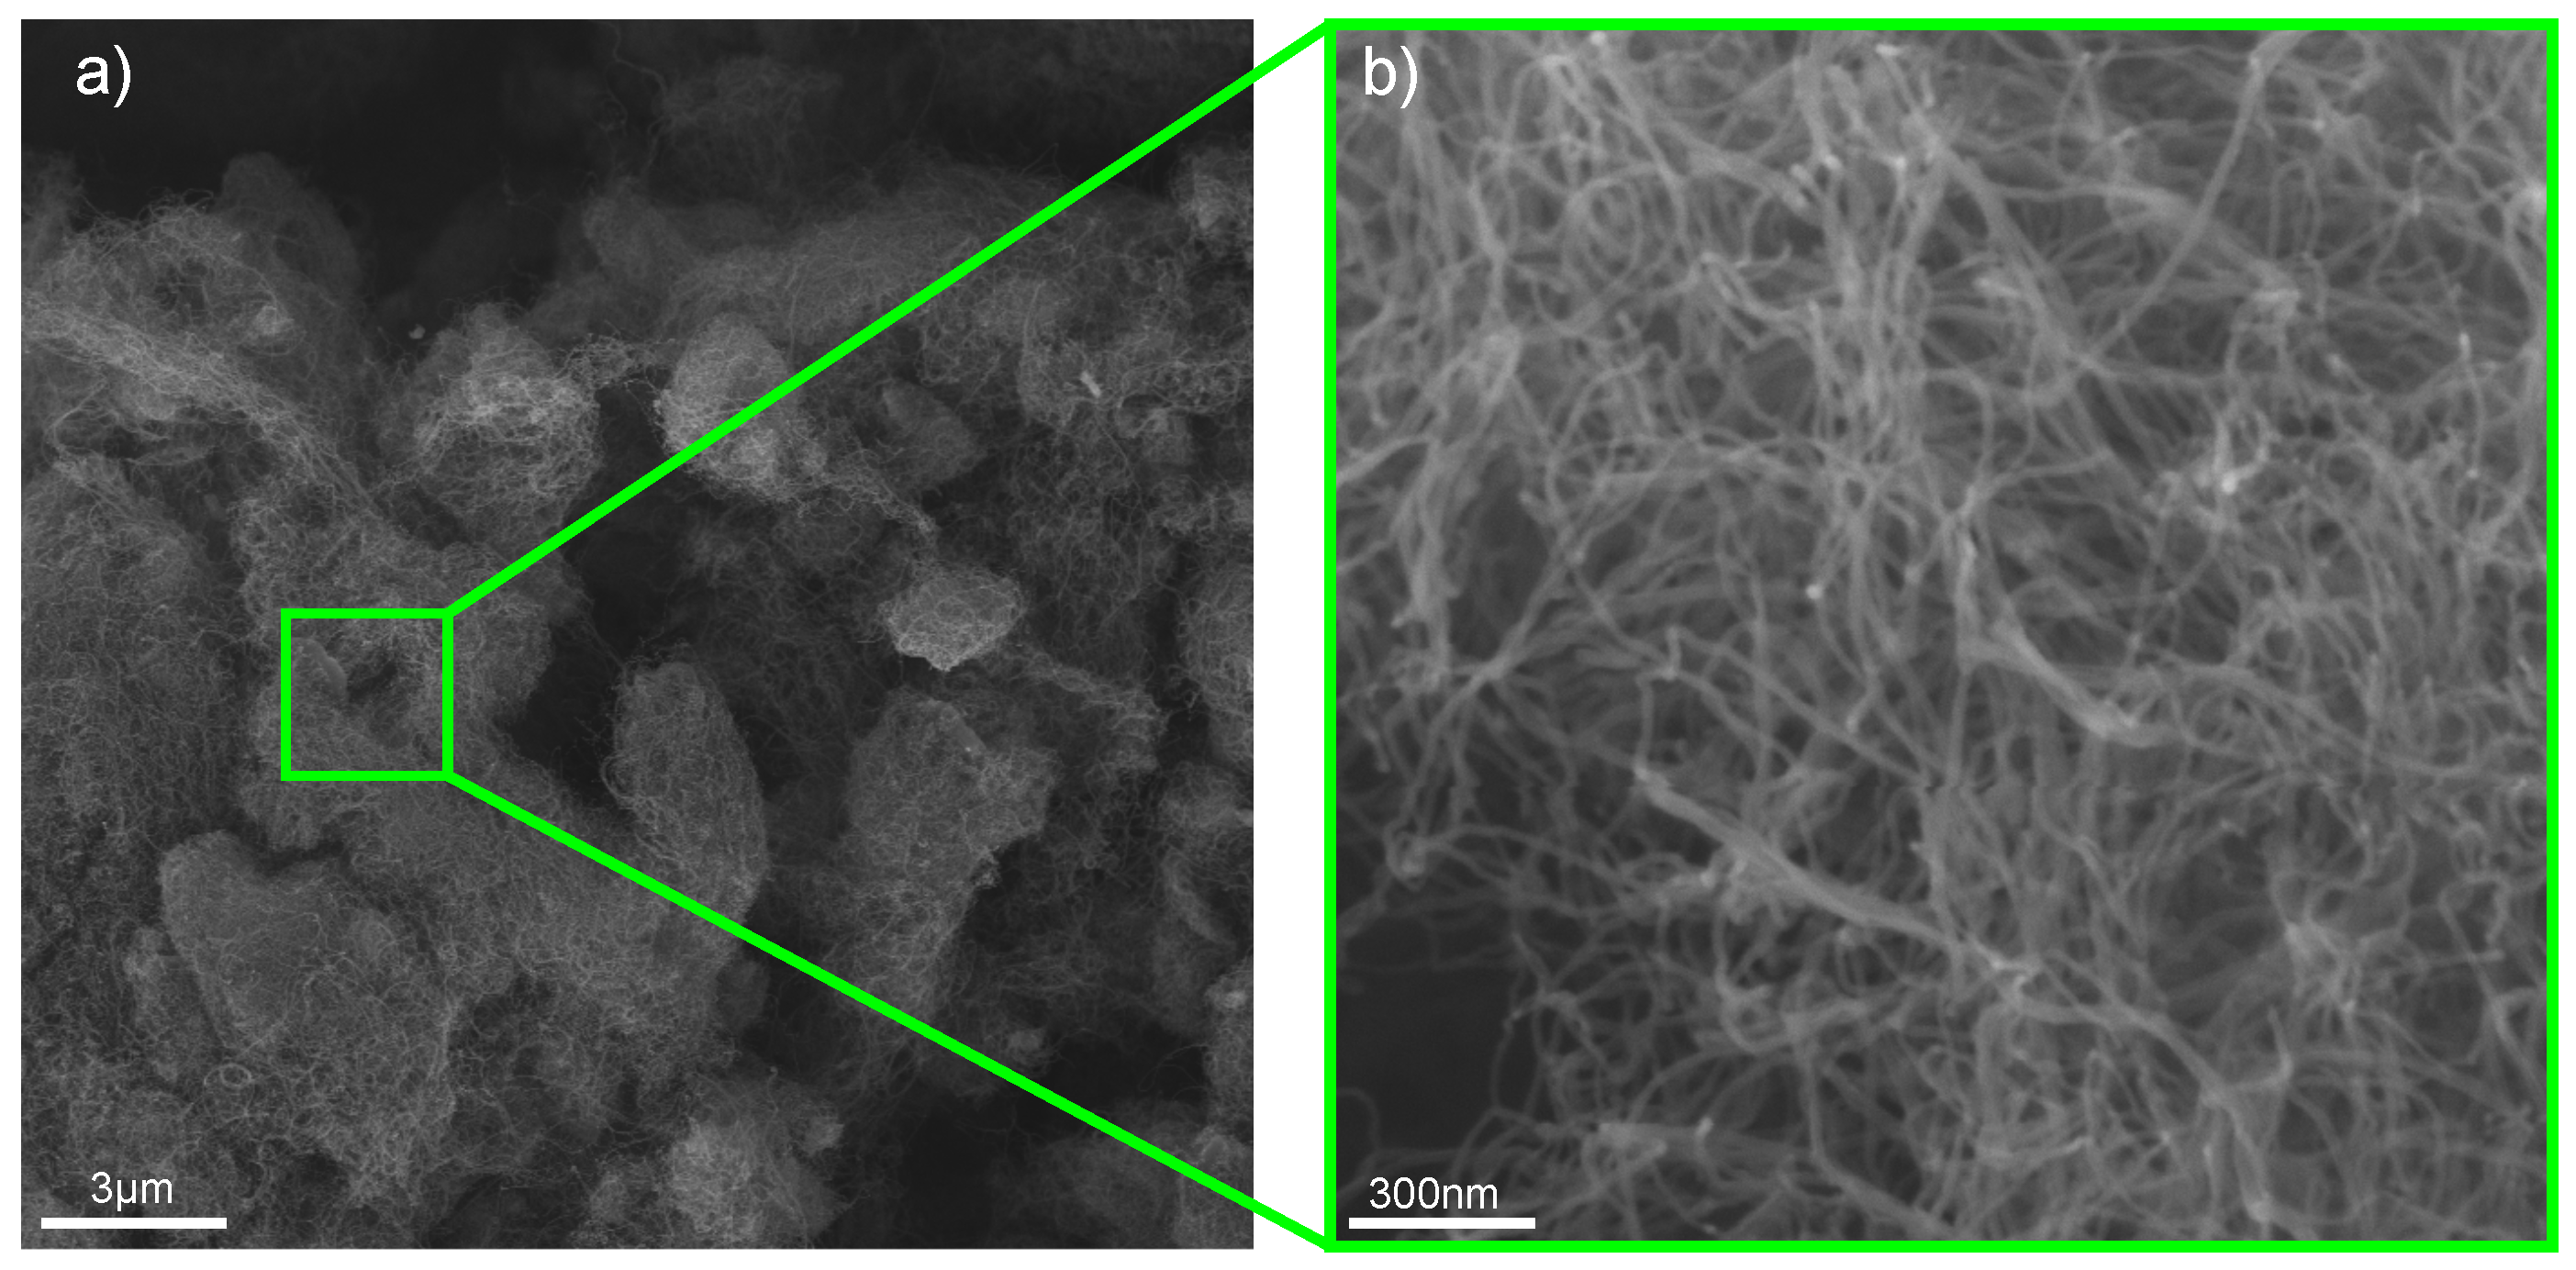
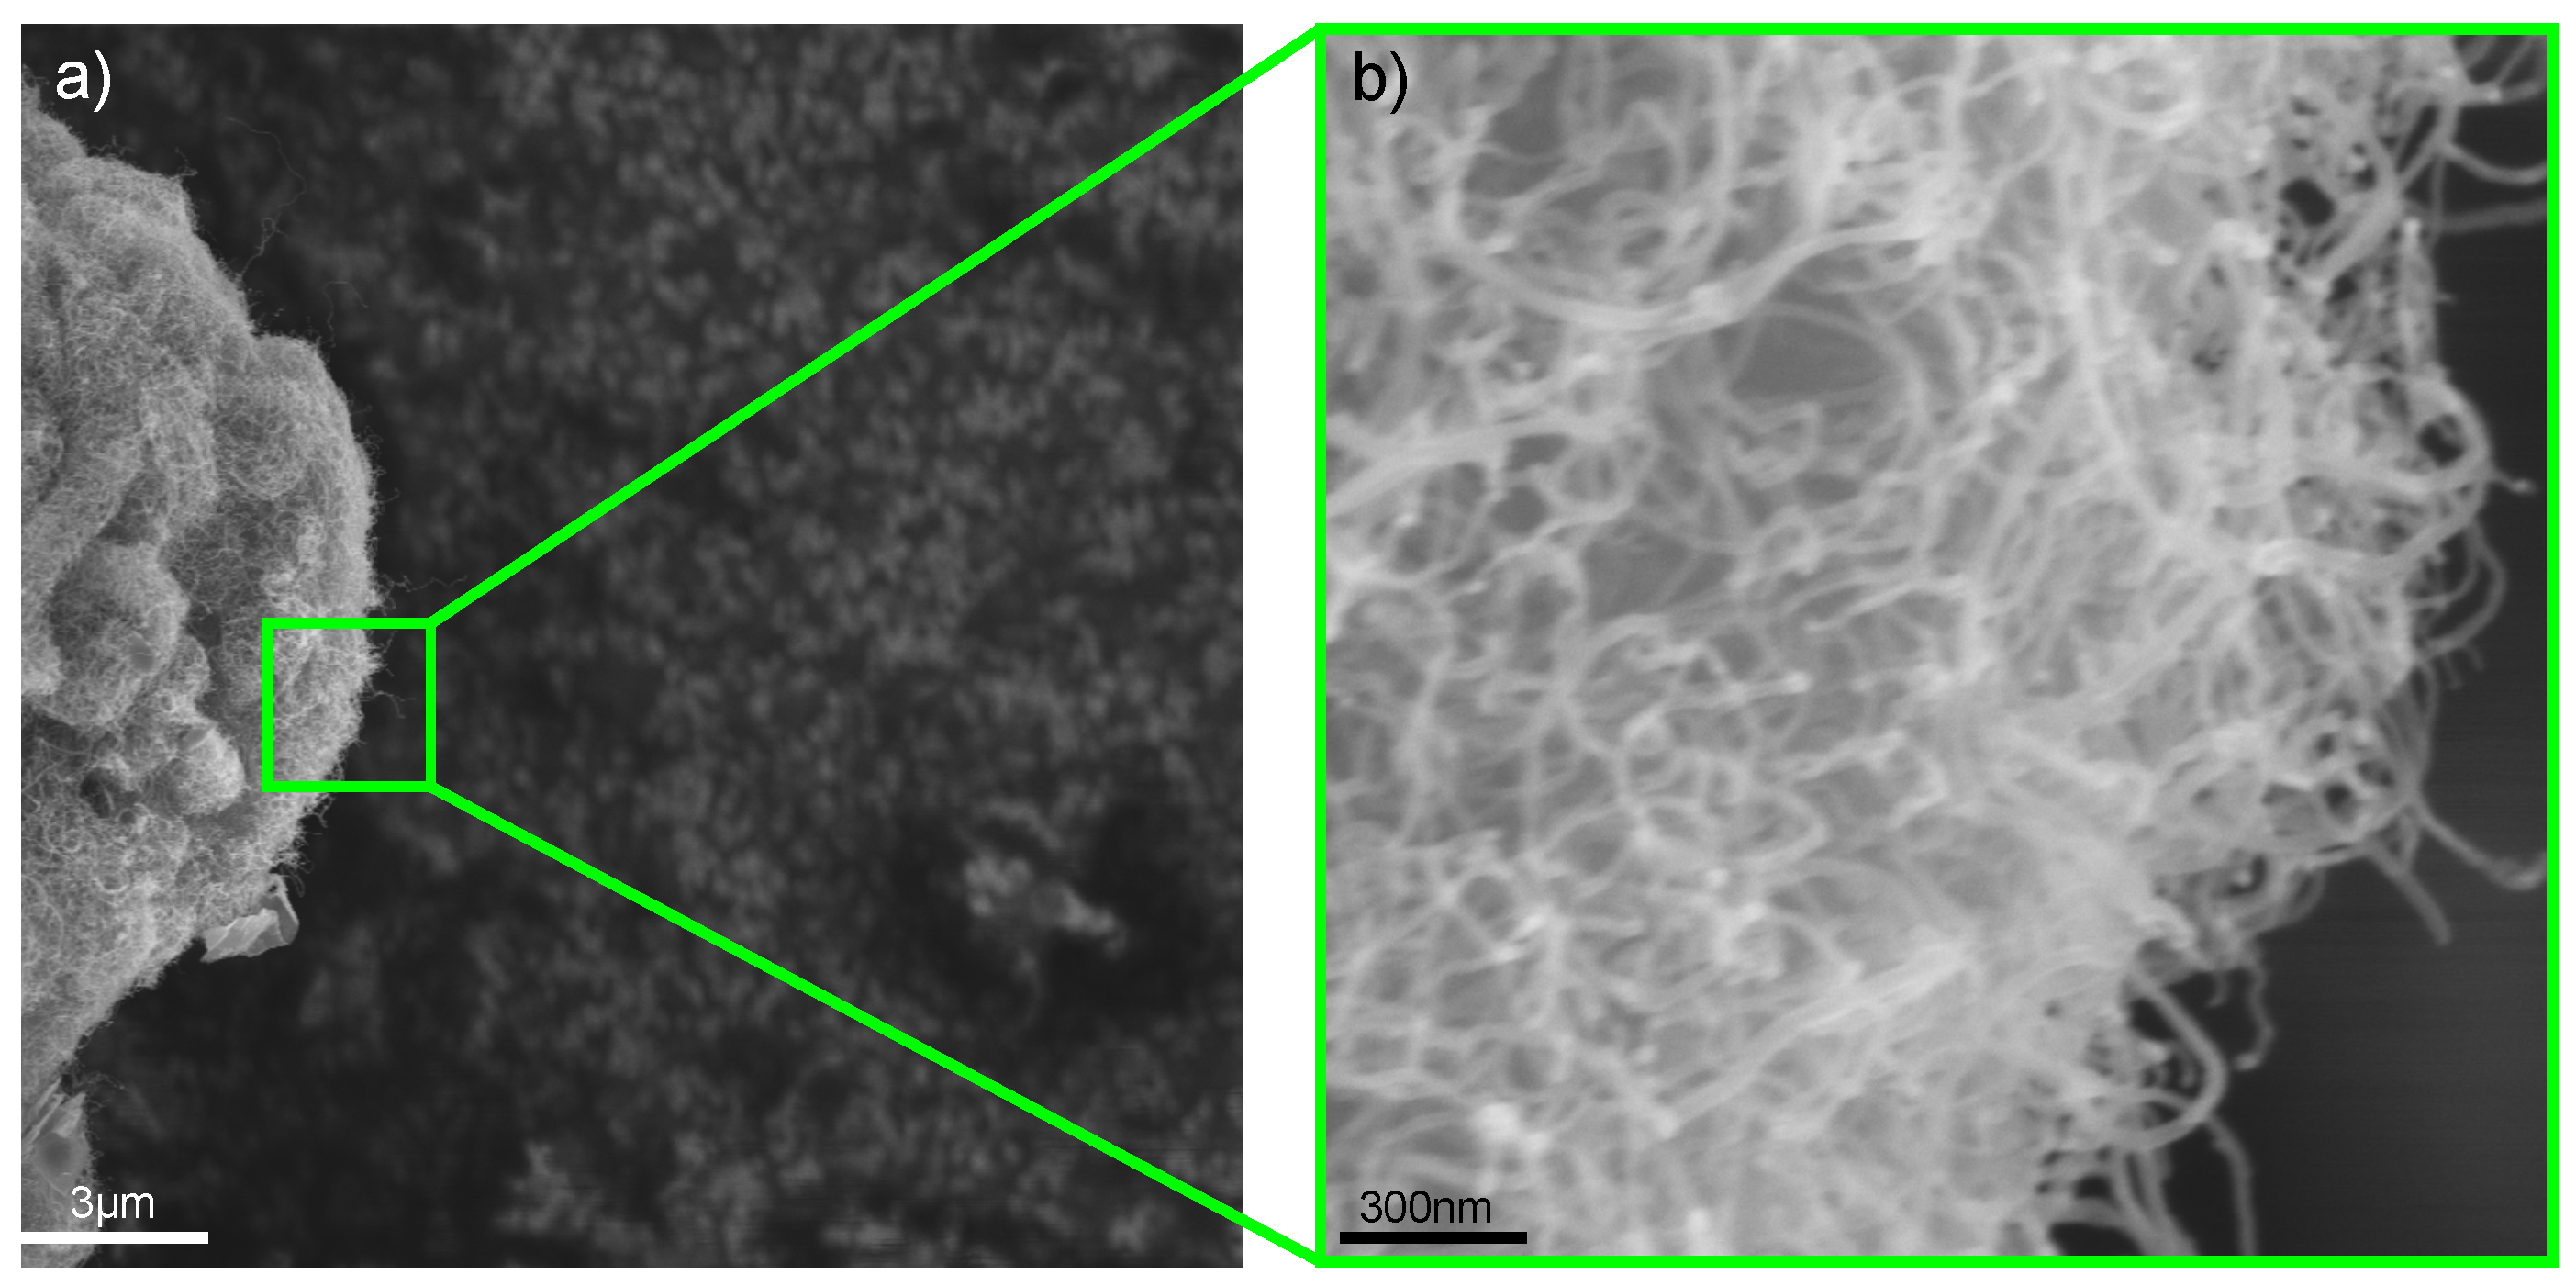
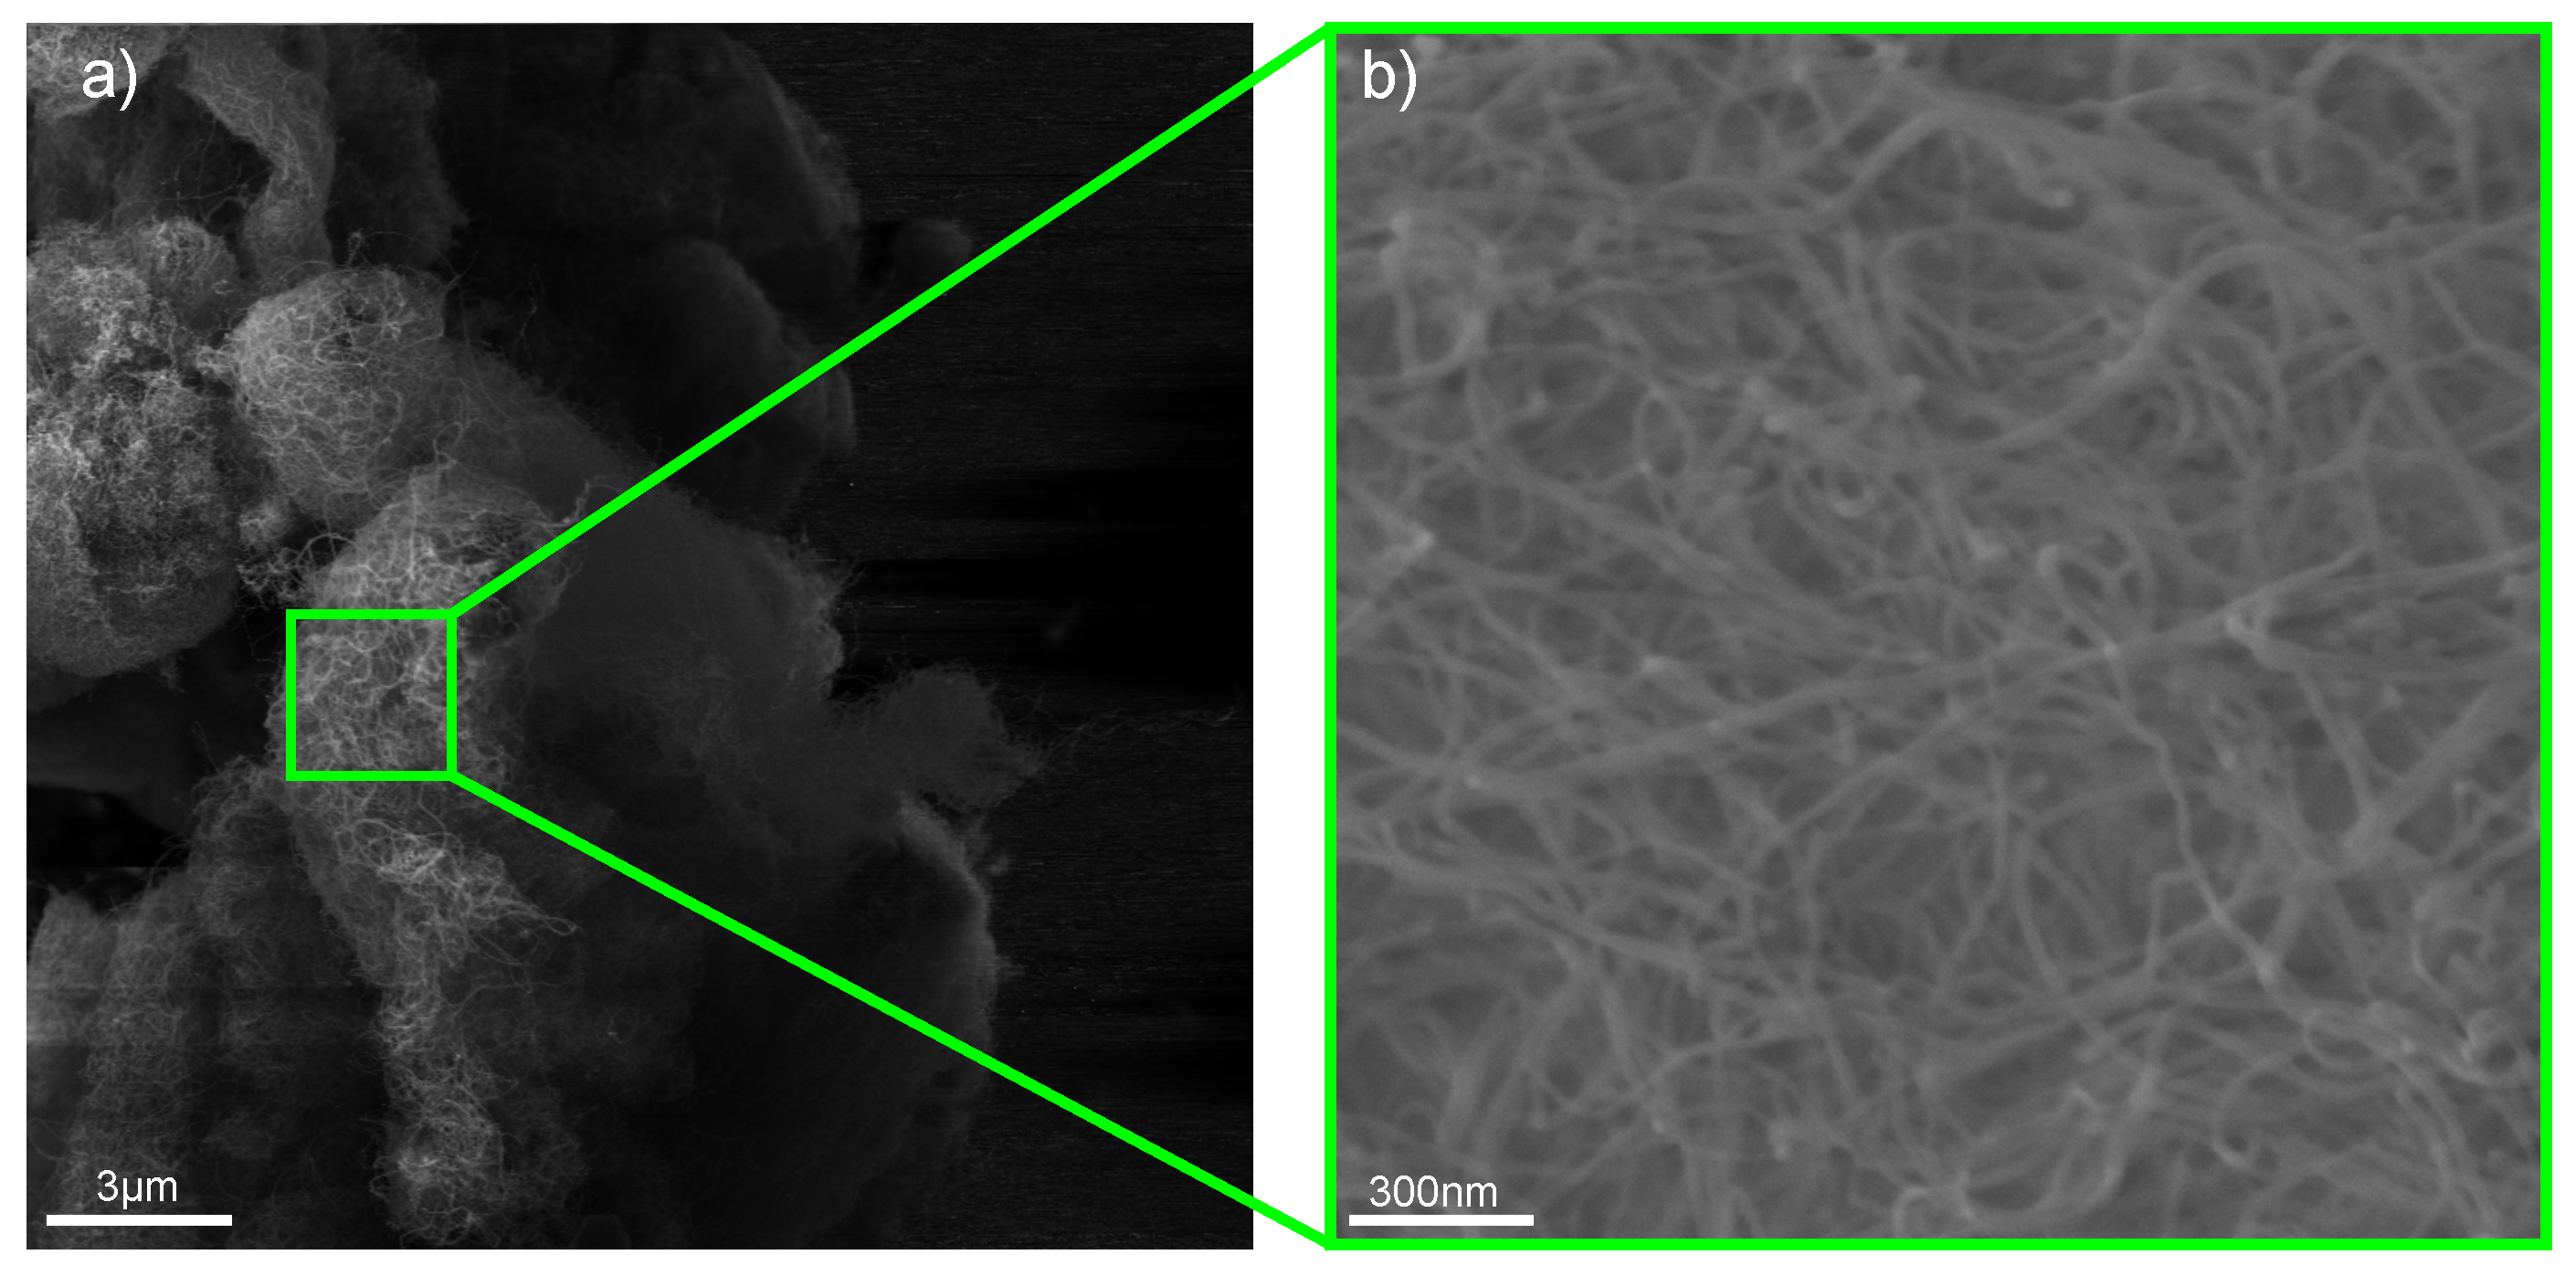
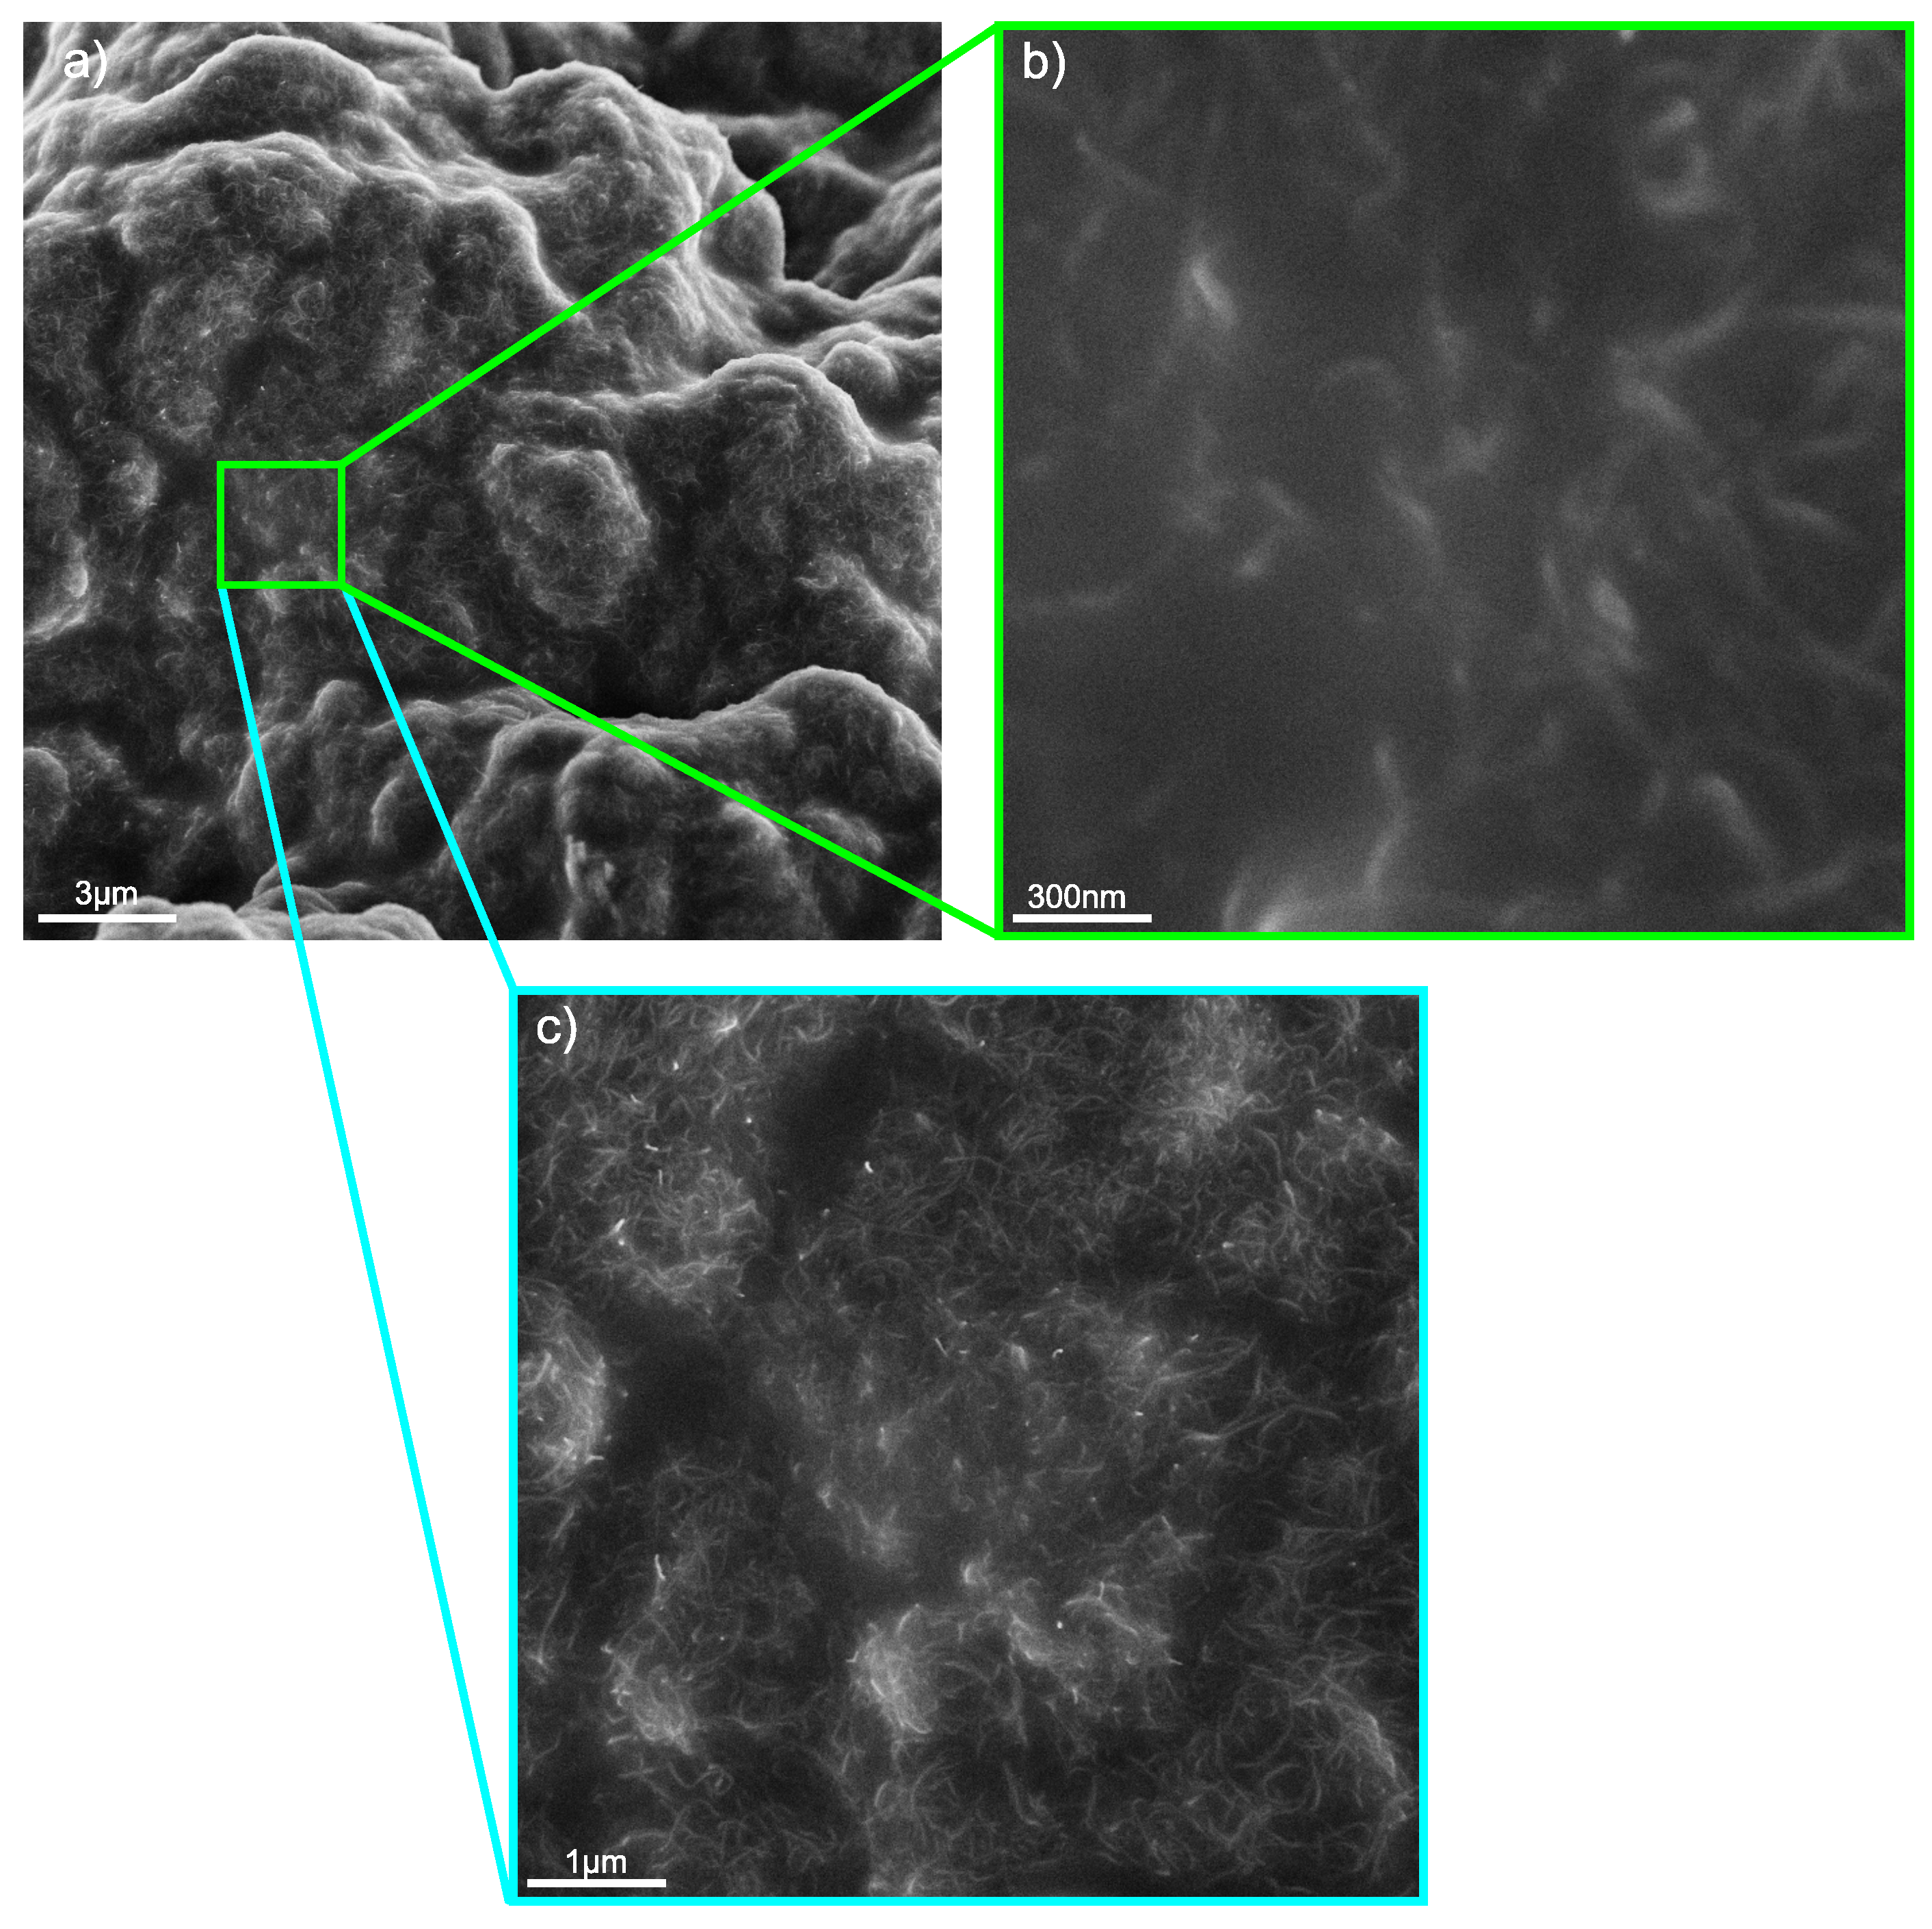
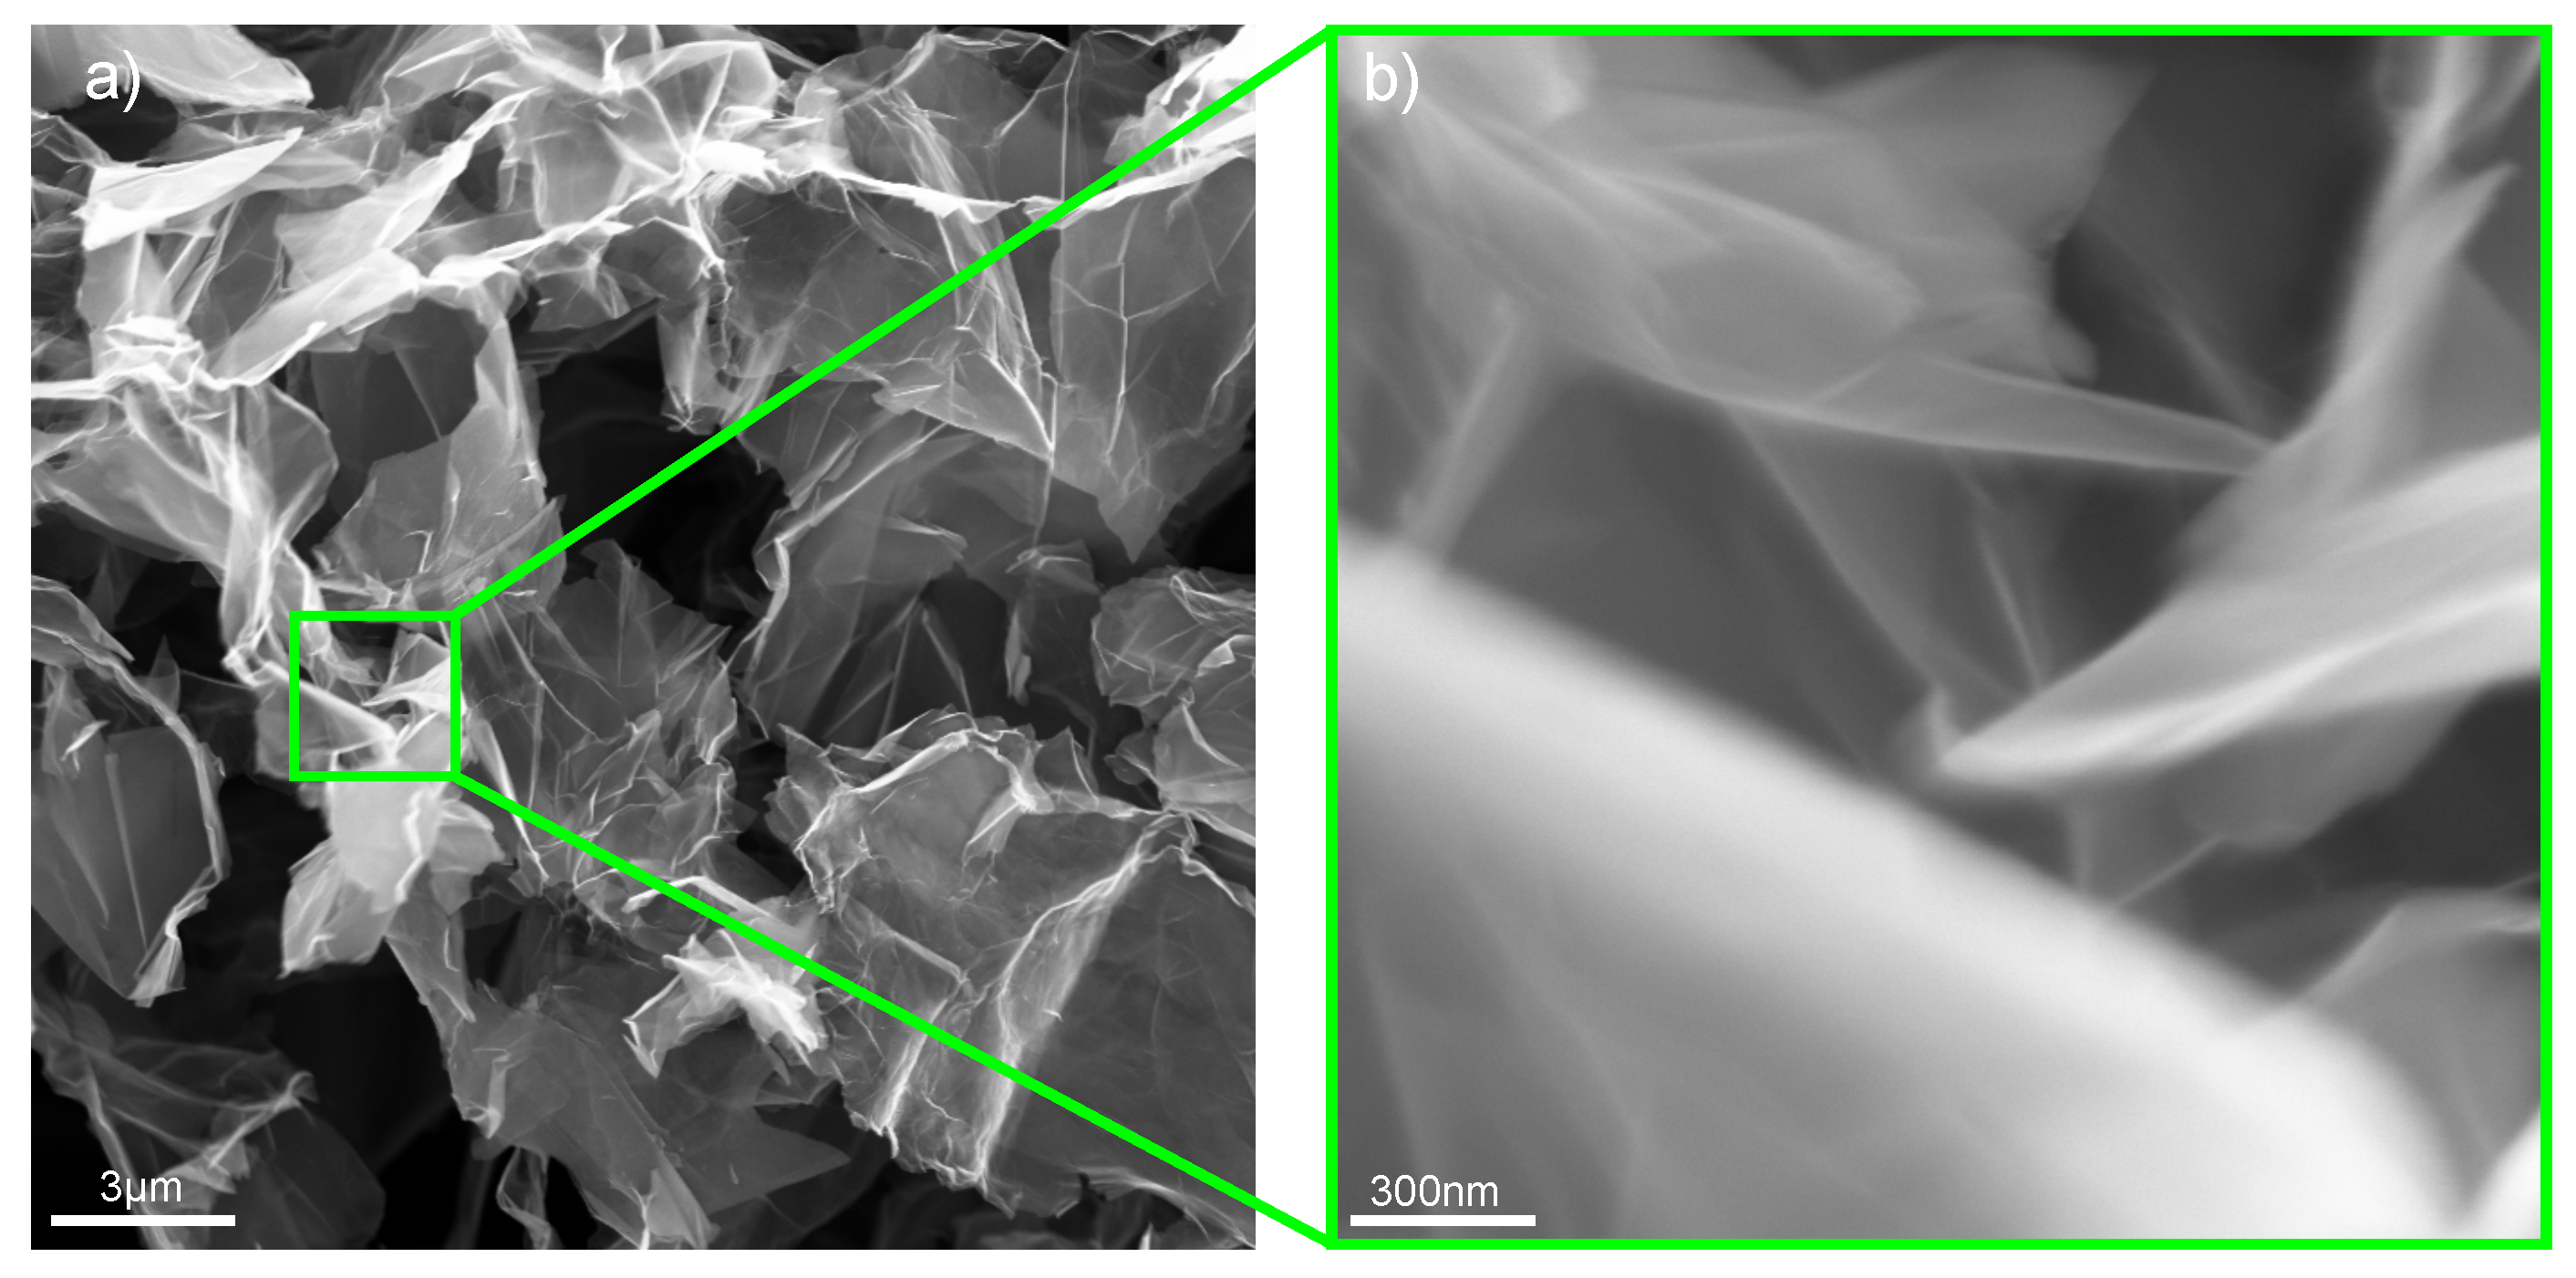
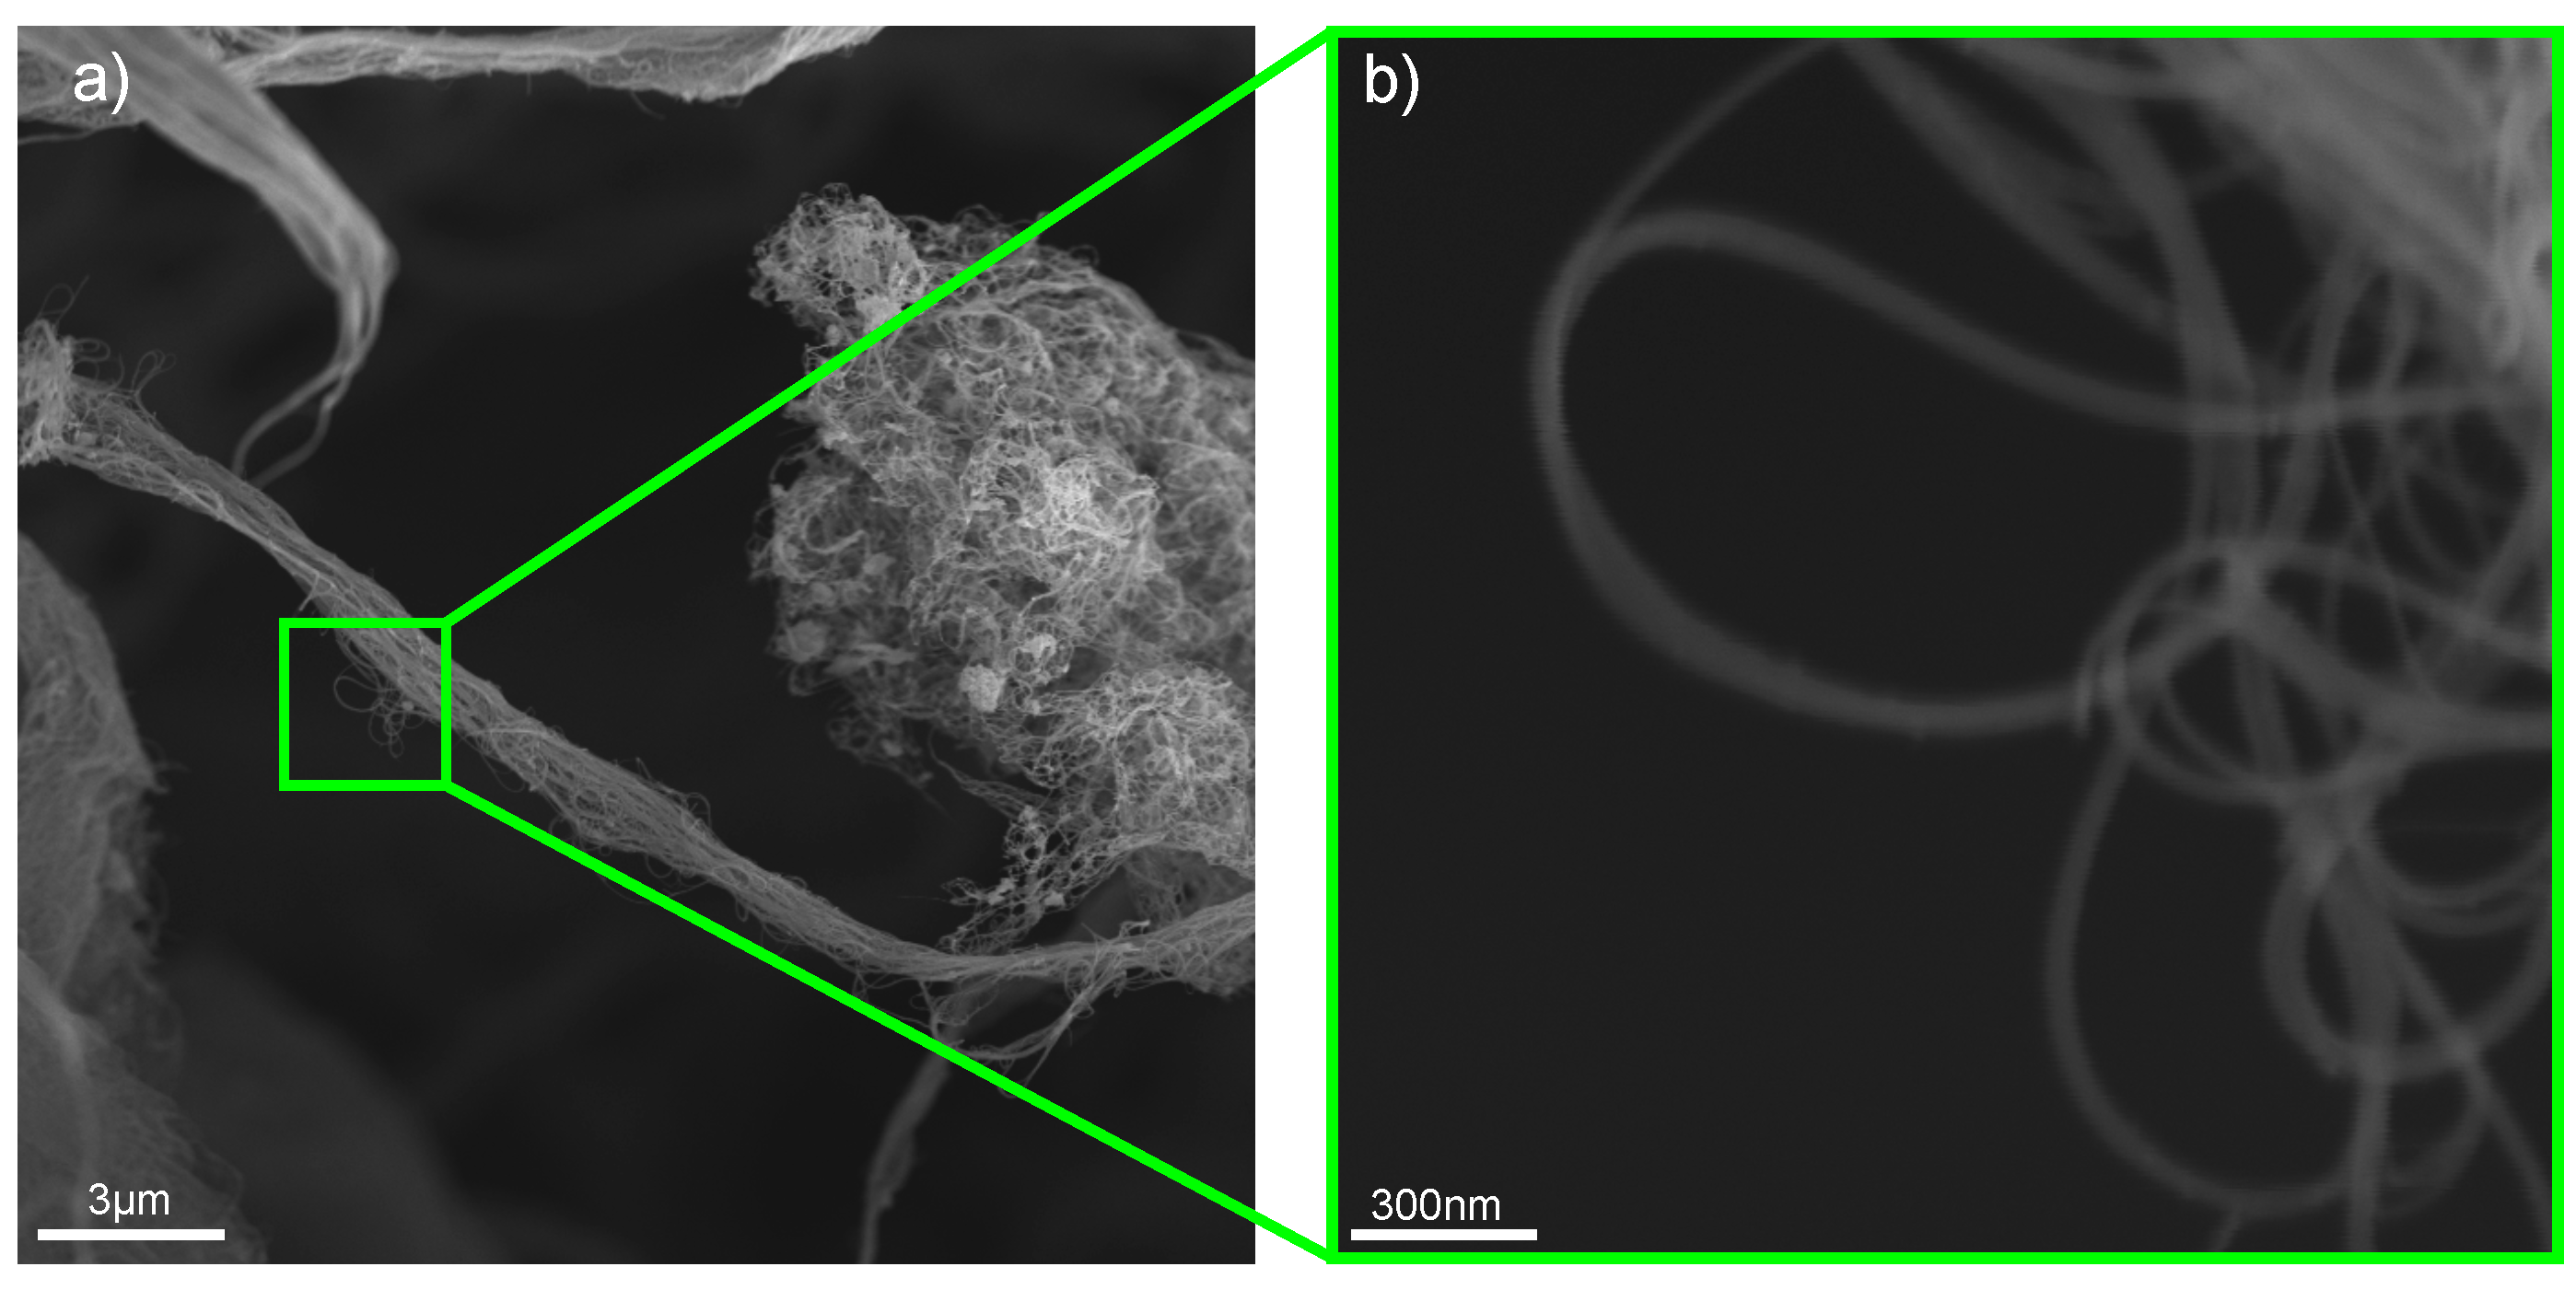
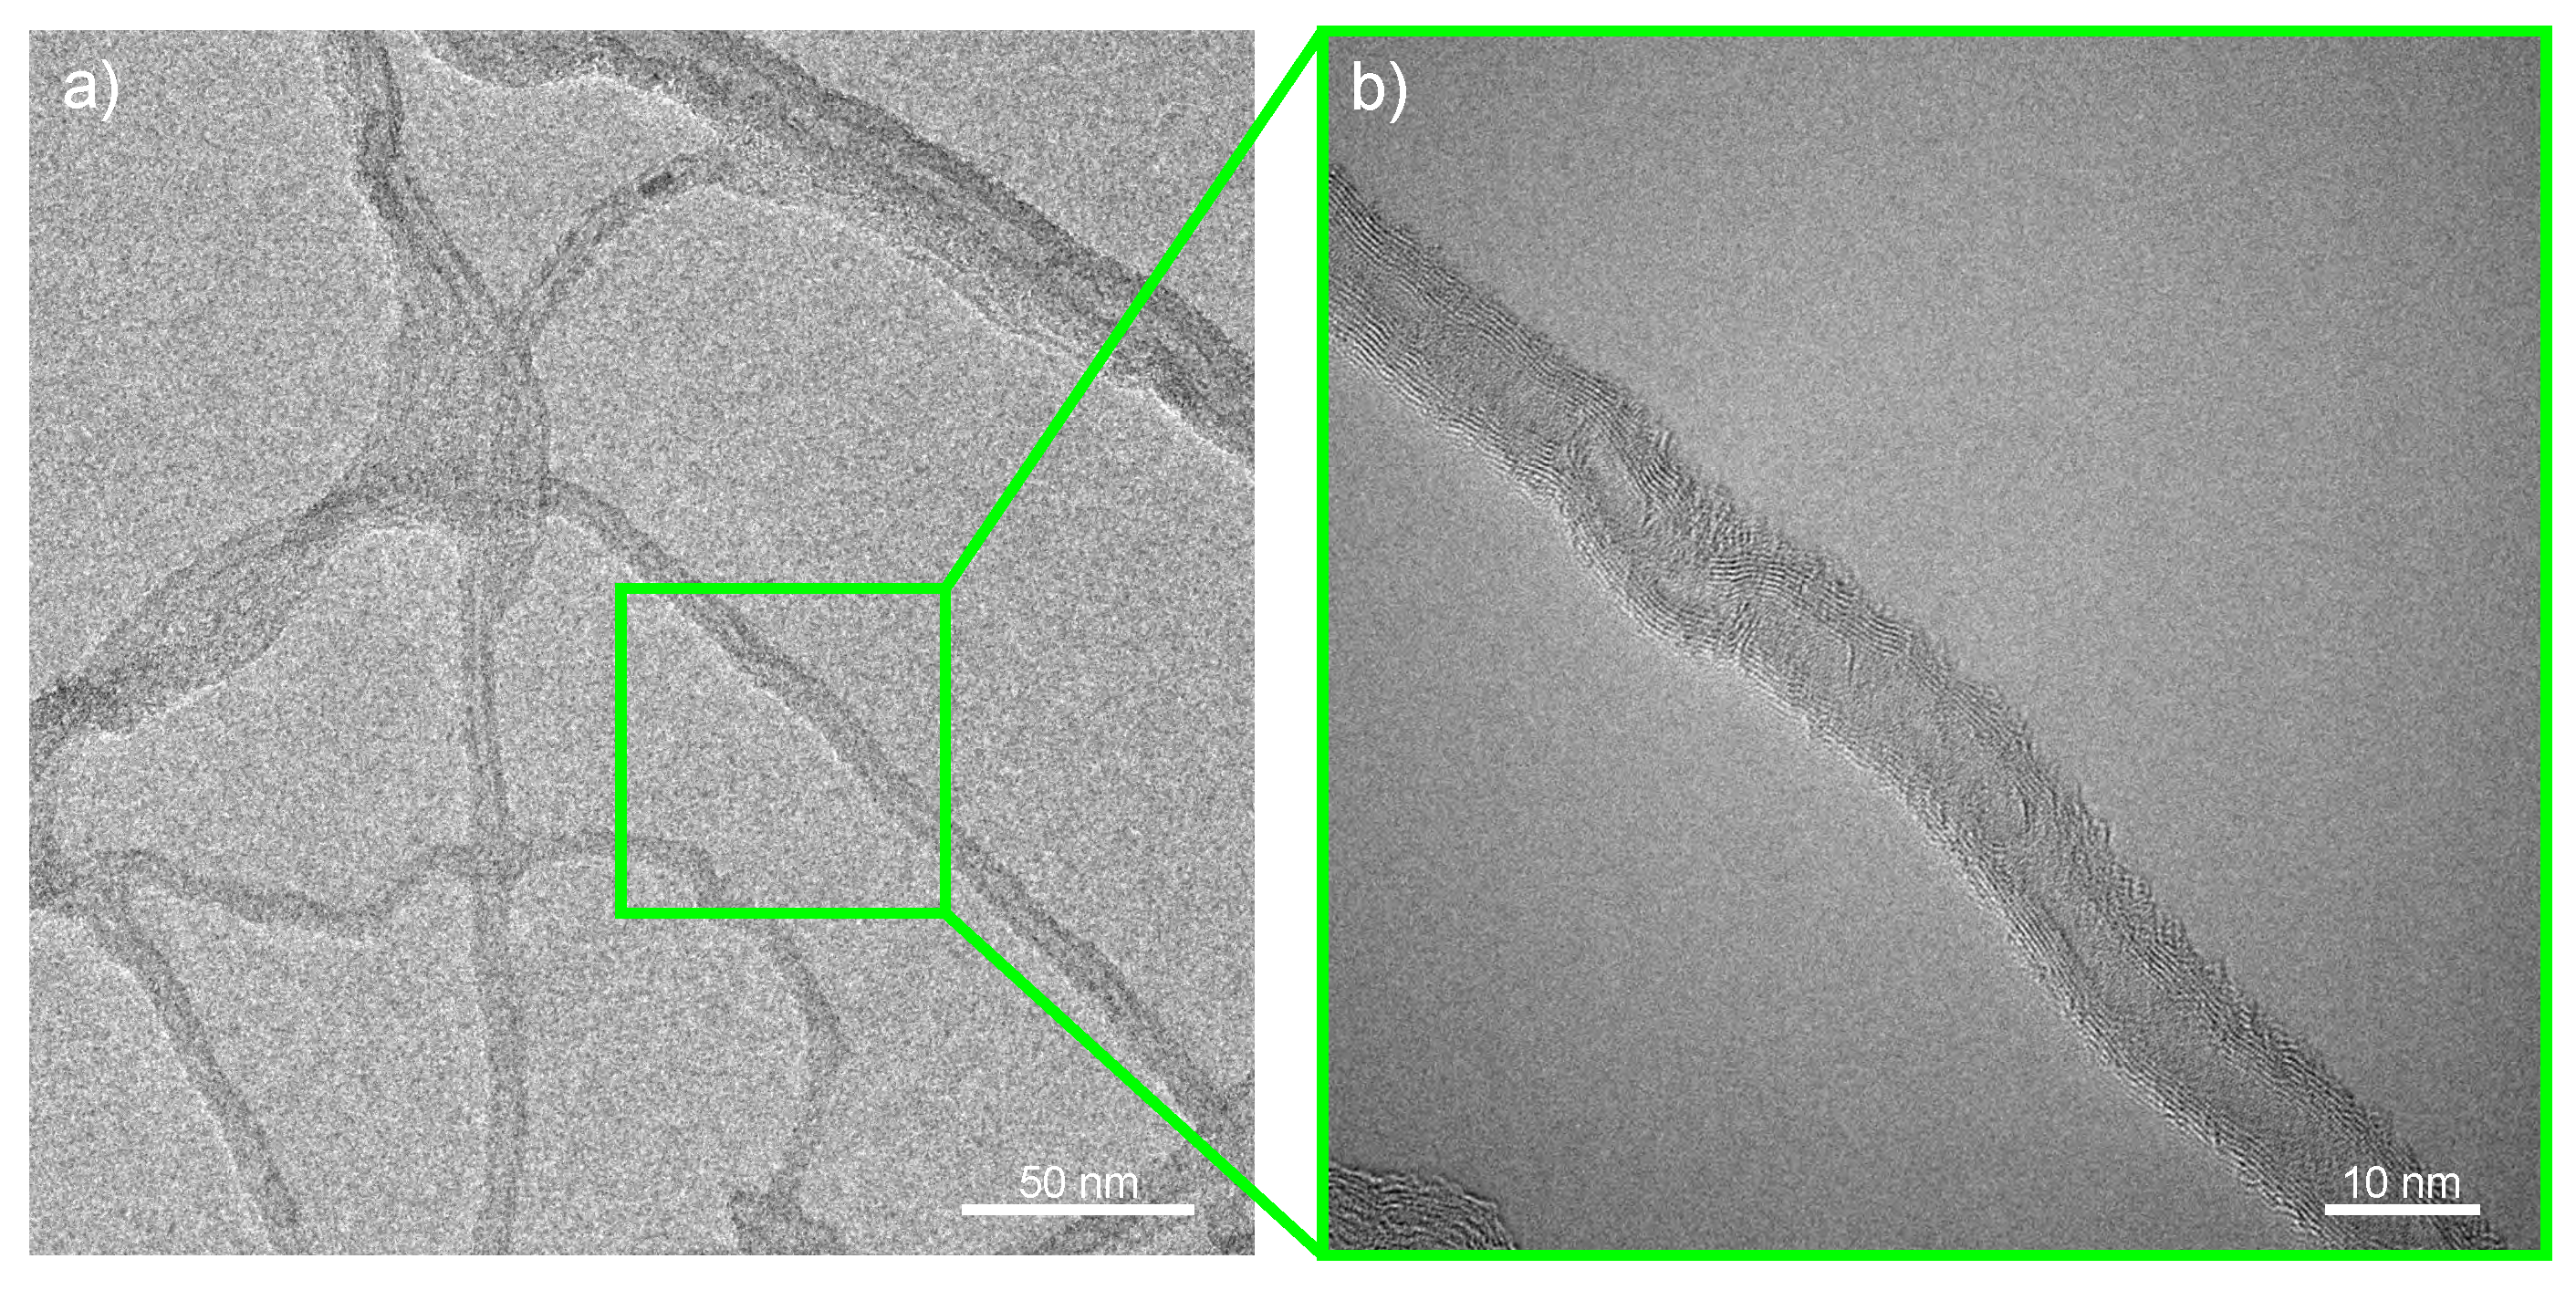
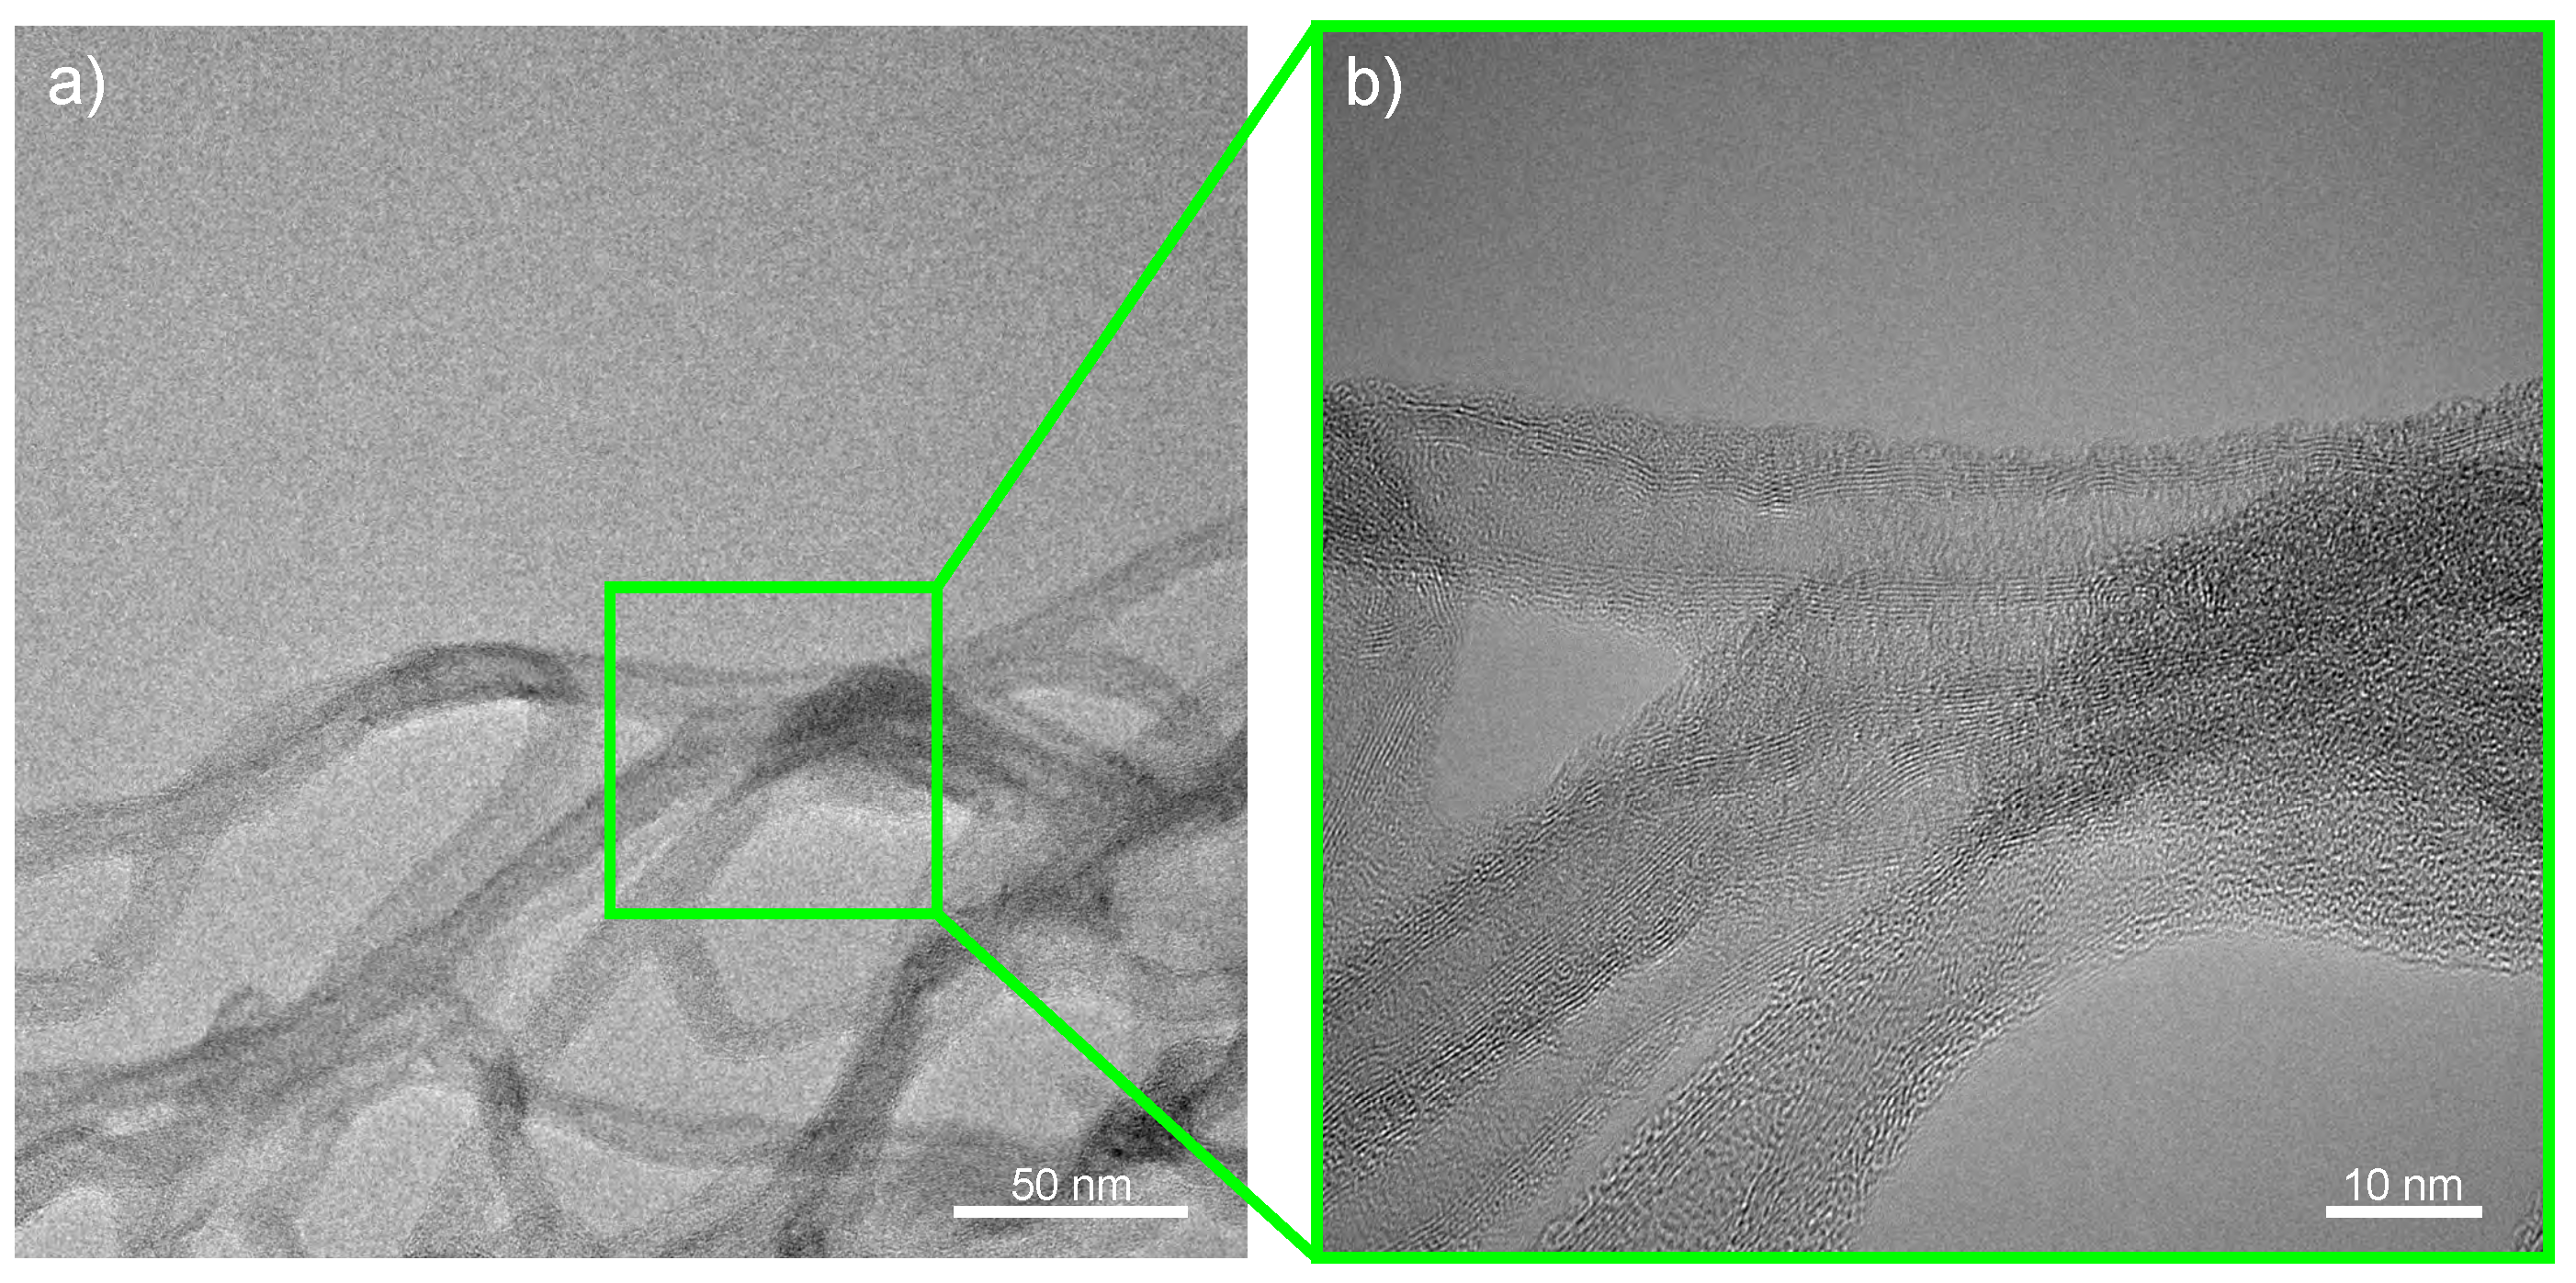
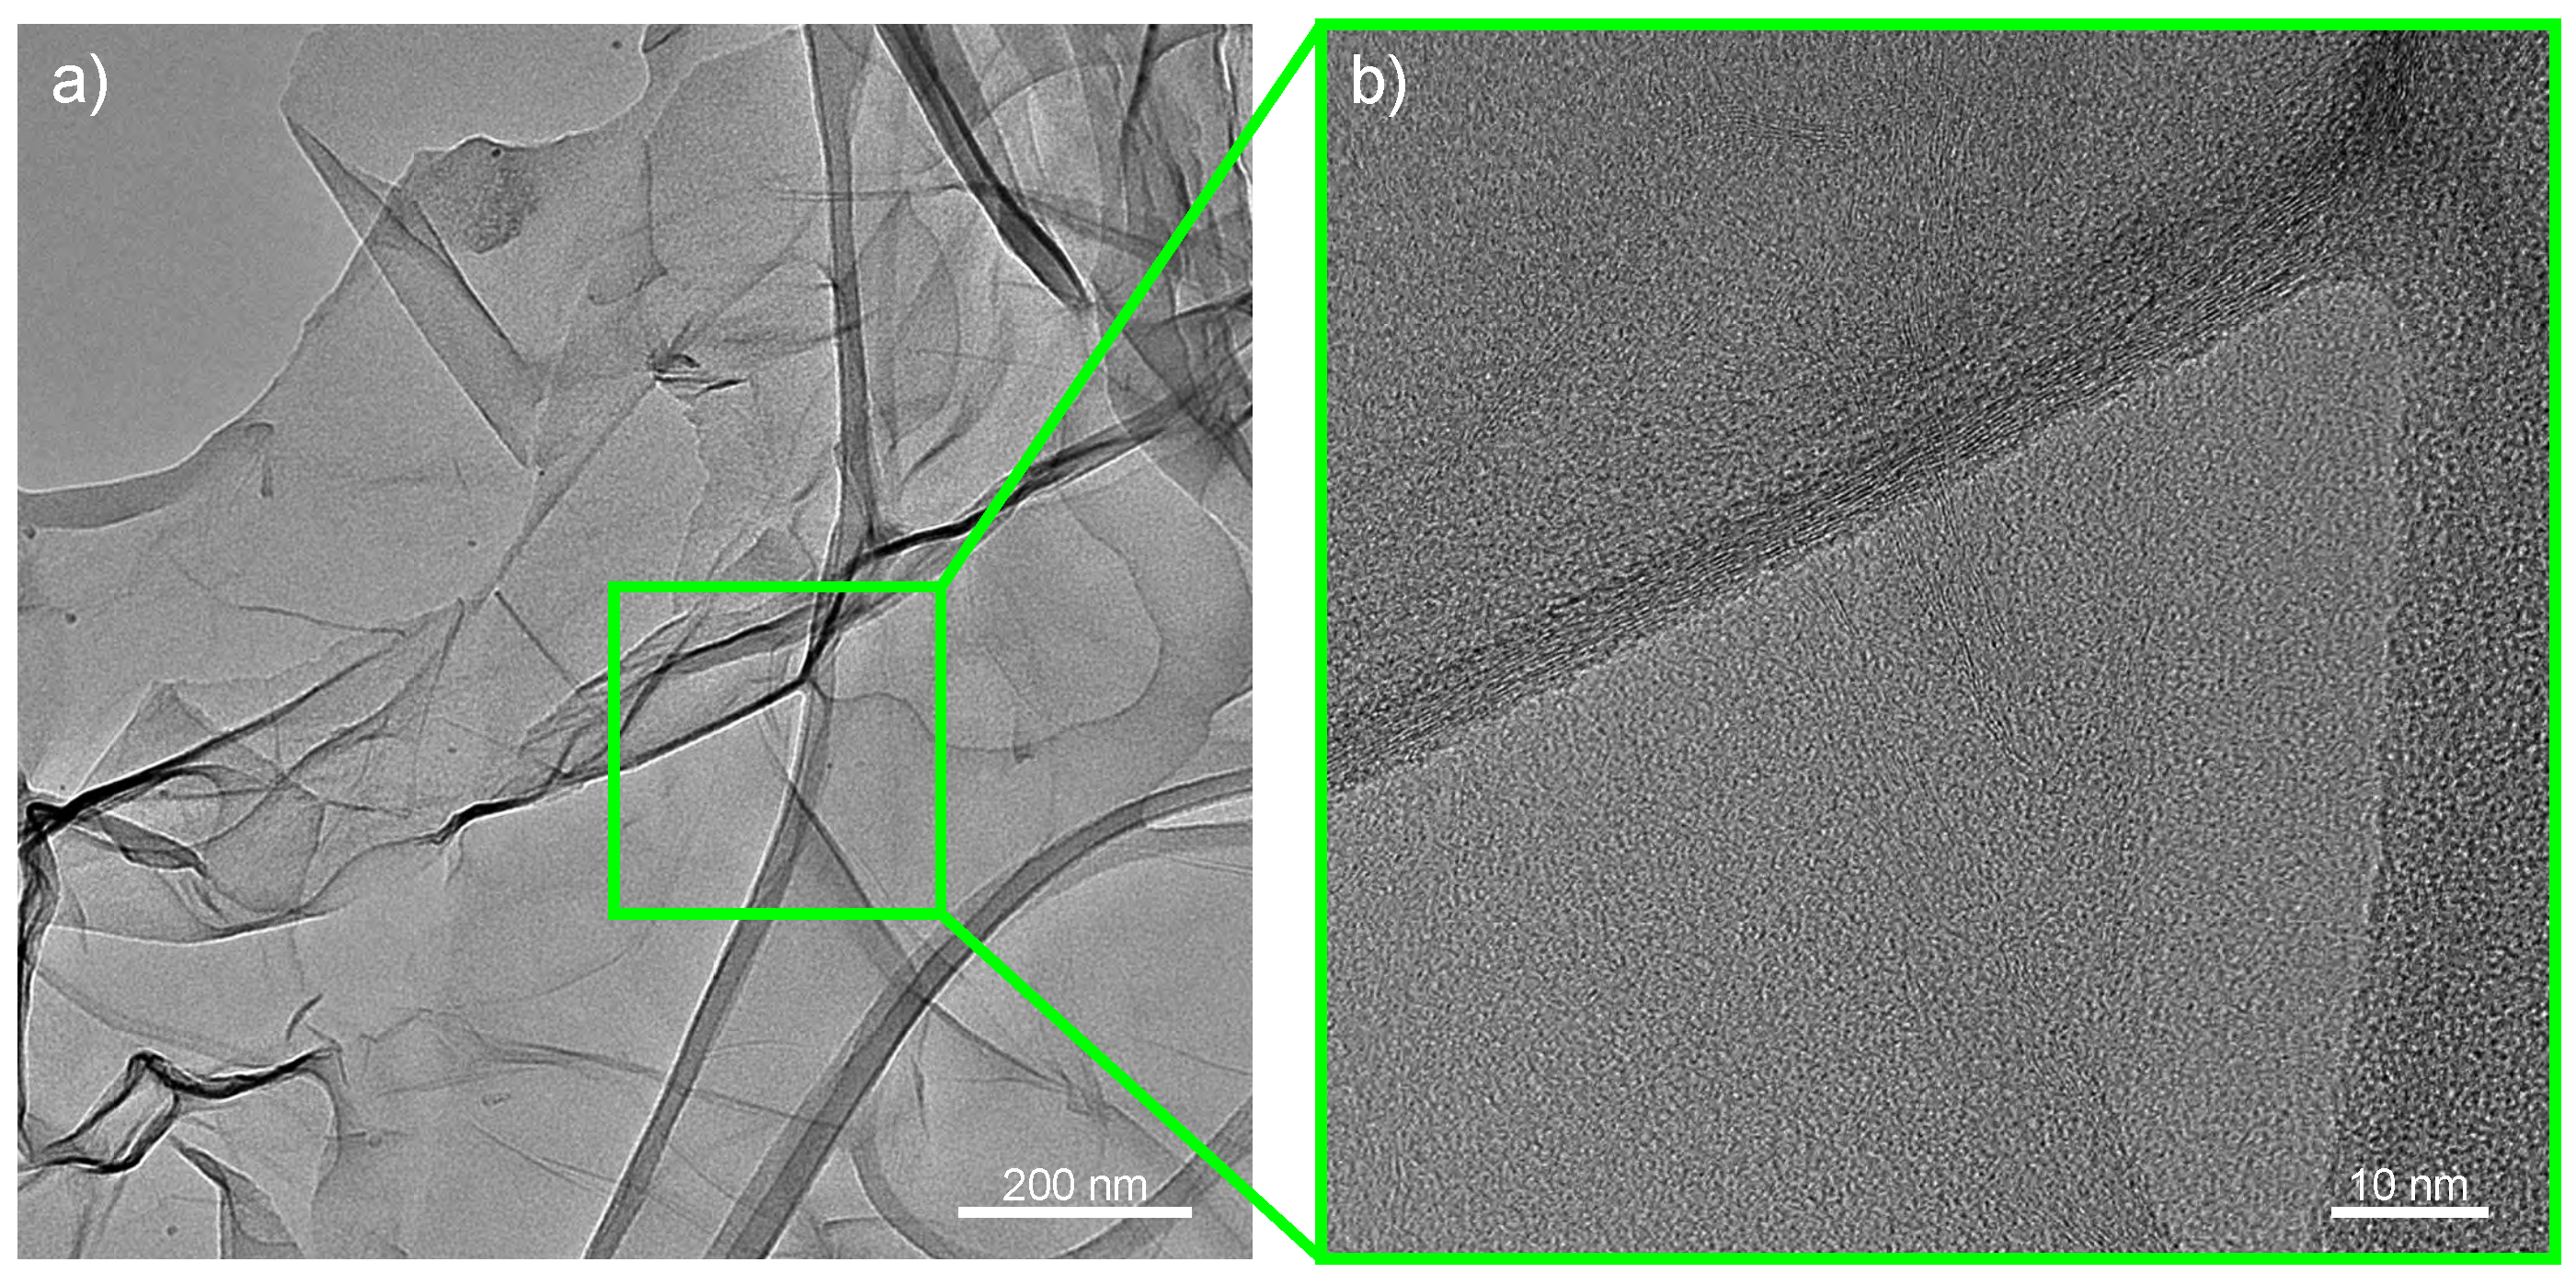
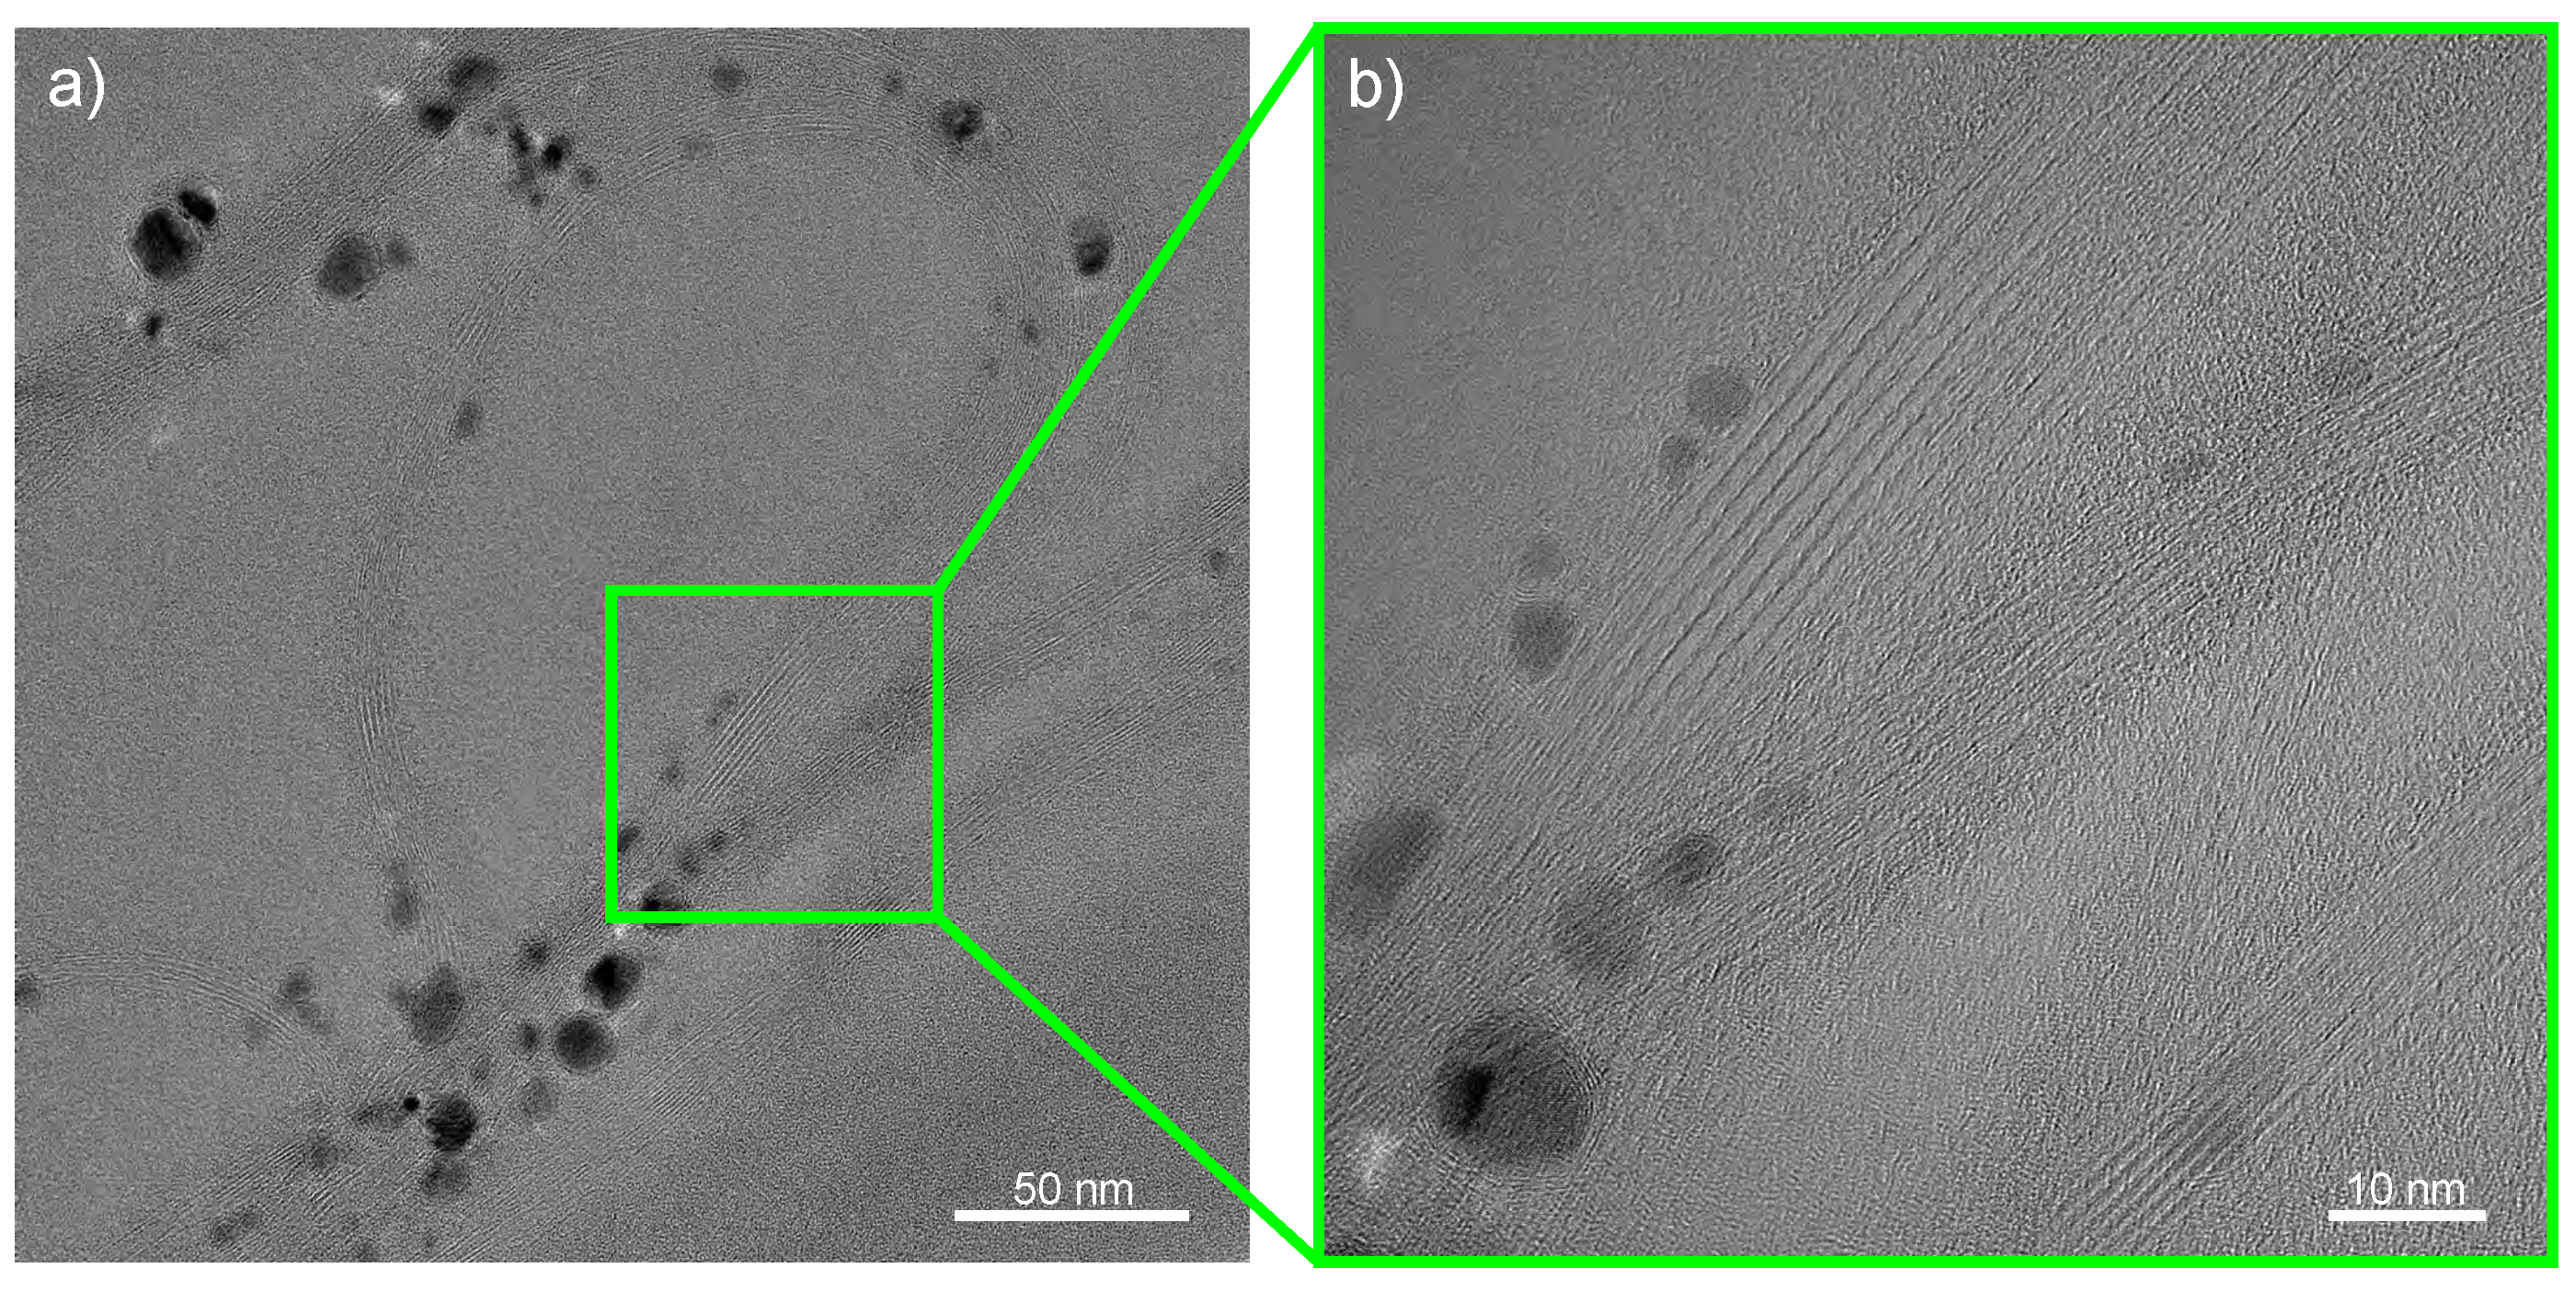
Appendix A. Morphological Characterization of Used Nanoparticles
Appendix A.1. Scanning Electron Microscopy


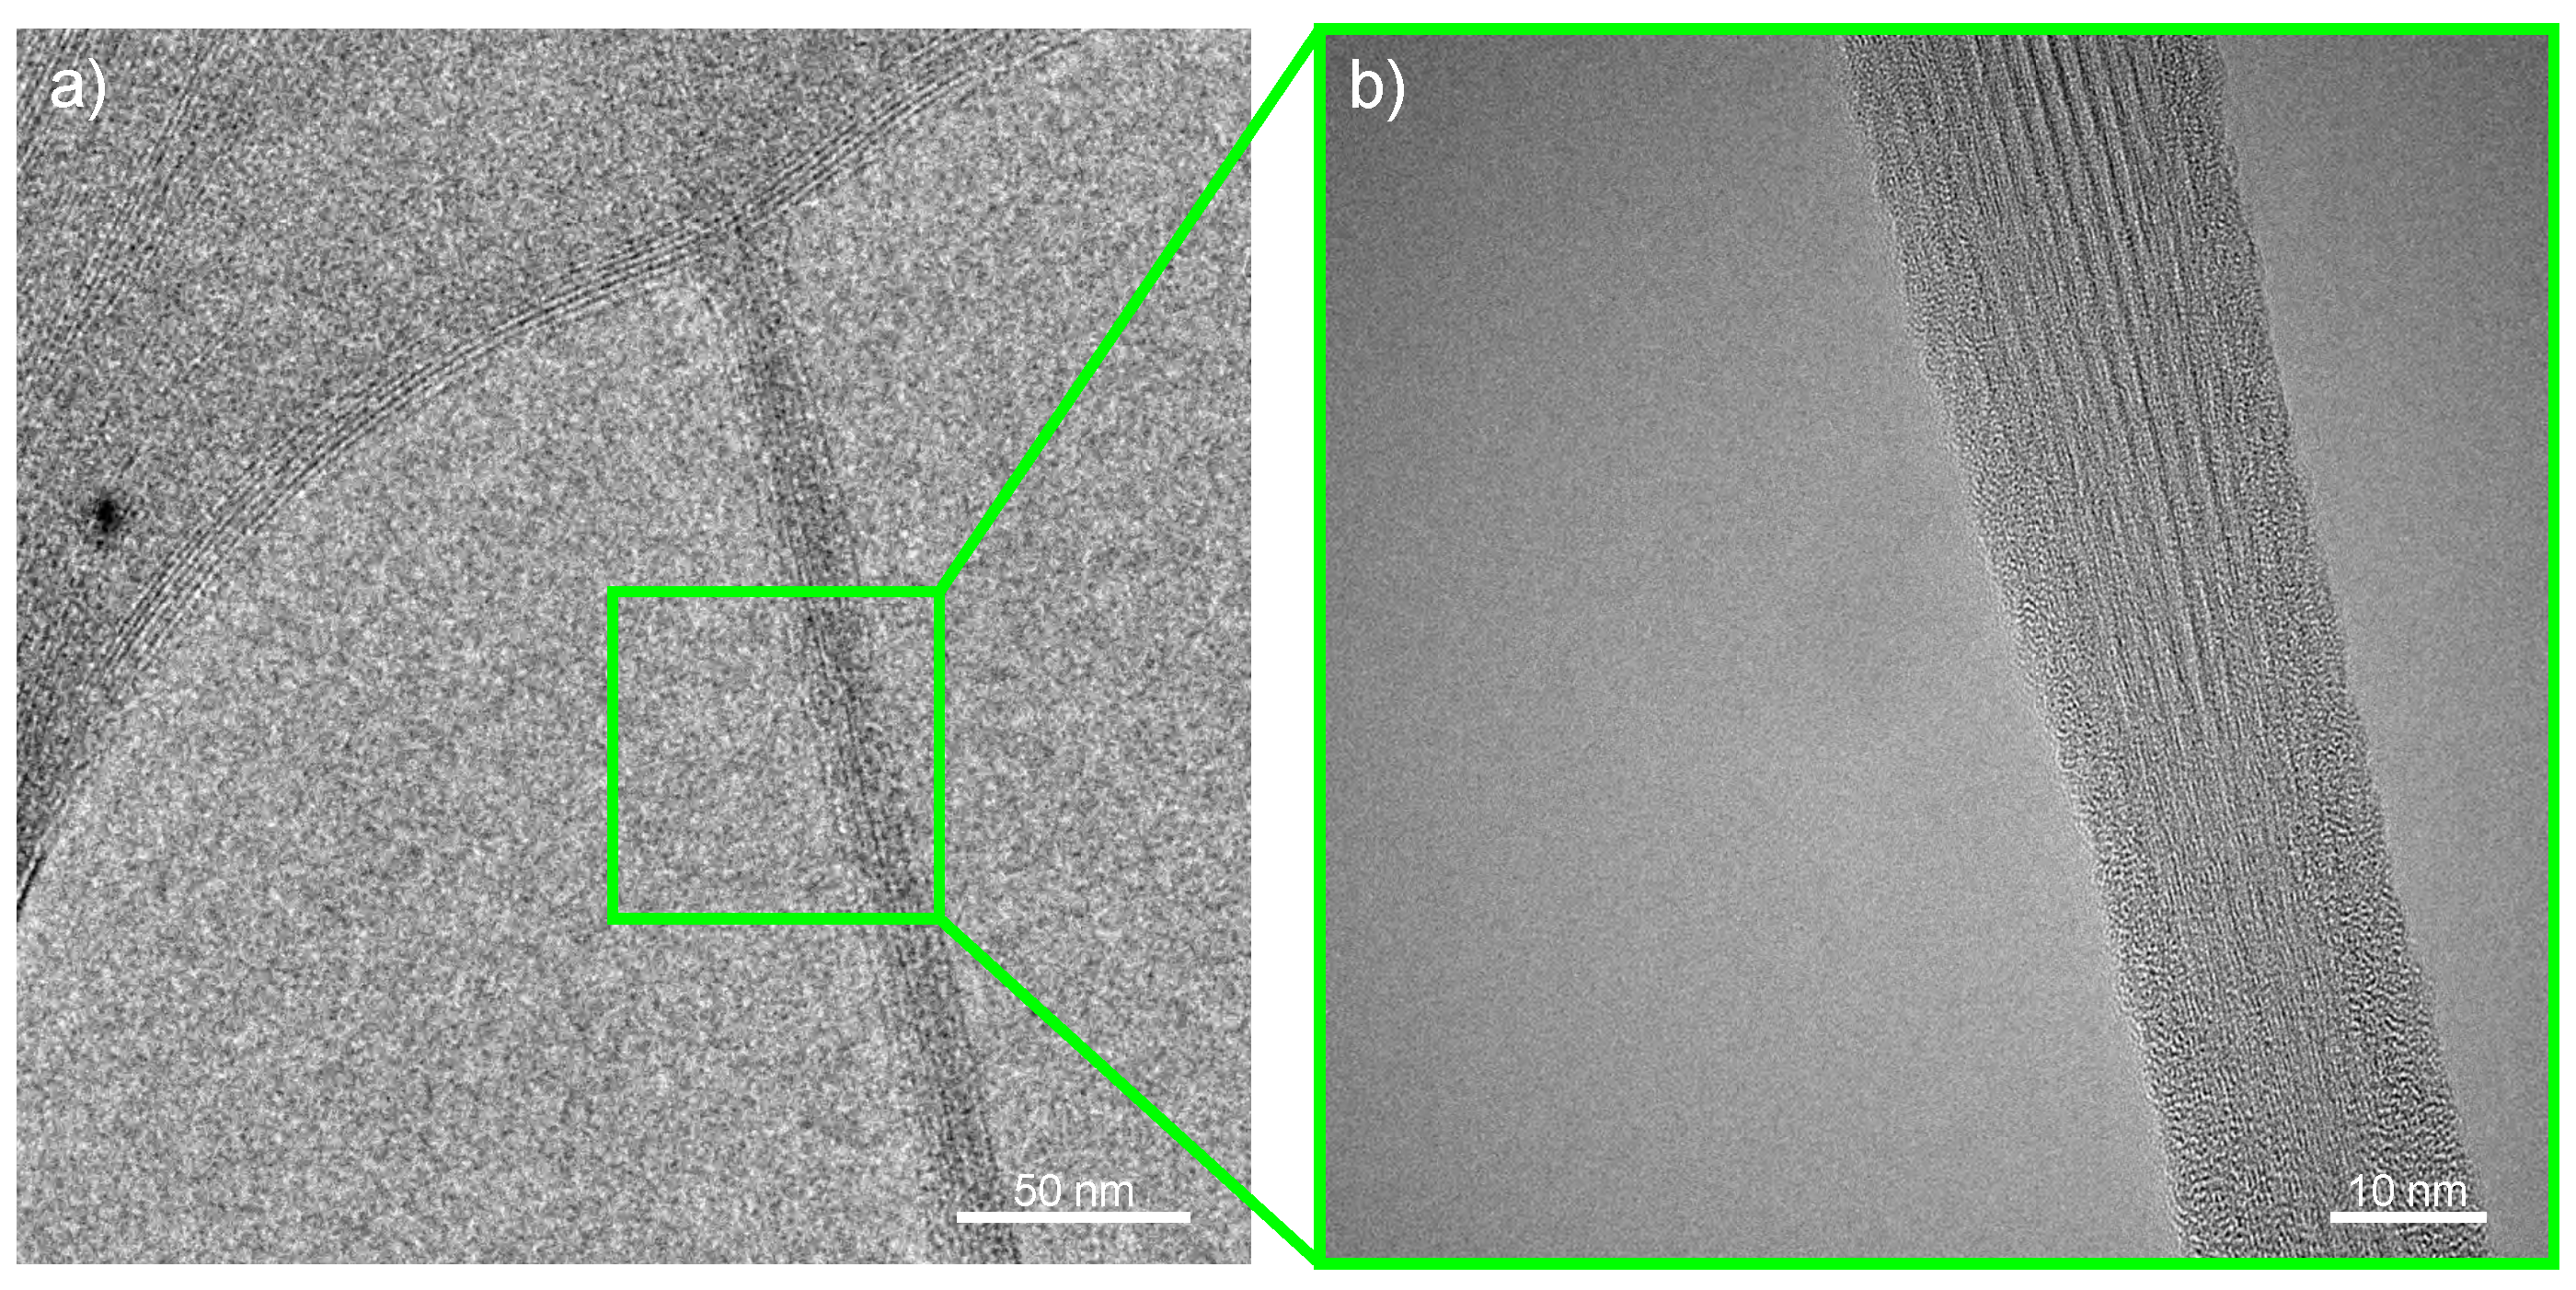
Appendix A.2. Transmission Electron Microscopy


References
- Müller, K.; Bugnicourt, E.; Latorre, M.; Jorda, M.; Echegoyen Sanz, Y.; Lagaron, J.M.; Miesbauer, O.; Bianchin, A.; Hankin, S.; Bölz, U.; et al. Review on the Processing and Properties of Polymer Nanocomposites and Nanocoatings and Their Applications in the Packaging, Automotive and Solar Energy Fields. Nanomaterials 2017, 7, 74. [Google Scholar] [CrossRef]
- Jin, F.L.; Li, X.; Park, S.J. Synthesis and application of epoxy resins: A review. J. Ind. Eng. Chem. 2015, 29, 1–11. [Google Scholar] [CrossRef]
- Haward, R.N.; Young, R.J. Physics of Glassy Polymers; Springer: Dordrecht, The Netherlands, 2012. [Google Scholar]
- Domun, N.; Paton, K.R.; Hadavinia, H.; Sainsbury, T.; Zhang, T.; Mohamud, H. Enhancement of Fracture Toughness of Epoxy Nanocomposites by Combining Nanotubes and Nanosheets as Fillers. Materials 2017, 10, 1179. [Google Scholar] [CrossRef] [PubMed]
- Domun, N.; Hadavinia, H.; Zhang, T.; Sainsbury, T.; Liaghat, G.H.; Vahid, S. Improving the fracture toughness and the strength of epoxy using nanomaterials—A review of the current status. Nanoscale 2015, 7, 10294–10329. [Google Scholar] [CrossRef] [PubMed]
- Shtein, M.; Nadiv, R.; Lachman, N.; Daniel Wagner, H.; Regev, O. Fracture behavior of nanotube–polymer composites: Insights on surface roughness and failure mechanism. Compos. Sci. Technol. 2013, 87, 157–163. [Google Scholar] [CrossRef]
- Nadiv, R.; Vasilyev, G.; Shtein, M.; Peled, A.; Zussman, E.; Regev, O. The multiple roles of a dispersant in nanocomposite systems. Compos. Sci. Technol. 2016, 133, 192–199. [Google Scholar] [CrossRef]
- Deng, F.; Zheng, Q.S. An analytical model of effective electrical conductivity of carbon nanotube composites. Appl. Phys. Lett. 2008, 92, 071902. [Google Scholar] [CrossRef]
- Meeuw, H.; Viets, C.; Liebig, W.V.; Schulte, K.; Fiedler, B. Morphological influence of carbon nanofillers on the piezoresistive response of carbon nanoparticle/epoxy composites under mechanical load. Eur. Polym. J. 2016, 85, 198–210. [Google Scholar] [CrossRef]
- Meeuw, H.; Radek, M.; Fiedler, B. Development of a colored GFRP with antistatic properties. AIP Conf. Proc. 2019, 2055, 090007. [Google Scholar] [CrossRef]
- Fan, Z.; Advani, S.G. Rheology of multiwall carbon nanotube suspensions. J. Rheol. 2007, 51, 585–604. [Google Scholar] [CrossRef]
- Rahatekar, S.S.; Koziol, K.K.K.; Butler, S.A.; Elliott, J.A.; Shaffer, M.S.P.; Mackley, M.R.; Windle, A.H. Optical microstructure and viscosity enhancement for an epoxy resin matrix containing multiwall carbon nanotubes. J. Rheol. 2006, 50, 599–610. [Google Scholar] [CrossRef]
- Reddy, C.S.; Zak, A.; Zussman, E. WS2 nanotubes embedded in PMMA nanofibers as energy absorptive material. J. Mater. Chem. 2011, 21, 16086. [Google Scholar] [CrossRef]
- Nadiv, R.; Shachar, G.; Peretz-Damari, S.; Varenik, M.; Levy, I.; Buzaglo, M.; Ruse, E.; Regev, O. Performance of nano-carbon loaded polymer composites: Dimensionality matters. Carbon 2018, 126, 410–418. [Google Scholar] [CrossRef]
- Nadiv, R.; Shtein, M.; Shachar, G.; Varenik, M.; Regev, O. Optimal nanomaterial concentration: Harnessing percolation theory to enhance polymer nanocomposite performance. Nanotechnology 2017, 28, 305701. [Google Scholar] [CrossRef] [PubMed]
- Chandrasekaran, S.; Liebig, W.V.; Mecklenburg, M.; Fiedler, B.; Smazna, D.; Adelung, R.; Schulte, K. Fracture, failure and compression behaviour of a 3D interconnected carbon aerogel (Aerographite) epoxy composite. Compos. Sci. Technol. 2016, 122, 50–58. [Google Scholar] [CrossRef]
- Chandrasekaran, S.; Sato, N.; Tölle, F.; Mülhaupt, R.; Fiedler, B.; Schulte, K. Fracture toughness and failure mechanism of graphene based epoxy composites. Compos. Sci. Technol. 2014, 97, 90–99. [Google Scholar] [CrossRef]
- Chandrasekaran, S.; Seidel, C.; Schulte, K. Preparation and characterization of graphite nano-platelet (GNP)/epoxy nano-composite: Mechanical, electrical and thermal properties. Eur. Polym. J. 2013, 49, 3878–3888. [Google Scholar] [CrossRef]
- Ayatollahi, M.R.; Shadlou, S.; Shokrieh, M.M. Fracture toughness of epoxy/multi-walled carbon nanotube nano-composites under bending and shear loading conditions. Mater. Des. 2011, 32, 2115–2124. [Google Scholar] [CrossRef]
- Ayatollahi, M.R.; Shadlou, S.; Shokrieh, M.M. Mixed mode brittle fracture in epoxy/multi-walled carbon nanotube nanocomposites. Eng. Fract. Mech. 2011, 78, 2620–2632. [Google Scholar] [CrossRef]
- Zappalorto, M.; Salviato, M.; Quaresimin, M. Mixed mode (I+II) fracture toughness of polymer nanoclay nanocomposites. Eng. Fract. Mech. 2013, 111, 50–64. [Google Scholar] [CrossRef]
- Shadlou, S.; Alishahi, E.; Ayatollahi, M.R. Fracture behavior of epoxy nanocomposites reinforced with different carbon nano-reinforcements. Compos. Struct. 2013, 95, 577–581. [Google Scholar] [CrossRef]
- Quan, D.; Urdániz, J.L.; Ivanković, A. Enhancing mode-I and mode-II fracture toughness of epoxy and carbon fibre reinforced epoxy composites using multi-walled carbon nanotubes. Mater. Des. 2018, 143, 81–92. [Google Scholar] [CrossRef]
- Ahmadi-Moghadam, B.; Taheri, F. Fracture and toughening mechanisms of GNP-based nanocomposites in modes I and II fracture. Eng. Fract. Mech. 2014, 131, 329–339. [Google Scholar] [CrossRef]
- Benra, J.; Forero, S. Epoxy resins reinforced with carbon nanotubes. Lightweight Des. Worldw. 2018, 11, 6–11. [Google Scholar] [CrossRef]
- Parvez, K.; Wu, Z.S.; Li, R.; Liu, X.; Graf, R.; Feng, X.; Müllen, K. Exfoliation of graphite into graphene in aqueous solutions of inorganic salts. J. Am. Chem. Soc. 2014, 136, 6083–6091. [Google Scholar] [CrossRef]
- Meeuw, H.; Körbelin, J.; von Bernstorff, D.; Augustin, T.; Liebig, W.V.; Fiedler, B. Smart dispersion: Validation of OCT and impedance spectroscopy as solutions for in-situ dispersion analysis of CNP/EP-composites. Materialia 2018. [Google Scholar] [CrossRef]
- Meeuw, H.; Wisniewski, V.K.; Köpke, U.; Nia, A.S.; Vázquez, A.R.; Lohe, M.; Feng, X.; Fiedler, B. In-line monitoring of carbon nanoparticle epoxy dispersion processes: Insights into the process via next generation three roll mills and impedance spectroscopy. Prod. Eng. 2019. [Google Scholar] [CrossRef]
- Meeuw, H.; Wisniewski, V.; Fiedler, B. Frequency or Amplitude?—Rheo-Electrical Characterization of Carbon Nanoparticle Filled Epoxy Systems. Polymers 2018, 10, 999. [Google Scholar] [CrossRef]
- Fett, T. Stress intensity factors for edge crack subjected to mixed mode four-point bending. Theor. Appl. Fract. Mech. 1991, 15, 99–104. [Google Scholar] [CrossRef]
- Araki, W.; Nemoto, K.; Adachi, T.; Yamaji, A. Fracture toughness for mixed mode I/II of epoxy resin. Acta Mater. 2005, 53, 869–875. [Google Scholar] [CrossRef]
- Kalthoff, J.F. Failure methodology of mode II loaded crack. Strength Fract. Complex. 2003, 1, 121–138. [Google Scholar]
- Bergmannshoff, D. Das Instabilitätsverhalten Zug-/scherbeanspruchter Risse bei Variation des Belastungs-pfades. Ph.D. Dissertation, Ruhr-Universität Bochum, Bochum, Germany, 2006. [Google Scholar]
- American Society for Testing and Materials. Test Methods for Plane-Strain Fracture Toughness and Strain Energy Release Rate of Plastic Materials; ASTM Standard D045-14; ASTM International: West Conshohocken, PA, USA, 2014. [Google Scholar] [CrossRef]
- Xiao, K.; Ye, L.; Kwok, Y.S. Effects of pre-cracking methods on fracture behaviour of an Araldite-F epoxy and its rubber-modified systems. J. Mater. Sci. 1998, 33, 2831–2836. [Google Scholar] [CrossRef]
- de Souza, J.M.; Yoshimura, H.N.; Peres, F.M.; Schön, C.G. Effect of sample pre-cracking method and notch geometry in plane strain fracture toughness tests as applied to a PMMA resin. Polym. Test. 2012, 31, 834–840. [Google Scholar] [CrossRef]
- Kuppusamy, N.; Tomlinson, R.A. Repeatable pre-cracking preparation for fracture testing of polymeric materials. Eng. Fract. Mech. 2016, 152, 81–87. [Google Scholar] [CrossRef]
- Haddadi, E.; Choupani, N.; Abbasi, F. Investigation on the Effect of Different Pre-Cracking Methods on Fracture Toughness of RT-PMMA. Lat. Am. J. Solids Struct. 2016, 13, 2012–2026. [Google Scholar] [CrossRef]
- Sumfleth, J.; Adroher, X.C.; Schulte, K. Synergistic effects in network formation and electrical properties of hybrid epoxy nanocomposites containing multi-wall carbon nanotubes and carbon black. J. Mater. Sci. 2009, 44, 3241–3247. [Google Scholar] [CrossRef]
- Martin, C.A.; Sandler, J.; Shaffer, M.; Schwarz, M.K.; Bauhofer, W.; Schulte, K.; Windle, A.H. Formation of percolating networks in multi-wall carbon-nanotube—Epoxy composites. Compos. Sci. Technol. 2004, 64, 2309–2316. [Google Scholar] [CrossRef]
- Feng, C.; Jiang, L. Micromechanics modeling of the electrical conductivity of carbon nanotube (CNT)—Polymer nanocomposites. Compos. Part A Appl. Sci. Manuf. 2013, 47, 143–149. [Google Scholar] [CrossRef]
- Seidel, G.D.; Lagoudas, D.C. A Micromechanics Model for the Electrical Conductivity of Nanotube-Polymer Nanocomposites. J. Compos. Mater. 2009, 43, 917–941. [Google Scholar] [CrossRef]
- Bauhofer, W.; Kovacs, J.Z. A review and analysis of electrical percolation in carbon nanotube polymer composites. Compos. Sci. Technol. 2009, 69, 1486–1498. [Google Scholar] [CrossRef]
- Prolongo, M.G.; Salom, C.; Arribas, C.; Sánchez-Cabezudo, M.; Masegosa, R.M.; Prolongo, S.G. Influence of graphene nanoplatelets on curing and mechanical properties of graphene/epoxy nanocomposites. J. Therm. Anal. Calorim. 2016, 125, 629–636. [Google Scholar] [CrossRef]
- Liu, C.; Huang, Y.; Stout, M.G. Enhanced mode-II fracture toughness of an epoxy resin due to shear banding. Acta Mater. 1998, 46, 5647–5661. [Google Scholar] [CrossRef]
- Fritsch, D.; Wittich, H.; Fiedler, B. Graphene Modified CFRP for Enhanced Damage Behavior. In Proceedings of the ECCM17—17th European Conference on Composite Materials, Munich, Germany, 26–30 June 2016; MAI Carbon Cluster Management GmbH: Augsburg, Germany, 2016. ISBN 978-300053387-7. [Google Scholar]
- Carpinteri, A.; Valente, S.; Ferrara, G.; Melchiorrl, G. Is mode II fracture energy a real material property? Comput. Struct. 1993, 48, 397–413. [Google Scholar] [CrossRef]
- Ramsteiner, F. An approach towards understanding model II failure of poly(methyl methacrylate). Polymer 1993, 34, 312–317. [Google Scholar] [CrossRef]
- Kinloch, A.J.; Young, R.J. Fracture Behaviour of Polymers; Springer: Dordrecht, The Netherlands, 2013. [Google Scholar]
- Dekkers, M.E.J.; Heikens, D. Crazing and shear deformation in glass bead-filled glassy polymers. J. Mater. Sci. 1985, 20, 3873–3880. [Google Scholar] [CrossRef]
- Zhang, W.; Srivastava, I.; Zhu, Y.F.; Picu, C.R.; Koratkar, N.A. Heterogeneity in epoxy nanocomposites initiates crazing: Significant improvements in fatigue resistance and toughening. Small 2009, 5, 1403–1407. [Google Scholar] [CrossRef] [PubMed]


| Resin | Type | Epoxy Equivalent Weight in g/eq | Epoxy Group Content in mmol/kg | Viscosity at 25 °C in Pas | Physical State | Remarks |
|---|---|---|---|---|---|---|
| 162 | DGEBA | 170–174 | 5744–5883 | 4.0–5.0 | Liquid | Distilled, high purity grade |
| 827 | DGEBA | 179–184 | 5430–5590 | 8.0–10.0 | Liquid | Low viscosity |
| 828LVEL | DGEBA | 182–187 | 5340–5500 | 10.0–12.0 | Liquid | Low hydrolyzable chlorine, low viscosity |
| 828 | DGEBA | 184–190 | 5260–5420 | 12.0–14.0 | Liquid | Standard unmodified bisphenol A resin |
| Nanoparticle | BET Surface Area in m2/g | Layers, Walls or Bundle Size | Aspect Ratio | Shape | Diameter or Thickness in nm | TGA Impurities in wt.% | EDX Composition in wt.% |
|---|---|---|---|---|---|---|---|
| Printex L | 125 | amorphous | 1 | spherical | 0.25 | C (96.51), O (2.69), S (0.80) | |
| NC7000 | 321 | 150 | cylindrical | 9.17 | C (92.15), O (5.96), Al (1.81), Si (0.08) | ||
| CNTB | 319 | 150 | cylindrical | 10.35 | C (85.34), O (8.78), Al (5.07), Fe (0.36), Co (0.22), Si (0.15), S (0.08) | ||
| CNTA | 296 | 150 | cylindrical | 10.64 | C (88.77), O (7.97), Al (2.73), Fe (0.24), Si (0.14), S (0.07) | ||
| CNTP | 312 | 150 | cylindrical | 7.84 | C (85.39), O (11.89), Al (1.79), Si (0.44), S (0.25), Na (0.25) | ||
| CNTN | N/A | N/A | N/A | cylindrical | N/A | 4.39 | C (90.53), N (4.78), O (4.21), Al (0.37), Cl (0.11) |
| Tuball 75 | 605 | 3570 | cylindrical | 17.98 | C (81.96), Fe (15.01), O (2.26), Si (0.44), S (0.32) | ||
| Tuball purified | 598 | 3570 | cylindrical | 2.09 | C (90.61), O (6.36), Si (1.74), Cl (1.03), Fe (0.26) | ||
| FLG (Avan2) | 128 | 6250 | planar | 5.81 | C (88.33), O (9.15), Mn (0.65), Si (0.62), S (0.35), Al (0.32), Fe (0.24), Na (0.22), Cl (0.08), Ca (0.06) | ||
| ExG | 18 | 525 | planar | 10.90 | C (88.08), O (11.02), S (0.45), Cu (0.25), Si (0.12), Na (0.08) |
| Step | Gap1 in m | Gap2 in m | n1 in Rpm | n2 in Rpm | n3 in Rpm |
|---|---|---|---|---|---|
| 1 | 120 | 40 | 50 | 150 | 450 |
| 2 | 40 | 13 | 50 | 150 | 450 |
| 3–7 | 13 | 5 | 50 | 150 | 450 |
| B | W | |||
|---|---|---|---|---|
| 3.9 mm | 7.8 mm | 3.9 mm | 19.5 mm | 3.9 mm |
| W | ||||
|---|---|---|---|---|
| 3.9 mm | 7.8 mm | 3.9 mm | 15.6 mm | 31.2 mm |
© 2019 by the authors. Licensee MDPI, Basel, Switzerland. This article is an open access article distributed under the terms and conditions of the Creative Commons Attribution (CC BY) license (http://creativecommons.org/licenses/by/4.0/).
Share and Cite
Meeuw, H.; Körbelin, J.; Wisniewski, V.K.; Nia, A.S.; Vázquez, A.R.; Lohe, M.R.; Feng, X.; Fiedler, B. Carbon Nanoparticles’ Impact on Processability and Physical Properties of Epoxy Resins—A Comprehensive Study Covering Rheological, Electrical, Thermo-Mechanical, and Fracture Properties (Mode I and II). Polymers 2019, 11, 231. https://doi.org/10.3390/polym11020231
Meeuw H, Körbelin J, Wisniewski VK, Nia AS, Vázquez AR, Lohe MR, Feng X, Fiedler B. Carbon Nanoparticles’ Impact on Processability and Physical Properties of Epoxy Resins—A Comprehensive Study Covering Rheological, Electrical, Thermo-Mechanical, and Fracture Properties (Mode I and II). Polymers. 2019; 11(2):231. https://doi.org/10.3390/polym11020231
Chicago/Turabian StyleMeeuw, Hauke, Johann Körbelin, Valea Kim Wisniewski, Ali Shaygan Nia, Adrián Romaní Vázquez, Martin Rudolf Lohe, Xinliang Feng, and Bodo Fiedler. 2019. "Carbon Nanoparticles’ Impact on Processability and Physical Properties of Epoxy Resins—A Comprehensive Study Covering Rheological, Electrical, Thermo-Mechanical, and Fracture Properties (Mode I and II)" Polymers 11, no. 2: 231. https://doi.org/10.3390/polym11020231
APA StyleMeeuw, H., Körbelin, J., Wisniewski, V. K., Nia, A. S., Vázquez, A. R., Lohe, M. R., Feng, X., & Fiedler, B. (2019). Carbon Nanoparticles’ Impact on Processability and Physical Properties of Epoxy Resins—A Comprehensive Study Covering Rheological, Electrical, Thermo-Mechanical, and Fracture Properties (Mode I and II). Polymers, 11(2), 231. https://doi.org/10.3390/polym11020231