Quantitative Pore Characterization of Polyurethane Foam with Cost-Effective Imaging Tools and Image Analysis: A Proof-Of-Principle Study

 , ,
, ,
Abstract
:1. Introduction
2. Theory
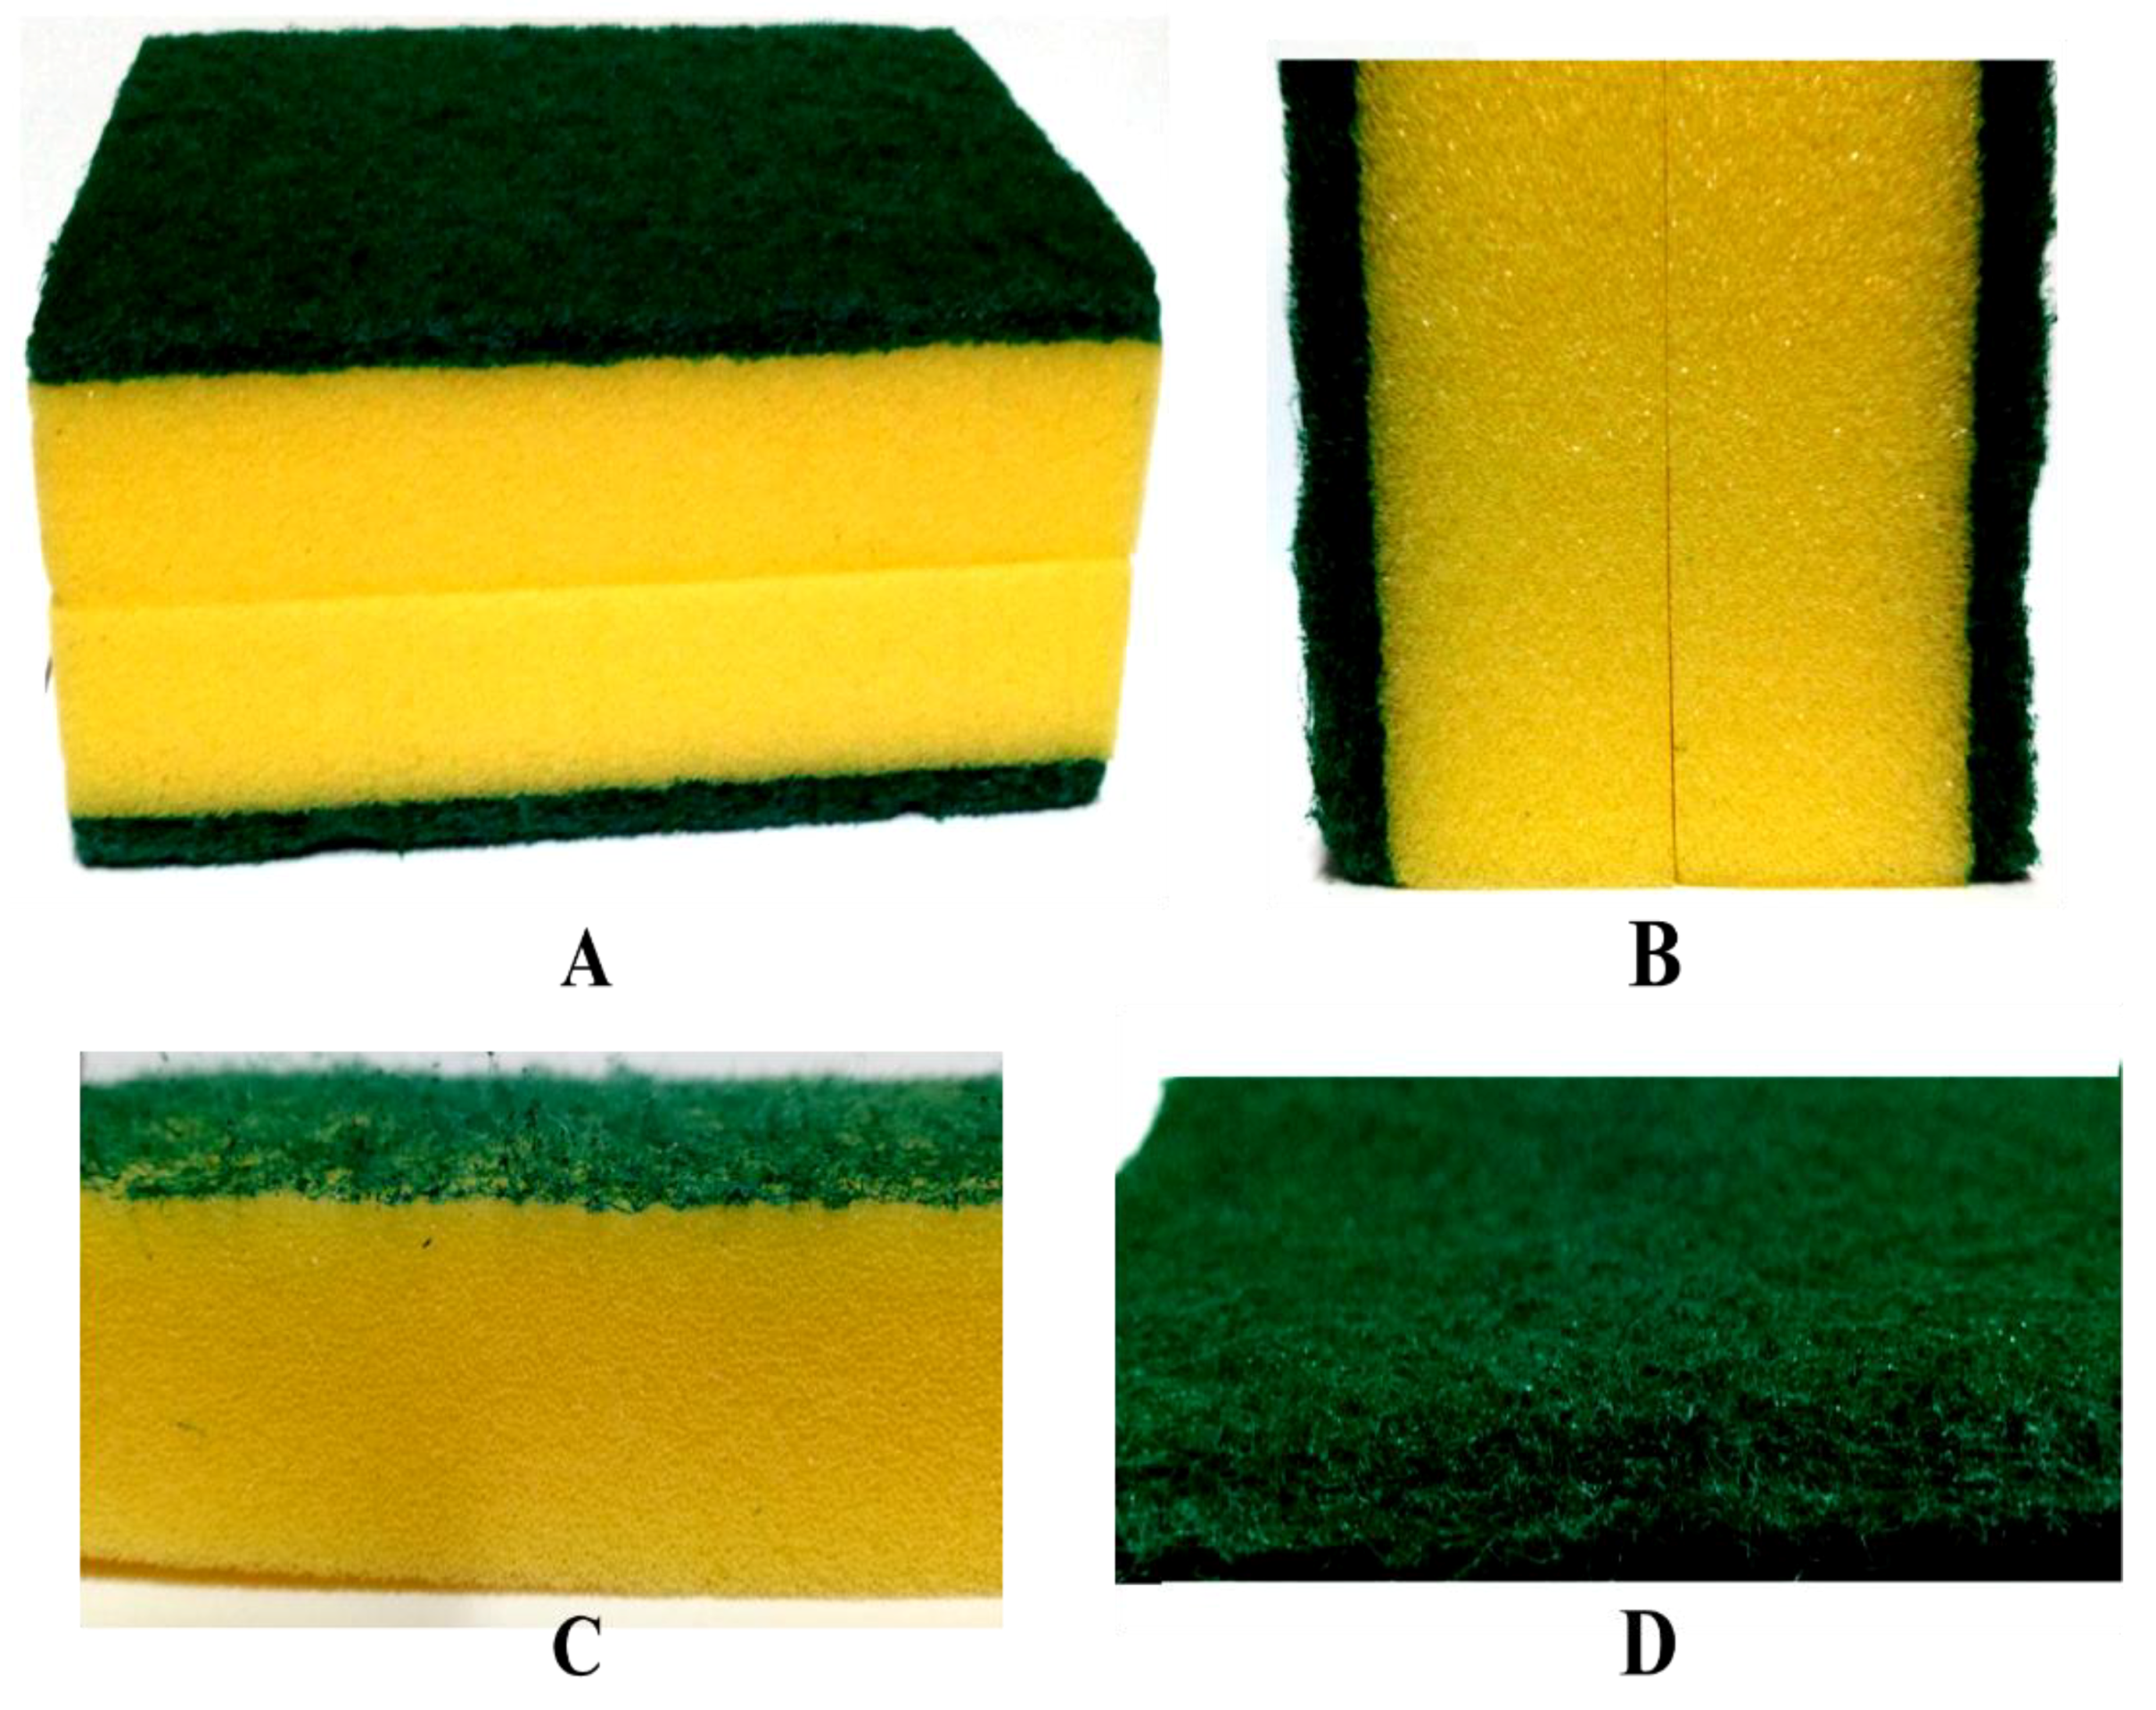
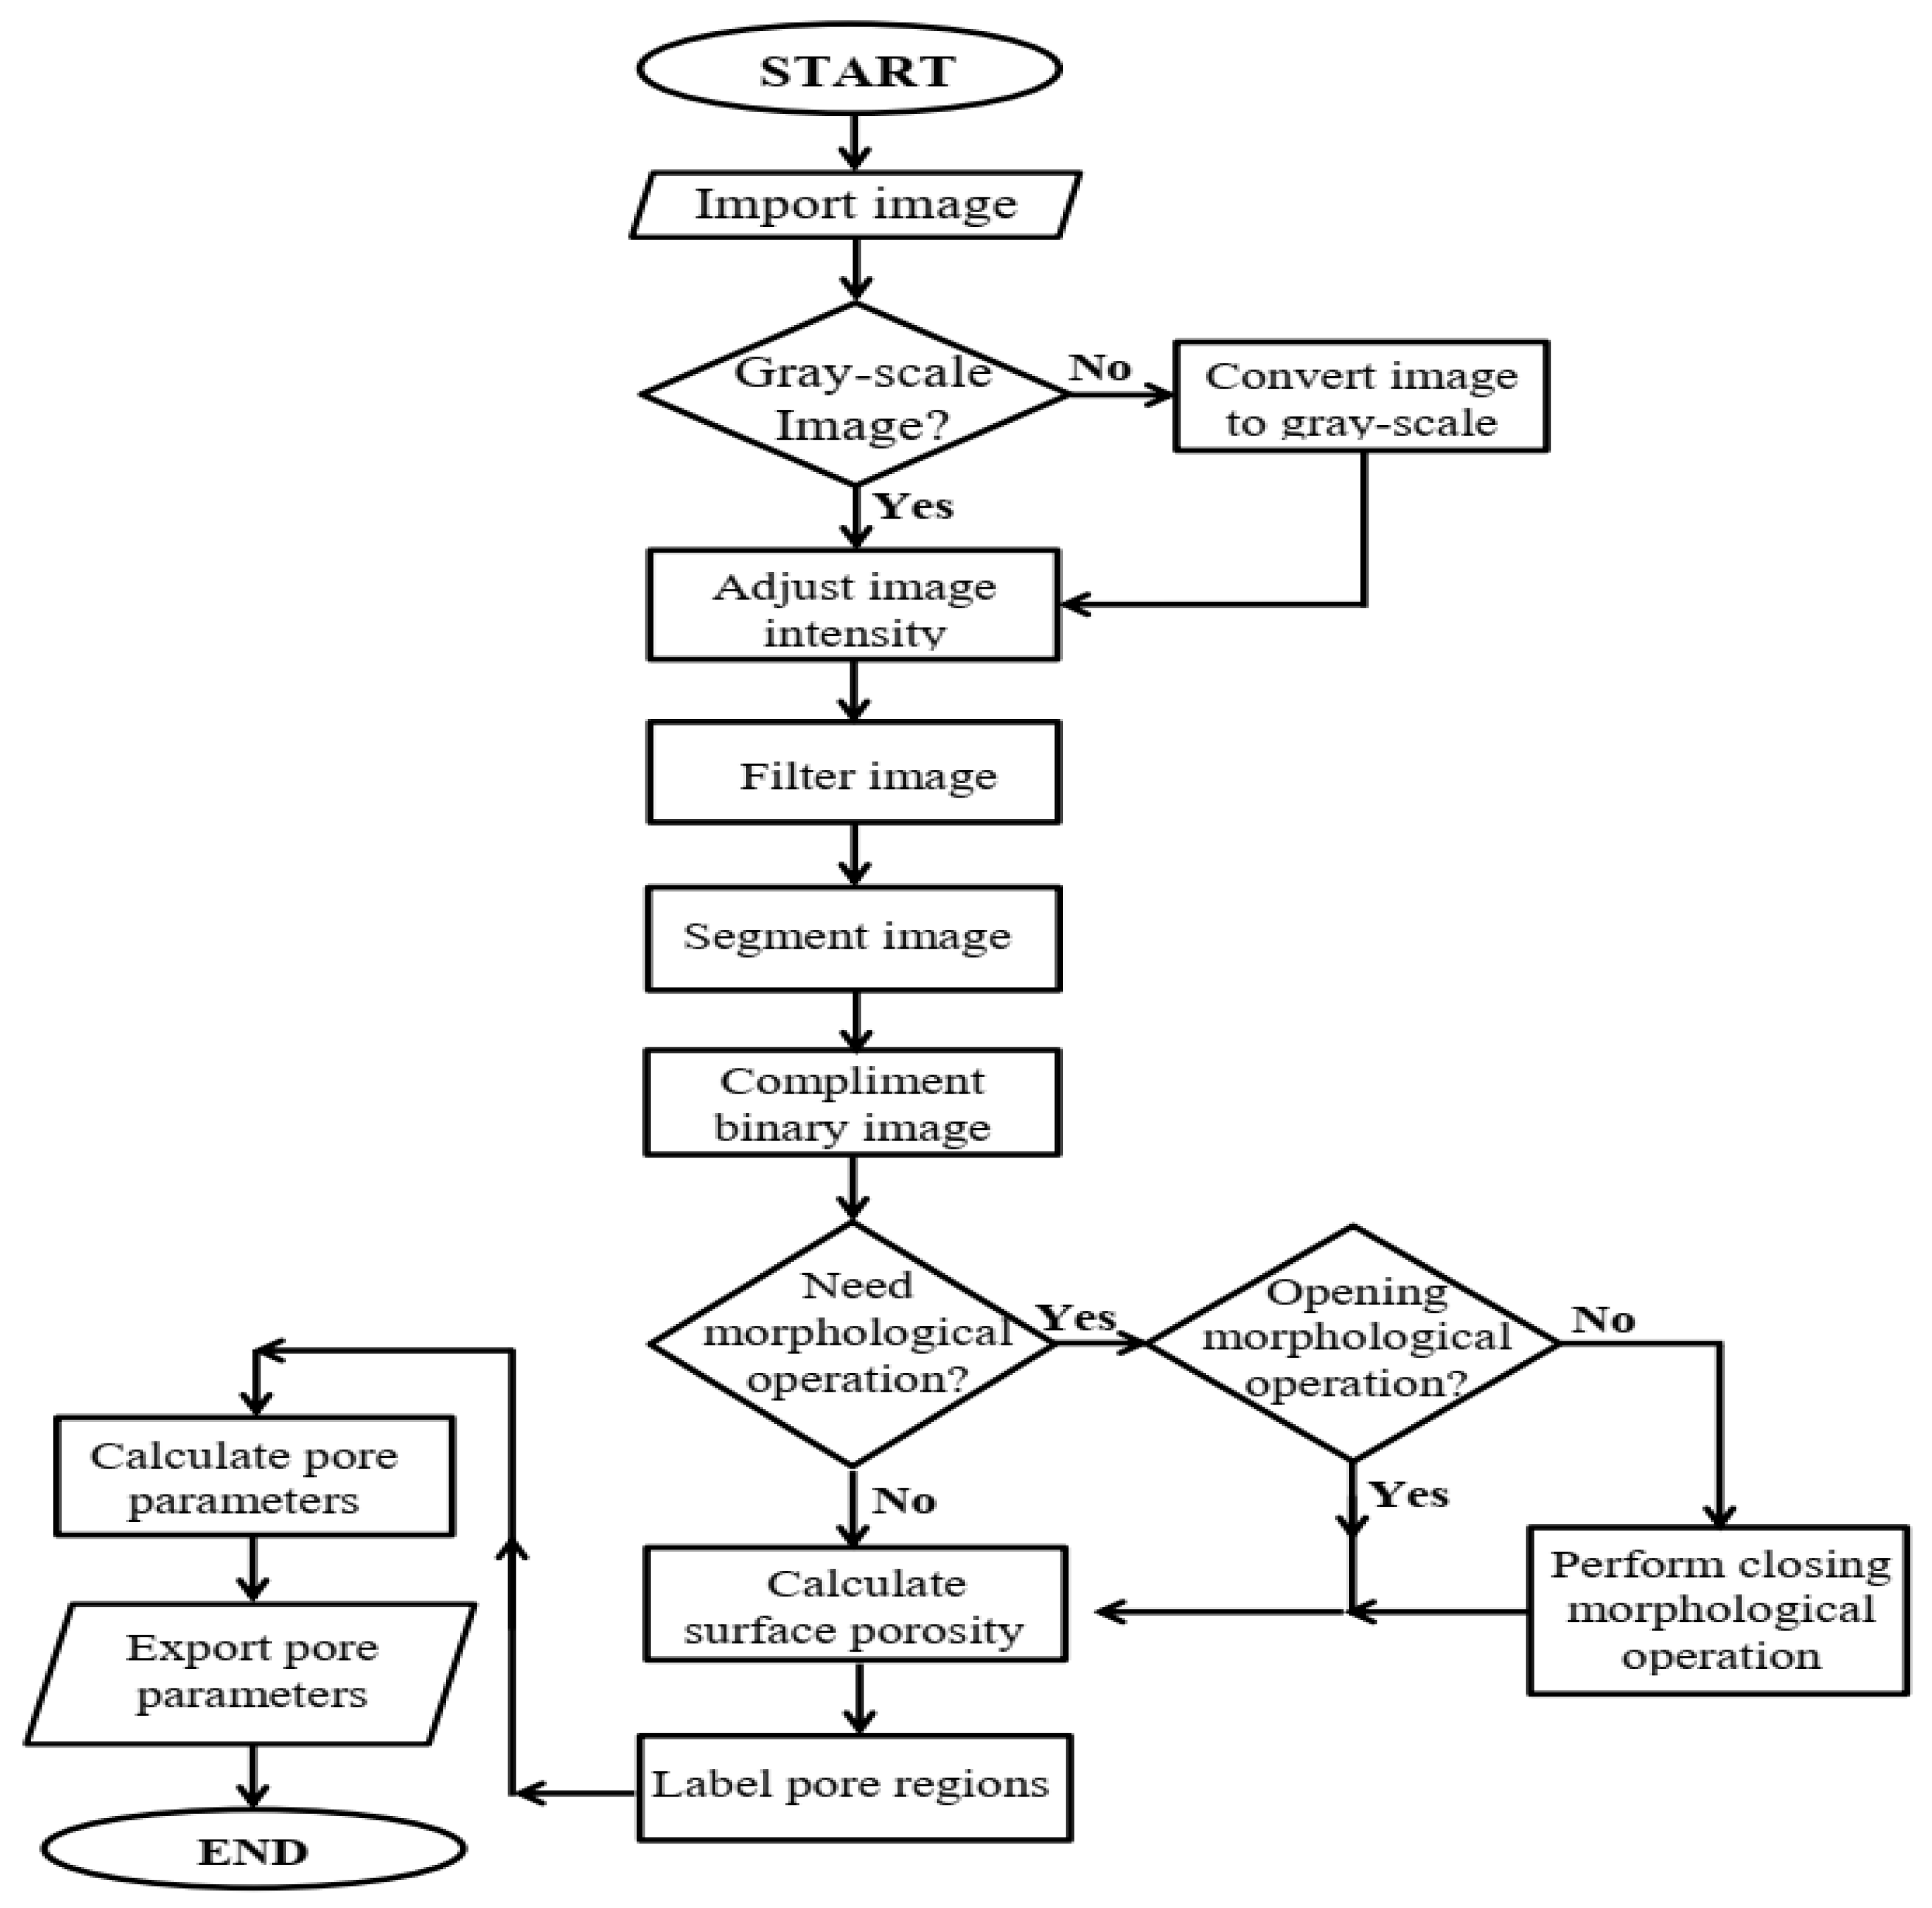
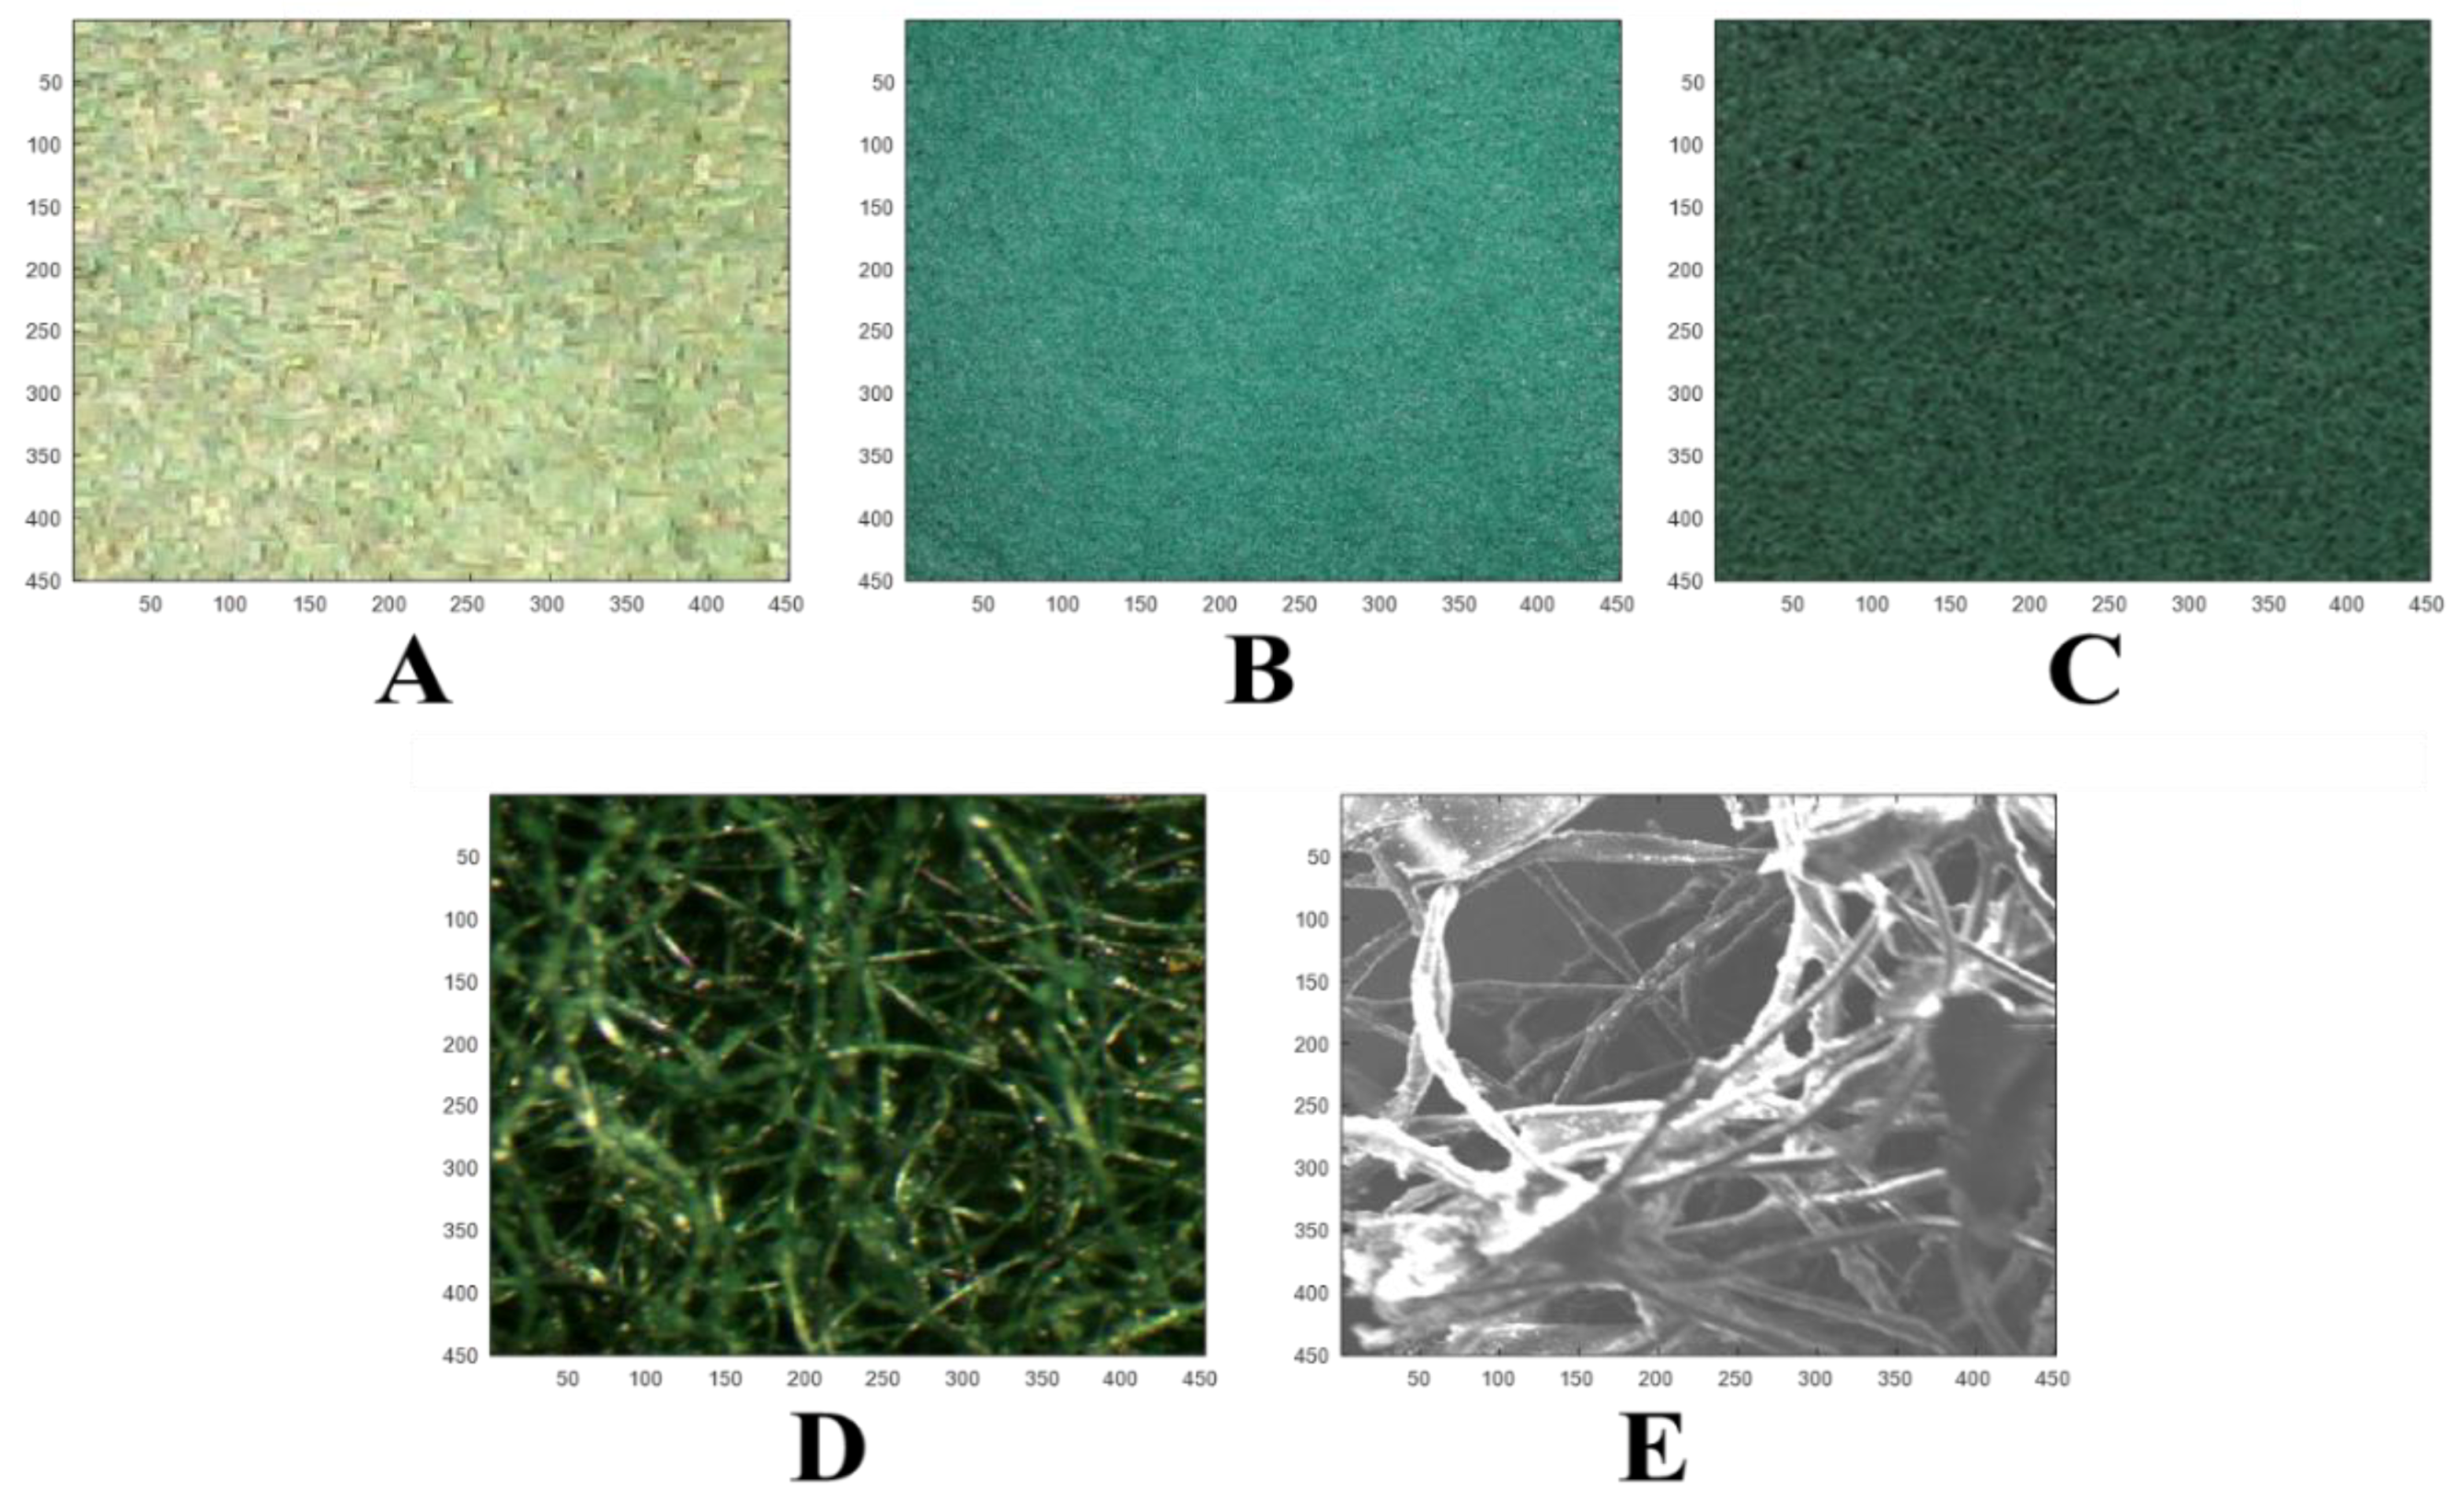
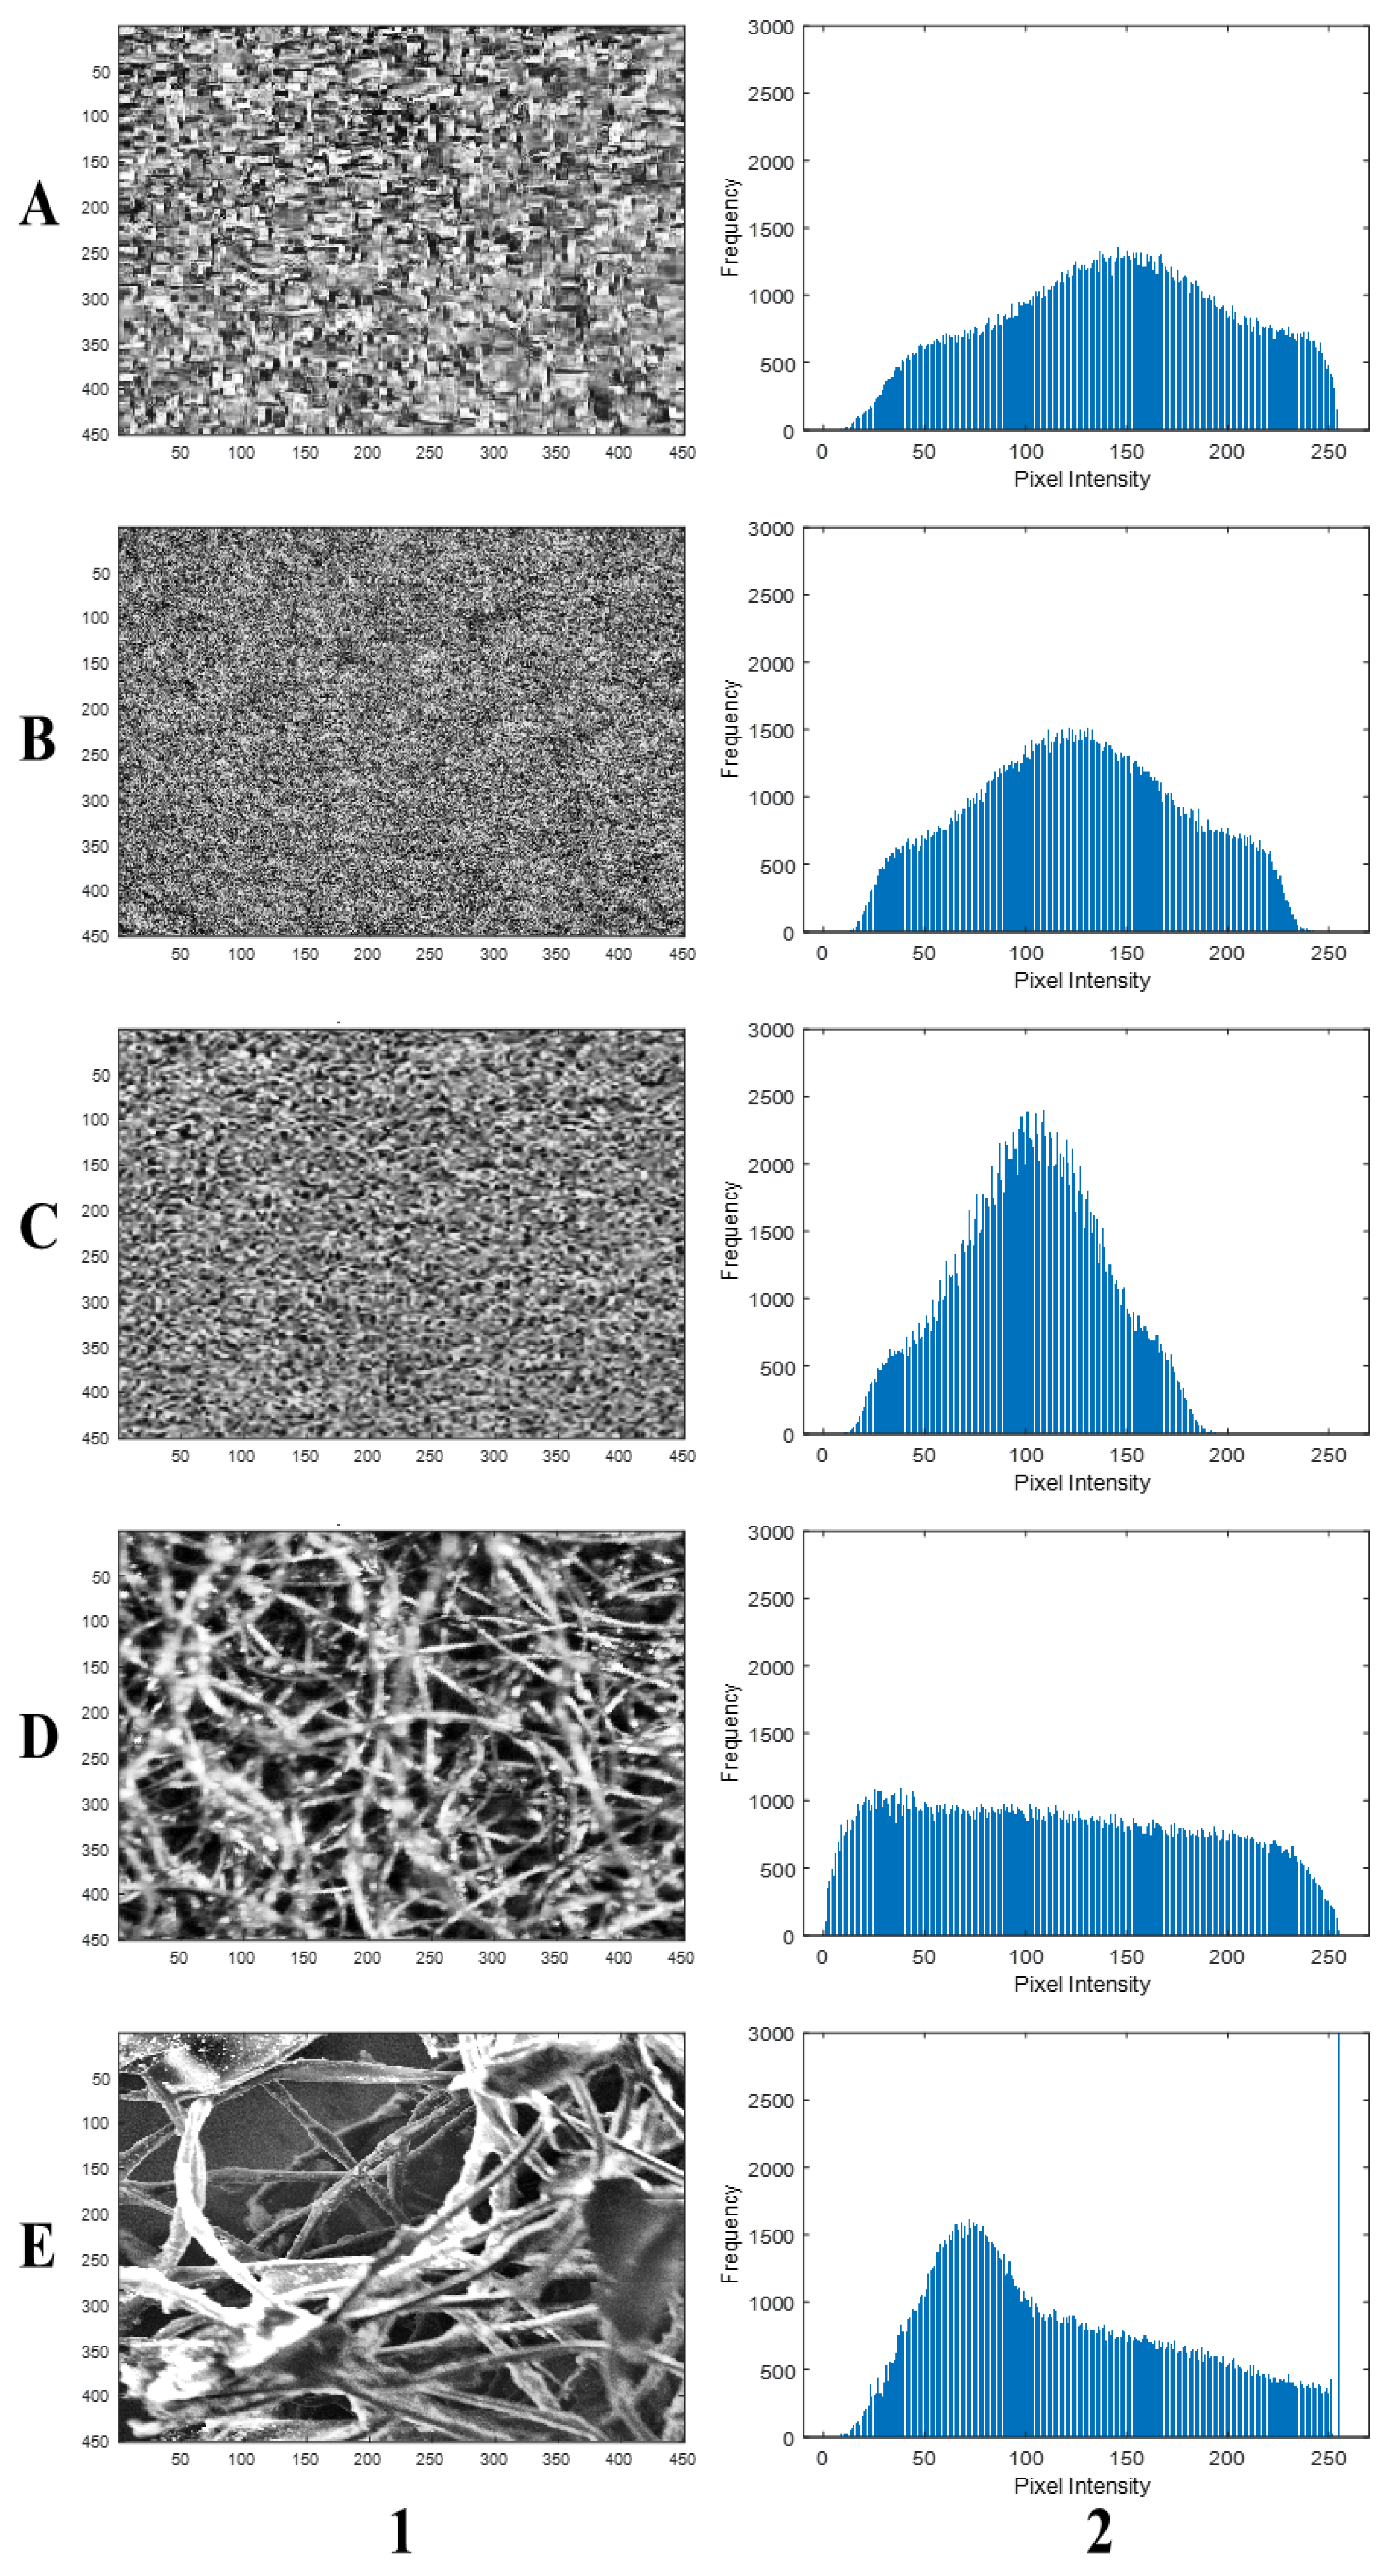
3. Materials and Methods
4. Results and Discussion
5. Conclusions
Author Contributions
Funding
Acknowledgments
Conflicts of Interest
References
- Gama, N.V.; Ferreira, A.; Barros-Timmons, A. Polyurethane Foams: Past, Present, and Future. Materials 2018, 11, 1841. [Google Scholar] [CrossRef] [PubMed]
- Szycher, M. Szycher’S Handbook of Polyurethanes, 2nd ed.; CRC Press: New York, NY, USA, 1999; ISBN 9781439863138. [Google Scholar]
- Yang, W.; Dong, Q.; Liu, S.; Xie, H.; Liu, L.; Li, J. Recycling and Disposal Methods for Polyurethane Foam Wastes. Procedia Env. Sci. 2012, 16, 167–175. [Google Scholar] [CrossRef]
- Domènech, B.; Ziegler, K.; Vigués, N.; Olszewski, W.; Marini, C.; Mas, J.; Muñoz, M.; Muraviev, D.N.; Macanás, J. Polyurethane foams doped with stable silver nanoparticles as bactericidal and catalytic materials for the effective treatment of water. New J. Chem. 2016, 40, 3716–3725. [Google Scholar] [CrossRef]
- Jain, P.; Pradeep, T. Potential of silver nanoparticle-coated polyurethane foam as an antibacterial water filter. Biotechnol. Bioeng. 2005, 90, 59–63. [Google Scholar] [CrossRef]
- Nguyen, T.; Roddick, F.A.; Fan, L. Biofouling of water treatment membranes: A review of the underlying causes, monitoring techniques and control measures. Membranes 2012, 2, 804–840. [Google Scholar] [CrossRef]
- Phuong, N.; Andisetiawan, A.; Van Lam, D.; Kim, J.H.; Choi, D.-S.; Whang, K.-H.; Nham, J.; Lee, Y.J.; Yoo, Y.-E.; Yoon, J.S. Nano sand filter with functionalized nanoparticles embedded in anodic aluminum oxide templates. Sci. Rep. 2016, 1–8. [Google Scholar] [CrossRef]
- Rastegarfar, N.; Behrooz, R.; Barikani, M. Characterization of polyurethane foams prepared from liquefied sawdust by crude glycerol and polyethylene glycol. J. Polym. Res. 2018, 25, 154. [Google Scholar] [CrossRef]
- Sivertsen, K. Polymer foams. 3.063 Polymer Physics. 2007, Spring2007, 1–2. [Google Scholar]
- Li, T.-T.; Dai, W.; Huang, S.-Y.; Wang, H.; Lin, Q.; Lou, C.-W.; Lin, J.-H. Preparation and characterization of SEBS-g-MAH-filled flexible polyurethane foam composites with gradient-changing structure. Mater. Des. 2019, 183, 108150. [Google Scholar] [CrossRef]
- Lee, S.; Park, C.; Ramesh, S. Polymeric Foams Science and Technology, 1st ed.; Raton, B., Ed.; CRC Press: Taylor and Francis Group: Boca Raton, FL, USA; London, UK; New York, NY, USA, 2006. [Google Scholar]
- Li, T.; Wang, H.; Huang, S.; Lou, C.; Lin, J. Bioinspired foam composites resembling pomelo peel: Structural design and compressive, bursting and cushioning properties. Compos. Part B 2019, 172, 290–298. [Google Scholar] [CrossRef]
- Linul, E.; Marsavina, L. The effect of loading rate and direction of formation on fracture toughness of rigid polyurethane foams. J. Eng. Stud. Res. 2012, 18, 1–10. [Google Scholar]
- Tiuc, A.E.; Vermeşan, H.; Gabor, T.; Vasile, O. Improved sound absorption properties of polyurethane foam mixed with textile waste. Energy Procedia 2016, 85, 559–565. [Google Scholar] [CrossRef]
- Voiconi, T.; Linul, E.; Marşavina, L.; Sadowski, T.; Kneć, M. Determination of flexural properties of rigid PUR foams using digital image correlation. Solid State Phenom 2014, 216, 116–121. [Google Scholar] [CrossRef]
- Li, R.; Qin, M.; Chen, Z.; Zhao, S.; Liu, C.; Wang, X.; Zhang, L.; Ma, J.; Qu, X. Porous structure uniformity investigation of tungsten matrix prepared by jet milled and annealed tungsten powder. Powder Technol. 2018, 339, 192–198. [Google Scholar] [CrossRef]
- Qu, J.; Sun, Q.; Wang, H.; Zhang, D.; Yuan, J. Performance characteristics of flat-plate oscillating heat pipe with porous metal-foam wicks. Int. J. Heat Mass Transf. 2019, 137, 20–30. [Google Scholar] [CrossRef]
- Cong, S.; Liu, X.; Guo, F. Membrane distillation using surface modified multi-layer porous ceramics. Int. J. Heat Mass Transf. 2019, 129, 764–772. [Google Scholar] [CrossRef]
- Karl, D.; Jastram, B.; Kamm, P.H.; Schwandt, H.; Gurlo, A.; Schmidt, F. Evaluating porous polylactide-co-glycolide/bioactive glass composite microsphere powders for laser sintering of scaffolds. Powder Technol. 2019, 354, 289–300. [Google Scholar] [CrossRef]
- Rehman, T.U.; Ali, H.M.; Janjua, M.M.; Sajjad, U.; Yan, W.M. A critical review on heat transfer augmentation of phase change materials embedded with porous materials/foams. Int. J. Heat Mass Transf. 2019, 135, 649–673. [Google Scholar] [CrossRef]
- Fard, A.K.; McKay, G.; Buekenhoudt, A.; Al Sulaiti, H.; Motmans, F.; Khraisheh, M.; Atieh, M. Inorganic membranes: Preparation and application for water treatment and desalination. Materials 2018, 11, 74. [Google Scholar] [CrossRef]
- Lee, A.; Elam, J.W.; Darling, S.B. Membrane materials for water purification: Design, development, and application. Environ. Sci. Water Res. Technol. 2016, 2, 17–42. [Google Scholar] [CrossRef]
- Zahid, M.; Rashid, A.; Akram, S.; Rehan, Z.A.; Razzaq, W. A comprehensive review on polymeric nano-composite membranes for water treatment. J. Membr. Sci. Technol. 2018, 8, 1–20. [Google Scholar] [CrossRef]
- Jena, A.; Gupta, K. Advanced Technology for Evaluation of Pore Structure Characteristics of Filtration Media to Optimize Their Design and Performance; Porous Materials, Inc.: Ithaca, NY, USA, 2002; Volume 14850, pp. 1–36. [Google Scholar]
- She, F.H.; Tung, K.L.; Kong, L.X. Calculation of effective pore diameters in porous filtration membranes with image analysis. Robot. Comput. Integr. Manuf. 2008, 24, 427–434. [Google Scholar] [CrossRef]
- Lawrence, M.; Jiang, Y. Porosity, Pore Size Distribution, micro-structure. In Bio-aggregates Based Building Materials; RILEM State- of-the-Art-Reports; Amziane, S., Collet, F., Eds.; Springer International Publishing: Dordrecht, The Netherlands, 2017; Volume 23, pp. 39–71. [Google Scholar]
- Datta, D.; Thakur, N.; Ghosh, S.; Poddar, R.; Sharmila, P. An image analysis technique to estimate the porosity of rock samples. Int. J. Sci. Res. Dev. 2015, 3, 835–839. [Google Scholar]
- Sportelli, M.C.; Picca, R.A.; Ronco, R.; Bonerba, E.; Tantillo, G.; Pollini, M.; Sannino, A.; Valentini, A.; Cataldi, T.R.I.; Cioffi, N. Investigation of industrial polyurethane foams modified with antimicrobial copper nanoparticles. Materials 2016, 9, 544. [Google Scholar] [CrossRef] [PubMed]
- Abràmoff, M.D.; Magalhães, P.J.; Ram, S.J. Image Processing with ImageJ. Biophotonics Int. 2004, 11, 36–42. [Google Scholar]
- Bachtiar, E.V.; Kurkowiak, K.; Yan, L.; Kasal, B.; Kolb, T. Thermal stability, fire performance, and mechanical properties of natural fibre fabric-reinforced polymer composites with different fire retardants. Polymers 2019, 11, 669. [Google Scholar] [CrossRef]
- Nakao, S. Determination of pore size and pore size distribution. J. Membr. Sci. 1994, 96, 1–35. [Google Scholar] [CrossRef]
- Olson, E. Particle shape factors and their use in image analysis—Part 1: Theory. J. GXP Compliance 2011, 3, 85–96. [Google Scholar]
- Bhargavi, P.M.; Mayee, V.S.K.; Manaswini, T.; Manvitha, S. A comparison of image segmentation techniques, Otsu and watershed for X-ray images. Int. J. Res. Eng. Technol. 2015, 04, 720–723. [Google Scholar]
- Roy, P.; Dutta, S.; Dey, N.; Dey, G.; Chakraborty, S.; Ray, R. Adaptive thresholding: A comparative study. In Proceedings of the 2014 International Conference on Control, Instrumentation, Communication and Computational Technologies (ICCICCT), Kanyakumari, India, 10–11 July 2014. [Google Scholar]
- Chen, X.; Li, S.; Hu, J.; Liang, Y. A survey on Otsu image segmentation methods. J. Comput. Inf. Syst. 2014, 10, 387–389. [Google Scholar]
- MathWorks. Types of Morphological Operations. Available online: https://www.mathworks.com/help/-images/morphological-dilation-and-erosion.html (accessed on 20 September 2019).
- Olson, E. Particle shape factors and their use in image analysis—Part 1: Theory. J. GXP Compliance 2011, 15, 85–96. [Google Scholar]
- Doutres, O.; Atalla, N.; Dong, K. Effect of the microstructure closed pore content on the acoustic behavior of polyurethane foams. J. Appl. Phys. 2011, 110, 1–12. [Google Scholar] [CrossRef]
- Lorusso, C.; Vergaro, V.; Monteduro, A.; Saracino, A.; Ciccarella, G.; Congedo, P.M.; Scremin, B.F. Characterization of polyurethane foam added with synthesized acetic and oleic-modified TiO2 Nanocrystals. Nanomater. Nanotechnol. 2015, 5, 1–7. [Google Scholar] [CrossRef]
- Ariff, Z.M.; Zakaria, Z.; Bakar, A.A.; Naser, M.A.M. Effectiveness of a simple image enhancement method in characterizing polyethylene foam morphology using optical microscopy. Procedia Chem. 2016, 19, 477–484. [Google Scholar] [CrossRef] [Green Version]


| Black Box | Canon Camera | LaserJet Scanner | Microscope | SEM | |||||||||||
|---|---|---|---|---|---|---|---|---|---|---|---|---|---|---|---|
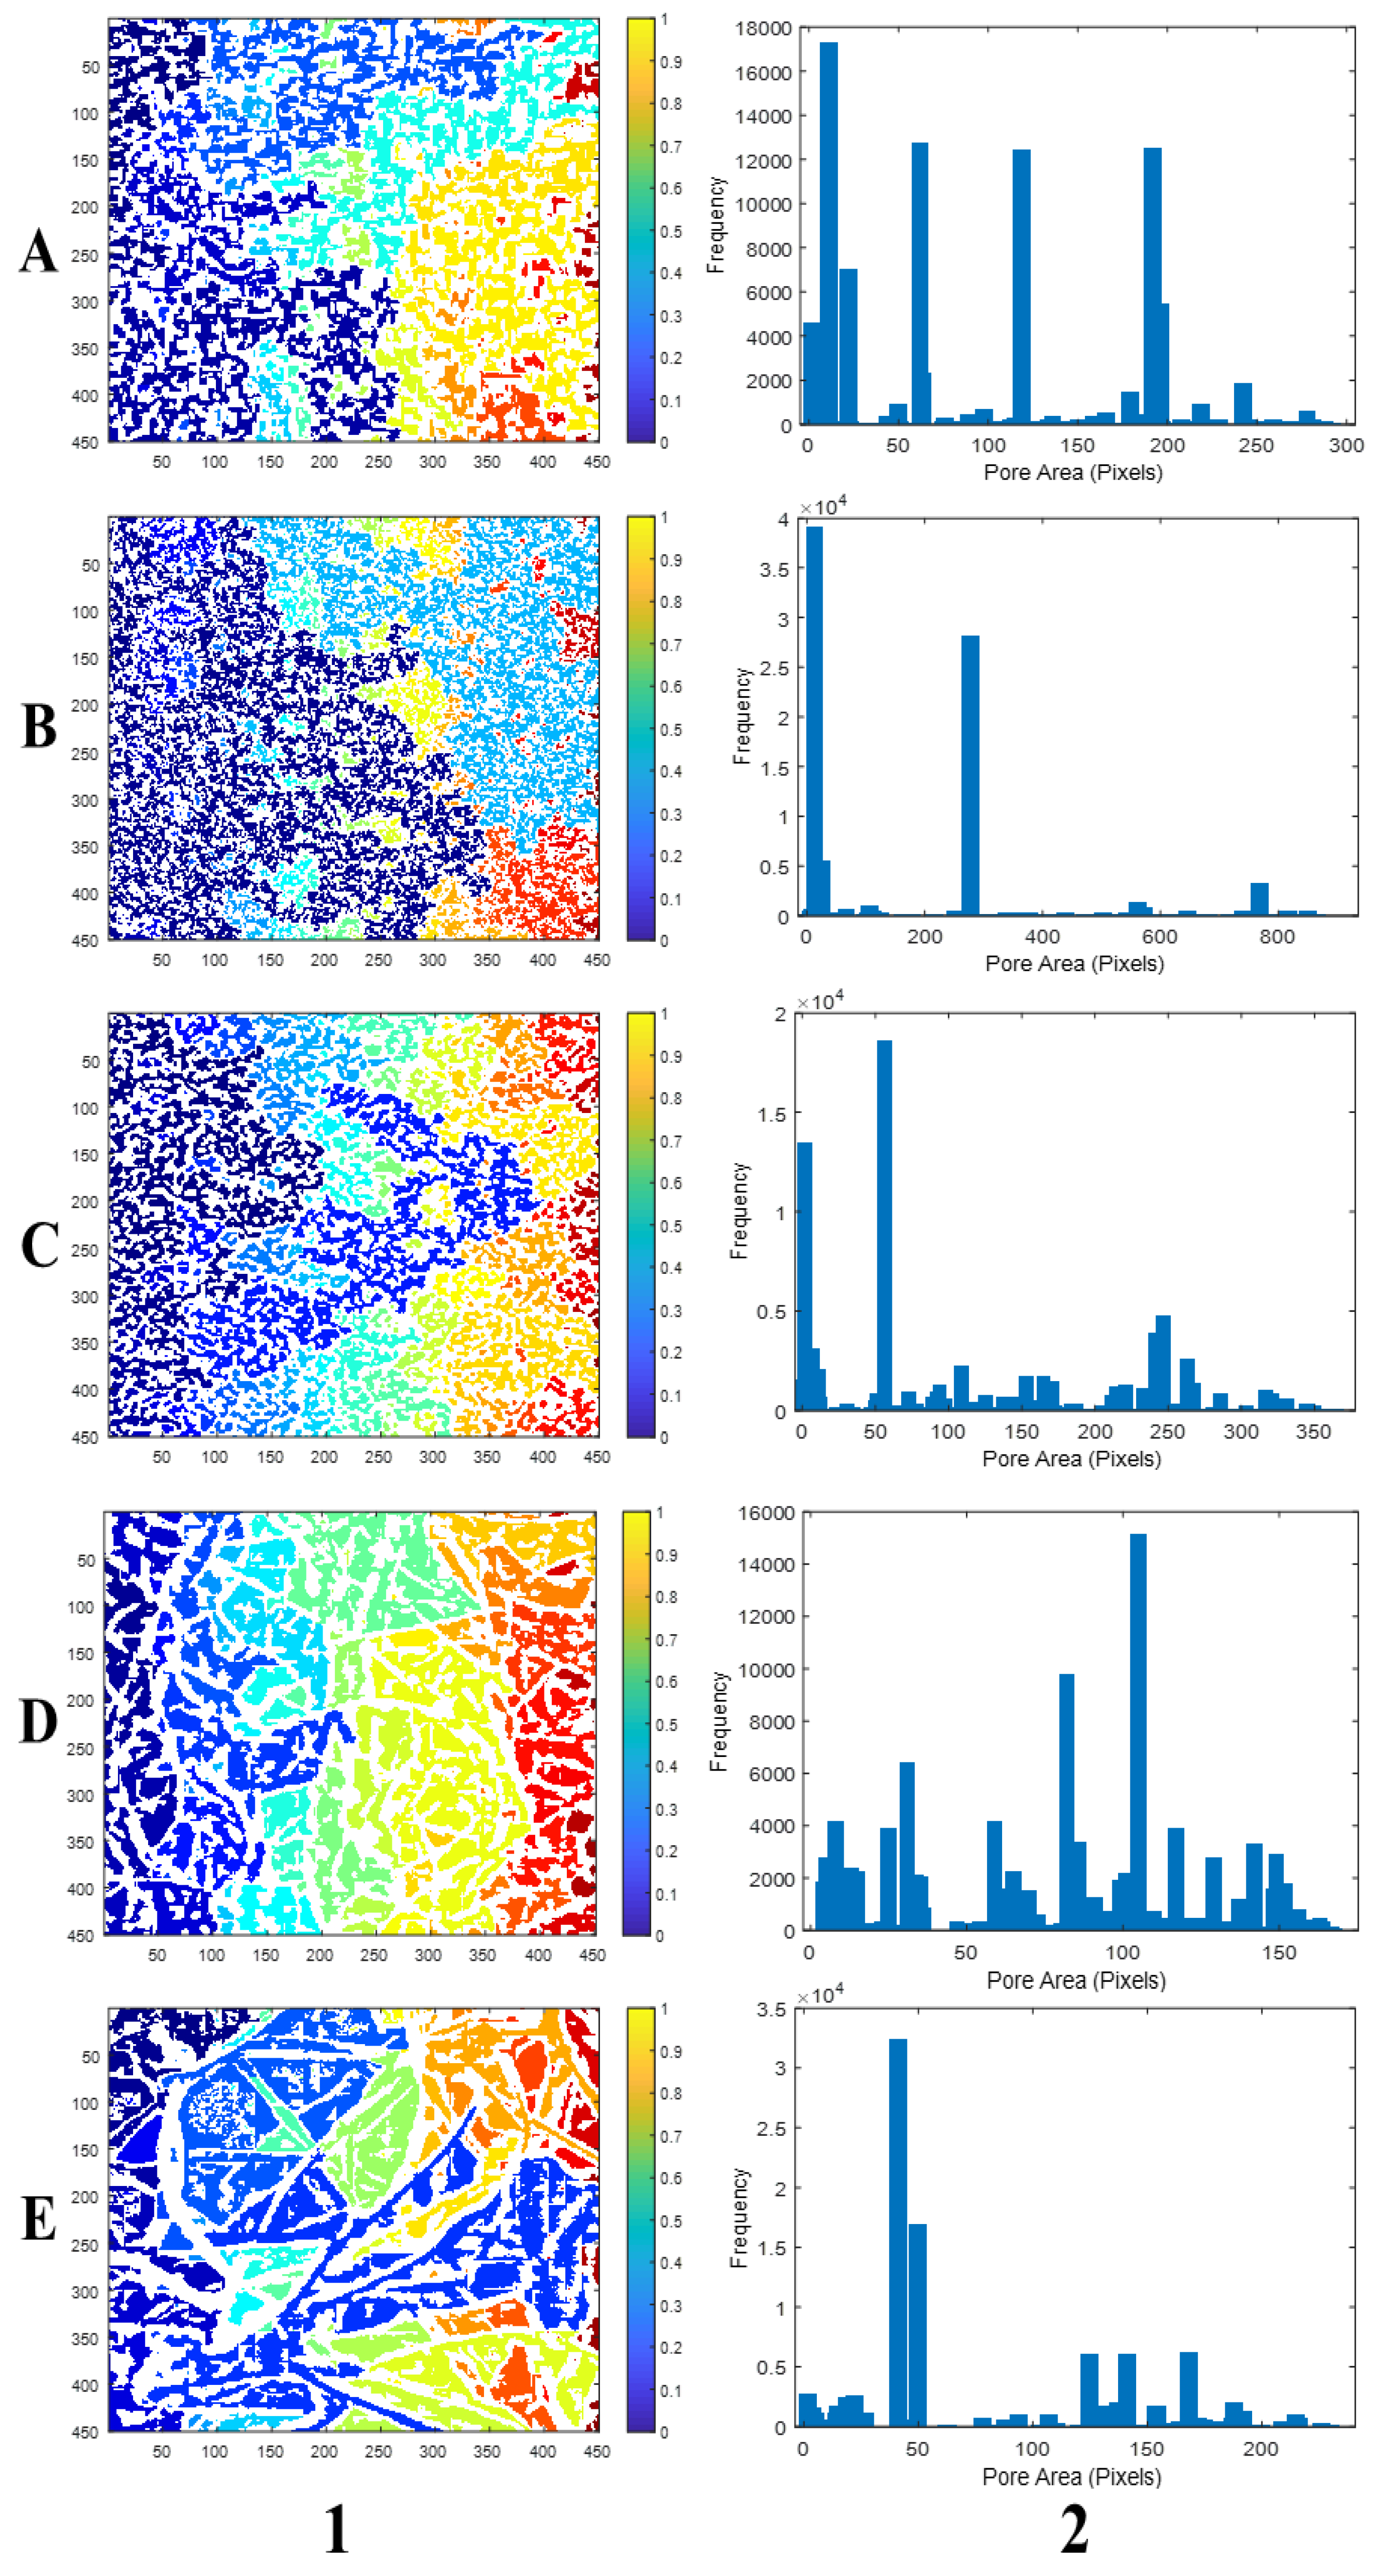
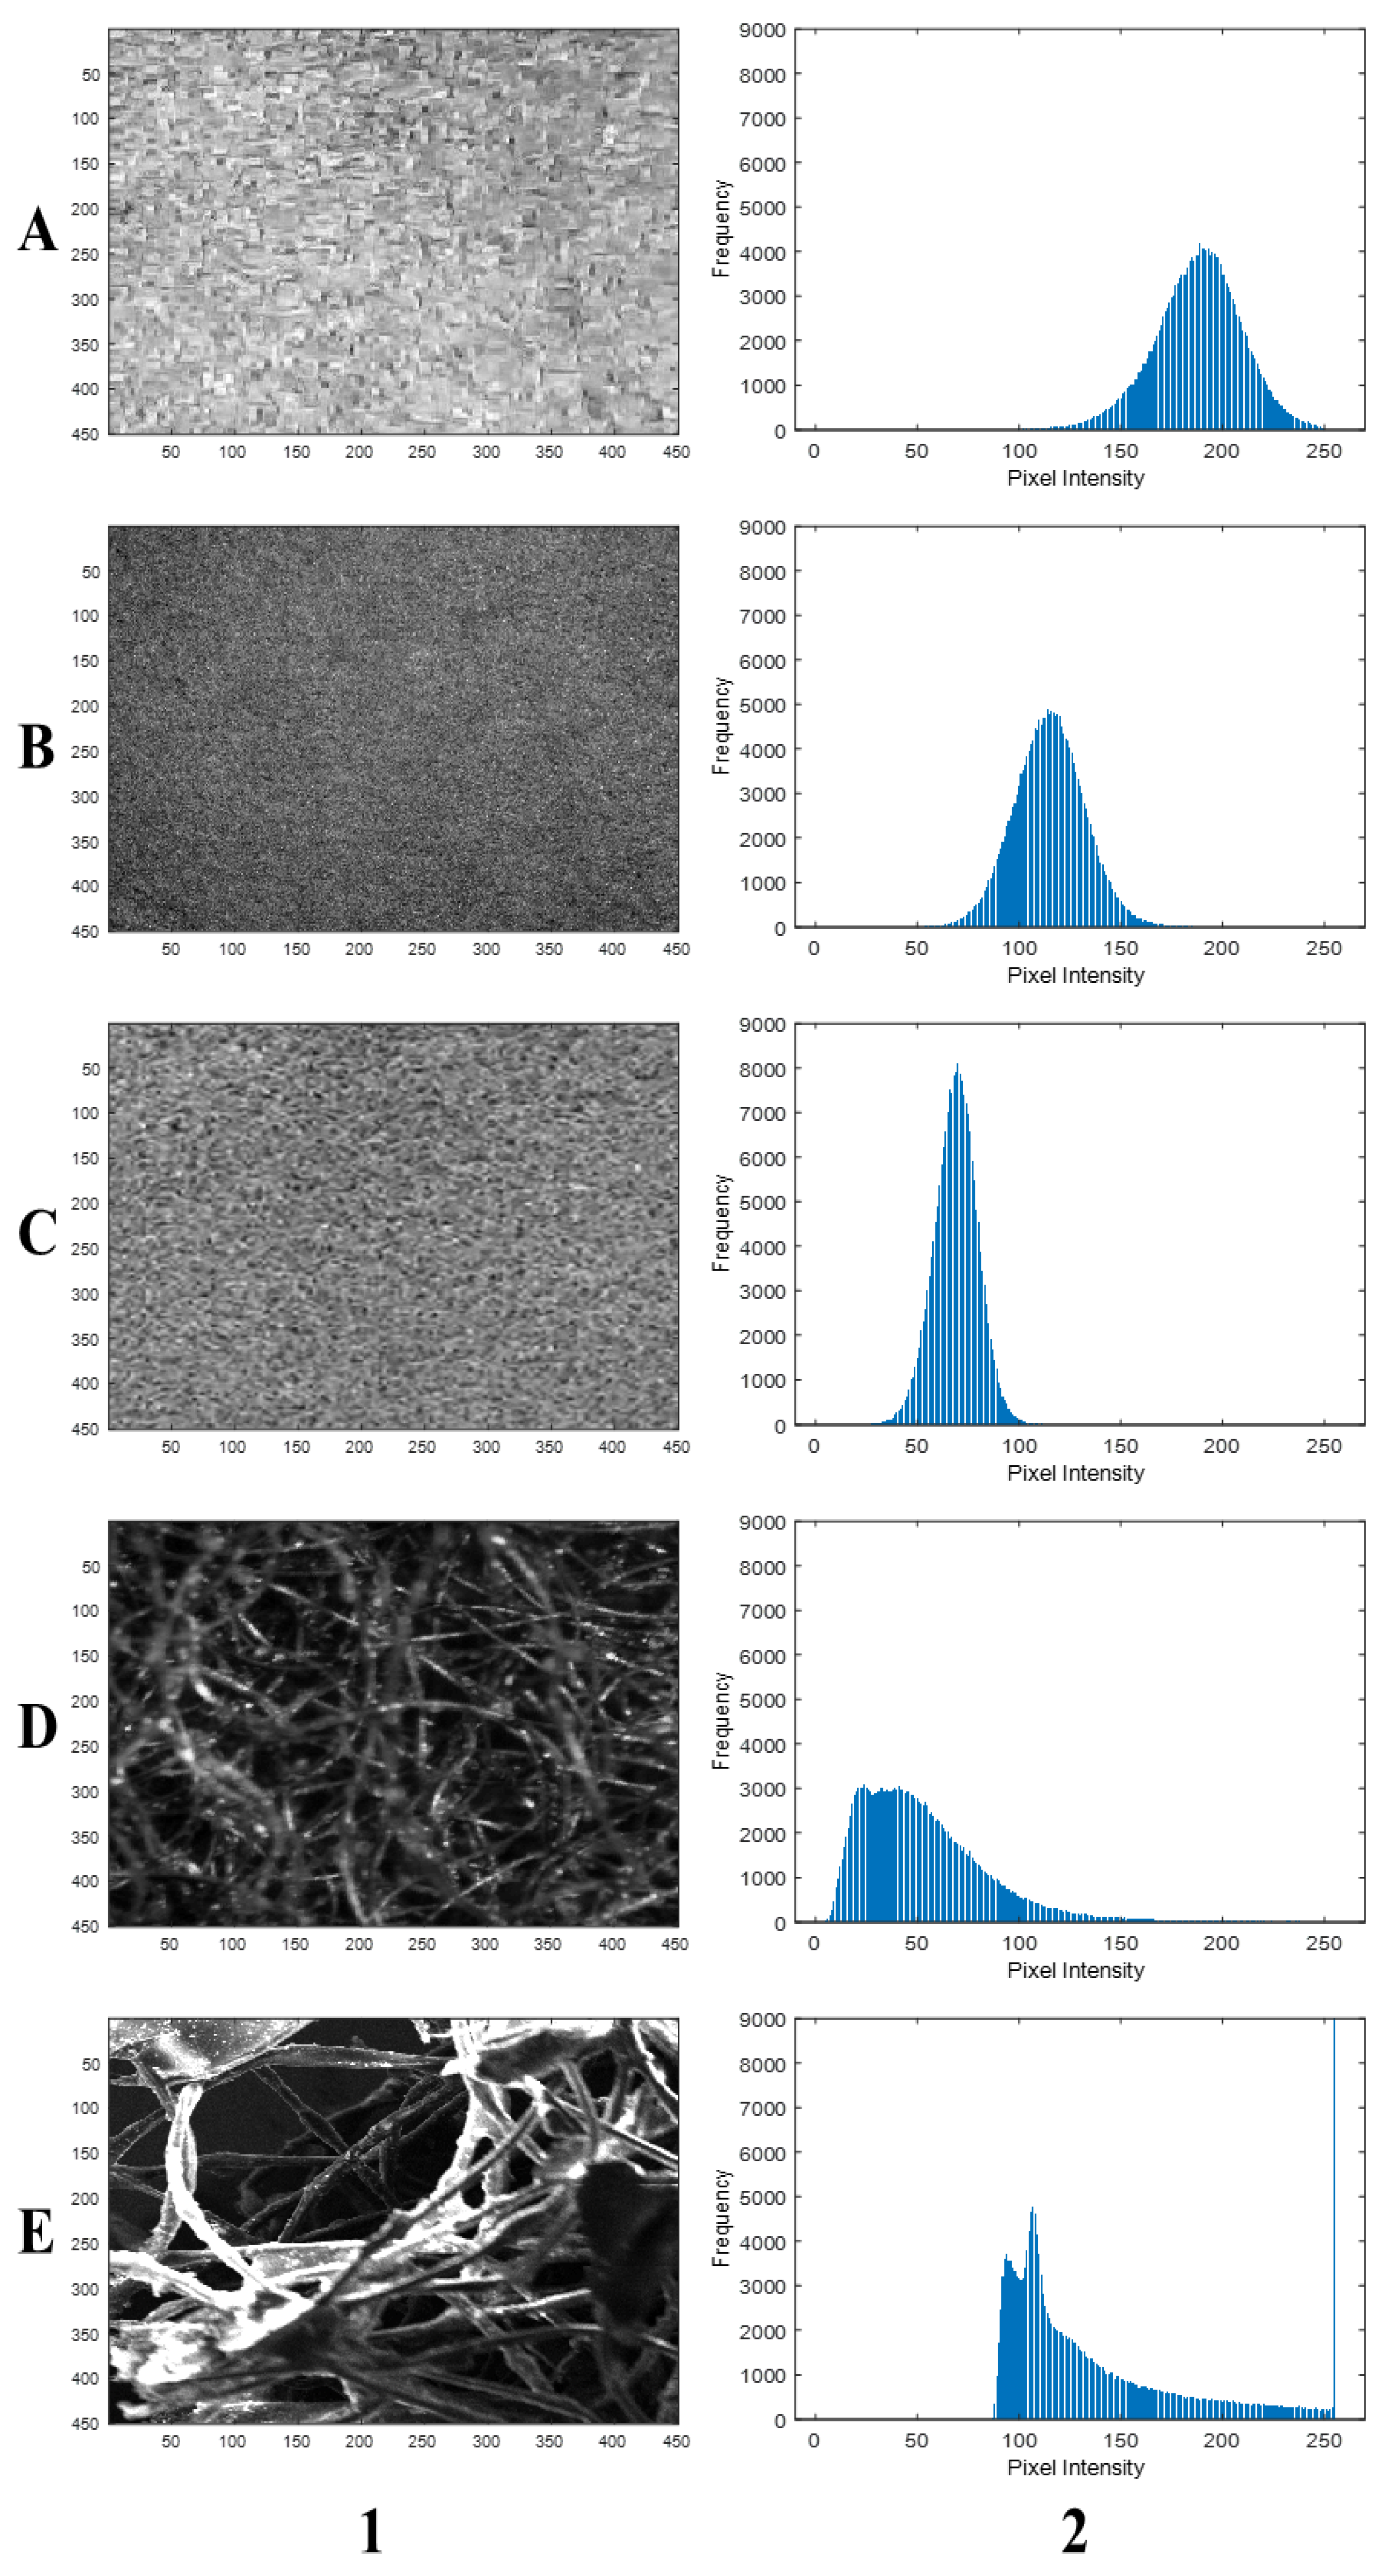
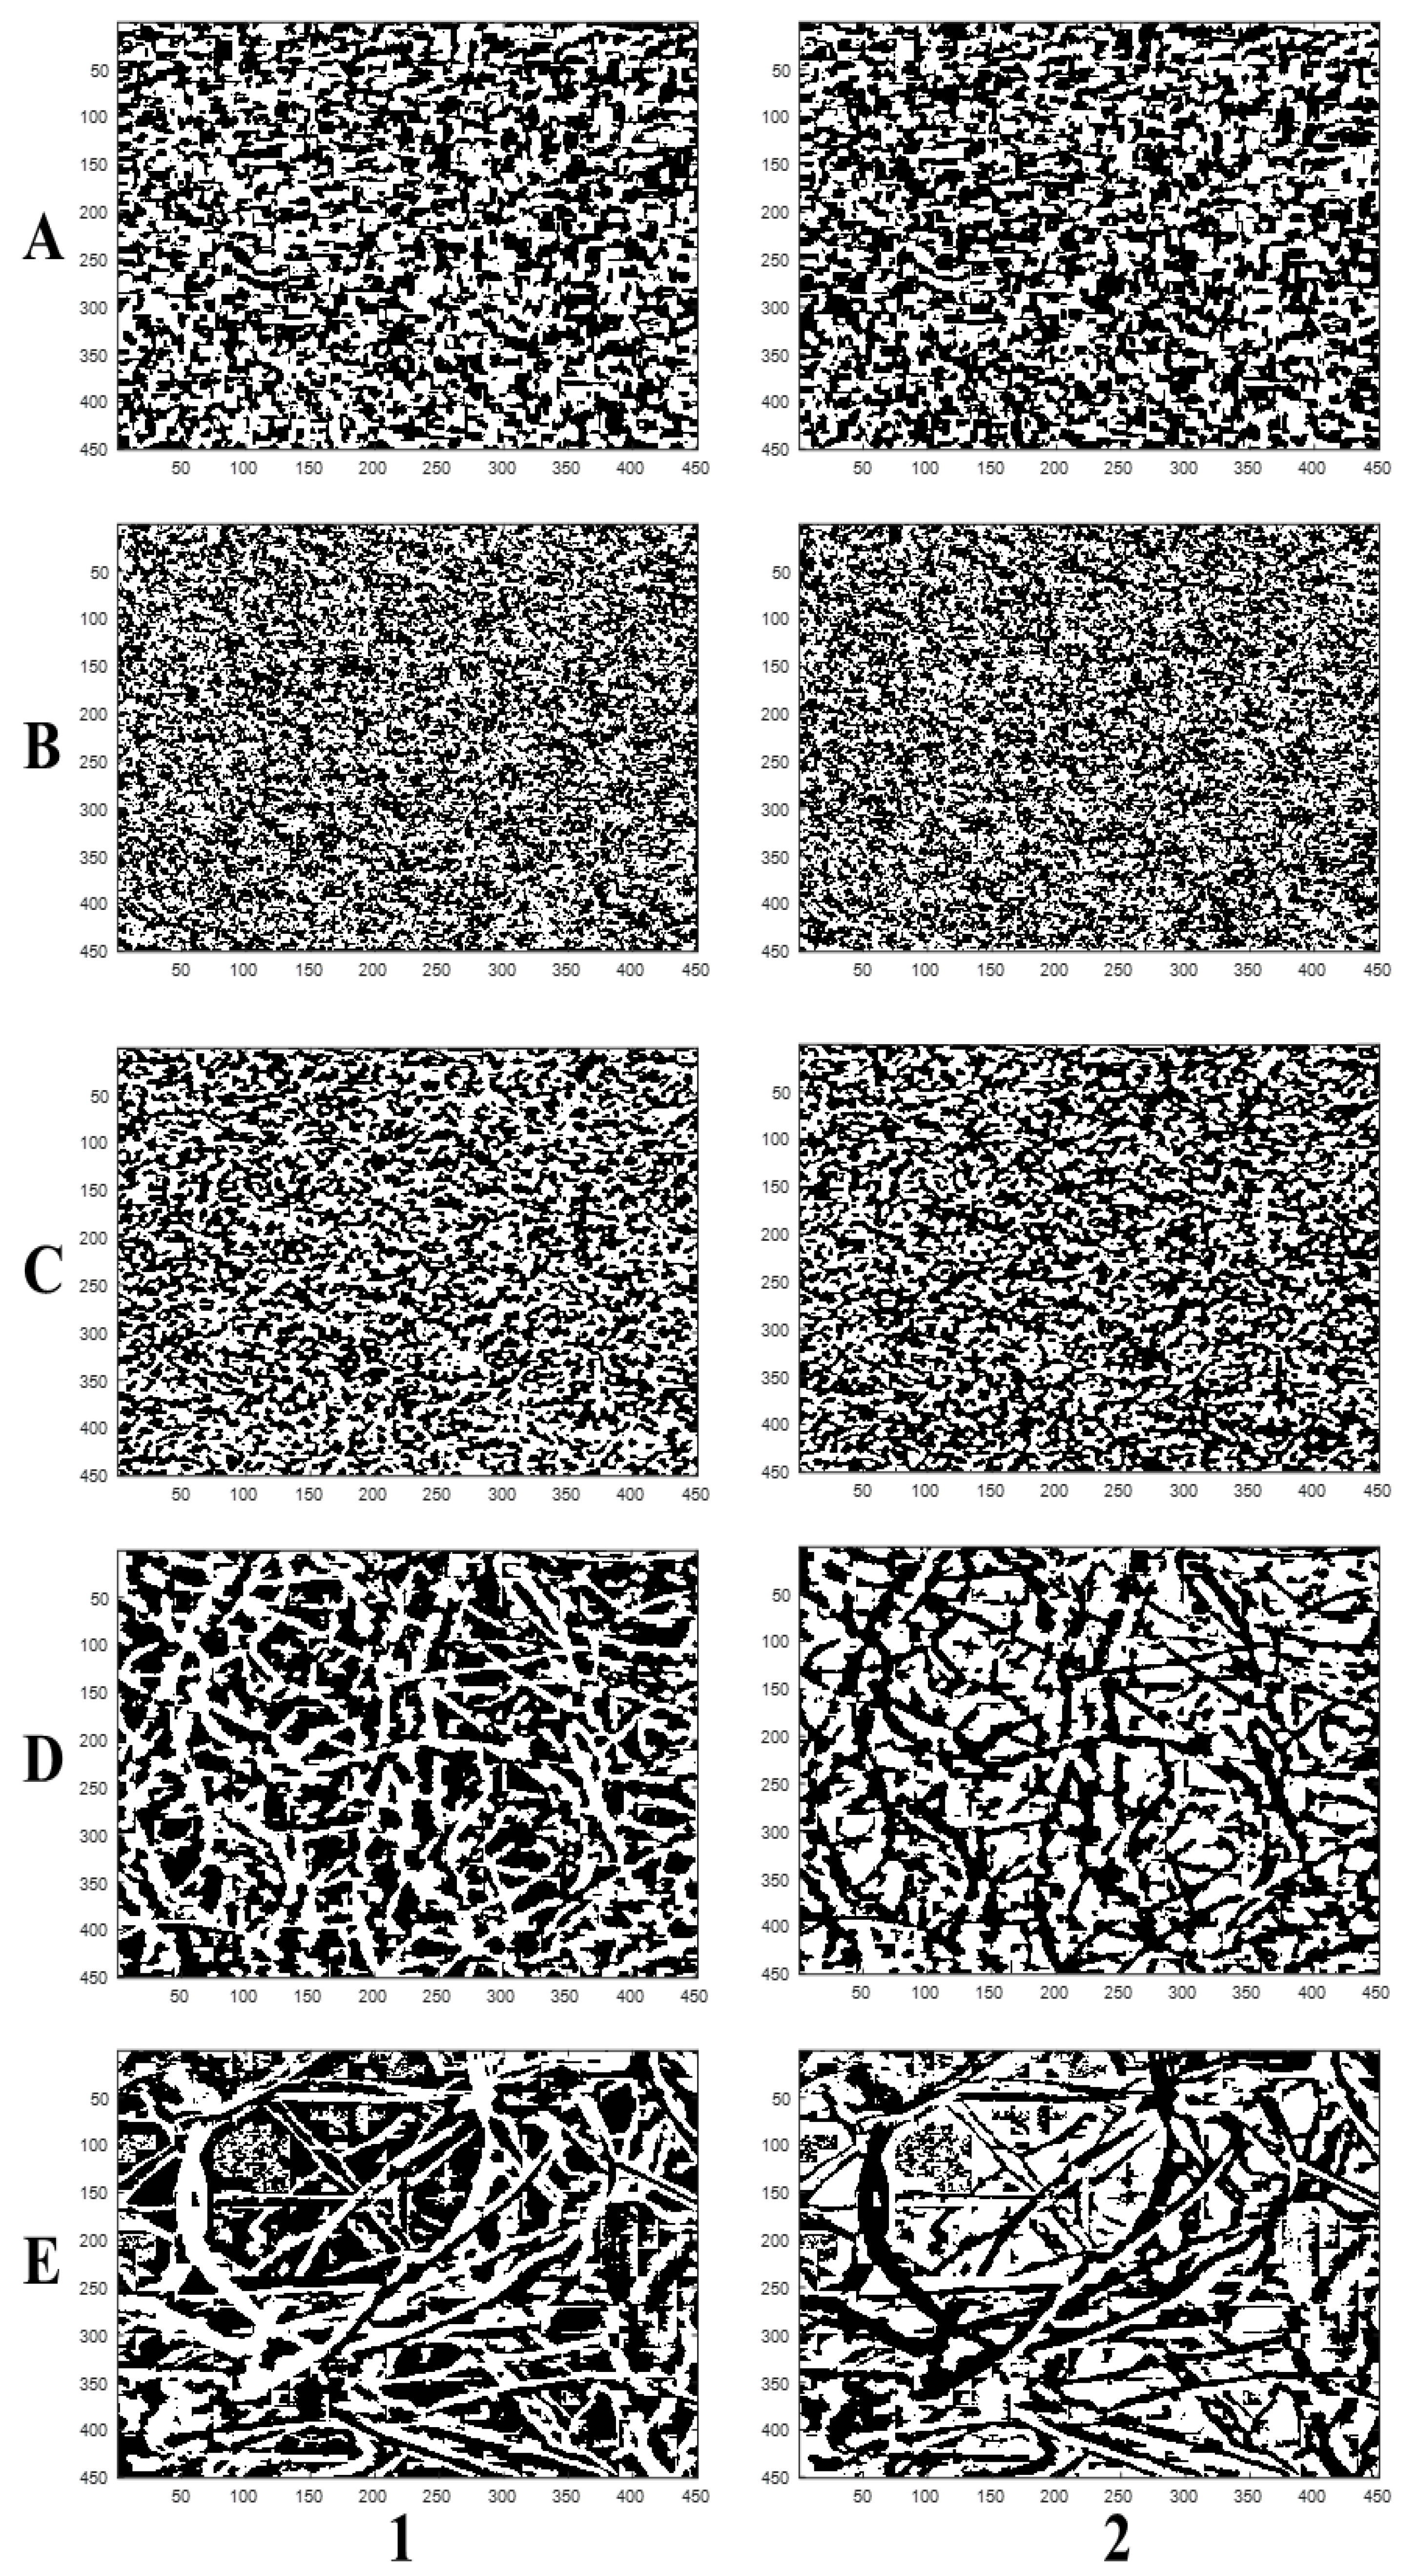
| Surface Porosity (1) | Pore Area (Px) | Shape Factor (1) | Surface Porosity (1) | Pore Area (Px) | Shape Factor (1) | Surface Porosity (1) | Pore Area (Px) | Shape Factor (1) | Surface Porosity (1) | Pore Area (Px) | Shape Factor (1) | Surface Porosity (1) | Pore Area (Px) | Shape Factor (1) | |
| Icomp | 0.515 ± 0.013 | 342.59 ± 69.62 | 1.64 ± 0.42 | 0.579 ± 0.138 | 124.17 ± 18.02 | 1.91 ± 0.06 | 0.546 ± 0.007 | 75.49 ± 10.71 | 1.80 ± 0.07 | 0.455 ± 0.014 | 845.71 ± 175.06 | 2.99 ± 0.29 | 0.450 ± 0.017 | 449.71 ± 127.08 | 1.73 ± 0.35 |
| Iclosed | 0.366 ± 0.031 | 5203.94 ± 1519.66 | 0.34 ± 0.06 | 0.206 ± 0.037 | 9372.22 ± 5691.92 | 0.31 ± 0.14 | 0.212 ± 0.026 | 3520.18 ± 986.77 | 0.13 ± 0.07 | 0.387 ± 0.013 | 8197.14 ± 2546.39 | 2.69 ± 0.48 | 0.340 ± 0.028 | 6704.29 ± 3205.38 | 1.16 ± 0.66 |
| Iopen | 0.666 ± 0.036 | 166.21 ± 43.97 | 1.38 ± 0.16 | 0.829 ± 0.025 | 64.20 ± 9.18 | 0.99 ± 0.04 | 0.862 ± 0.039 | 56.45 ± 10.04 | 0.93 ± 0.05 | 0.512 ± 0.017 | 498.28 ± 107.14 | 1.92 ± 0.22 | 0.534 ± 0.022 | 421.71 ± 57.10 | 1.76 ± 0.17 |
© 2019 by the authors. Licensee MDPI, Basel, Switzerland. This article is an open access article distributed under the terms and conditions of the Creative Commons Attribution (CC BY) license (http://creativecommons.org/licenses/by/4.0/).
Share and Cite
Yunus, S.; Sefa-Ntiri, B.; Anderson, B.; Kumi, F.; Mensah-Amoah, P.; Sonko Sackey, S. Quantitative Pore Characterization of Polyurethane Foam with Cost-Effective Imaging Tools and Image Analysis: A Proof-Of-Principle Study. Polymers 2019, 11, 1879. https://doi.org/10.3390/polym11111879
Yunus S, Sefa-Ntiri B, Anderson B, Kumi F, Mensah-Amoah P, Sonko Sackey S. Quantitative Pore Characterization of Polyurethane Foam with Cost-Effective Imaging Tools and Image Analysis: A Proof-Of-Principle Study. Polymers. 2019; 11(11):1879. https://doi.org/10.3390/polym11111879
Chicago/Turabian StyleYunus, Shemmira, Baah Sefa-Ntiri, Benjamin Anderson, Francis Kumi, Patrick Mensah-Amoah, and Samuel Sonko Sackey. 2019. "Quantitative Pore Characterization of Polyurethane Foam with Cost-Effective Imaging Tools and Image Analysis: A Proof-Of-Principle Study" Polymers 11, no. 11: 1879. https://doi.org/10.3390/polym11111879
APA StyleYunus, S., Sefa-Ntiri, B., Anderson, B., Kumi, F., Mensah-Amoah, P., & Sonko Sackey, S. (2019). Quantitative Pore Characterization of Polyurethane Foam with Cost-Effective Imaging Tools and Image Analysis: A Proof-Of-Principle Study. Polymers, 11(11), 1879. https://doi.org/10.3390/polym11111879