Fabrication and Characterization of Wrapped Metal Yarns-based Fabric Temperature Sensors

Abstract
1. Introduction
2. Experiments
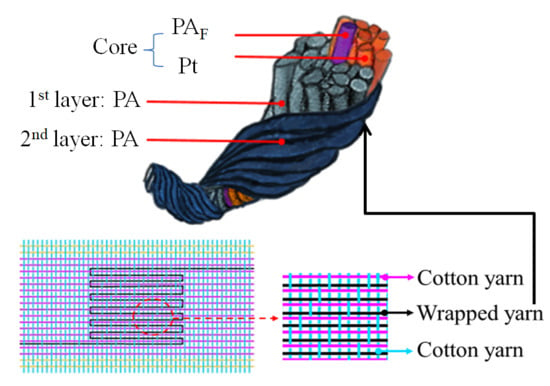
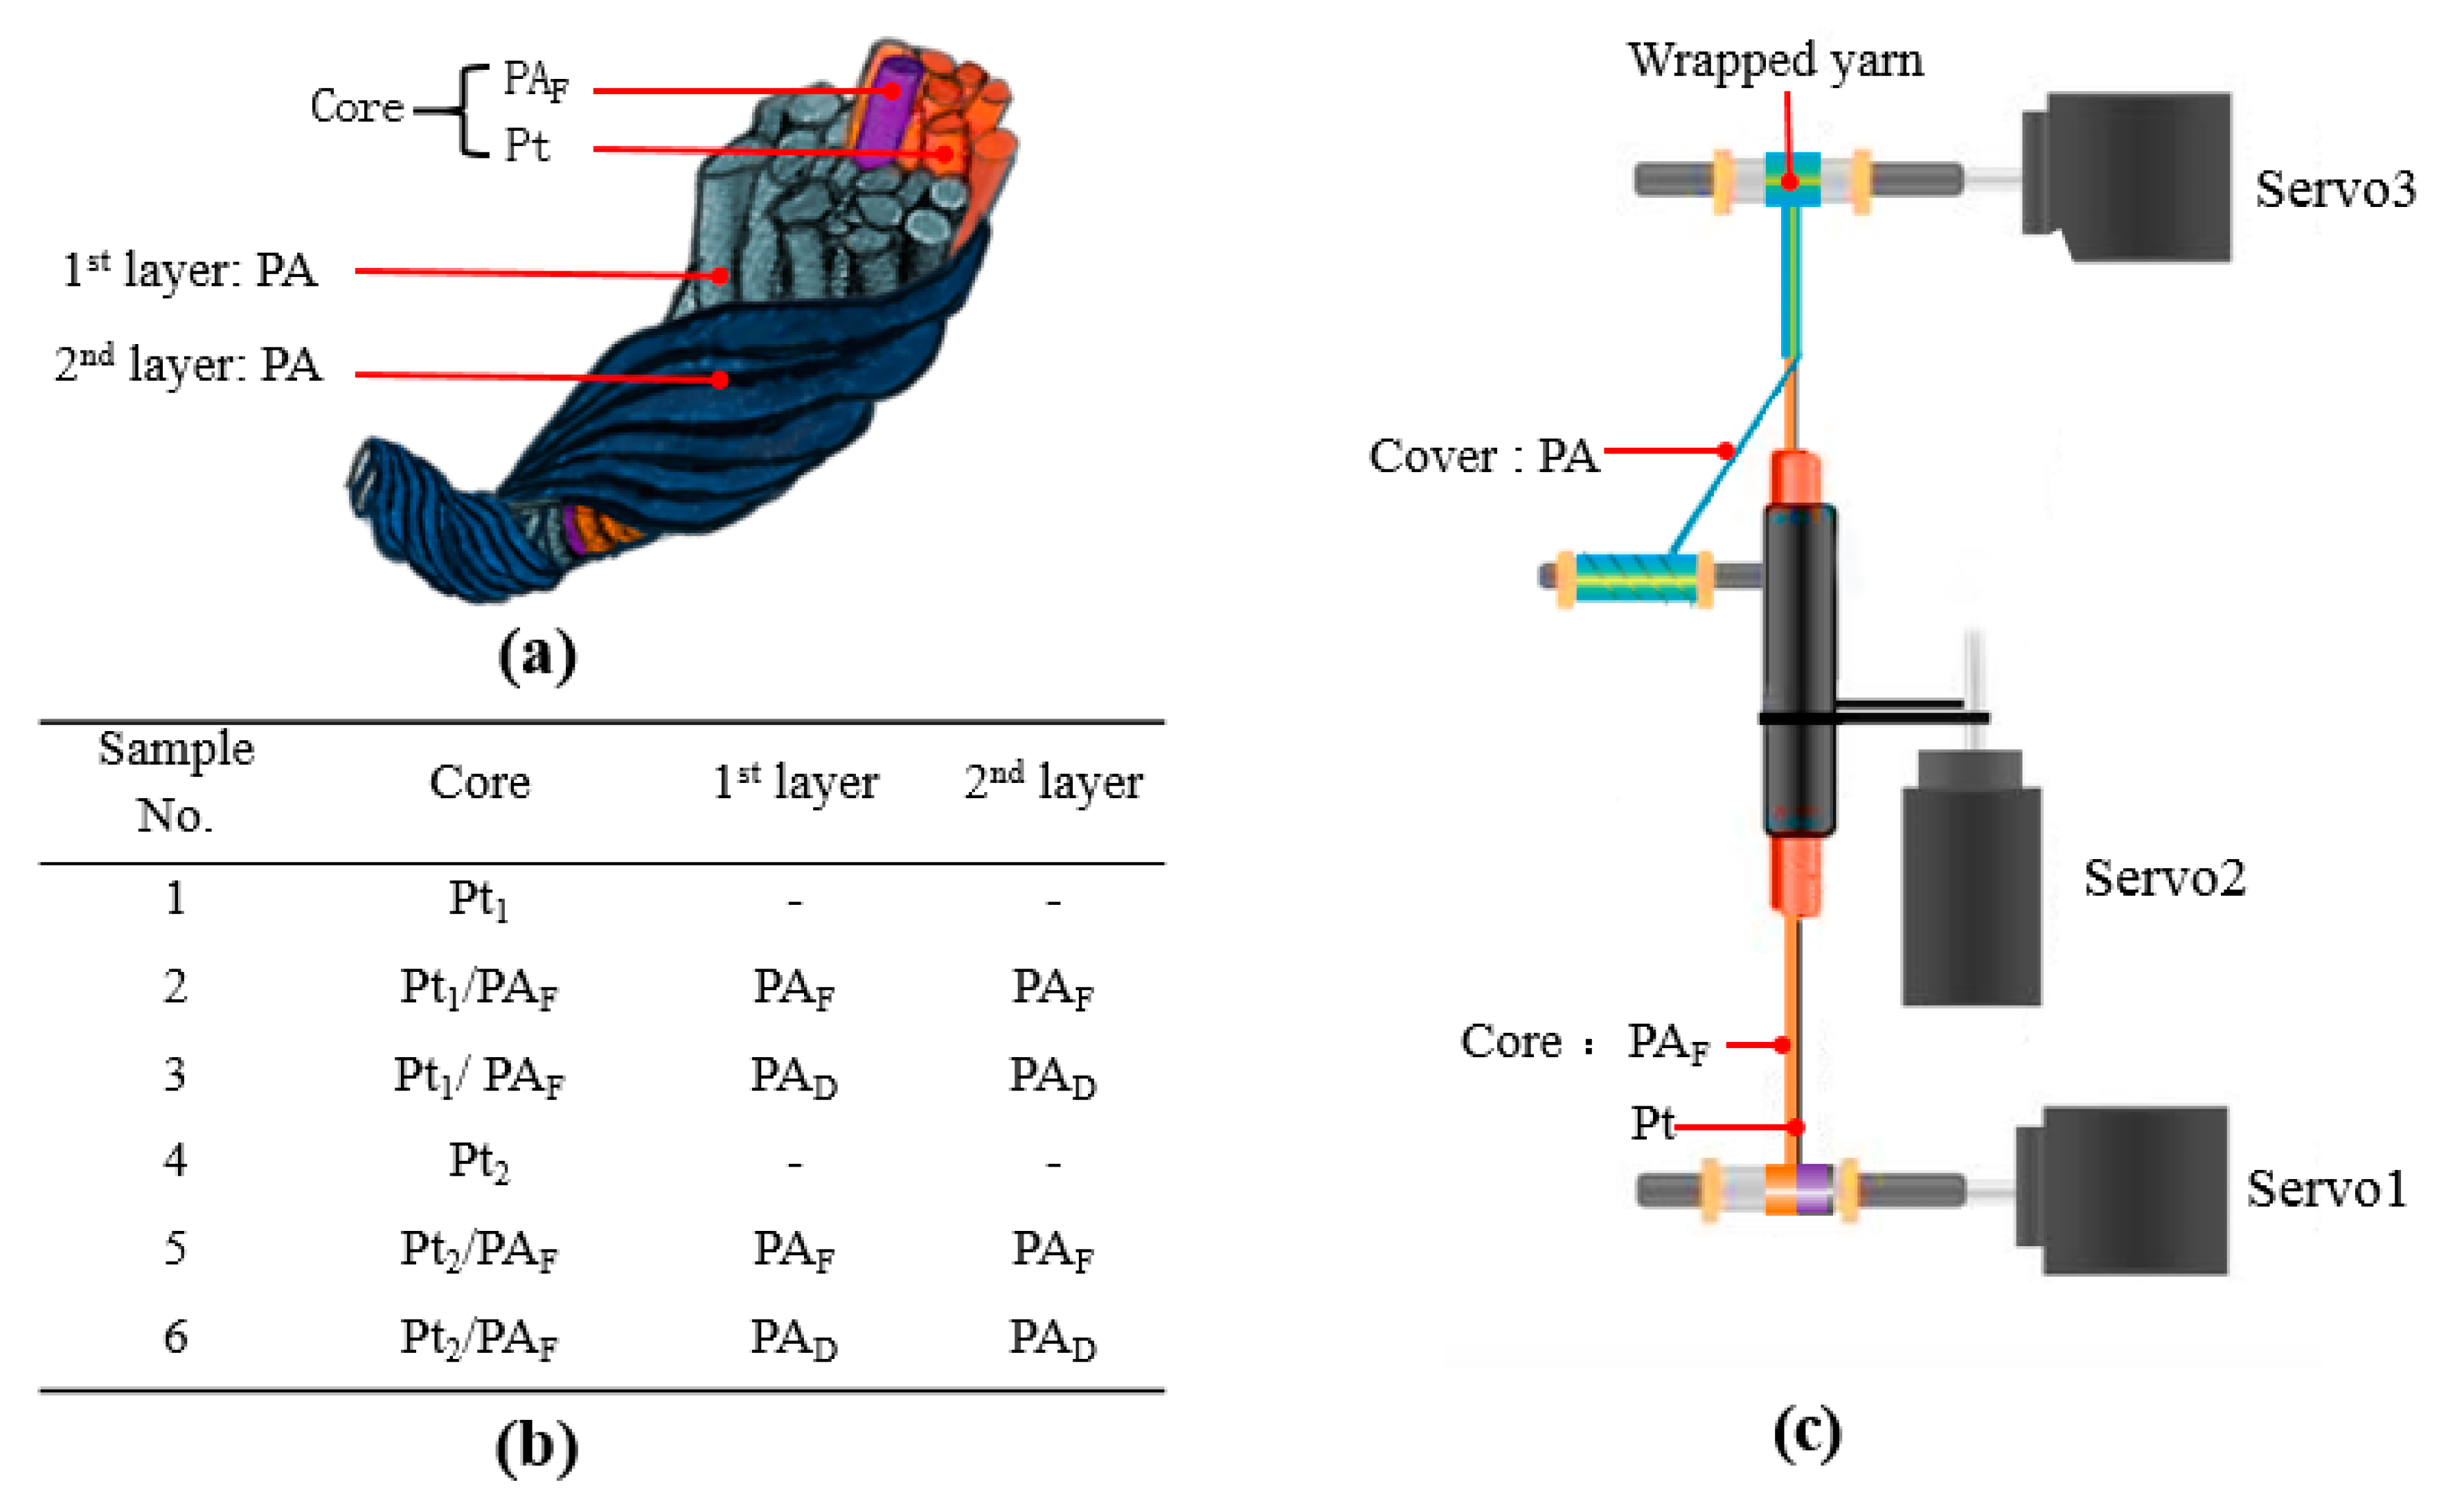
2.1. Fabrication of Wrapped Yarns
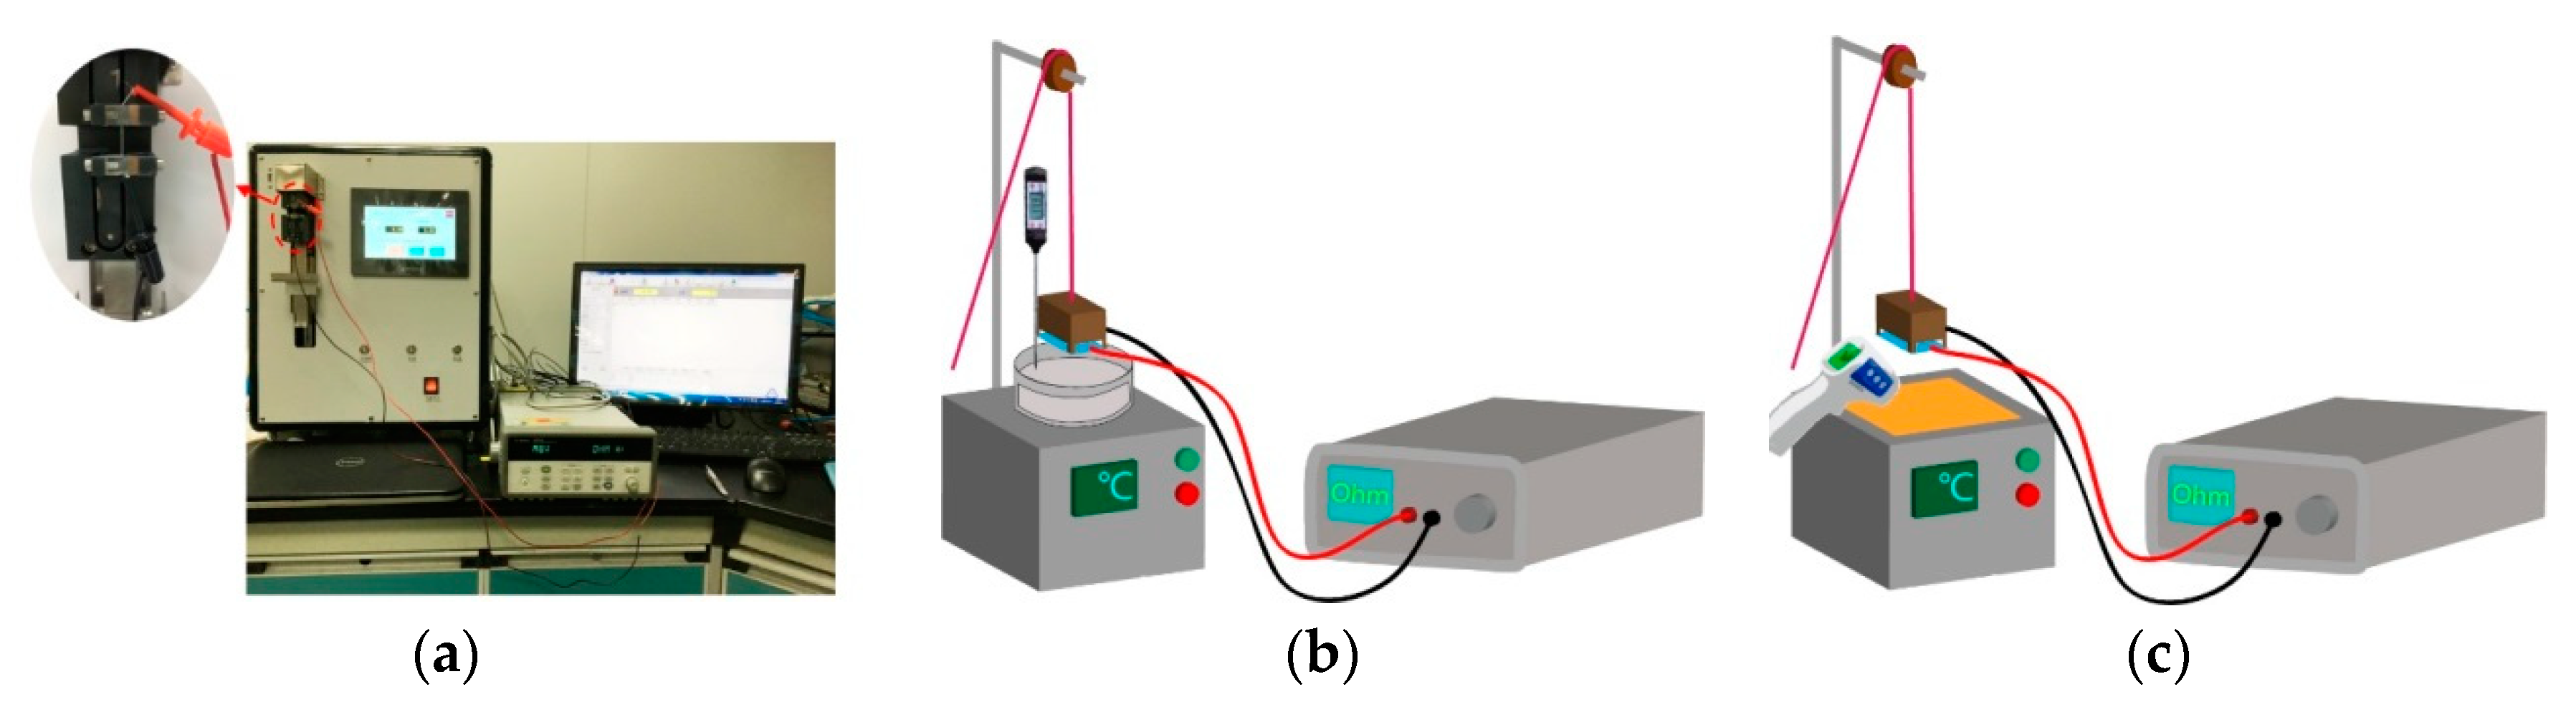
2.2. Characterization of Wrapped Yarns
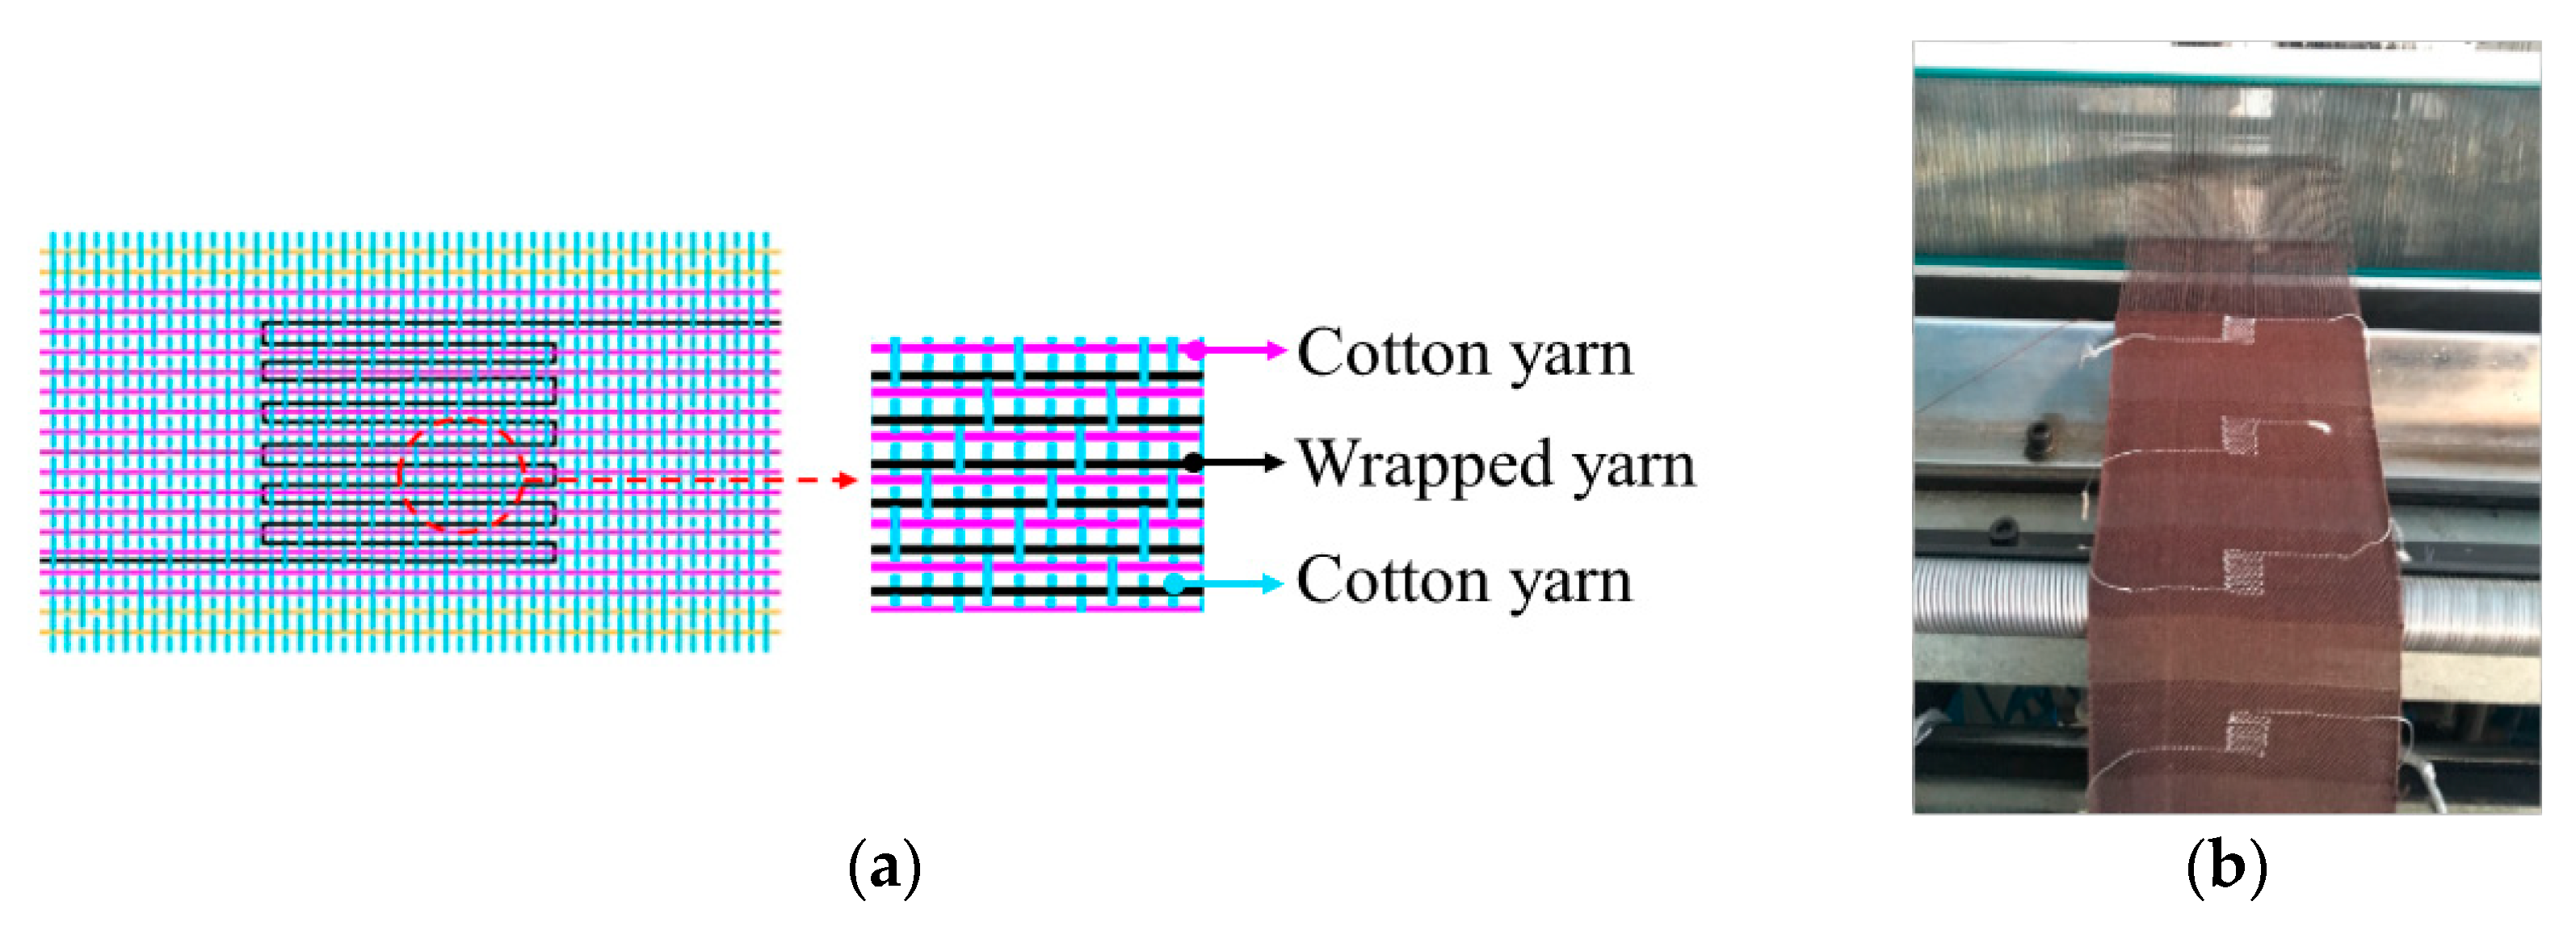
2.3. Fabrication and Characterization of Fabric Temperature Sensors
3. Results and Discussion
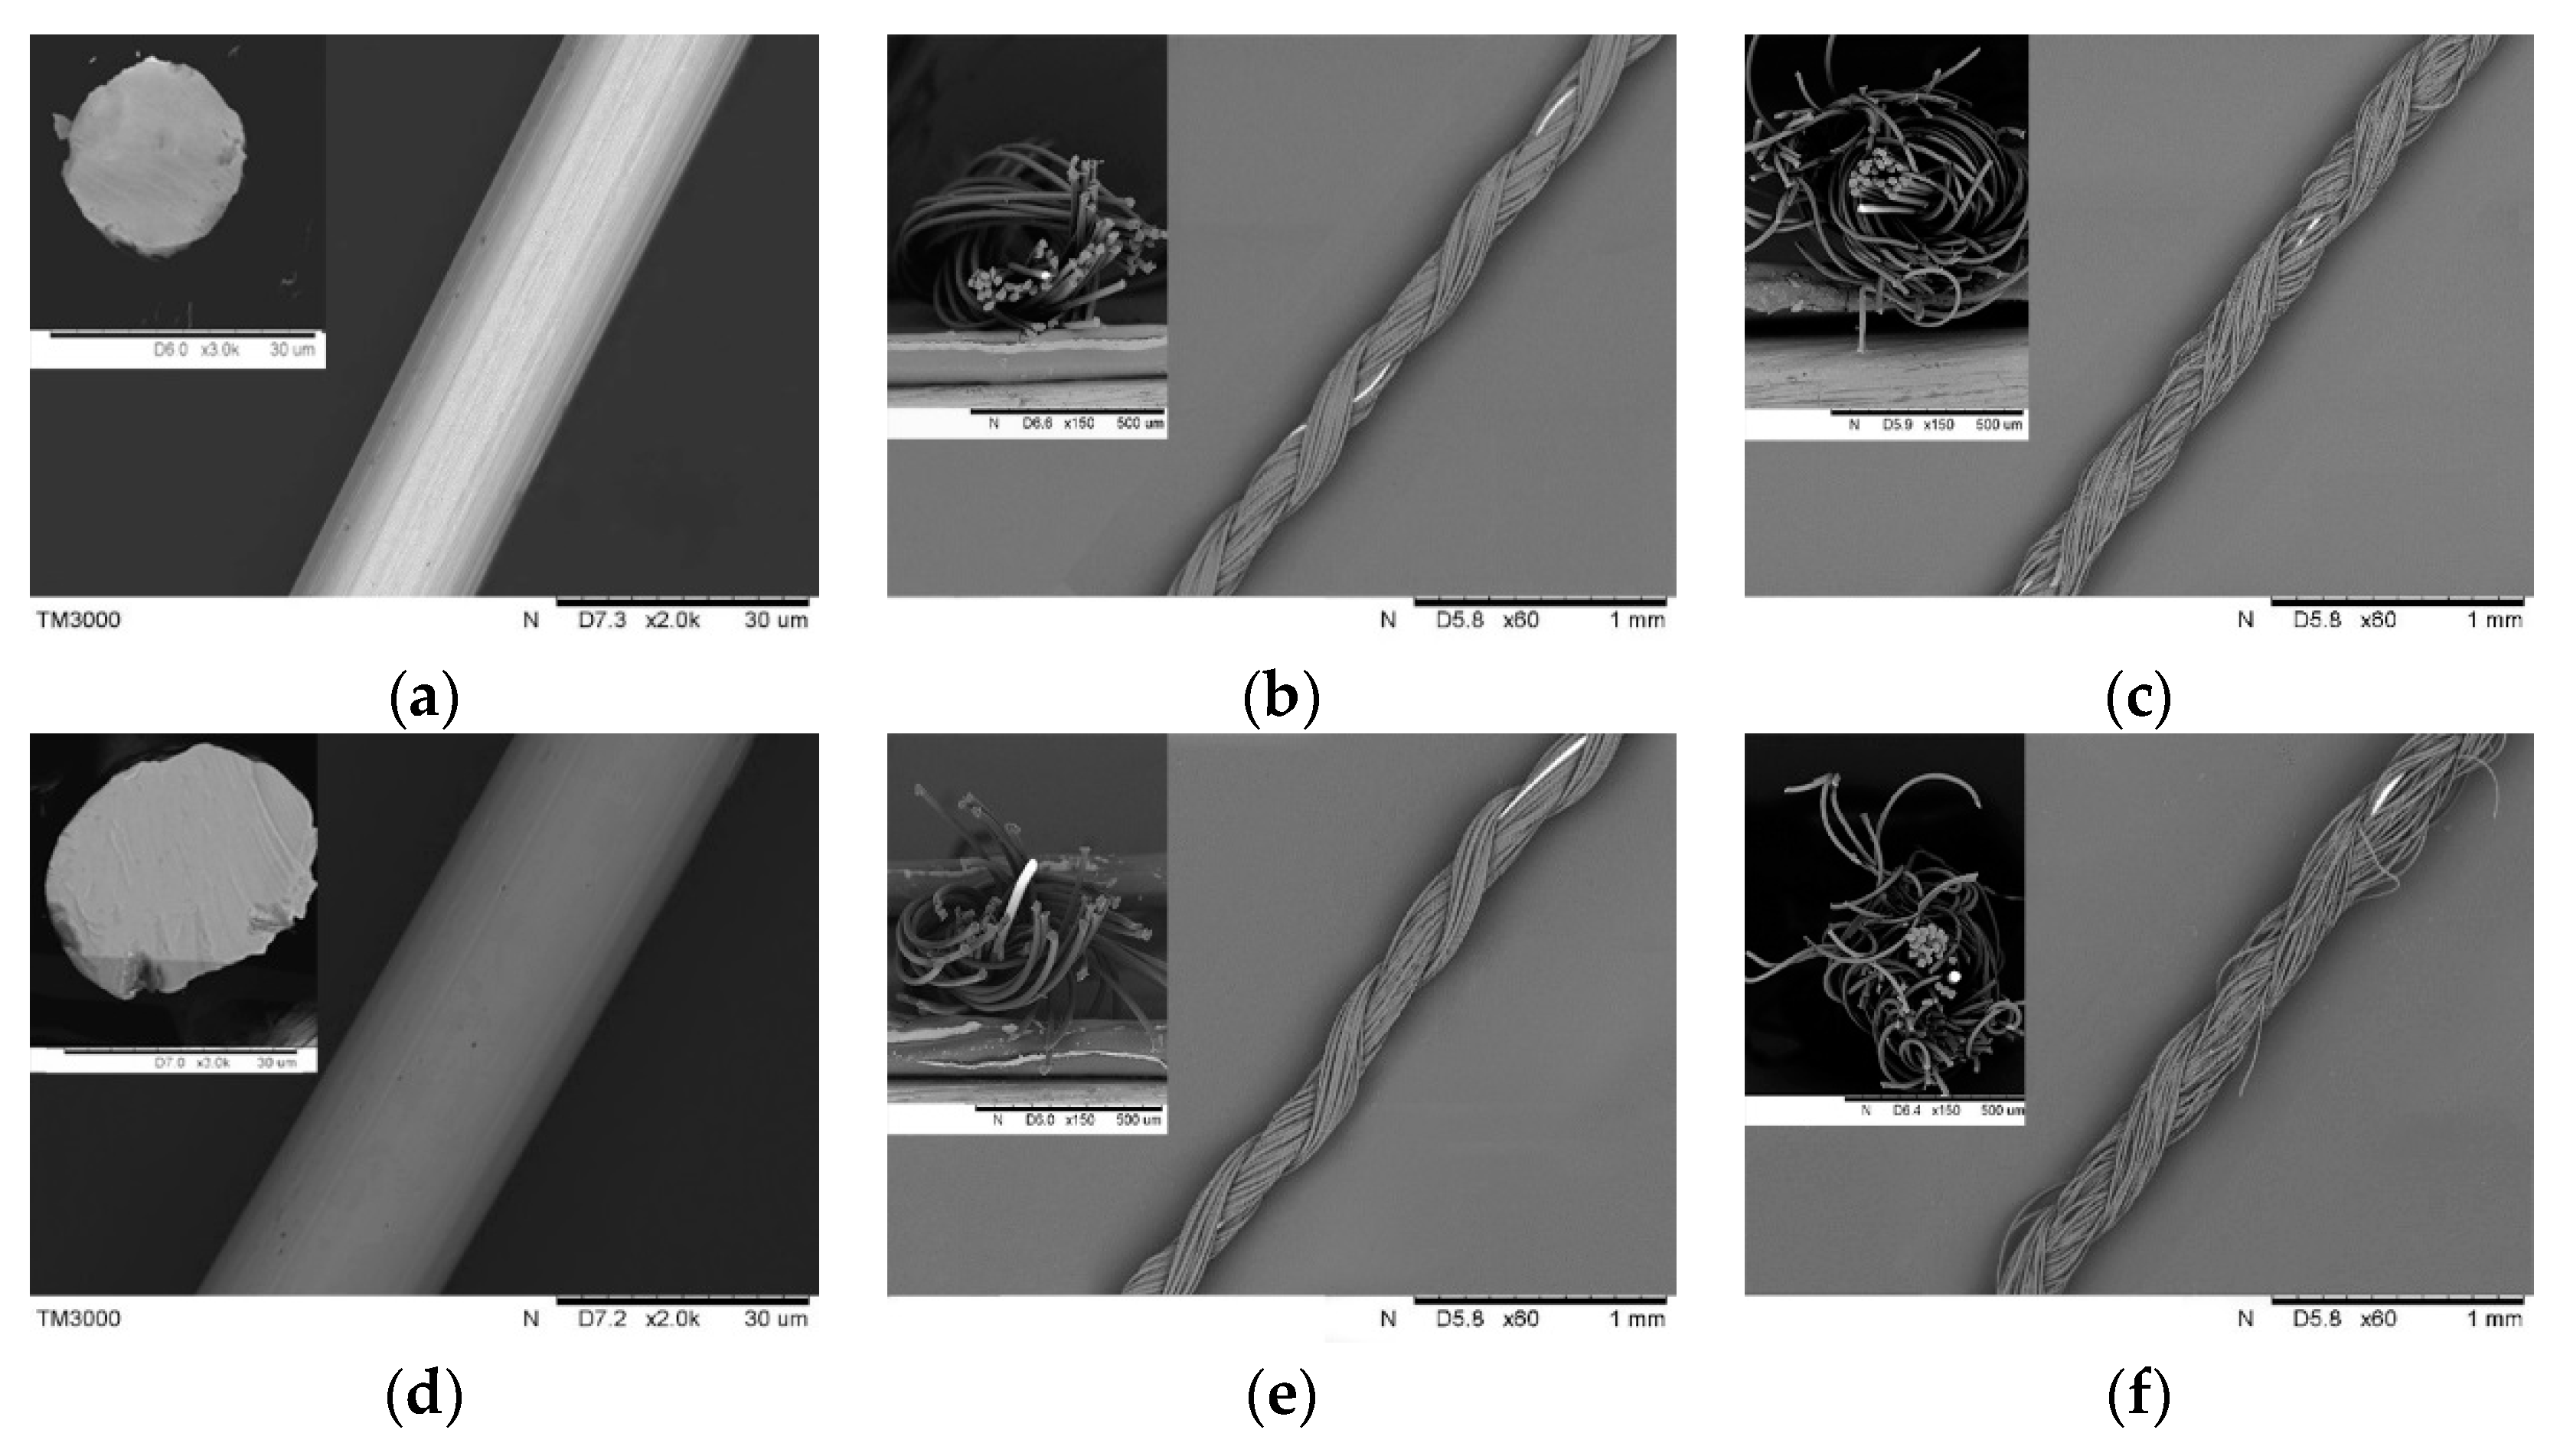
3.1. Pt/PA Wrapped Yarns
3.2. Fabric Temperature Sensors
4. Conclusions
Author Contributions
Funding
Conflicts of Interest
References
- Castano, L.M.; Flatau, A.B. Smart fabric sensors and e-textile technologies: A review. Smart Mater. Struct. 2014, 23, 053001. [Google Scholar] [CrossRef]
- Zeng, W.; Shu, L.; Li, Q.; Chen, S.; Wang, F.; Tao, X.M. Fiber-Based Wearable Electronics: A Review of Materials, Fabrication, Devices, and Applications. Adv. Mater. 2014, 26, 5310–5336. [Google Scholar] [CrossRef]
- Wang, X.; Tao, X.M.; So, R.C.H.; Shu, L.; Yang, B.; Li, Y. Monitoring elbow isometric contraction by novel wearable fabric sensing device. Smart Mater. Struct. 2016, 25, 125022. [Google Scholar] [CrossRef]
- Son, D.; Lee, J.; Qiao, S.; Ghaffari, R.; Kim, J.; Lee, J.E.; Song, C.; Kim, S.J.; Lee, D.J.; Jun, S.W.; et al. Multifunctional wearable devices for diagnosis and therapy of movement disorders. Nat. Nanotechnol. 2014, 9, 397–404. [Google Scholar] [CrossRef]
- Schwartz, G.; Tee, B.C.K.; Mei, J.G.; Appleton, A.L.; Kim, D.H.; Wang, H.L.; Bao, Z.N. Flexible polymer transistors with high pressure sensitivity for application in electronic skin and health monitoring. Nat. Commun. 2013, 4, 1859. [Google Scholar] [CrossRef]
- Trung, T.Q.; Lee, N.E. Flexible and Stretchable Physical Sensor Integrated Platforms for Wearable Human-Activity Monitoring and Personal Healthcare. Adv. Mater. 2016, 28, 4338–4372. [Google Scholar] [CrossRef]
- Wang, X.; Tao, X.M.; So, R.C.H. A Bio-mechanical Model for Elbow Isokinetic and Isotonic Flexions. Sci. Rep. 2017, 7, 8919. [Google Scholar] [CrossRef]
- Li, Q.; Zhang, L.N.; Tao, X.M.; Ding, X. Review of Flexible Temperature Sensing Networks for Wearable Physiological Monitoring. Adv. Healthc. Mater. 2017, 6, 1601371. [Google Scholar] [CrossRef]
- Chen, Y.; Lu, B.W.; Chen, Y.H.; Feng, X. Breathable and Stretchable Temperature Sensors Inspired by Skin. Sci. Rep. 2015, 5, 11505. [Google Scholar] [CrossRef]
- Webb, R.C.; Bonifas, A.P.; Behnaz, A.; Zhang, Y.H.; Yu, K.J.; Cheng, H.Y.; Shi, M.X.; Bian, Z.G.; Liu, Z.J.; Kim, Y.S.; et al. Ultrathin conformal devices for precise and continuous thermal characterization of human skin. Nat. Mater. 2013, 12, 1078. [Google Scholar] [CrossRef]
- Hussain, A.M.; Lizardo, E.B.; Sevilla, G.A.T.; Nassar, J.M.; Hussain, M.M. Ultrastretchable and Flexible Copper Interconnect-Based Smart Patch for Adaptive Thermotherapy. Adv. Healthc. Mater. 2015, 4, 665–673. [Google Scholar] [CrossRef]
- Li, Q.; Ran, Z.Y.; Ding, X.; Wang, X. Fabric Circuit Board Connecting to Flexible Sensors or Rigid Components for Wearable Applications. Sensors 2019, 19, 3745. [Google Scholar] [CrossRef]
- Lee, C.Y.; Wu, G.W.; Hsieh, W.J. Fabrication of micro sensors on a flexible substrate. Sens. Actuators A Phys. 2008, 147, 173–176. [Google Scholar] [CrossRef]
- Takei, K.; Honda, W.; Harada, S.; Arie, T.; Akita, S. Toward Flexible and Wearable Human-Interactive Health-Monitoring Devices. Adv. Healthc. Mater. 2015, 4, 487–500. [Google Scholar] [CrossRef]
- Lee, C.Y.; Lee, S.J.; Tang, M.S.; Chen, P.C. In Situ Monitoring of Temperature inside Lithium-Ion Batteries by Flexible Micro Temperature Sensors. Sensors 2011, 11, 9942–9950. [Google Scholar] [CrossRef]
- Chen, Z.J.; Zhang, K.Y.; Tong, X.; Liu, Y.H.; Hu, C.Y.; Liu, S.J.; Yu, Q.; Zhao, Q.; Huang, W. Phosphorescent Polymeric Thermometers for In Vitro and In Vivo Temperature Sensing with Minimized Background Interference. Adv. Funct. Mater. 2016, 26, 4386–4396. [Google Scholar] [CrossRef]
- Ramakrishnan, M.; Rajan, G.; Semenova, Y.; Farrell, G. Overview of Fiber Optic Sensor Technologies for Strain/Temperature Sensing Applications in Composite Materials. Sensors 2016, 16, 99. [Google Scholar] [CrossRef]
- Hong, S.Y.; Lee, Y.H.; Park, H.; Jin, S.W.; Jeong, Y.R.; Yun, J.; You, I.; Zi, G.; Ha, J.S. Stretchable Active Matrix Temperature Sensor Array of Polyaniline Nanofibers for Electronic Skin. Adv. Mater. 2016, 28, 930–935. [Google Scholar] [CrossRef]
- Yang, J.; Wei, D.P.; Tang, L.L.; Song, X.F.; Luo, W.; Chu, J.; Gao, T.P.; Shi, H.F.; Du, C.L. Wearable temperature sensor based on graphene nanowalls. RSC Adv. 2015, 5, 25609–25615. [Google Scholar] [CrossRef]
- Ahmed, M.; Chitteboyina, M.M.; Butler, D.P.; Celik-Butler, Z. Temperature Sensor in a Flexible Substrate. IEEE Sens. J. 2012, 12, 864–869. [Google Scholar] [CrossRef]
- Xiao, S.Y.; Che, L.F.; Li, X.X.; Wang, Y.L. A cost-effective flexible MEMS technique for temperature sensing. Microelectron. J. 2007, 38, 360–364. [Google Scholar] [CrossRef]
- Sadasivuni, K.K.; Kafy, A.; Kim, H.C.; Ko, H.U.; Mun, S.; Kim, J. Reduced graphene oxide filled cellulose films for flexible temperature sensor application. Synth. Met. 2015, 206, 154–161. [Google Scholar] [CrossRef]
- Yokota, T.; Inoue, Y.; Terakawa, Y.; Reeder, J.; Kaltenbrunner, M.; Ware, T.; Yang, K.J.; Mabuchi, K.; Murakawa, T.; Sekino, M.; et al. Ultraflexible, large-area, physiological temperature sensors for multipoint measurements. Proc. Natl. Acad. Sci. USA 2015, 112, 14533–14538. [Google Scholar] [CrossRef]
- Huo, X.Y.; Liu, H.X.; Liang, Y.R.; Fu, M.Q.; Sun, W.Q.; Chen, Q.; Xu, S.Y. A Nano-Stripe Based Sensor for Temperature Measurement at the Submicrometer and Nano Scales. Small 2014, 10, 3869–3875. [Google Scholar] [CrossRef]
- Jeon, J.; Lee, H.B.R.; Bao, Z. Flexible Wireless Temperature Sensors Based on Ni Microparticle-Filled Binary Polymer Composites. Adv. Mater. 2013, 25, 850–855. [Google Scholar] [CrossRef]
- Zhang, Y.H.; Webb, R.C.; Luo, H.Y.; Xue, Y.G.; Kurniawan, J.; Cho, N.H.; Krishnan, S.; Li, Y.H.; Huang, Y.G.; Rogers, J.A. Theoretical and Experimental Studies of Epidermal Heat Flux Sensors for Measurements of Core Body Temperature. Adv. Healthc. Mater. 2016, 5, 119–127. [Google Scholar] [CrossRef]
- Yoon, S.; Sim, J.K.; Cho, Y.H. A Flexible and Wearable Human Stress Monitoring Patch. Sci. Rep. 2016, 6, 23468. [Google Scholar] [CrossRef]
- Yang, Y.J.; Cheng, M.Y.; Shih, S.C.; Huang, X.H.; Tsao, C.M.; Chang, F.Y.; Fan, K.C. A 32 × 32 temperature and tactile sensing array using PI-copper films. Int. J. Adv. Manuf. Tech. 2010, 46, 945–956. [Google Scholar] [CrossRef]
- Koh, K.H.; Yu, C.W. Comparing the accuracy of skin sensor temperature at two placement sites to axillary temperature in term infants under radiant warmers. J. Neonatal Nurs. 2016, 22, 196–203. [Google Scholar] [CrossRef]
- Li, Q.; Chen, H.; Ran, Z.Y.; Zhang, L.N.; Xiang, R.F.; Wang, X.; Tao, X.M.; Ding, X. Full fabric sensing network with large deformation for continuous detection of skin temperature. Smart Mater. Struct. 2018, 27, 105017. [Google Scholar] [CrossRef]
- Li, Q.; Tao, X.M. Three-dimensionally deformable, highly stretchable, permeable, durable and washable fabric circuit boards. Proc. R. Soc. A Math. Phys. Eng. Sci. 2014, 470, 1471–2946. [Google Scholar] [CrossRef]
- Li, Q.; Tao, X.M. A stretchable knitted interconnect for three-dimensional curvilinear surfaces. Text. Res. J. 2011, 81, 1171–1182. [Google Scholar]
- Yu, Z.C.; Zhang, J.F.; Lou, C.W.; Lin, J.H. Investigation and fabrication of multifunctional metal composite knitted fabrics. Text. Res. J. 2014, 85, 188–199. [Google Scholar] [CrossRef]
- Ortlek, H.G.; Saracoglu, O.G.; Saritas, O.; Bilgin, S. Electromagnetic shielding characteristics of woven fabrics made of hybrid yarns containing metal wire. Fibers Polym. 2012, 13, 63–67. [Google Scholar] [CrossRef]
- Shao, H.Q.; Chen, N.L.; Jiang, J.; Xiong, L.; Shao, G.; Kong, J. Empirical Model for Evaluating Covered Effect on Polyimide/Metal Wire Cowrapped Yarn by Response Surface Methodology. J. Donghua Univ. Engl. Ed. 2016, 33, 520–523. [Google Scholar]
- Sunter, N. Investigation of Polyacrylic/Metal Wire Composite Yarn Characteristics Manufactured on Fancy Yarn Machine. Mater. Manuf. Proc. 2013, 28, 650–656. [Google Scholar]
- Yu, Z.C.; Zhang, J.F.; Lou, C.W.; Lin, J.H. Processing and Properties of Multifunctional Metal Composite Yarns and Woven Fabric. Mater. Manuf. Proc. 2015, 30, 320–326. [Google Scholar] [CrossRef]
- Li, F.Y.; Yan, S.Y.; Cheng, X.W. Performance of Electrically Conductive Fabrics Based on Polyester/Metal Wire Wrapped Yarns. Adv. Mater. Res. 2011, 287, 2543–2546. [Google Scholar] [CrossRef]
- Bedeloglu, A.; Sunter, N.; Bozkurt, Y. Manufacturing and Properties of Yarns Containing Metal Wires. Mater. Manuf. Proc. 2011, 26, 1378–1382. [Google Scholar] [CrossRef]
- Bedeloglu, A.; Sunter, N.; Yildirim, B.; Bozkurt, Y. Bending and tensile properties of cotton/metal wire complex yarns produced for electromagnetic shielding and conductivity applications. J. Text. Inst. 2012, 103, 1304–1311. [Google Scholar] [CrossRef]
- Lou, C.W. Process of Complex Core Spun Yarn Containing a Metal Wire. Text. Res. J. 2005, 75, 466–473. [Google Scholar] [CrossRef]
- Hashemian, H.M. Response time testing of temperature sensors using loop current step response method. AIP Conf. Proc. 2013, 1552, 949. [Google Scholar]
- SINOPEC Shanghai Engineering Company Limited (SSEC). Chemical Process. Design Handbook, 4th ed.; Chemical Industry: Beijing, China, 2009; pp. 1242–1249. [Google Scholar]


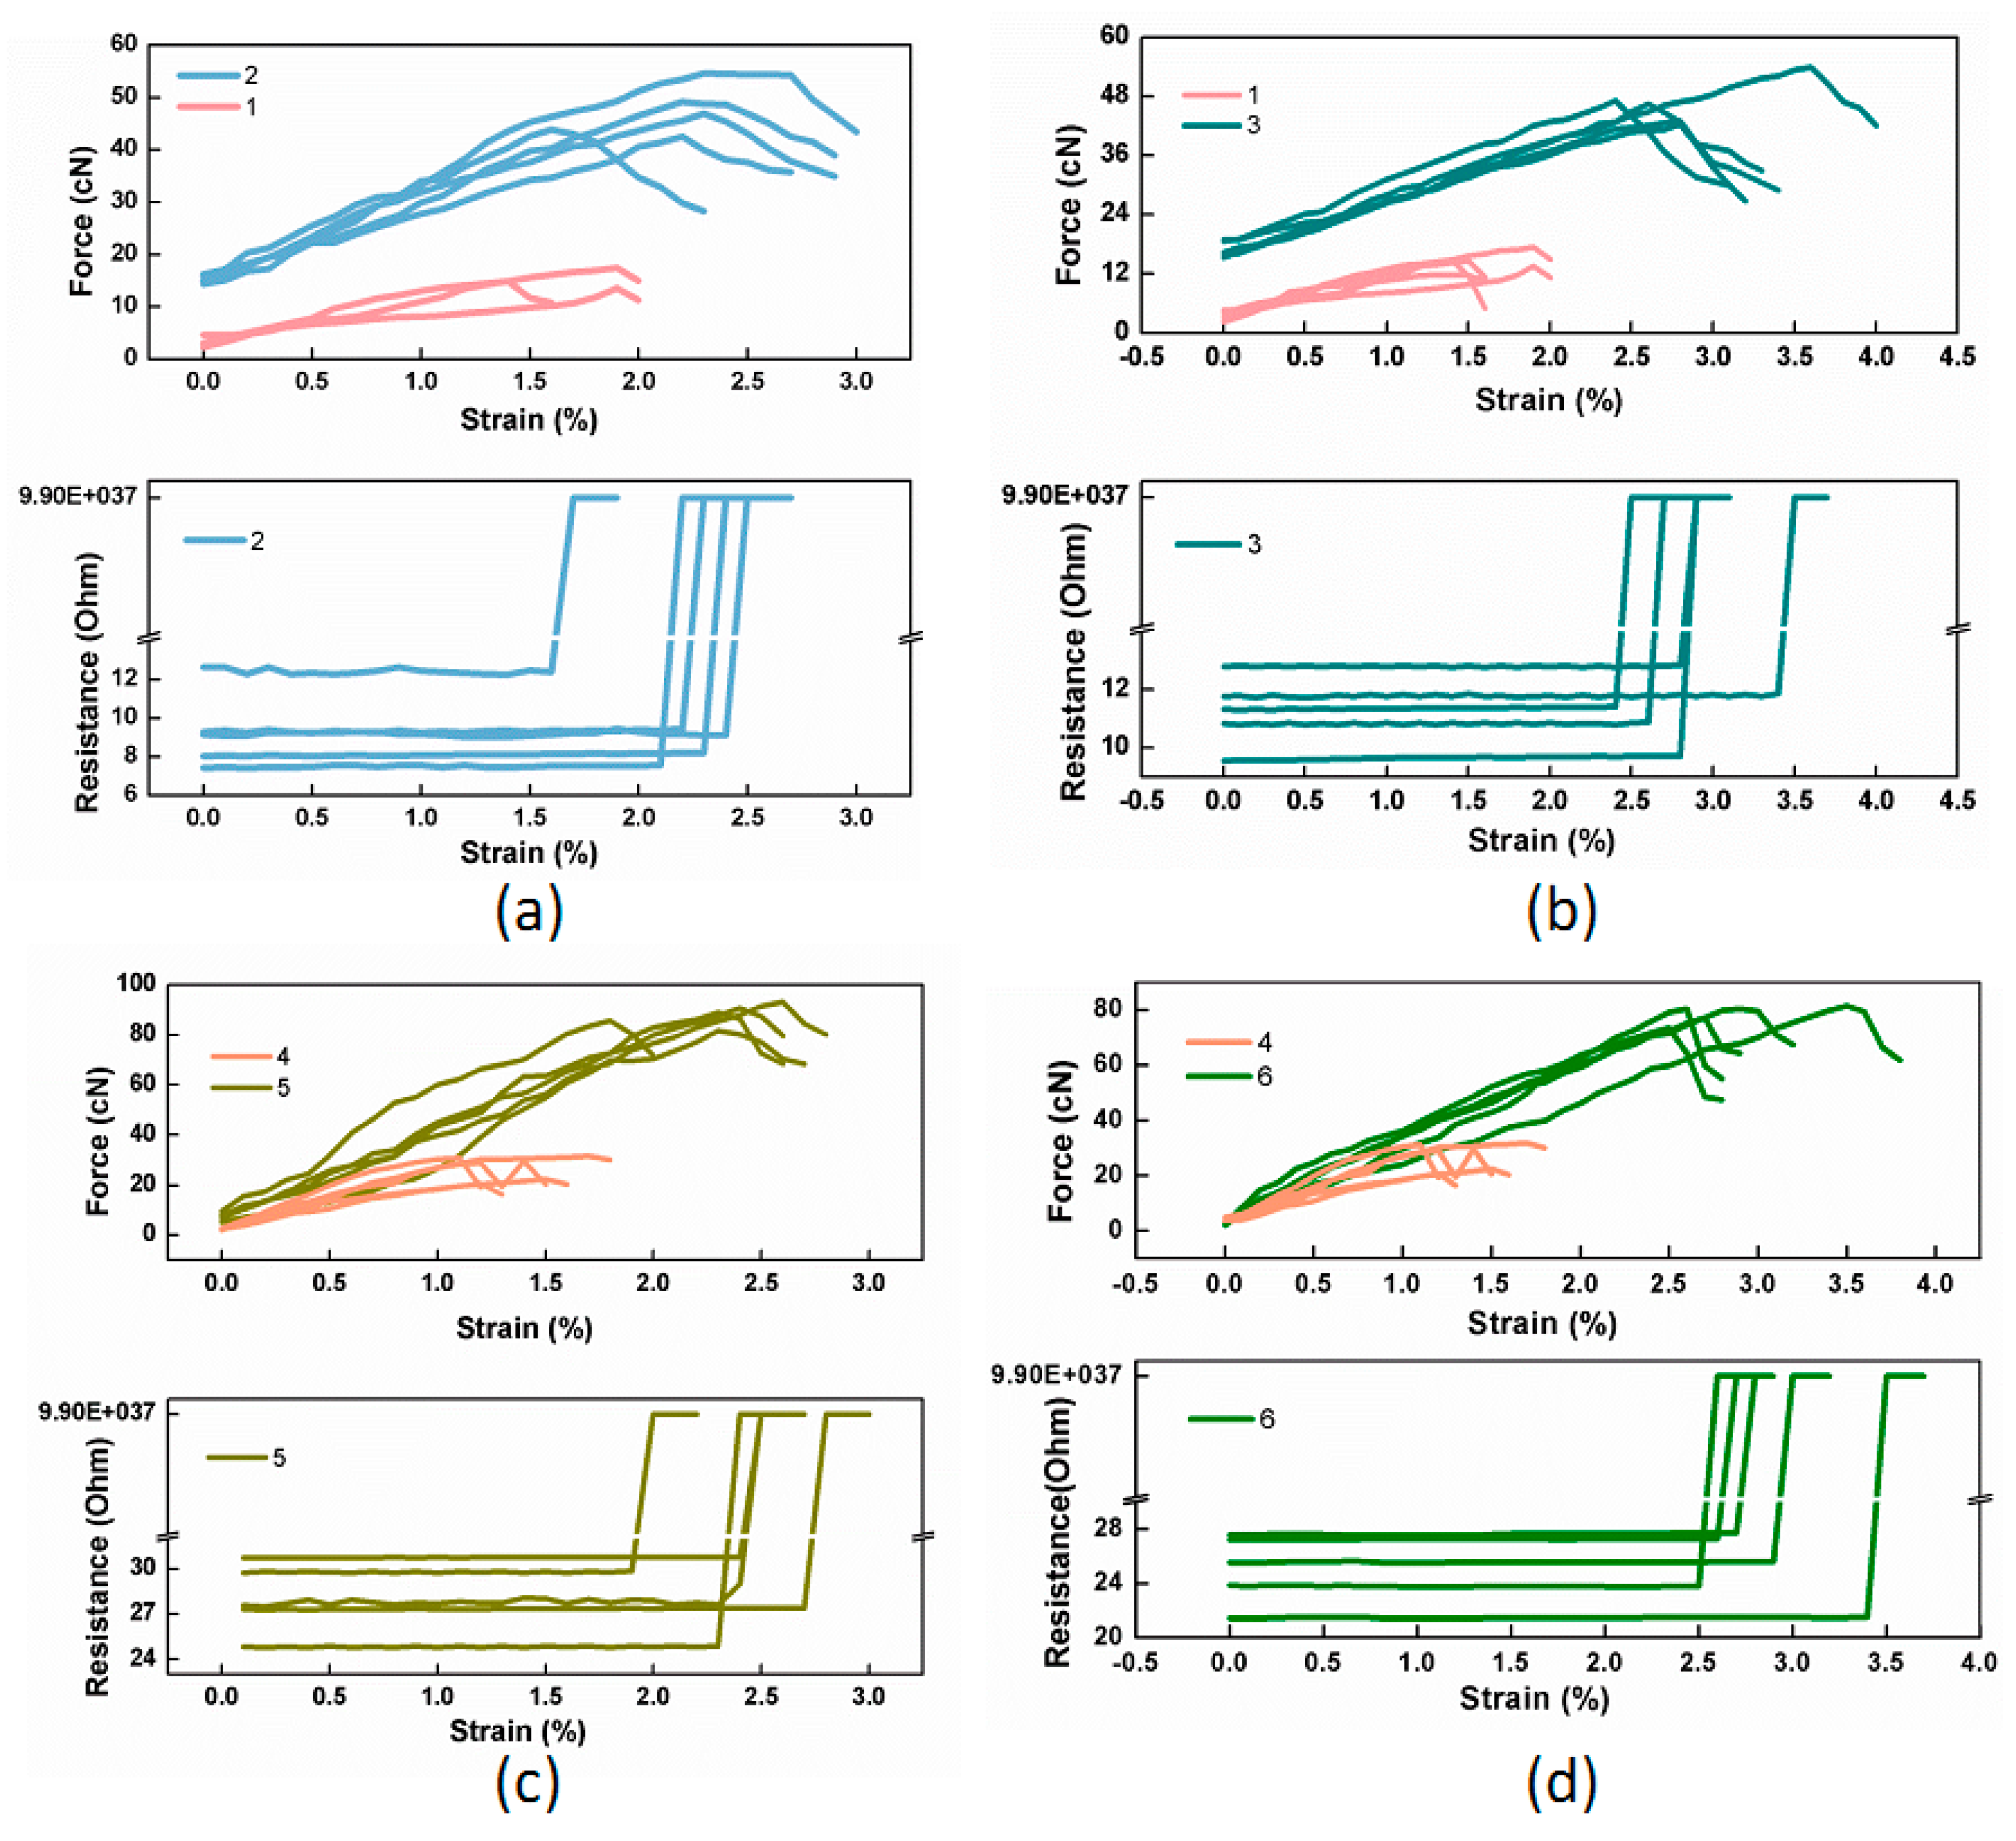
| Sample No. | Force (cN) | Deviation (±cN) | Strain (%) | Deviation (±%) |
|---|---|---|---|---|
| 1 | 17.79 | 0.56 | 1.16 | 0.13 |
| 2 | 47.36 | 2.39 | 2.12 | 0.15 |
| 3 | 46.58 | 2.33 | 2.84 | 0.23 |
| 4 | 31.31 | 0.75 | 1.13 | 0.14 |
| 5 | 88.06 | 2.24 | 2.28 | 0.13 |
| 6 | 78.57 | 1.69 | 2.84 | 0.19 |
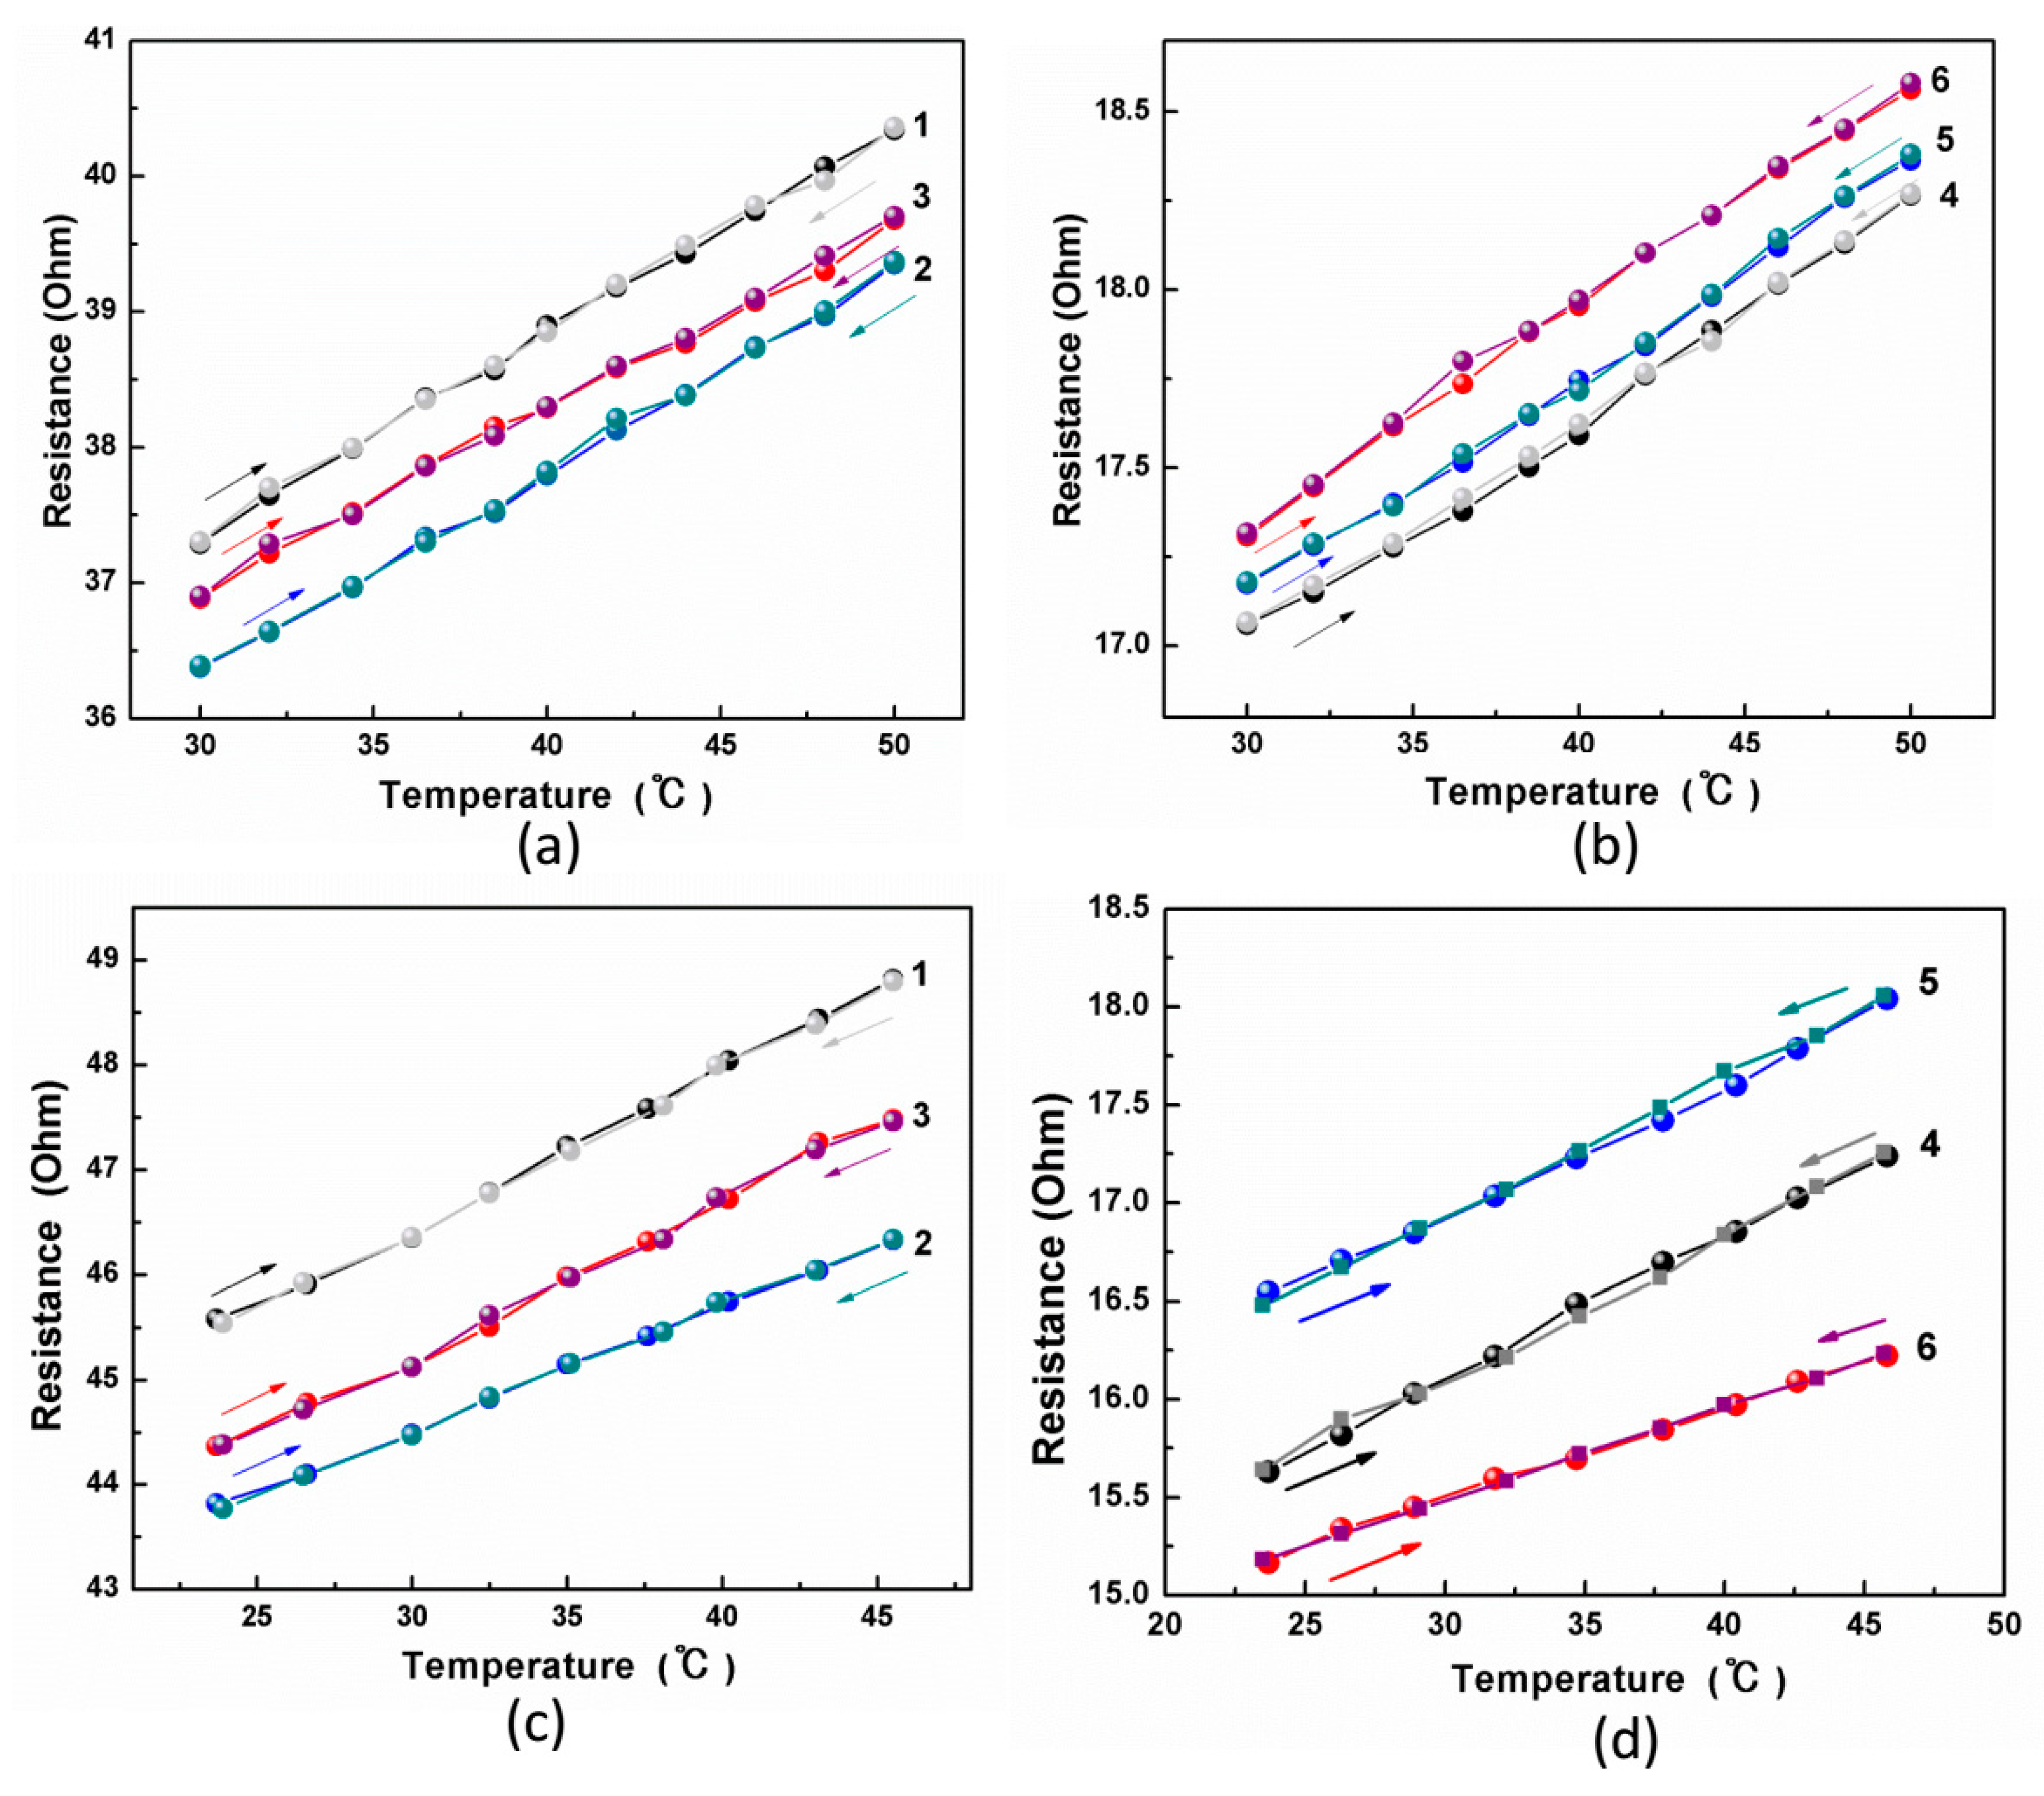
| Indicator | Environment | Process | 1 | 2 | 3 | 4 | 5 | 6 |
|---|---|---|---|---|---|---|---|---|
| α (Ω/°C) | Oilbath | Heating | 0.00381 | 0.00378 | 0.00352 | 0.00328 | 0.00323 | 0.00337 |
| Cooling | 0.00409 | 0.00410 | 0.00380 | 0.00352 | 0.00315 | 0.00365 | ||
| Hotplate | Heating | 0.00409 | 0.00315 | 0.00478 | 0.00325 | 0.00322 | 0.00263 | |
| Cooling | 0.00394 | 0.00292 | 0.00422 | 0.00308 | 0.00301 | 0.00255 | ||
| r2 | Oilbath | Heating | 0.99941 | 0.99913 | 0.99861 | 0.99783 | 0.99614 | 0.99882 |
| Cooling | 0.99904 | 0.99900 | 0.99907 | 0.99876 | 0.99826 | 0.99875 | ||
| Hotplate | Heating | 0.99891 | 0.99833 | 0.99928 | 0.99883 | 0.99487 | 0.99951 | |
| Cooling | 0.99961 | 0.99979 | 0.99836 | 0.99908 | 0.99842 | 0.99927 |
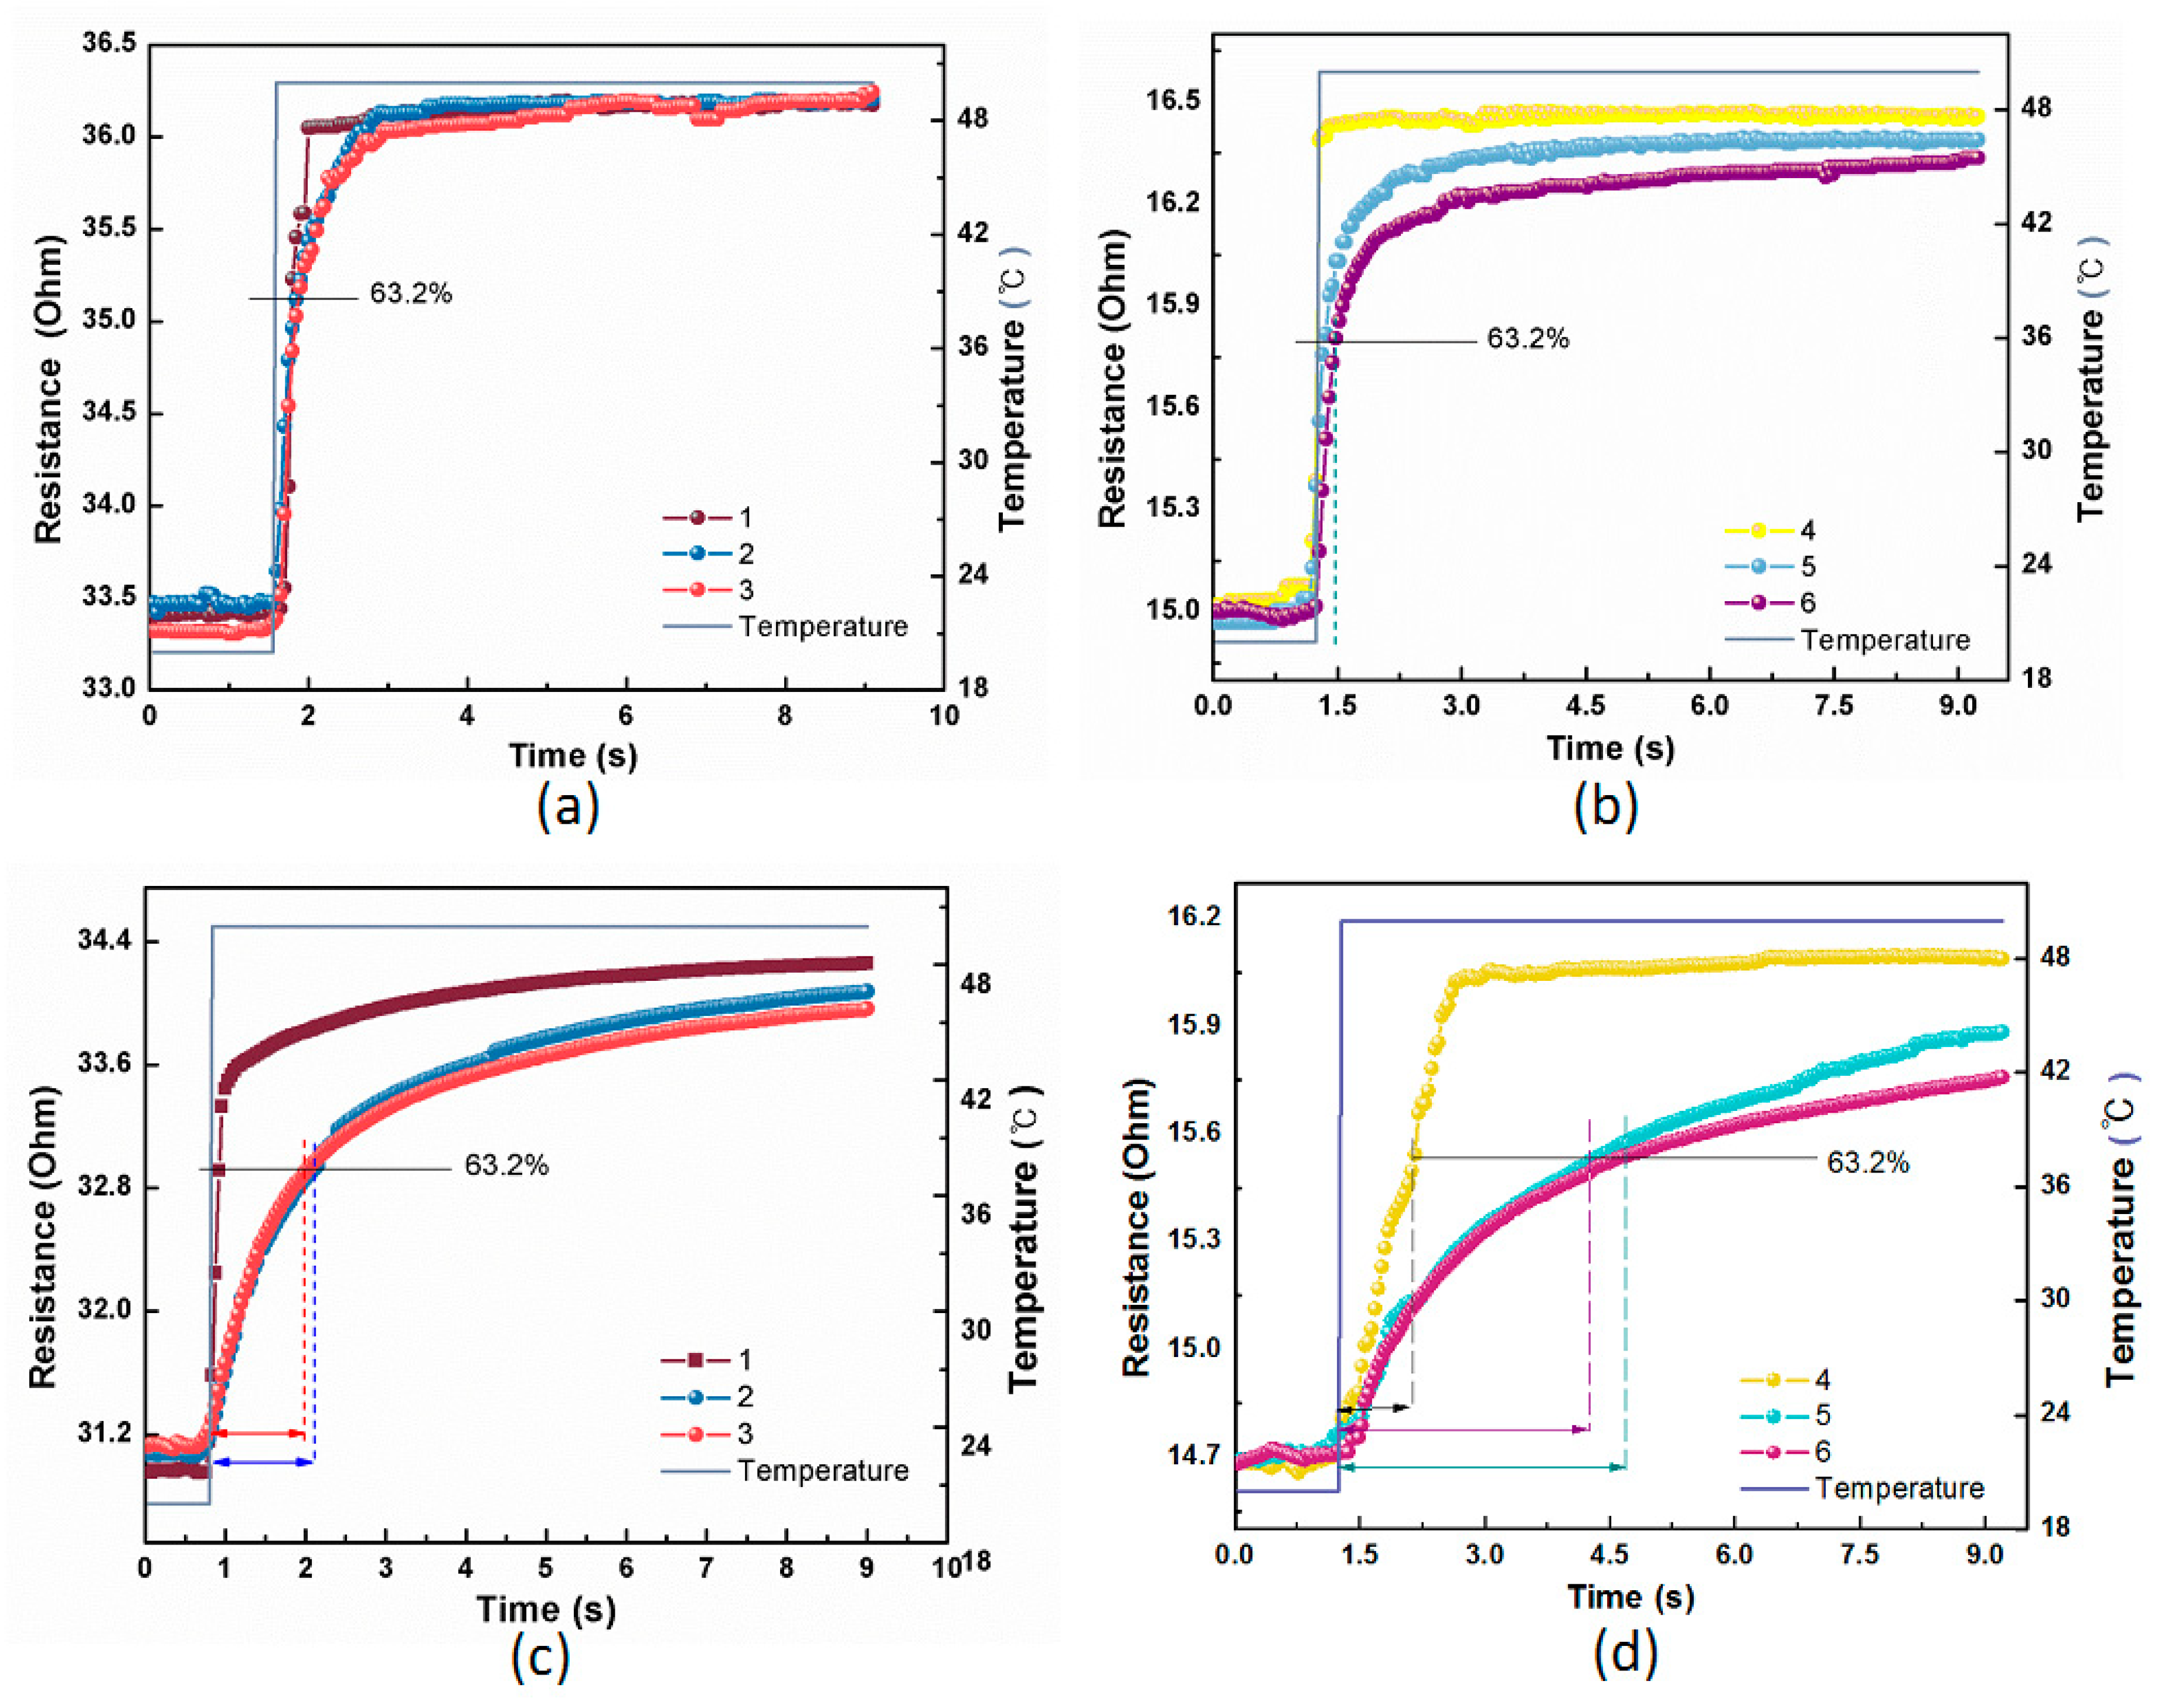
| Sample No. | Temperature Range (°C) | RTO 1 (s) | RTp 1 (s) |
|---|---|---|---|
| 1 | 20 ± 2–50 ± 2 | 0.25 ± 0.03 | 0.28 ± 0.12 |
| 2 | 0.55 ± 0.05 | 1.56 ± 0.10 | |
| 3 | 0.60 ± 0.04 | 2.28 ± 0.14 | |
| 4 | 0.15 ± 0.05 | 0.96 ± 0.08 | |
| 5 | 0.25 ± 0.10 | 3.92 ± 0.06 | |
| 6 | 0.25 ± 0.05 | 3.68 ± 0.06 |
| Material | Air | PA66 | Pt |
|---|---|---|---|
| λ(W/(m·°C) | 0.027 | 0.28 | 72 |
| Fabric Specimens | Temperature Range (°C) | RTf 1 (s) | RTb 1 (s) |
|---|---|---|---|
| #1 | 20 ± 2–50 ± 2 | 0.75 ± 0.05 | 0.70 ± 0.05 |
| #2 | 0.75 ± 0.10 | 0.85 ± 0.15 | |
| #3 | 0.95 ± 0.10 | 0.90± 0.10 | |
| #4 | 0.70 ± 0.05 | 0.75 ± 0.15 | |
| #5 | 0.95 ± 0.05 | 1.08 ± 0.10 | |
| #6 | 1.15 ± 0.10 | 0.85 ± 0.25 |
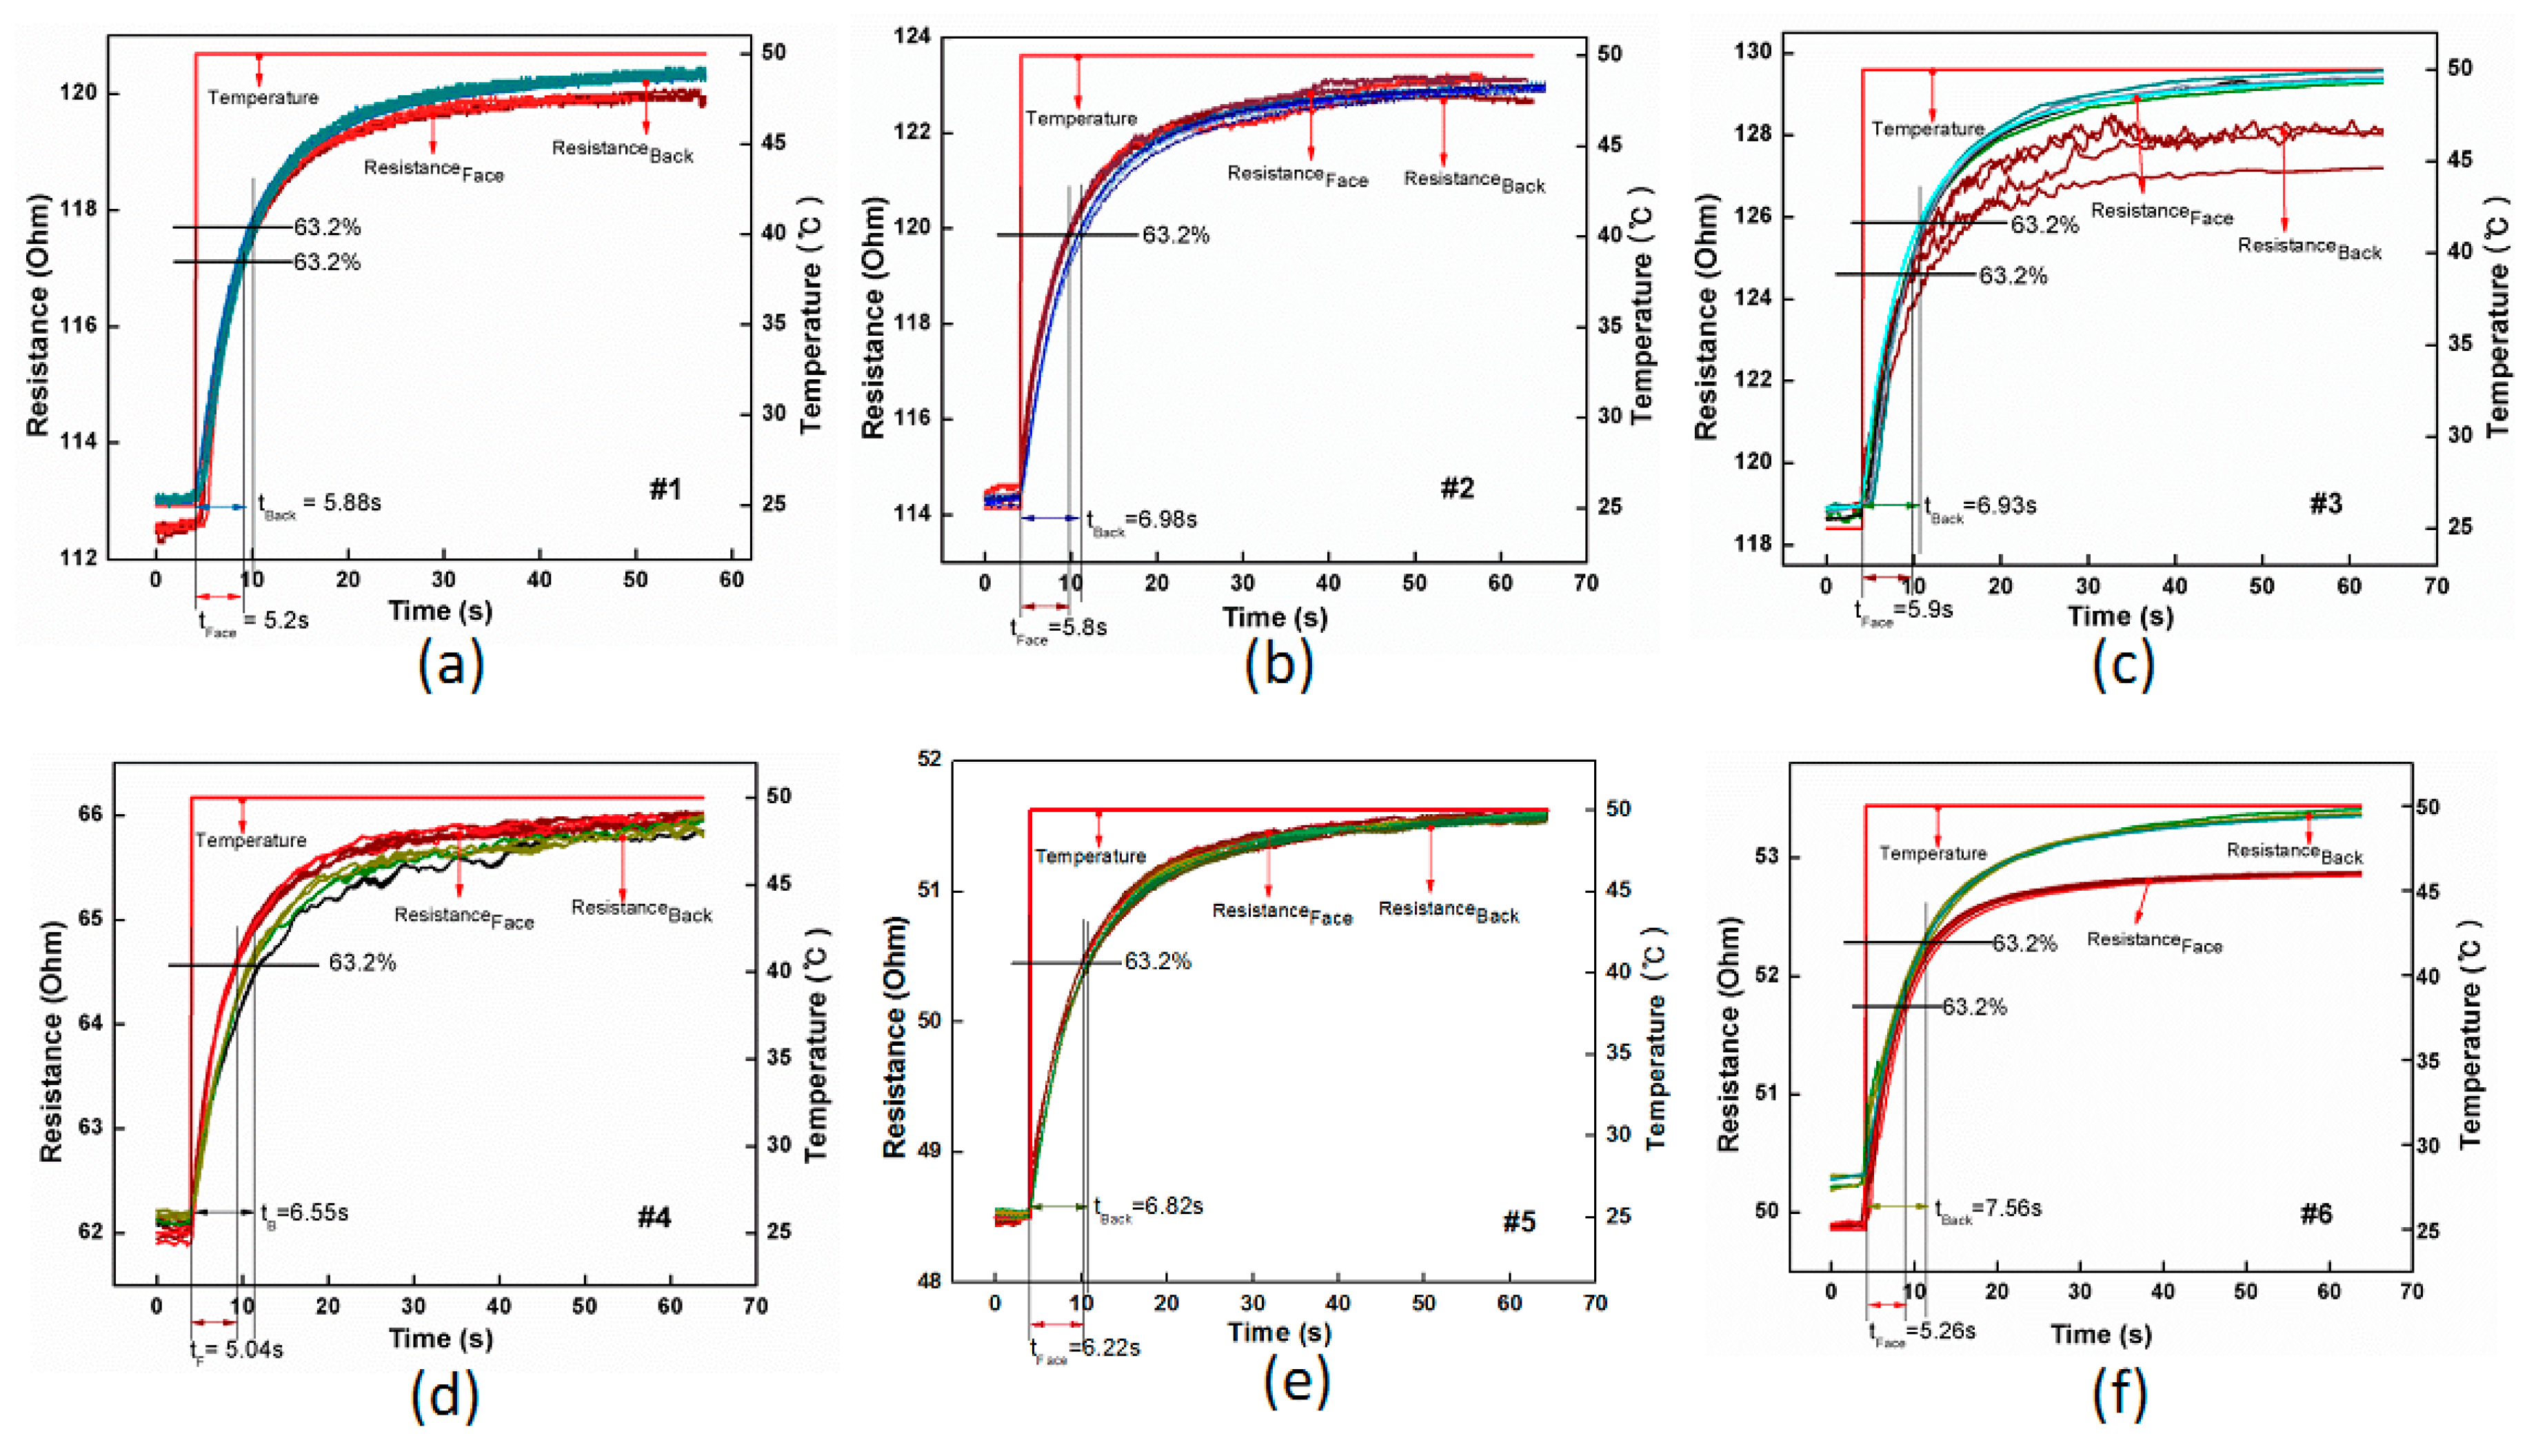
| Fabric Specimens | Temperature Range (°C) | RTf (s) | RTb (s) |
|---|---|---|---|
| #1 | 20 ± 2–50 ± 2 | 5.02 ± 0.19 | 5.88 ± 0.50 |
| #2 | 5.80 ± 0.33 | 6.98 ± 0.31 | |
| #3 | 5.90 ± 0.30 | 6.93 ± 0.28 | |
| #4 | 5.04 ± 0.12 | 6.55 ± 0.47 | |
| #5 | 6.22 ± 0.13 | 6.82 ± 0.20 | |
| #6 | 5.26 ± 0.30 | 7.56 ± 0.41 |
© 2019 by the authors. Licensee MDPI, Basel, Switzerland. This article is an open access article distributed under the terms and conditions of the Creative Commons Attribution (CC BY) license (http://creativecommons.org/licenses/by/4.0/).
Share and Cite
Yang, Q.; Wang, X.; Ding, X.; Li, Q. Fabrication and Characterization of Wrapped Metal Yarns-based Fabric Temperature Sensors. Polymers 2019, 11, 1549. https://doi.org/10.3390/polym11101549
Yang Q, Wang X, Ding X, Li Q. Fabrication and Characterization of Wrapped Metal Yarns-based Fabric Temperature Sensors. Polymers. 2019; 11(10):1549. https://doi.org/10.3390/polym11101549
Chicago/Turabian StyleYang, Qian, Xi Wang, Xin Ding, and Qiao Li. 2019. "Fabrication and Characterization of Wrapped Metal Yarns-based Fabric Temperature Sensors" Polymers 11, no. 10: 1549. https://doi.org/10.3390/polym11101549
APA StyleYang, Q., Wang, X., Ding, X., & Li, Q. (2019). Fabrication and Characterization of Wrapped Metal Yarns-based Fabric Temperature Sensors. Polymers, 11(10), 1549. https://doi.org/10.3390/polym11101549