Article

Roughness and Fiber Fraction Dominated Wetting of Electrospun Fiber-Based Porous Meshes

1
International Centre of Electron Microscopy for Materials Science, Faculty of Metals Engineering and Industrial Computer Science, AGH University of Science and Technology, 30-059 Kraków, Poland
2
Faculty of Materials Science and Ceramics, AGH University of Science and Technology, 30-059 Kraków, Poland
3
Academic Centre for Materials and Nanotechnology, AGH University of Science and Technology, 30-059 Kraków, Poland
4
Faculty of Physics and Applied Computer Science, AGH University of Science and Technology, 30-059 Kraków, Poland
*
Author to whom correspondence should be addressed.
Polymers 2019, 11(1), 34; https://doi.org/10.3390/polym11010034
Submission received: 6 November 2018 / Revised: 14 December 2018 / Accepted: 24 December 2018 / Published: 27 December 2018

Abstract

:
Wettability of electrospun fibers is one of the key parameters in the biomedical and filtration industry. Within this comprehensive study of contact angles on three-dimensional (3D) meshes made of electrospun fibers and films, from seven types of polymers, we clearly indicated the importance of roughness analysis. Surface chemistry was analyzed with X-ray photoelectron microscopy (XPS) and it showed no significant difference between fibers and films, confirming that the hydrophobic properties of the surfaces can be enhanced by just roughness without any chemical treatment. The surface geometry was determining factor in wetting contact angle analysis on electrospun meshes. We noted that it was very important how the geometry of electrospun surfaces was validated. The commonly used fiber diameter was not necessarily a convincing parameter unless it was correlated with the surface roughness or fraction of fibers or pores. Importantly, this study provides the guidelines to verify the surface free energy decrease with the fiber fraction for the meshes, to validate the changes in wetting contact angles. Eventually, the analysis suggested that meshes could maintain the entrapped air between fibers, decreasing surface free energies for polymers, which increased the contact angle for liquids with surface tension above the critical Wenzel level to maintain the Cassie-Baxter regime for hydrophobic surfaces.

Graphical Abstract

1. Introduction

Repellency to water and other liquids, especially with lower surface tension, cannot be simply attributed only to the surface chemistry, therefore wetting is one of the most studied topics when considering surface topography. Wetting is defined by the contact angle measured for the liquid, where a liquid-vapor interface meets a solid surface and depends on surface roughness [1]. In nature, the hydrophobicity is often a combination of low surface energy surfaces and designed roughness [2,3]. Hierarchical roughness is observed in many plants with the hierarchically organized structure of surface [4], usually to increase natural abilities of water collection [5]. The air that is captured between nanostructured surfaces with designed roughness is minimizing the surface energy so wetting contact angles [6]. Electrospun three-dimensional (3D) meshes, characterized by large surface area to volume or mass ratio, have a range of applications where wetting and surface properties [7] are particularly important, such as filtration [8,9,10], membranes [11,12,13], structured composites [14,15], optical sensing [16], water [17,18,19], energy harvesting [20], drug delivery [21], and tissue engineering [22,23]. Wettability of tissue scaffolds plays an important role in the adsorption of proteins [24] and cell culture [25,26].
The typical approach in the production of superhydrophobic surfaces is increasing surface roughness, through chemical modifications [27] and tuning mechanical properties of materials, such as stiffness [28]. The first one, roughness, can be controlled on electrospun surfaces via decorating of fiber surfaces [29], wrinkling [30,31], introducing core-shell [32] or core-sheath structures [33], and various surface treatment methods [34,35], which brings us to the second case. The third option is stiffness that for polymer fibers depends on the orientation of crystallites along the fiber axis [36,37,38] and the degree of crystallinity [39], affecting wetting angles and liquid spreading [40,41].
Generally, surface free energy is correlated with surface deformation, which is sensitive to surface roughness and chemical composition [42]. The surface free energy of electrospun fibers can be controlled along with their main axis with the polymer chain alignment or their reorientation of functional groups in the polymer chains at the surface [37], which eventually changes their wetting [43,44] and adhesion forces [45] between them. The mesh is 3D structured network of fibers [35] with very high porosity, reaching often above 90% [14].
In this study, we investigated the wetting properties of the 3D meshes that were produced with randomly oriented electrospun polymer fibers. We present here the mechanistic study evaluating the wetting properties of meshes when considering the fiber diameter (Df) [46], roughness of meshes that is validated by arithmetical mean deviation (Ra) [47], and a fraction of fibers in meshes (Ff) [48], which is opposite of air volume fraction [49]. The fraction of fibers from two-dimensional (2D) images can give an estimate about the air captured between fibers at the surfaces in the meshes. Fibers morphology, Df distribution, and Ff were analyzed based on scanning electron microscopy (SEM) micrographs. The aim of the study was to verify the commonly used fiber diameter of fiber to justify changes in the observed wetting angles. Instead of Df, we focused our analysis Ra and Ff giving characteristics of the larger contact area in contact with the liquid. Additionally, the surface free energy of polymer films and meshes was verified based on contact angle measurements using the Owens–Wendt theory and the surface chemistry of meshes and flat films was investigated with X-ray photoelectron microscopy (XPS).
Previously, many studies have shown the effect of increased contact angles, most often for water, for the decreased fiber diameter [7,46], however, the smallest fibers were often with beads and the variations of contact angles were smaller than 10° for the sizes from 0.6 to 2.2 µm [46] and between 3.5 to 8 µm another 10° [7]. Other studies actually showed the opposite, so an increase of contact angle with fibers diameter [50] or no correlation at all with Df [51]. Based on the above-mentioned studies, we tried to identify the range of fiber diameter that should not influence wetting contact angle, so we could focus in our investigation on roughness and fraction of fibers effect on wetting of polymer meshes. The fraction of fibers controls the air capture on the surfaces of the mesh, which reduces the surface free energy and wetting angles. Herein, we found that Ra and Ff had a dominating effect on wetting of electrospun meshes, especially with low surface tension liquids. The Ff is directly correlated with the volume of air trapped at the surface of meshes, which defines the hydrophobicity for the Cassie-Baxter wetting regime [52,53] or hydrophlilicity for applicability of the Wenzel wetting theory [54]. In all of the wetting experiments on electrospun fibers, Df should be correlated with the roughness parameters, and additionally Ff should be analyzed from the surface images. The Ff is directly correlated with the volume of air trapped at the surface of meshes, which is crucial to be considered for hydrophobic polymers in terms of the Cassie–Baxter wetting regime [52].
We show the importance of surface roughness analysis to interpret the contact angle data correctly, which are one of the most often experiments used in interfacial research. Notable, this study is highly desirable for several existing and emerging applications of porous meshes, as it identifies the advantages and limitations of fiber-based materials.

2. Materials and Methods

2.1. Polymer Solutions

The following seven polymers were used to produce films and fibers: poly(methyl methacrylate) (PMMA), poly(lactic-co-glycolic acid) (PLGA), polycarbonate (PC), polycaprolactone (PCL), polystyrene (PS), polyvinylidene fluoride (PVDF), and most hydrophilic nylon 6 (PA6). The polymer solutions were prepared on a magnetic stirrer with a heating plate (IKA RCT basic, Staufen, Germany) for electrospinning fibers and spin-coating films. Before preparing solutions, all of the polymers were dried at 70 °C for 24 h, except PCL at 45 °C and PS and PA6 at 40 °C. The parameters are stated in Table 1, with the following solvents used: formic acid, acetic acid, dimethylacetamide (DMAc), acetone, dimethylformamide (DMF), chloroform, and tetrahydrofuran (THF), all purchased from Sigma Aldrich, Gillingham, UK.

2.2. Electrospinning

Electrospinning of polymer fibers was carried out using apparatus EC–DIG with climate upgrade system (IME Technologies, the Netherlands) at constant temperature (Tc) of 25 °C and relative humidity (H) between 35 and 60%, see Table 2 for further details. The applied voltage (U) to the nozzle, with an inner diameter of 0.8 mm, was in the range from 10 to 18 kV and the distance between the nozzle and the grounded collector (d) was from 10 to 20 cm. The flow rate for polymer solution (Q) was the lowest for PCL 0.001 ml·h−1, as previously indicated [55], and the highest for PLGA 9.5 ml·h−1.
The thickness of electrospun samples was controlled with the deposition time to obtain thickness from 14 to 600 μm, depending on initial Df. The substrate for deposition of fibers during electrospinning did not affect fibers’ morphology or size, therefore we used an aluminum foil for microscopy study, glass slides for roughness and contact angle measurements and Si wafers for chemical analysis. After electrospinning, the produced meshes were left for a few hours to dry in the air to ensure solvent residues evaporation in the case that any were left. All of the samples after preparation were stored in polystyrene Petri dishes that were placed in a desiccator.

2.3. Spin-Coating

To produce polymer films from the solutions (0.1–0.3 ml) listed in Table 1 we used spin-coated (L2001A v.3, Ossila, Sheffield, UK) set with rotation speed (vs) and spinning time (ts), as specified in Table 2. The samples were prepared on 16 × 16 mm glass slides for contact angle and on 15 × 15 mm Si wafers for surface chemistry analysis using XPS. The SEM micrographs of all spin-coated polymer films are in Figure S1 in the Supporting Information.

2.4. Surface Profilometry

Within the profilometry study, we verified the roughness and thickness of electrospun samples using laser microscopy (Olympus OLS4000, Tokyo, Japan), from a larger area [56] than usually is reached with AFM [57]. The measured area for all samples was 646 × 646 μm, except PA6, where it was 130 × 130 μm due to smaller fiber diameter. We obtained roughness average (Ra), which is used to describe the roughness of measured surfaces, calculated with the digital approximation of:
R a = 1 MN j = 1 M i = 1 N | Z ij |
where M and N is a number of data points in X, Y direction, and Z is the surface height relative to the reference mean plate. The 2D images from profilometry analysis of all electrospun samples and thickness measurements are provided in the Supporting Information, Figure S2.

2.5. SEM Parameters and Image Analysis

Prior to imaging with SEM, all samples of electrospun fibers and films were sputter coated with 5 nm gold layer using rotary-pump sputter coater (Q150RS, Quorum Technologies, Laughton, UK). We used an accelerating voltage of 3 kV and a current of 150 pA at a working distance of 6 mm in SEM (Merlin Gemini II, Zeiss, Germany). The average Df was measured on 100 fibers using ImageJ [58] (v.1.51g) for all electrospun polymers with standard deviations, see histograms and micrographs in Figure 1 SEM micrographs of all spin-coated films are included in Supporting Information, see Figure S1. From SEM micrographs of electrospun surfaces, uploaded to ImageJ, we calculated Ff. Prior, the images were made binary using DiameterJ plug-in for the best automatic threshold and next from the obtained images, pixels were counted using histogram plug-in. This ratio of white to black pixels indicated the Ff. The representative binary images for Ff analysis are presented in Figure S3 in the Supporting Information.

2.6. Contact Angle and Surface Free Energy

Advancing contact angles on electrospun fibers and polymer films were measured by pipetting droplets of 3 μL volume on the surfaces using deionized (DI) water (Spring 5UV purification system—Hydrolab, Straszyn, Poland), glycerol (Pure, Sigma Aldrich), and formamide (Pure, Sigma Aldrich) for exact information, see Table 3. Experiments were carried out at a temperature of 21 °C and a humidity of 50 %. Immediately, after the liquid deposition, the images of droplets were taken using Canon EOS 700D camera with EF-S 60mm f/2.8 Macro USM zoom lens. The advancing contact angle was measured using ImageJ and MB Ruler (v5.3 MB-Software, Iffezheim, Germany) software. The representative images of contact angels for all samples and all liquids are shown in Table S1 in the Supporting Information.
The liquids: water, glycerol, and formamide were chosen for contact angle study because of their low vapor pressure and various polar and dispersive components of their surface tension, their surface tension components are shown in Table 3. The surface free energy was calculated using the Owens-Wendt approach [64], with the following equation [65,66]:
γ l ( 1 + c o s θ ) 2 γ l d = γ s p ( γ l p γ l d ) + γ s d
where γ l is the total surface tension of the probe liquid with dispersive γ l d and polar γ l p components and γ s is the surface free energy of a solid surface with dispersive γ s d and polar γ s p components. Ɵ is the contact angle between the probe liquid and solid surface. The error in the contact angle data was calculated based on standard deviation, which was later used for the estimation of surface free energy error, which was approximately 5.6%.

2.7. X-ray Photoelectron Spectroscopy

The XPS analyses were carried out in a PHI VersaProbe II Scanning XPS system using monochromatic Al Kα (1486.6 eV) X-rays focused to a 100 µm spot and scanned over the sample area of 400 × 400 µm. The photoelectron take-off angle was 45° and the pass energy in the analyzer was set to 23.50 eV to obtain high energy resolution spectra for the C 1s, O 1s, N 1s, and F 1s regions. A dual beam charge compensation with 7 eV Ar+ ions and 1 eV electrons were used to maintain a constant sample surface potential, regardless of the sample conductivity. All XPS spectra were charge referenced to the unfunctionalized, saturated carbon (C–C) C 1s peak at 284.8 eV. The operating pressure in the analytical chamber was less than 4x10⁻⁹ mbar. Deconvolution of spectra was carried out using PHI MultiPak software (v.9.7.0.1). Spectrum background was subtracted using the Shirley method.

2.8. Experimental Summary

In order to characterize the wetting properties of electrospun meshes, we performed a number of mechanistic experiments, including:
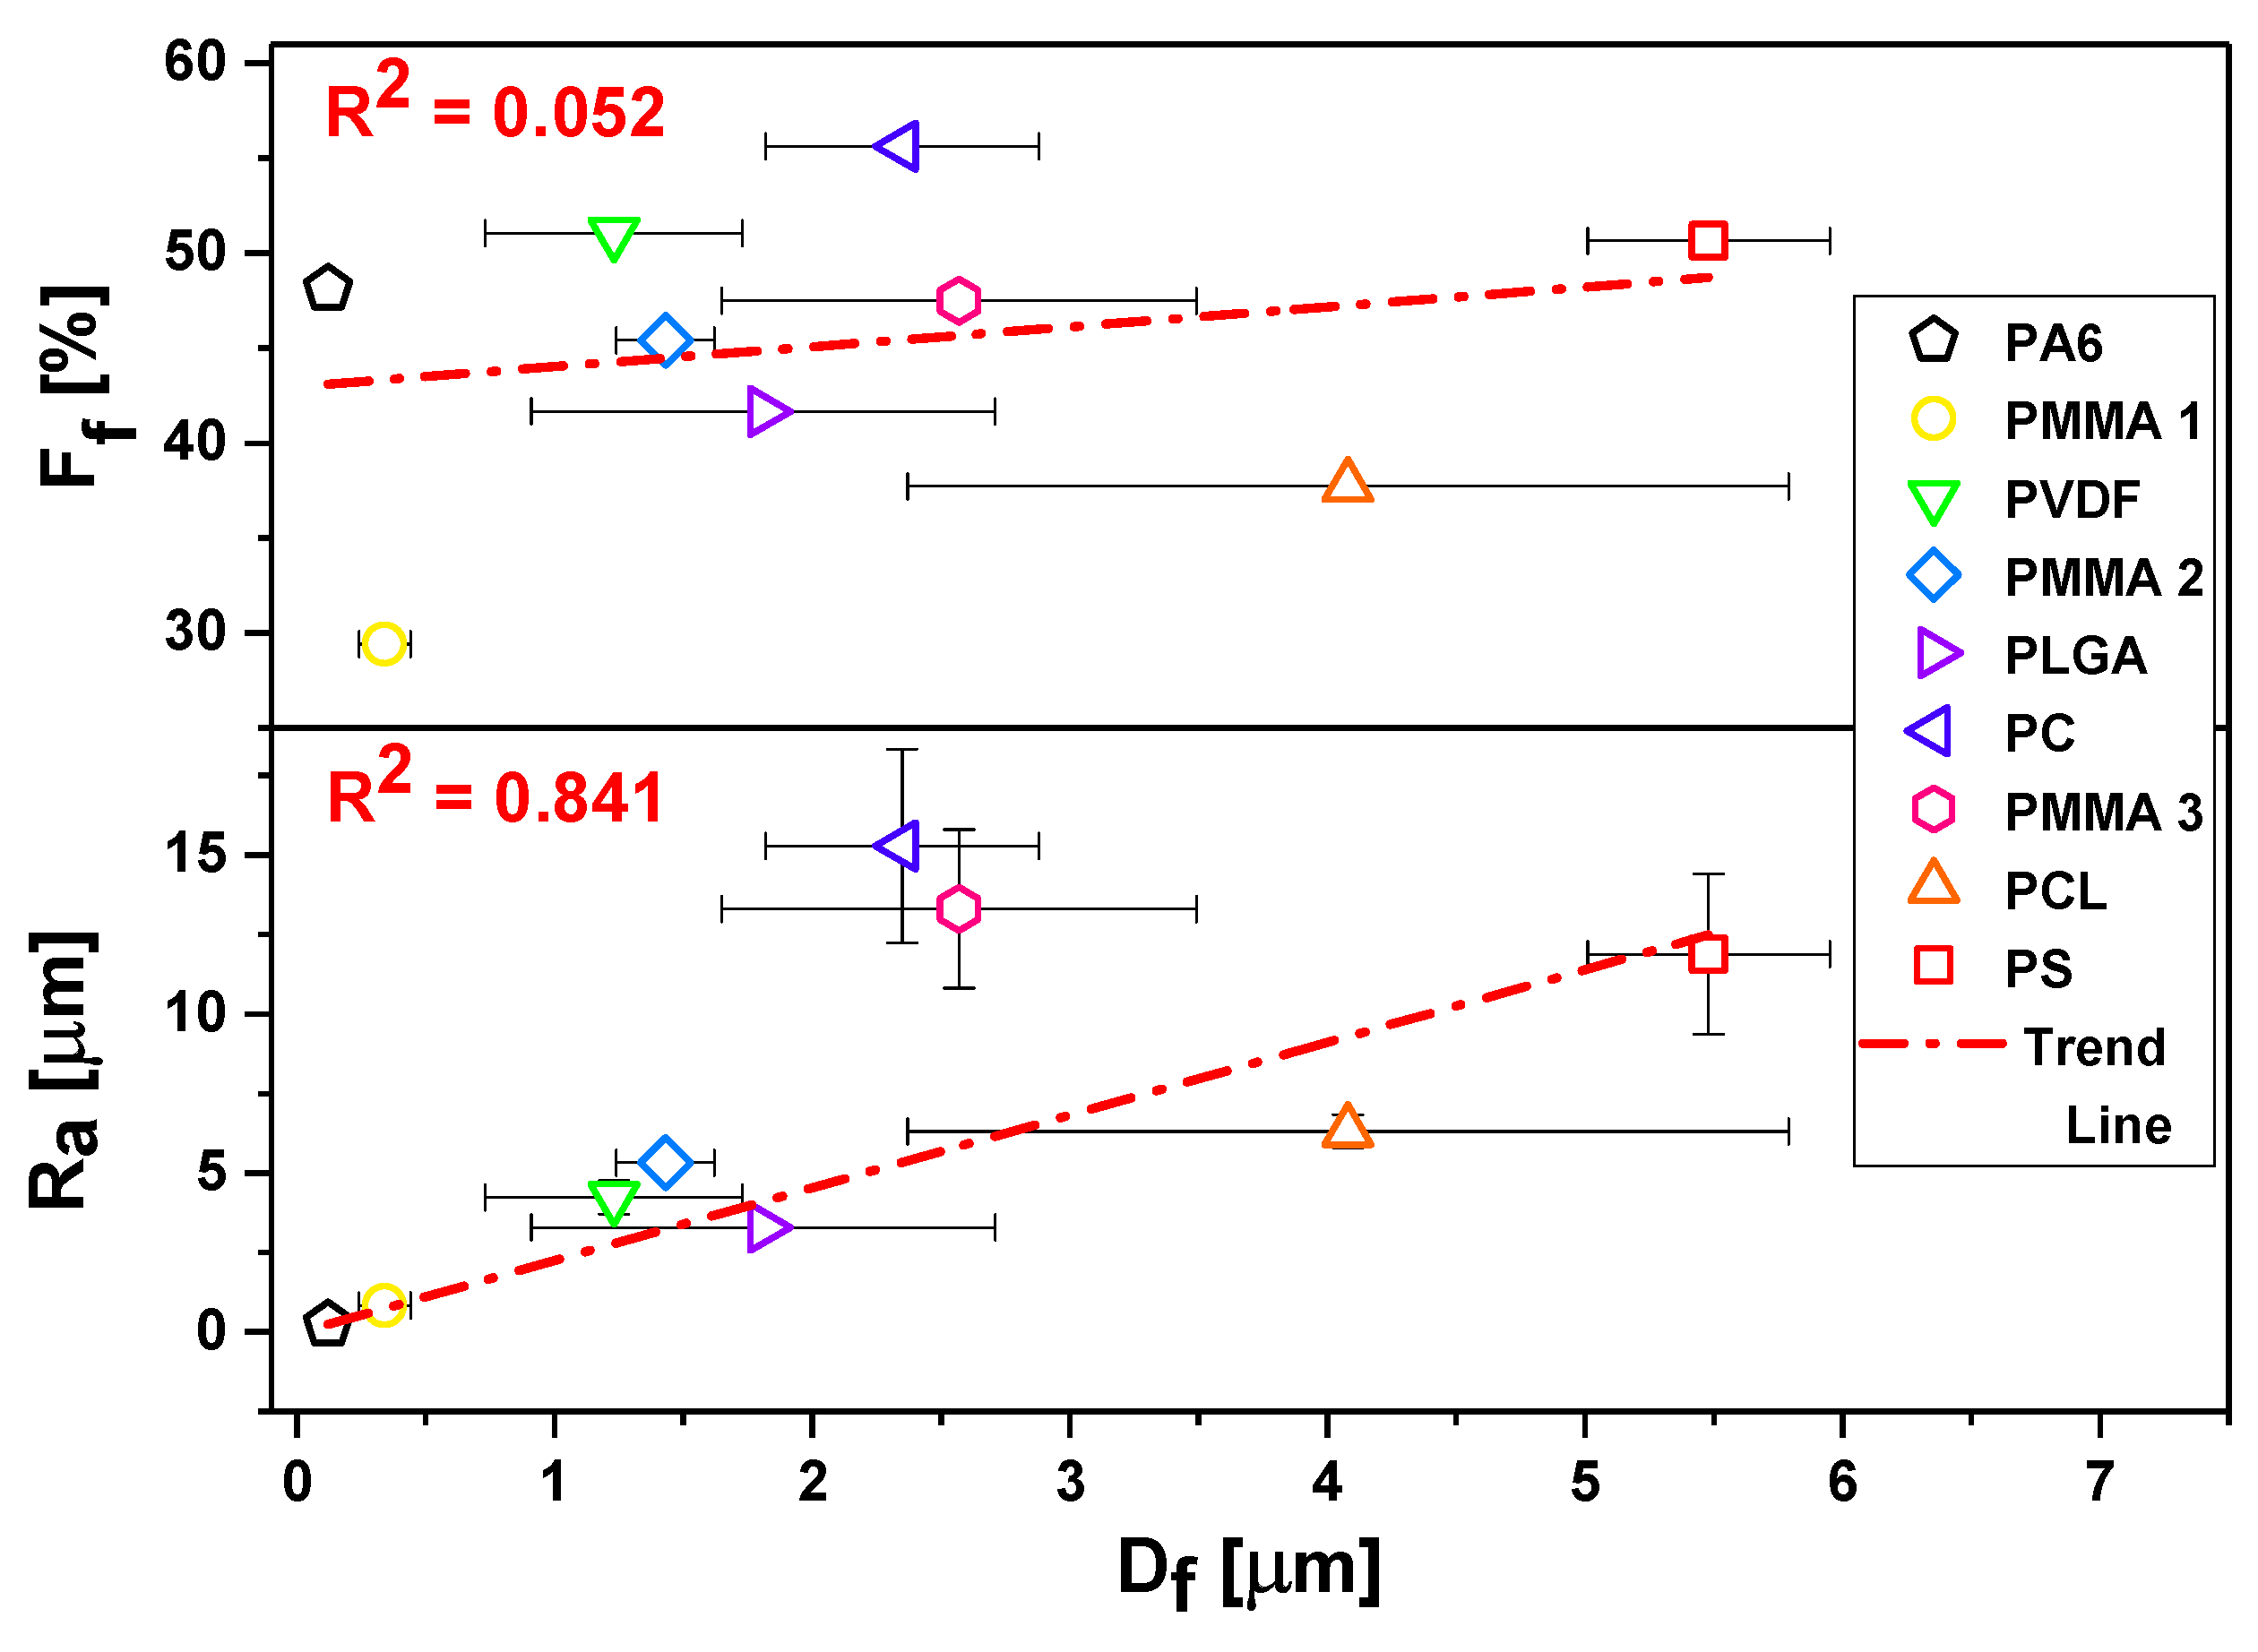
  • Investigation of fibers and films morphology using SEM; fiber diameter comparison to surface roughness and fiber fraction for all meshes.
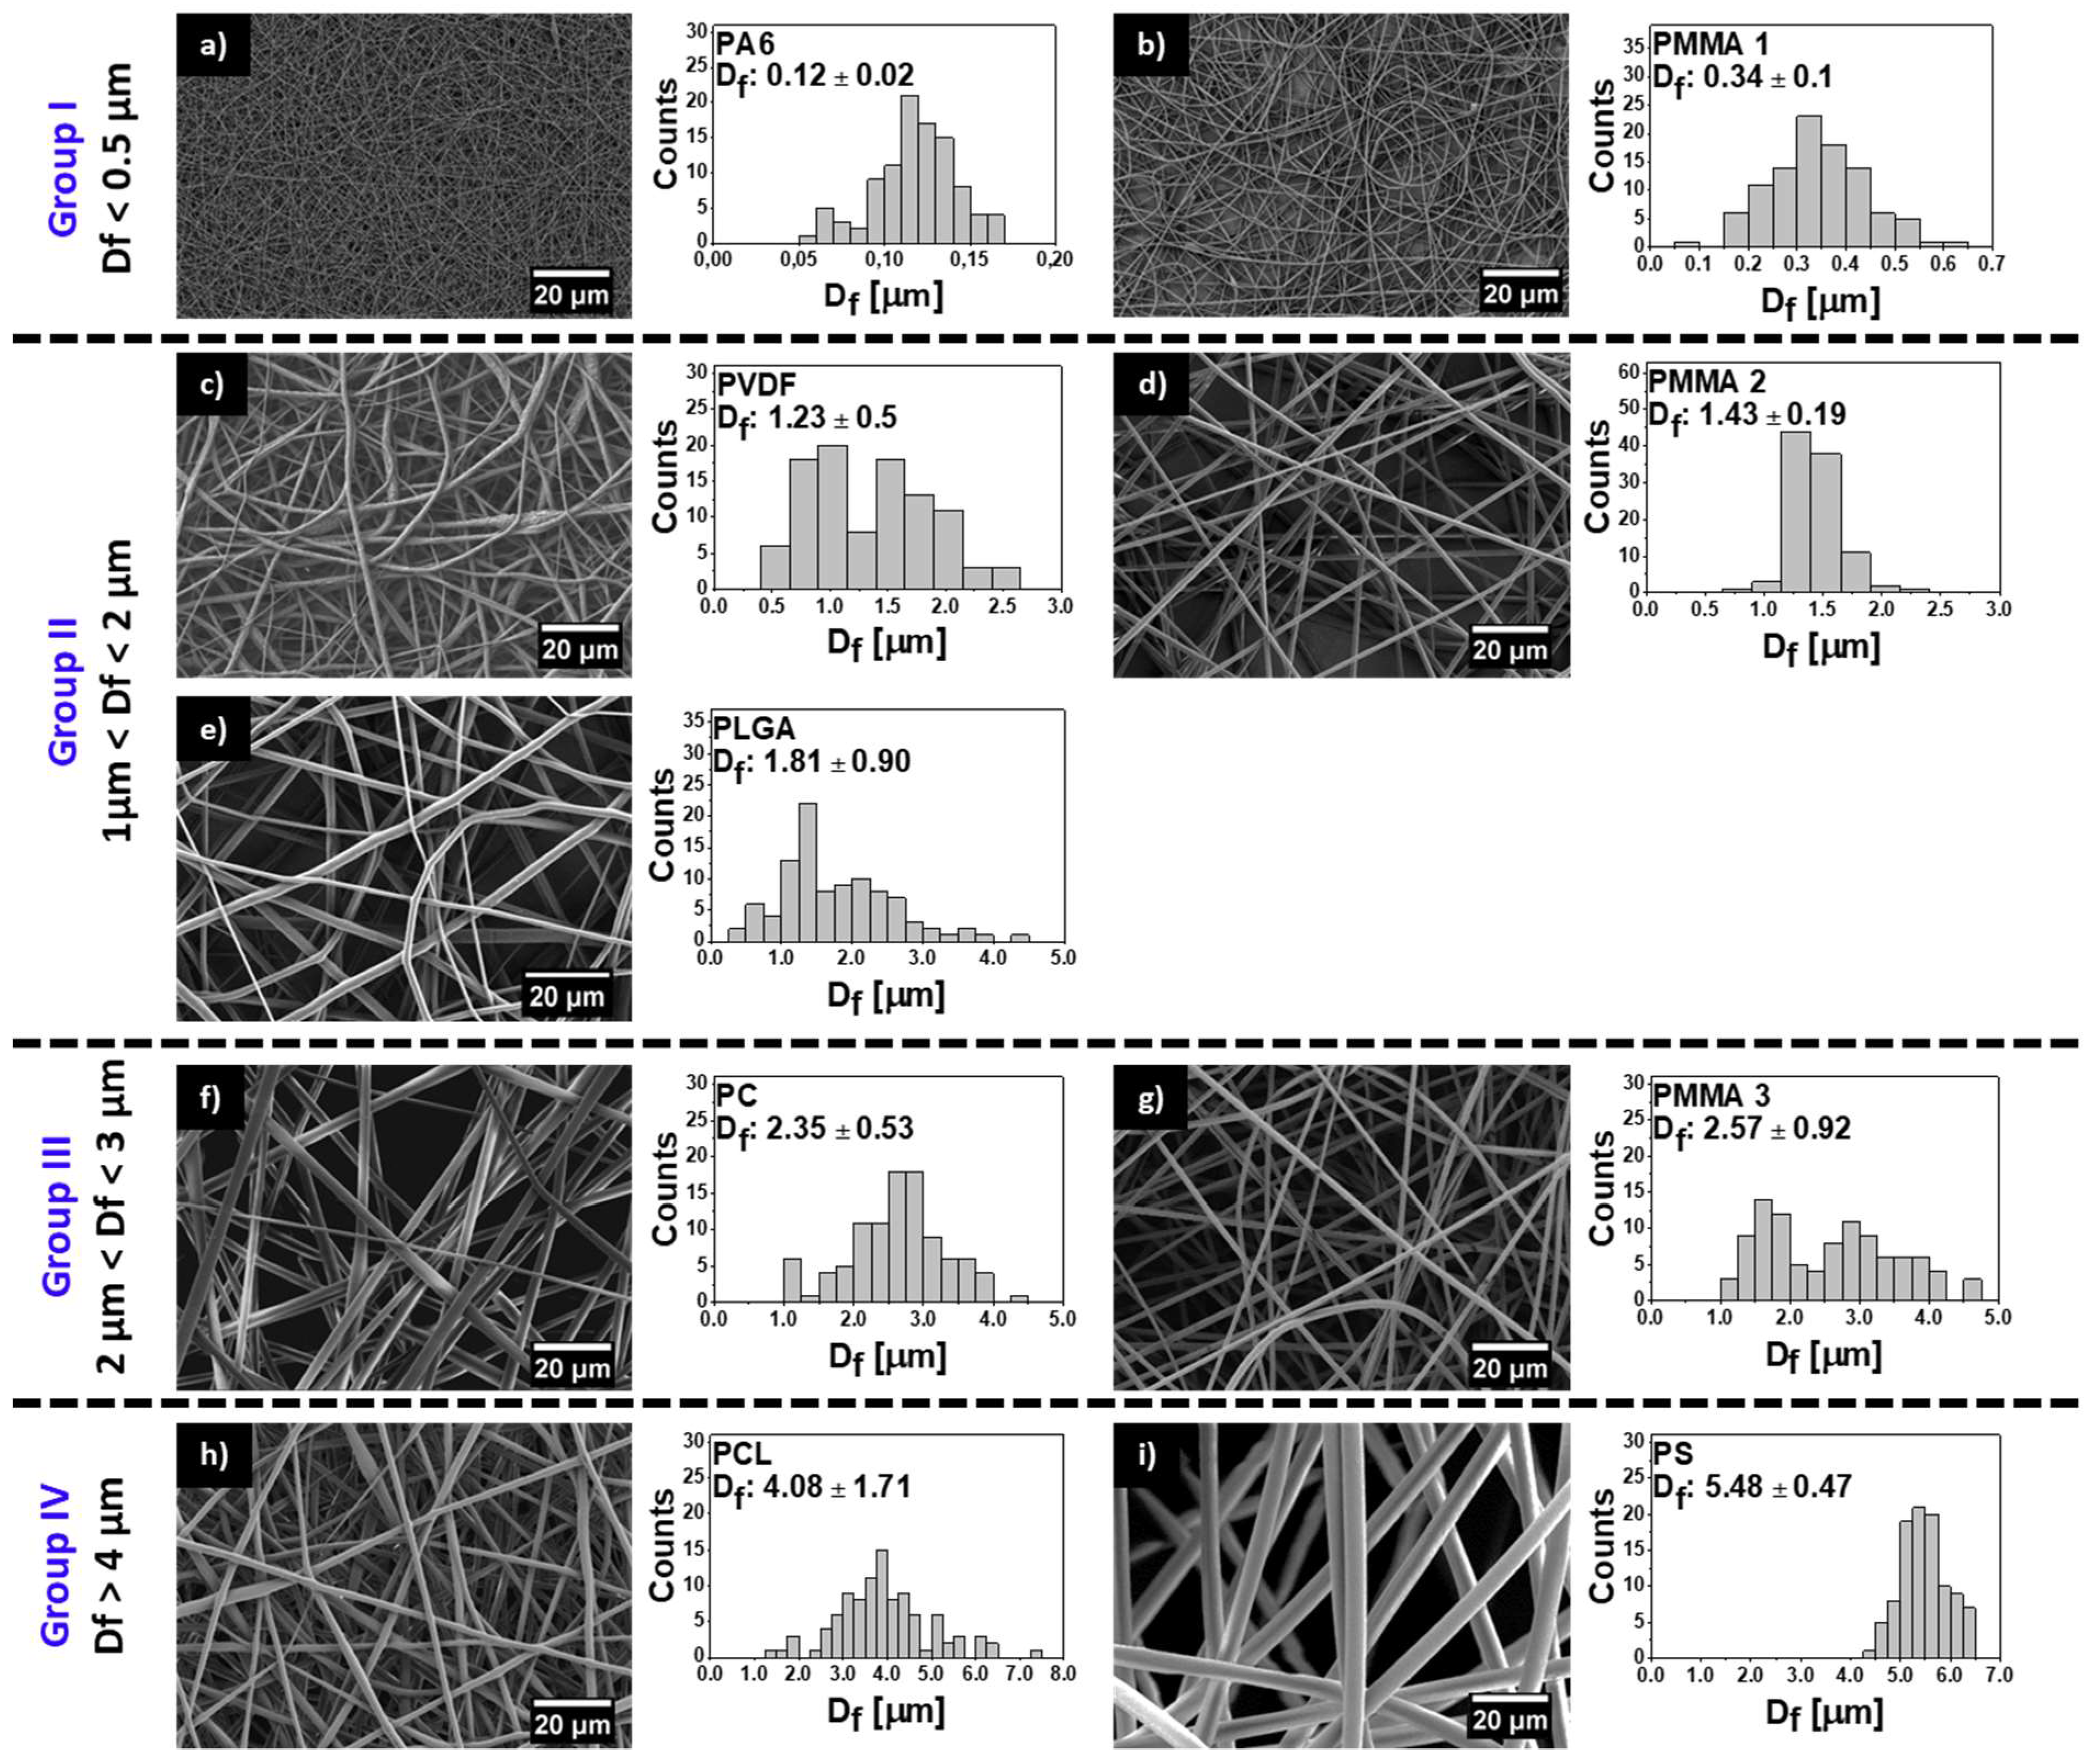
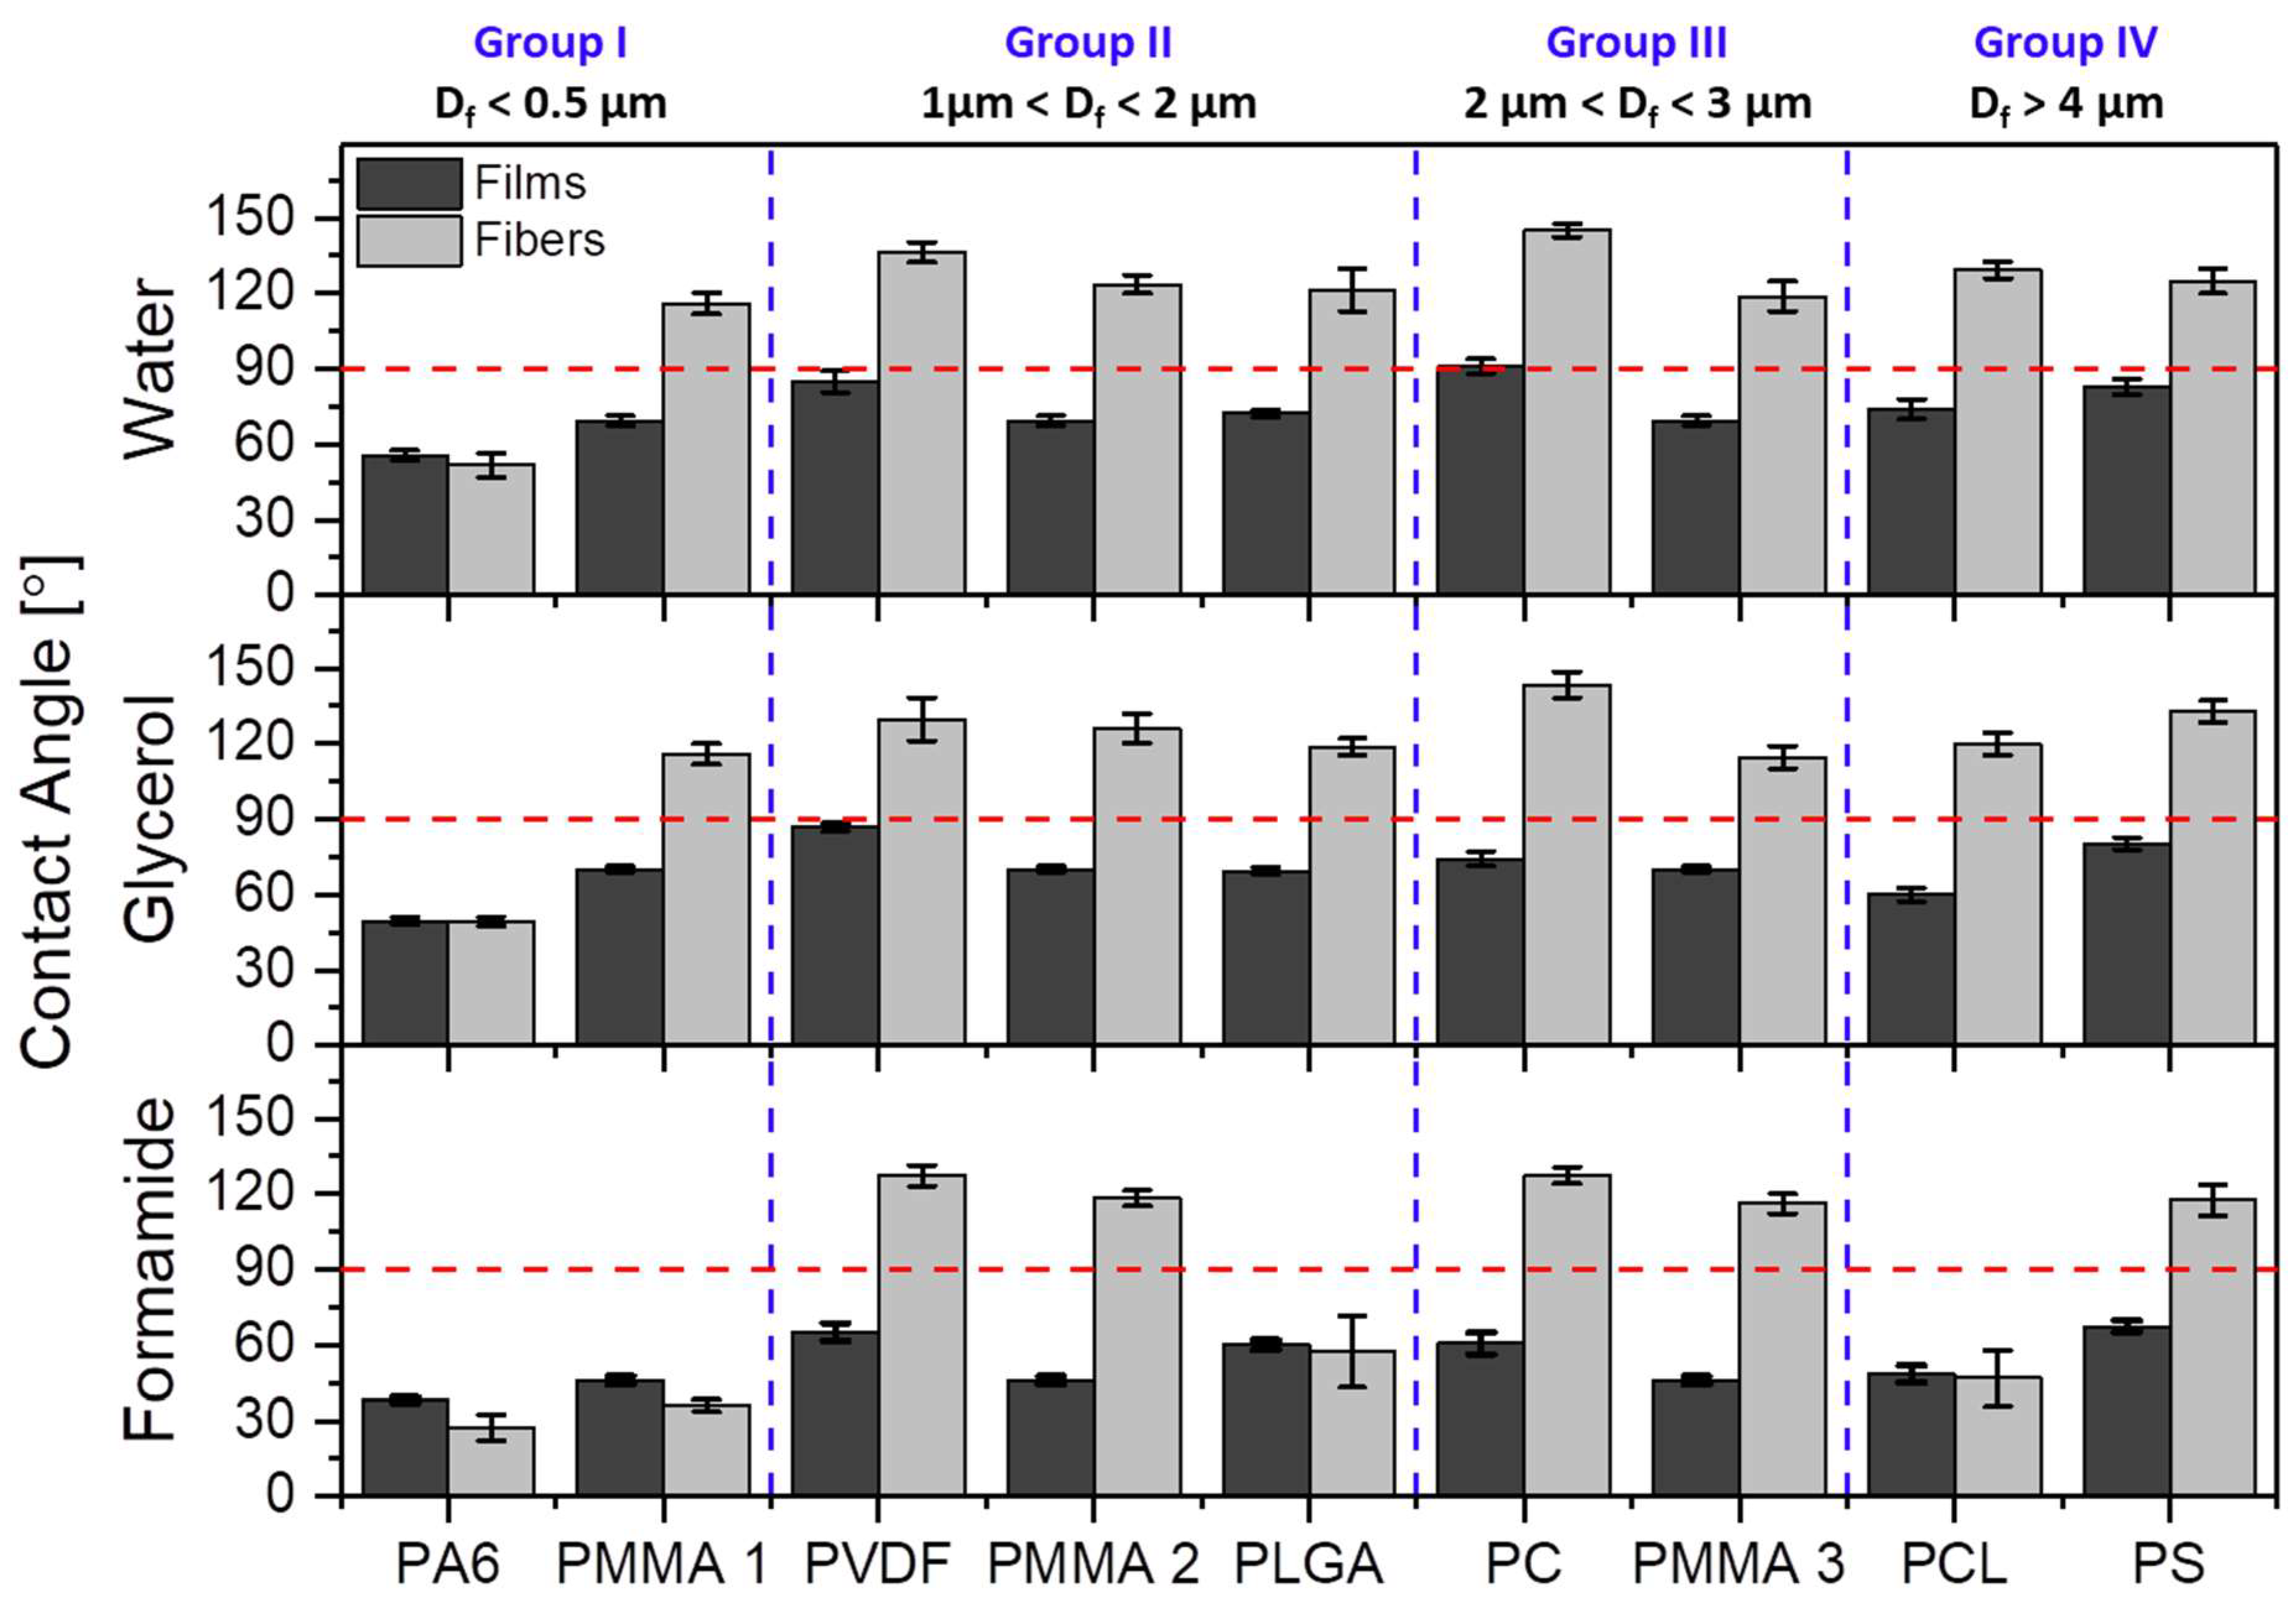
  • Wetting contact angle on films and meshes made of seven types of polymer (including PMMA, PLGA, PC, PCL, PS, PVDF, and most hydrophilic PA6), without any surface modifications; meshes were divided to four groups by their average fiber diameter below 0.5 µm, 1–2 µm, 2–3 µm, and 4–6 µm.
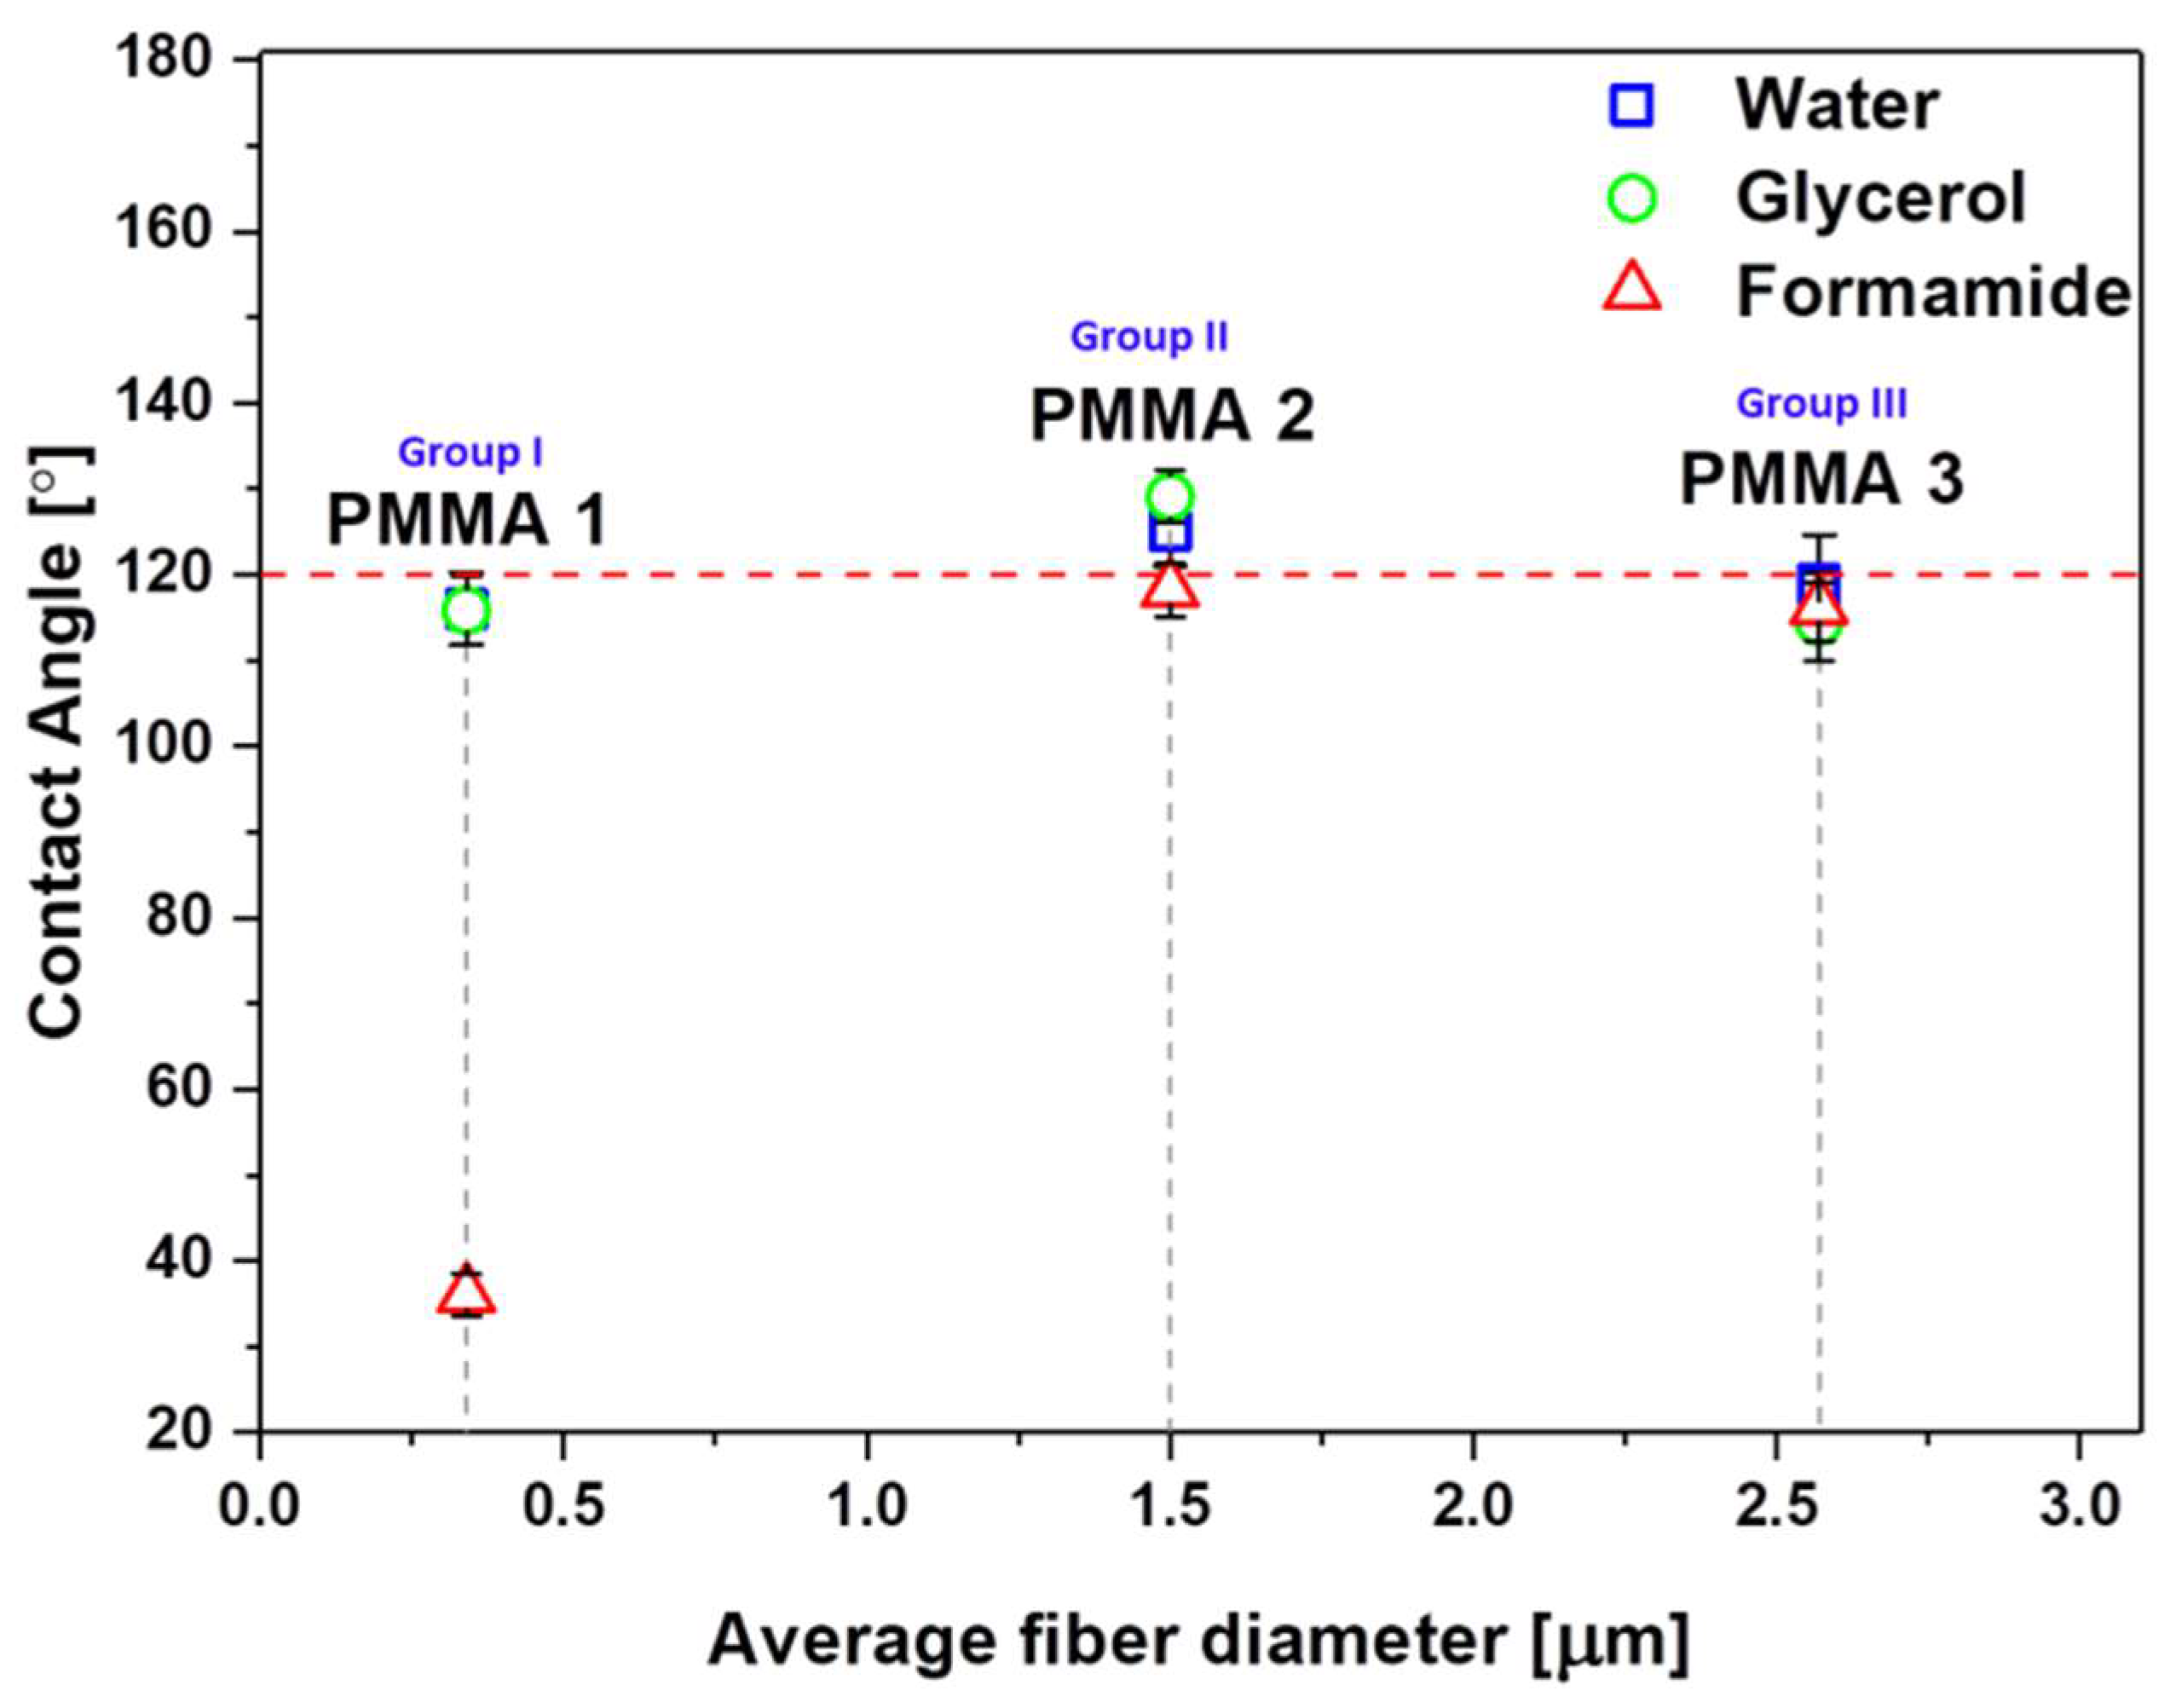
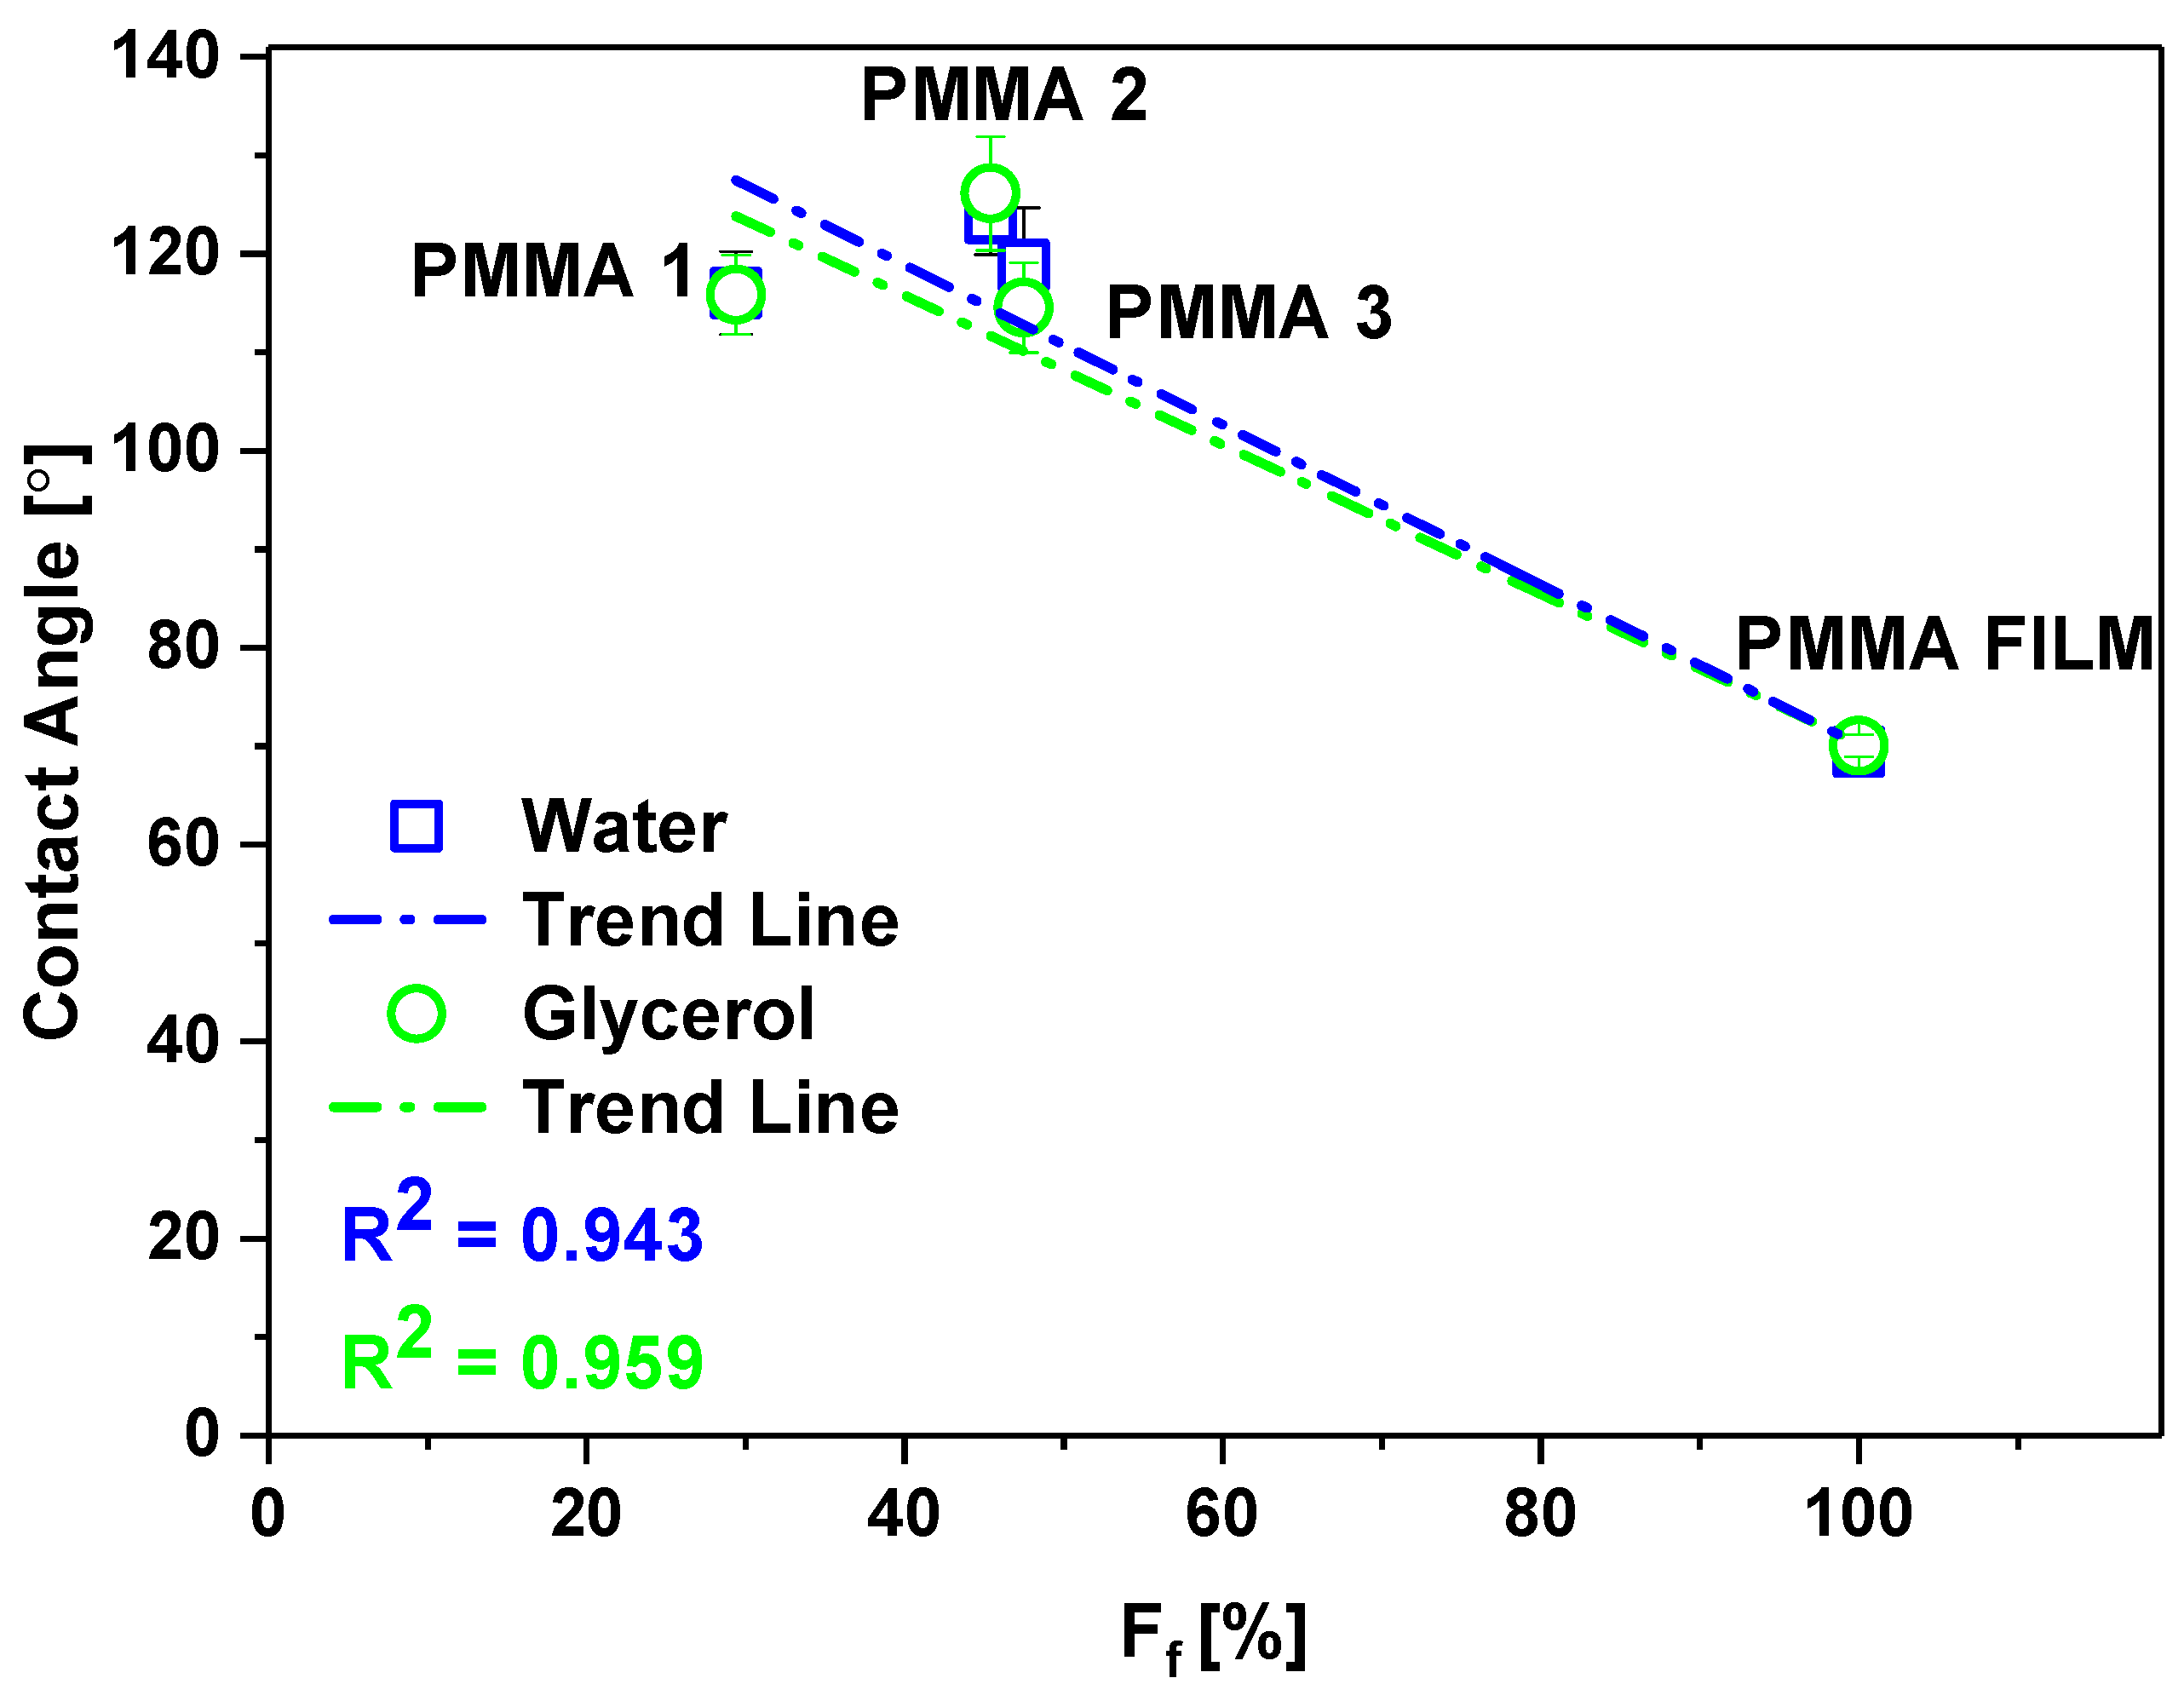
  • The varying fiber diameter of the same polymer (PMMA) for the three groups: below 0.5 µm, between 1–2 µm, and 2–3 µm, and keeping the same thickness of the meshes to validate wetting contact angle.
  • Analyzing the effect of thickness of 3D meshes on wetting contact angles.
  • Calculations of surface free energy and its changes with fiber fraction in the meshes, with additional surface chemistry analysis using XPS.

3. Results

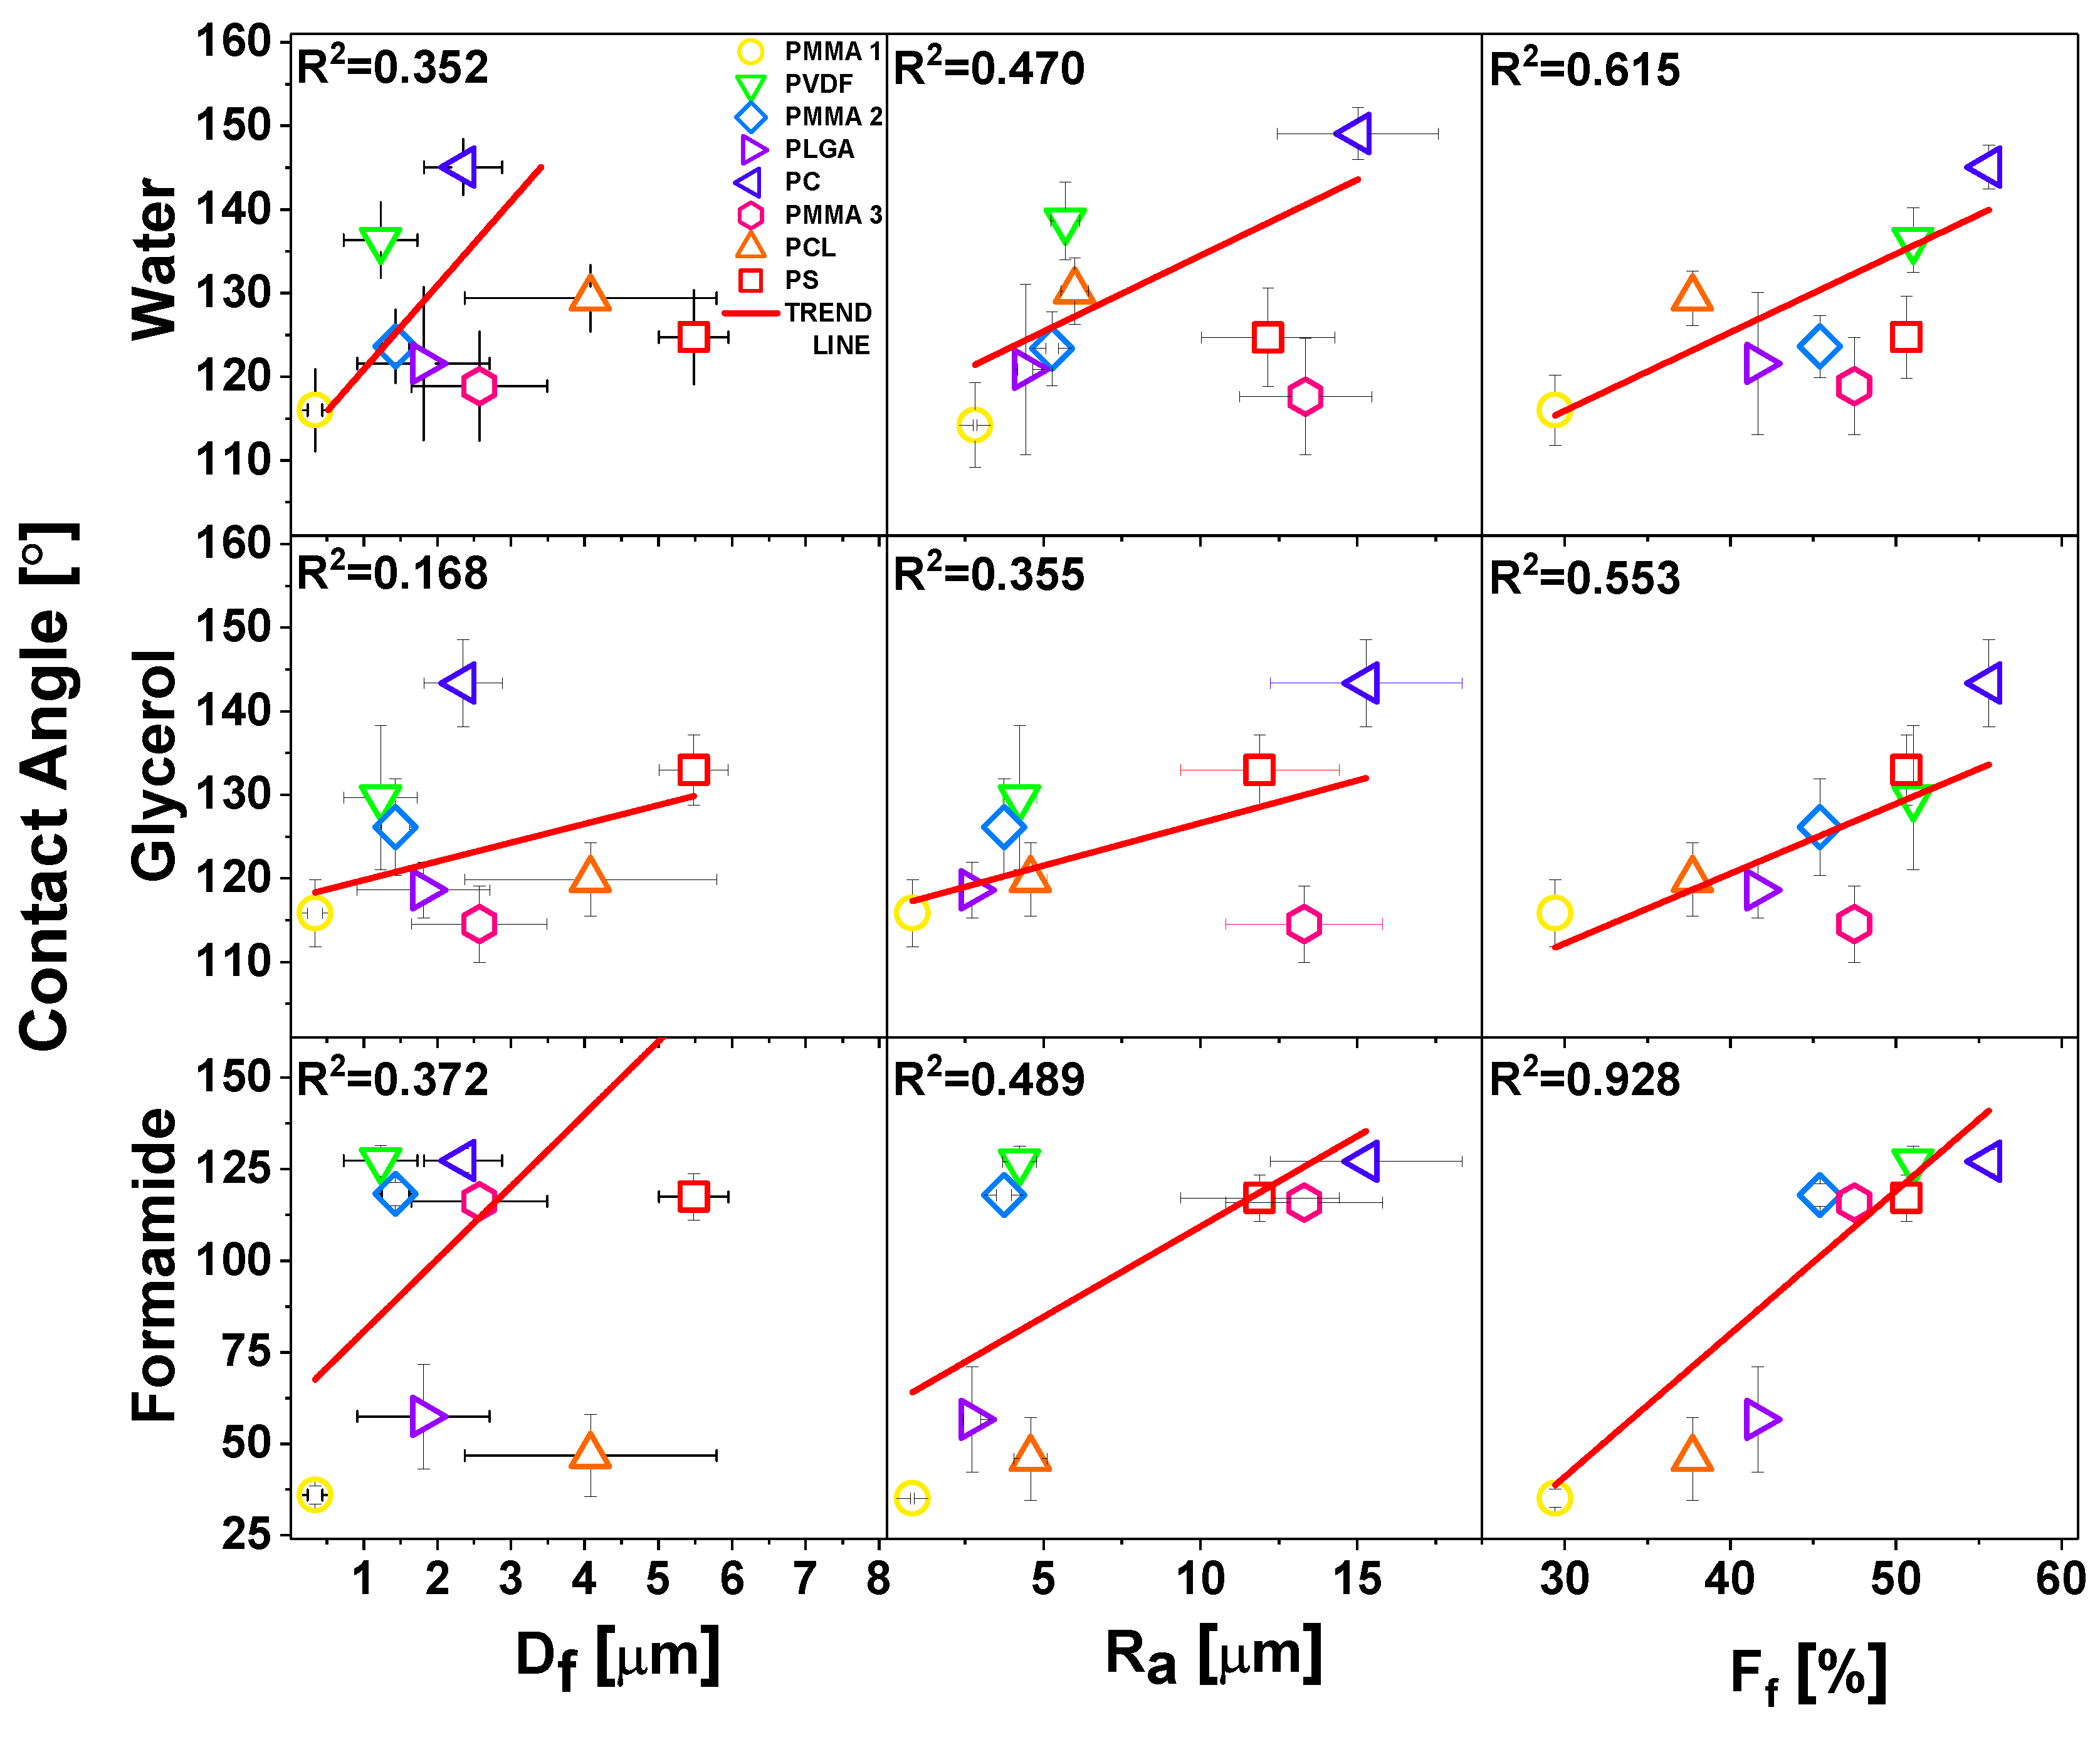
3.1. Contact Angle versus Fiber Diameter, Roughness and Fiber Fraction

The surface morphology of all meshes including hydrophobic PMMA, PLGA, PC, PCL, PS, PVDF, and hydrophilic PA6 are shown in Figure 1. We investigated the wetting of these meshes to verify the effect of surface chemistry without any additional surface modifications on the contact angles. All of the electrospun samples were divided into four groups in relation to obtained average Df: Group I with Df below 0.5 μm, Group II with Df between 1 and 2 μm, Group III with Df between 2 and 3 μm, and Group IV with Df between 4 and 6 μm, as shown in Figure 1, together with SEM images. The smallest average fiber diameters were obtained for PA6 and the largest for PS with Df of 0.12 ± 0.2 μm and 5.48 ± 0.47 μm, respectively. The mean diameters for the rest of the electrospun fibers were as follows 0.34 ± 0.09 μm for PMMA 1, 1.23 ± 0.50 μm as shown before [67], for PVDF, 1.43 ± 0.19 μm, which confirmed our previous results [68], a for PLGA, 2.35 ± 0.53 μm for PC, 2.57 ± 0.92 μm for PMMA 3, and 4.08 ± 1.71 μm for PCL, see histograms in Figure 1. The average fiber diameter for PCL was 4.08 ± 1.71 μm, and for PS was 5.48 ± 0.47 μm. Notable, all electrospun fibers were without beads. As Df is commonly used in wetting studies of electrospun surfaces we correlated it with roughness Ra and fiber fraction, Ff, see Figures S2 and S3 in Supporting Information. To analyses Df influence on sample roughness, we plotted Ra and Ff as a function of Df, see Figure 2. Ra was proportional to Df, however, there was almost no correlation Ff to Df.
The obtained contact angles on films and randomly oriented electrospun meshes were compared for all polymers in histogram that is presented in Figure 3. The SEM images, showing the smooth surfaces of polymer films, are presented in Figure S1 in the Supporting Information. The contact angles on films were close to hydrophobic for PVDF, PC, and PS, the rest of the investigated polymers exhibited contact angles that were much lower than 90°. We observed a straightforward increased of contact angles with all liquids on electrospun fibers when compared to films made out of the same polymer solution, except PA6 with formamide. PA6 fibers exhibited lower contact angle values when compared to films, because we observed the liquids percolation into fiber networks, similarly it happened for PMMA 1 mesh (all in Group I) for which formamide penetrated the membrane completely. For the PLGA in Group II and PCL in Group IV, we observed significantly lower contact angles being 57.4 ± 14.2° and 46.8 ± 11.2°, respectively, than for other electrospun fibers with similar Df. For all three liquids, the highest contact angles were observed for PC, within Group III, with values of 145.1 ± 2.6°, 143.3 ± 5.2°, and 127.3 ± 3.3° for water, glycerol, and formamide, respectively.
As the correlation between Df and wetting contact angle might be affected by polymers variations, we verified it for PMMA only. For PMMA meshes, with three characteristic Df from the first three groups (I-III), we obtained similar contact angles, close to 120° (Figure 4), with water and glycerol, having different Df, (Figure 1b,d,g), like in the previous study [51]. In the case of formamide with the surface tension of 58 mJm−2 with the lowest polar component among all of the liquids that we used for testing (see Table 3), the contact angle drastically decreases, and the liquid percolated into the network of fibers. It happened also with hexadecane (surface tension = 27.8 mJm2) for the electrospun poly(2,2,2-trifluoroethyl methacrylate) (PTFEMA) with Df of 500 nm [69], where liquid soaked into PTFEMA network.
Notable, the contact angles were not affected by the thickness of the electrospun samples. The PMMA 2 fibers with the same fiber diameter were deposited between 15 and 45 min to produce thickness between 35 and 134 μm of electrospun mats, see Table 4. By varying the deposition time of electrospinning, we slightly increased the PMMA 2 fiber diameter, thus Ra increased too, but Ff was in the same range. The SEM micrograph and Df histograms of PMMA fibers with thickness variations are included in Figure S4, in the Supporting Information. The obtained contact angles with water, glycerol, and formamide were very similar for all PMMA samples, regardless of the thickness of the mesh, see Table 4.
Regardless of the polymer type, the decrease of fiber diameter did not cause the increase of the water contact angle, as it was suggested in other studies [69]. Noteworthy is a fact that all of the fibers we investigated in this study were beadless. Beads on fibers usually occur in unstable electrospinning process [70], having often the size of few microns, which significantly changes Ra and Ff, therefore the wetting properties of meshes. In Figure 5, we compared the effect of roughness parameters and contact angles for water, glycerol, and formamide for hydrophobic polymers, thus omitting hydrophilic PA6, as there was no significant difference in wetting between films and fibers. The less direct correlation between the contact angles was observed for Df, but there was a relatively good correlation between Ra and Ff. However, Df is correlated with Ra, see Figure 3, and, with increased Df, Ra was proportionally increased. In all of the wetting experiments on electrospun fibers, Df should be correlated with the roughness parameters, and additionally, Ff should be analyzed from the surface images. The Ff is directly correlated with the volume of air that is trapped at the surface of meshes, which is crucial to be considered for hydrophobic polymers in terms of the Cassie-Baxter wetting regime [52].
Despite the trend of using Df as an indication of variations in the wetting of electrospun fibers, we identified Ra and Ff as the key parameters in the analysis of contact angles on electrospun meshes. Most of the previous studies on wetting of electrospun fibers were performed with water, therefore in Table 5, we summarized the literature data as compared with our results for this liquid. For the hydrophilic PA6, we obtained very similar contact angle of 50° with a diameter of 12–15 nm [71]. PVDF membrane with an average fiber diameter of 0.17 µm gave a contact angle of 142.8° [72], which was in the same range to what we measured, but on the PVDF fibers with diameter one order of magnitude higher: 1.23 µm. Similarly, PCL fibers had vastly lower fiber diameter, but the water contact angle was similar [73]. The wetting investigation of PLGA fibers yielded similar results [74]. In the case of PS, we obtained the contact angles of 124.8° with a diameter that was half as small as Kang et al. [75], having 12.7 µm and the contact angle of 138.1°. Regarding PC fibers [76], almost 20° difference in contact angle was observed for fibers with diameter of 1.6 µm smaller than what we produced. Additionally, in Figure 3, we showed the results for all electrospun PMMA samples that were actually very similar to previously obtained results for water [51,77] (see Table 5), confirming the same trend of contact angle independence from Df. The contact angle for PLGA, PCL, and PVDF fibers, as reported in Table 5, were almost identical for different Df.

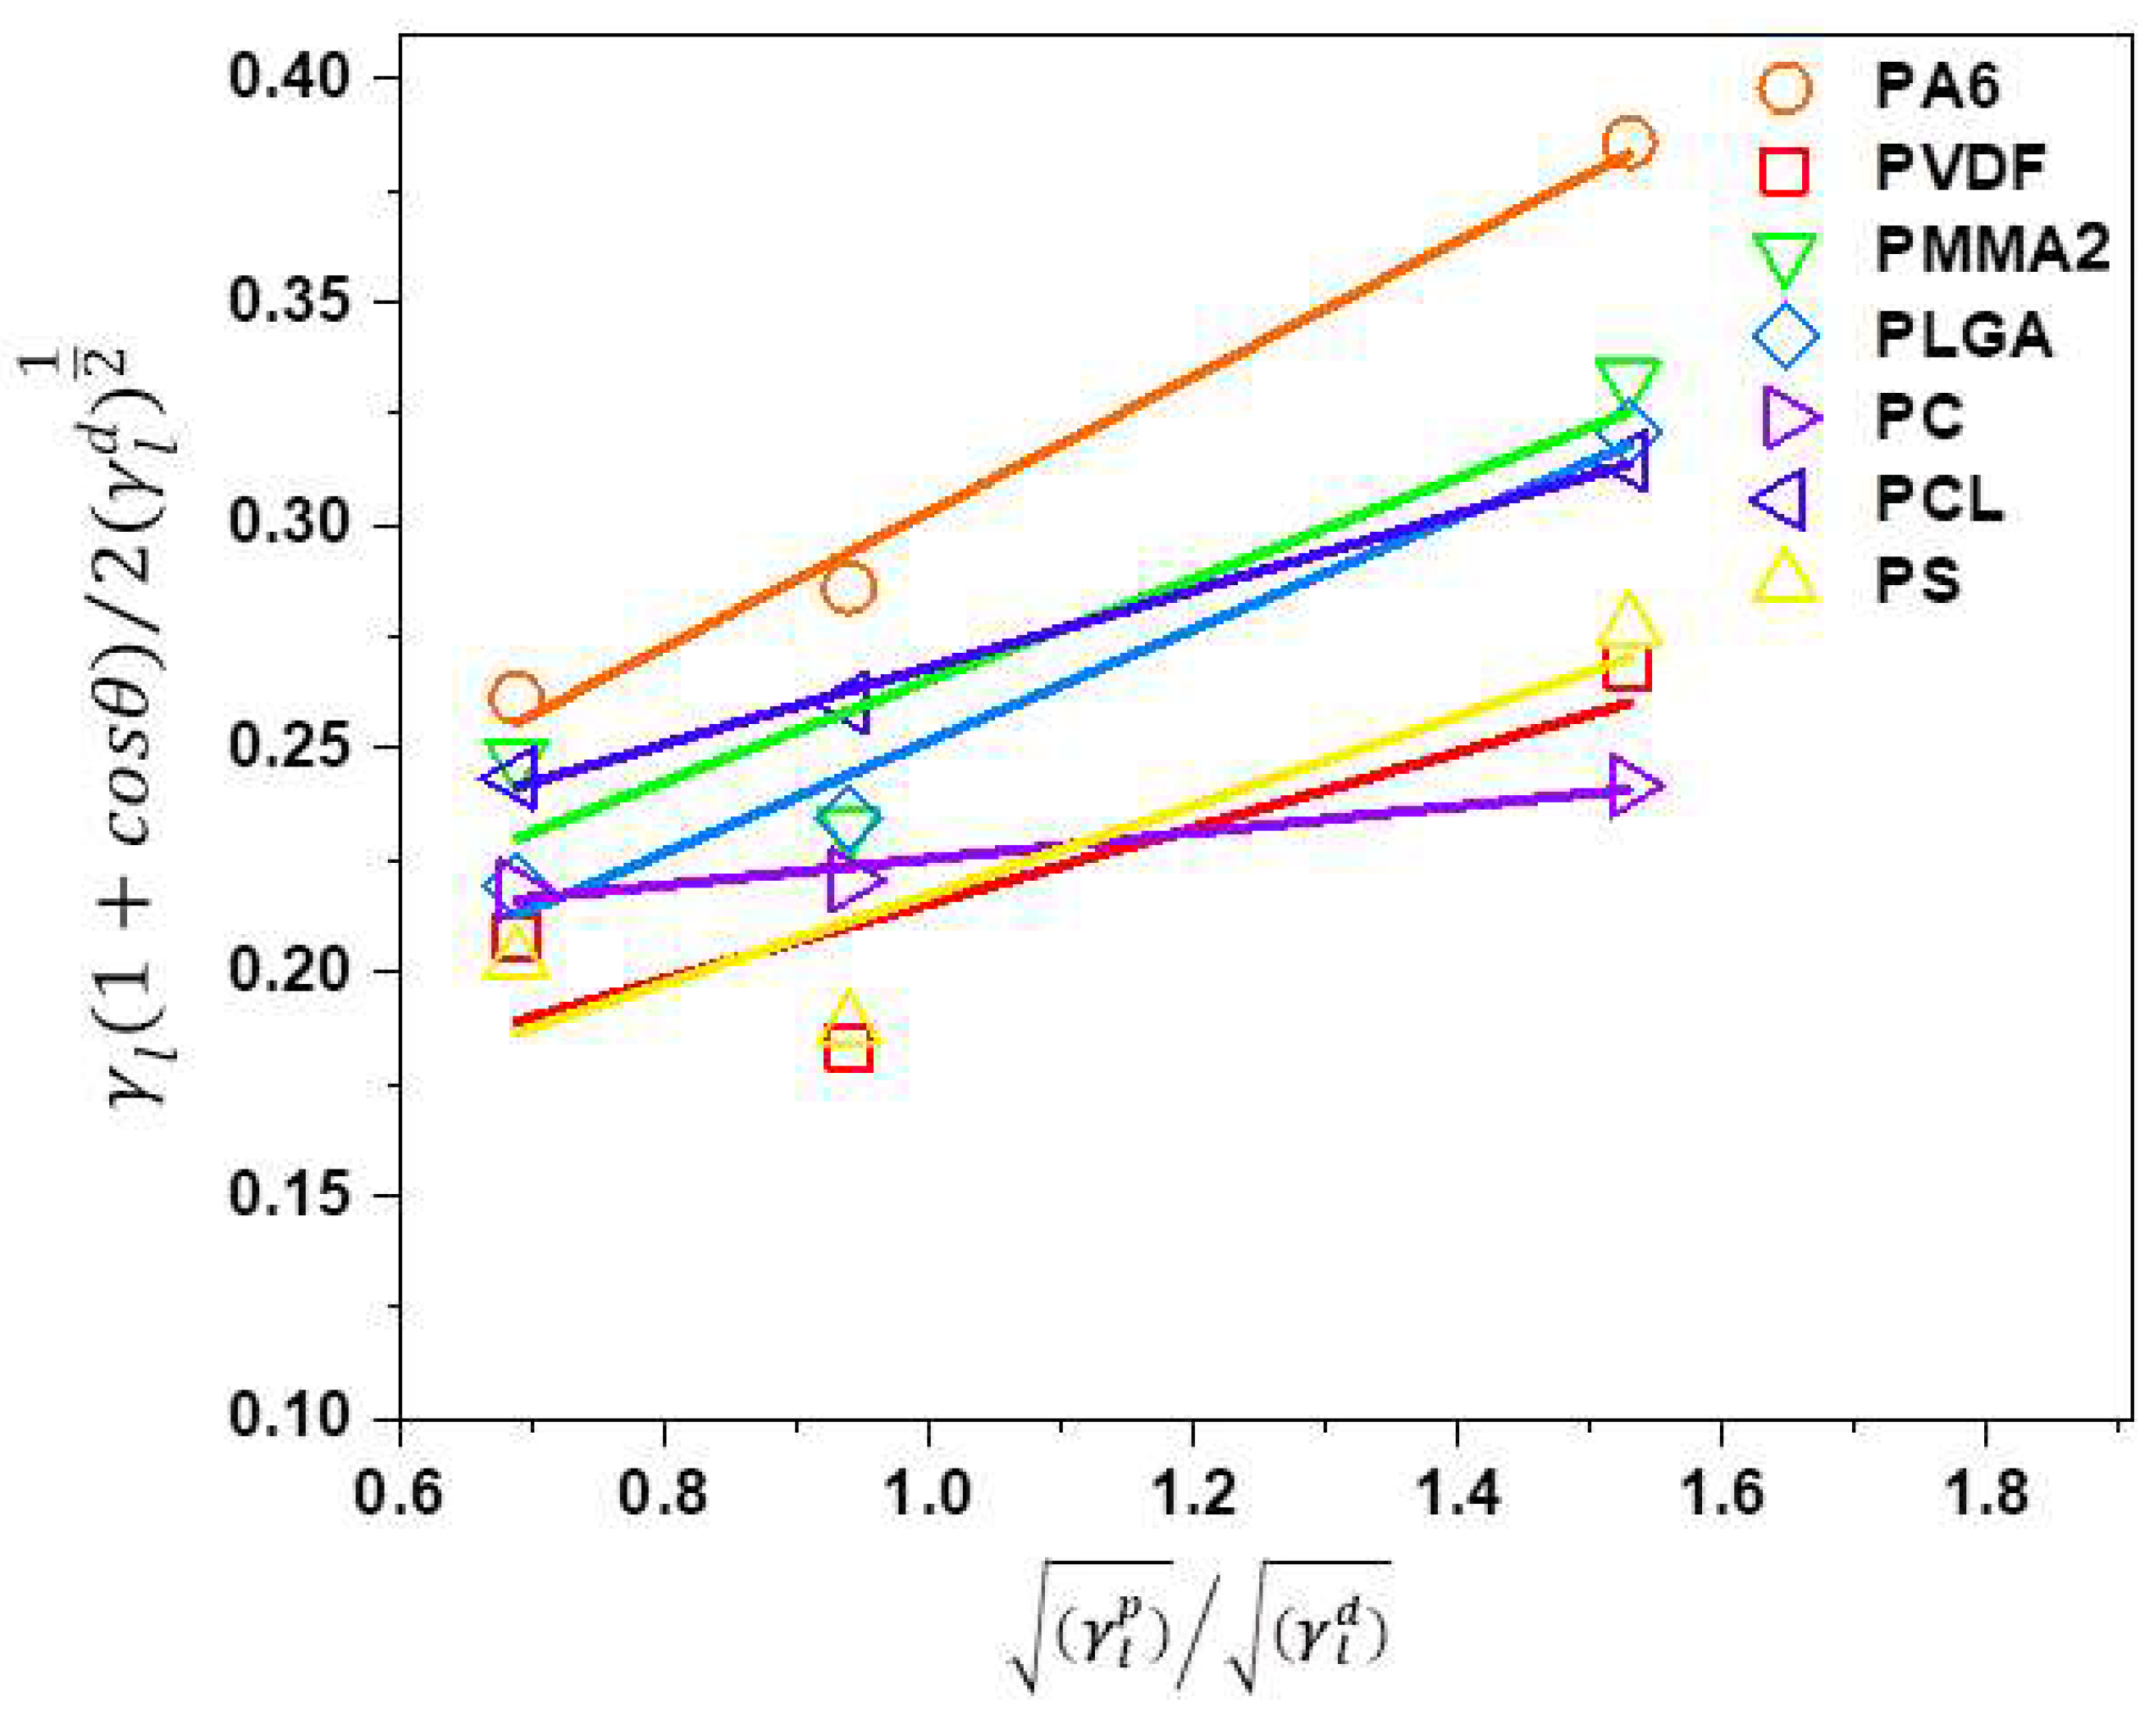
3.2. The Surface Free Energy of Polymer Films

Surface free energy is often calculated based on contact angle measurement using several liquids with different surface tension [78,79]. Notably, the surface free energy depends on the polymer chains organization that is related to the manufacturing methods used to produce films and fibers [43,44]. In this study, the obtained contact angle data on polymer films with water, glycerol, and formamide were used to calculate surface free energy based on the Owens–Wendt [64] method with polar and dispersive contributions. In Figure 6, the Owens-Wendt plots are presented and all of the fitting parameters are included in the Supporting Information in Table S2. The summary of all the calculated polar and dispersive components of surface free energies of all investigated polymer films are shown in Table 6. Additionally, Table 6 includes the values found in the literature for given polymers.
We obtained for PA6 films a very similar surface free energy of 45.9 mJm−2 as compared to 40.3 mJm−2 [44]. The lowest surface free energy of 24.2 mJm−2 was for PVDF in comparison to slightly higher values that were obtained by Wu [80], who used only two liquids to measure the contact angles: water and diiodomethane and calculated surface free energy. Concerning PMMA film, Wu [81] used molten polymer and obtained surface free energy of 32 mJm2, which was comparable to our results, see Table 6. Surface free energy for PC was simulated using contact angle hysteresis model giving the result of 44.0 mJm−2 similar to our 39.3 mJm−2 [27]. Luk et al. [82] used water, ethylene glycol, and DMSO to measure contact angles on PCL and obtained surface free energy of 33 mJm2, which was confirmed by slightly higher values of 40.7 mJm−2, which are indicated in Table 6. The PS films were characterized with the surface free energy of 25.3 mJm−2, which were lower than the 32.1 mJm−2 obtained from measurements at a temperature of 140 °C [81]. Often, the differences in polar and dispersive part of surface free energy were associated with a diversity of liquid surface tensions used for contact angle measurement and calculation methods. The surface free energy data varied and was strongly dependent on calculations methods and liquids that were used for contact angle measurements [78].
The surface free energy of electrospun fibers may slightly differ from films, as was proven for PA6 fibers, showing increased polar components [44,45]. The lowest polar component of surface free energy suggested that most of the liquid interactions with electrospun fibers can be related to the dispersive part including van der Waals forces, enhanced by the large surface area created by the small diameter of fibers. We observed this effect for PA6 and PMMA fibers, from Group I, see Figure 3. A similar effect was partially observed by Cho et. Al., who studied the porosity of electrospun mats effect on contact angle using a mixture of water and ethanol. The controlled addition of ethanol decreased the surface tension of mixture and thus also decreased of contact angle on electrospun samples [83]. For PCL the critical surface tension of liquids was 57 mNm−1 [7], which is in the range of formamide, see Table 3, thus the contact angles with formamide on PCL meshes are much lower, similarly for PLGA. The critical surface tension is related to the Wenzel state transition from the Cassie–Baxter regime when liquids start to penetrate the network of fibers [53,54].
Keeping in mind that we investigated here high porosity meshes built of a 3D network of randomly arranged fibers we analyzed the fraction of fibers in contact with liquid droplets in wetting experiments. When considering electrospun PMMA meshes as hydrophobic surfaces (Figure 3 and Figure 4), with various fiber fraction, (Figure 5) we analyzed the samples based on Cassie–Baxter state [53]. In Figure 7, we plotted the wetting contact angles with water and glycerol only for PMMA samples characterized by a different fraction of fiber, for PMMA film, we assume Ff equal 100%. As a result, the wetting contact angles decreased proportionally to the decreased Ff. Therefore, we propose a statement that surface free energies decrease with the increased air fraction trapped between fibers building the 3D meshes, and the wetting contact angles are increasing.
Our analysis of surface irregularities show that providing only Df values of electrospun fibers for wetting analysis is not sufficient and additional parameters such as Ff or Ra should be considered to understand the wetting properties of 3D meshes. Surface free energy is reduced here by the air that can be clearly analyzed with the Ff for meshes, as shown in Figure 7. Importantly, the decreased Ff gives lower values of surface free energy and the increase of contact angles. We showed the direct correlation that can be further exploited in terms of theoretical descriptions to provide the prediction of the wetting behavior of meshes with designed fiber fractions.

3.3. Surface Chemistry

The surface chemistry of electrospun polymer fibers and films were analyzed using the XPS method. Atomic concentrations of constituents at the surface of all studied polymer fibers and their film equivalents are presented in Table 7. Results for polymer fibers show slightly increased oxygen content at the surface as compared with the films, except for PCL, for which the oxygen/carbon (O/C in Table 7) ratio was insignificantly decreased. Additionally, for all studied polymers excluding PCL, the fiber compositions were closer to theoretically expected values. However, it was unfeasible to indicate any clear dependence between the surface chemistry of fibers and films, their oxygen, fluorine, and/or nitrogen content changed, in relation to measured contact angles. The change in the surface compositions among films and fibers had a negligible impact on measured contact angles.

4. Conclusions

The aim of this study was to validate surface geometry effects over the polymer chemistry on contact angles on electrospun meshes. We found that it was very important how the geometry of electrospun surfaces was validated. The commonly used fiber diameter was not necessarily a convincing parameter unless it was correlated with surface roughness [7,46,50,51,69]. Another important parameter that should be included in the roughness analysis of electrospun surfaces was a fraction of fibers that was strictly correlated with changes of surface free energies of 3D meshes, which was reduced by the air trapped between fibers.
We showed that the wetting of electrospun meshes was eventually controlled with roughness and fraction of fibers, which was related to the surfaces in contact with liquids. The air trapped between fibers was keeping their wetting behavior in the Cassie–Baxter regime, however, it was quickly transformed to the Wenzel state once the liquid surface tension was reduced to 58 mNm−1. Increasing roughness of the most hydrophilic polymers, represented here by PA6, was not sufficient to achieve higher contact angles than on films, suggesting that chemical modifications would be necessary to obtain higher contact angles on PA6 meshes. In the case of formamide, where surface tension was close to the critical values for given polymer, the dispersive and polar components played an important role for liquids and solids. The van der Waals interaction included in the dispersive part of surface free energy was enhanced due to the increased surface area of electrospun samples, which resulted in liquids soaking into the small diameter (below 0.5 µm) fiber networks. The hydrophobic properties of the surfaces can be enhanced by roughness that is created by randomly oriented fibers without complex chemical treatment. The geometry was the main factor influencing the contact angle of high surface tension liquids, such as water and glycerol on electrospun fibers, unaffected by polymer surface chemistry.
Our study opens the discussion about the standard methods to use in the characterization roughness of electrospun fibers roughness to be able to compare it to wetting contact angles. Within this comprehensive study, we indicated the complexity of surface effects on wetting on electrospun fibers from polymers that are very often used in the filtration and biomedical industry.

Supplementary Materials

The following are available online at https://www.mdpi.com/2073-4360/11/1/34/s1, Figure S1: SEM micrographs of spin-coated polymer films: (a) PA6, (b) PVDF, (c) PMMA, (d) PLGA, (e) PC, (f) PCL, and (g) PS; Figure S2: Surface images from laser microscope for (a) PA6, (b) PVDF, (c) PMMA 1, (d) PMMA 2, (e) PMMA 3, (f) PLGA, (g) PC, (h) PCL, (i) PS used for roughness measurements Ra, Figure S3: Binary images of electrospun meshes obtained from SEM images that were used for the calculation of fiber fraction, Ff for (a) PA6, (b) PVDF, (c) PMMA 1, (d) PMMA 2, (e) PMMA 3, (f) PLGA, (g) PC, (h) PCL, (i) PS; Figure S4: Electrospun PMMA fibers deposited for (a) 15 minutes, (b) 30 minutes, (c) 45 minutes with fiber diameters’ histograms, Table S1: Representative images of a droplet on electrospun polymer fibers and films with water, glycerol, and formamide used for contact angle measurements with the average values of contact angle ± standard deviation for all the samples, Table S2: A linear fit to Owens–Wendt plots presented in Figure 4. The intercept and slope were used for the calculation of polar and dispersive components of surface free energy (SFE).

Author Contributions

All authors provided critical feedback and helped shape the research, analysis and manuscript.

Funding

This research was conducted within the funding from the Sonata Bis 5 project granted by National Science Centre, No 2015/18/E/ST5/00230 apart from electrospinning of PCL, PMMA, PLGA and contact angle and XPS measurements which were conducted within the funding from the Sonata 8 project granted by National Science Centre, No 2014/15/D/ST5/02598, and supported by the infrastructure at International Centre of Electron Microscopy for Materials Science (IC-EM) at AGH University of Science and Technology.

Conflicts of Interest

The authors declare no conflict of interest.

References

  1. Kubiak, K.J.; Wilson, M.C.T.; Mathia, T.G.; Carval, P. Wettability versus roughness of engineering surfaces. Wear 2011, 271, 523–528. [Google Scholar] [CrossRef] [Green Version]
  2. Guo, Z.; Liu, W.; Su, B.L. Superhydrophobic surfaces: From natural to biomimetic to functional. J. Colloid Interface Sci. 2011, 353, 335–355. [Google Scholar] [CrossRef] [PubMed]
  3. Bhushan, B.; Jung, Y.C.; Koch, K. Micro-, nano- and hierarchical structures for superhydrophobicity, self-cleaning and low adhesion. Philos. Trans. A Math. Phys. Eng. Sci. 2009, 367, 1631–1672. [Google Scholar] [CrossRef] [PubMed] [Green Version]
  4. Azad, M.A.K.; Barthlott, W.; Koch, K. Hierarchical Surface Architecture of Plants as an Inspiration for Biomimetic Fog Collectors. Langmuir 2015, 31, 13172–13179. [Google Scholar] [CrossRef]
  5. Brown, P.S.; Bhushan, B. Bioinspired materials for water supply and management: Water collection, water purification and separation of water from oil. Philos. Trans. A Math. Phys. Eng. Sci. 2016, 374, 20160135. [Google Scholar] [CrossRef]
  6. Tuteja, A.; Choi, W.; Ma, M.; Mabry, J.M.; Mazzella, S.A.; Rutledge, G.C.; McKinley, G.H.; Cohen, R.E. Designing Superoleophobic Surfaces. Science 2007, 318, 1618–1622. [Google Scholar] [CrossRef] [PubMed]
  7. Yohe, S.T.; Freedman, J.D.; Falde, E.J.; Colson, Y.L.; Grinstaff, M.W. A Mechanistic Study of Wetting Superhydrophobic Porous 3D Meshes. Adv. Funct. Mater. 2013, 23, 3628–3637. [Google Scholar] [CrossRef] [Green Version]
  8. Gopal, R.; Kaur, S.; Ma, Z.; Chan, C.; Ramakrishna, S.; Matsuura, T. Electrospun nanofibrous filtration membrane. J. Membr. Sci. 2006, 281, 581–586. [Google Scholar] [CrossRef]
  9. Zhang, C.; Li, P.; Cao, B. Electrospun Microfibrous Membranes Based on PIM-1/POSS with High Oil Wettability for Separation of Oil–Water Mixtures and Cleanup of Oil Soluble Contaminants. Ind. Eng. Chem. Res. 2015, 54, 8772–8781. [Google Scholar] [CrossRef]
  10. Zhang, C.; Li, P.; Cao, B. Fabrication of superhydrophobic-superoleophilic fabrics by an etching and dip-coating two-step method for oil-water separation. Ind. Eng. Chem. Res. 2016, 55, 5030–5035. [Google Scholar] [CrossRef]
  11. Li, X.; Yu, X.; Cheng, C.; Deng, L.; Wang, M.; Wang, X. Electrospun Superhydrophobic Organic/Inorganic Composite Nanofibrous Membranes for Membrane Distillation. ACS Appl. Mater. Interfaces 2015, 7, 21919–21930. [Google Scholar] [CrossRef] [PubMed]
  12. Han, D.; Steckl, A.J. Selective pH-Responsive Core-Sheath Nanofiber Membranes for Chem/Bio/Med Applications: Targeted Delivery of Functional Molecules. ACS Appl. Mater. Interfaces 2017, 9, 42653–42660. [Google Scholar] [CrossRef] [PubMed]
  13. Park, A.M.; Turley, F.E.; Wycisk, R.J.; Pintauro, P.N. Electrospun and cross-linked nanofiber composite anion exchange membranes. Macromolecules 2014, 47, 227–235. [Google Scholar] [CrossRef]
  14. Stachewicz, U.; Modaresifar, F.; Bailey, R.J.; Peijs, T.; Barber, A.H. Manufacture of Void-Free Electrospun Polymer Nanofiber Composites with Optimized Mechanical Properties. ACS Appl. Mater. Interfaces 2012, 4, 2577–2582. [Google Scholar] [CrossRef]
  15. Enayati, M.S.; Behzad, T.; Sajkiewicz, P.; Bagheri, R.; Ghasemi-Mobarakeh, L.; Pierini, F. Theoretical and experimental study of the stiffness of electrospun composites of poly(vinyl alcohol), cellulose nanofibers, and nanohydroxy apatite. Cellulose 2018, 25, 65–75. [Google Scholar] [CrossRef]
  16. Morello, G.; Camposeo, A.; Moffa, M.; Pisignano, D. Electrospun amplified fiber optics. ACS Appl. Mater. Interfaces 2015, 7, 5213–5218. [Google Scholar] [CrossRef] [PubMed]
  17. Ganesh, V.A.; Ranganath, A.S.; Baji, A.; Raut, H.K.; Sahay, R.; Ramakrishna, S. Hierarchical Structured Electrospun Nanofibers for Improved Fog Harvesting Applications. Macromol. Mater. Eng. 2017, 302, 1600387. [Google Scholar] [CrossRef]
  18. Park, K.C.; Chhatre, S.S.; Srinivasan, S.; Cohen, R.E.; McKinley, G.H. Optimal design of permeable fiber network structures for fog harvesting. Langmuir 2013, 29, 13269–13277. [Google Scholar] [CrossRef]
  19. Liang, M.; Chen, X.; Xu, Y.; Zhu, L.; Jin, X.; Huang, C. Double-grooved nanofibre surfaces with enhanced anisotropic hydrophobicity. Nanoscale 2017, 9, 16214–16222. [Google Scholar] [CrossRef]
  20. Varagnolo, S.; Raccanello, F.; Pierno, M.; Mistura, G.; Moffa, M.; Persano, L.; Pisignano, D. Highly sticky surfaces made by electrospun polymer nanofibers. RSC Adv. 2017, 7, 5836–5842. [Google Scholar] [CrossRef] [Green Version]
  21. Lavielle, N.; Hébraud, A.; Thöny-Meyer, L.; Rossi, R.M.; Schlatter, G. 3D Composite Assemblies of Microparticles and Nanofibers for Tailored Wettability and Controlled Drug Delivery. Macromol. Mater. Eng. 2017, 302, 1–8. [Google Scholar] [CrossRef]
  22. Agarwal, S.; Wendorff, J.H.; Greiner, A. Use of electrospinning technique for biomedical applications. Polymer 2008, 49, 5603–5621. [Google Scholar] [CrossRef] [Green Version]
  23. Haider, A.; Haider, S.; Kang, I.-K. A comprehensive review summarizing the effect of electrospinning parameters and potential applications of nanofibers in biomedical and biotechnology. Arab. J. Chem. 2018, 11, 1165–1188. [Google Scholar] [CrossRef]
  24. Zhou, Q.; Xie, J.; Bao, M.; Yuan, H.; Ye, Z.; Lou, X.; Zhang, Y. Engineering aligned electrospun PLLA microfibers with nano-porous surface nanotopography for modulating the responses of vascular smooth muscle cells. J. Mater. Chem. B 2015, 3, 4439–4450. [Google Scholar] [CrossRef]
  25. Ahmed, F.; Choudhury, N.R.; Dutta, N.K.; Zannettino, A.; Knott, R. Near superhydrophobic fibrous scaffold for endothelialization: Fabrication, characterization and cellular activities. Biomacromolecules 2013, 14, 3850–3860. [Google Scholar] [CrossRef]
  26. Stachewicz, U.; Qiao, T.; Rawlinson, S.C.F.; Almeida, F.V.; Li, W.-Q.Q.; Cattell, M.; Barber, A.H. 3D imaging of cell interactions with electrospun PLGA nanofiber membranes for bone regeneration. Acta Biomater. 2015, 27, 88–100. [Google Scholar] [CrossRef]
  27. Terpilowski, K.; Rymuszka, D.; Holysz, L.; Chibowski, E. Changes in Wettability of Polycarbonate and Polypropylene Pretreated With Oxygen and Argon Plasma. In Proceedings of the 8th International Conference MMT-20142, Ariel, Israel, 28 July–01 August 01 2014; pp. 155–165. [Google Scholar]
  28. Squires, T.M. Drops on soft surfaces learn the hard way. Proc. Natl. Acad. Sci. USA 2013, 110, 12505–12506. [Google Scholar] [CrossRef] [Green Version]
  29. Ma, M.; Gupta, M.; Li, Z.; Zhai, L.; Gleason, K.K.; Cohen, R.E.; Rubner, M.F.; Rutledge, G.C. Decorated electrospun fibers exhibiting superhydrophobicity. Adv. Mater. 2007, 19, 255–259. [Google Scholar] [CrossRef]
  30. Pai, C.L.; Boyce, M.C.; Rutledge, G.C. Morphology of porous and wrinkled fibers of polystyrene electrospun from dimethylformamide. Macromolecules 2009, 42, 2102–2114. [Google Scholar] [CrossRef]
  31. Wang, L.; Pai, C.L.; Boyce, M.C.; Rutledge, G.C. Wrinkled surface topographies of electrospun polymer fibers. Appl. Phys. Lett. 2009, 94, 92–95. [Google Scholar] [CrossRef]
  32. Scheffler, R.; Bell, N.S.; Sigmund, W. Electrospun Teflon AF fibers for superhydrophobic membranes. J. Mater. Res. 2010, 25, 1595–1600. [Google Scholar] [CrossRef]
  33. Muthiah, P.; Hsu, S.H.; Sigmund, W. Coaxially electrospun PVDF-teflon AF and teflon AF-PVDF core-sheath nanofiber mats with superhydrophobic properties. Langmuir 2010, 26, 12483–12487. [Google Scholar] [CrossRef] [PubMed]
  34. Liu, C.; Burghaus, U.; Besenbacher, F.; Wang, Z.L. Preparation and Characterization of Nanomaterials for Sustainable Energy Production. ACS Nano 2010, 4, 5517–5526. [Google Scholar] [CrossRef] [PubMed] [Green Version]
  35. Stachewicz, U.; Bailey, R.J.; Zhang, H.; Stone, C.A.; Willis, C.R.; Barber, A.H. Wetting Hierarchy in Oleophobic 3D Electrospun Nanofiber Networks. ACS Appl. Mater. Interfaces 2015, 7, 16645–16652. [Google Scholar] [CrossRef] [PubMed] [Green Version]
  36. Song, Z.; Hou, X.; Zhang, L.; Wu, S. Enhancing crystallinity and orientation by hot-stretching to improve the mechanical properties of electrospun partially aligned polyacrylonitrile (PAN) nanocomposites. Materials 2010, 4, 621–632. [Google Scholar] [CrossRef] [PubMed]
  37. Stachewicz, U.; Bailey, R.J.; Wang, W.; Barber, A.H. Size dependent mechanical properties of electrospun polymer fibers from a composite structure. Polymer 2012, 53, 5132–5137. [Google Scholar] [CrossRef]
  38. Camposeo, A.; Greenfeld, I.; Tantussi, F.; Moffa, M.; Fuso, F.; Allegrini, M.; Zussman, E.; Pisignano, D. Conformational evolution of elongated polymer solutions tailors the polarization of light-emission from organic nanofibers. Macromolecules 2014, 47, 4704–4710. [Google Scholar] [CrossRef] [PubMed]
  39. Lee, H.; Yamaguchi, K.; Nagaishi, T.; Murai, M.; Kim, M.; Wei, K.; Zhang, K.Q.; Kim, I.S. Enhancement of mechanical properties of polymeric nanofibers by controlling crystallization behavior using a simple freezing/thawing process. RSC Adv. 2017, 7, 43994–44000. [Google Scholar] [CrossRef] [Green Version]
  40. Duprat, C.; Protière, S.; Beebe, A.Y.; Stone, H.A. Wetting of flexible fibre arrays. Nature 2012, 482, 510–513. [Google Scholar] [CrossRef] [PubMed]
  41. Sauret, A.; Bick, A.D.; Duprat, C.; Stone, H.A. Wetting of crossed fibers: Multiple steady states and symmetry breaking. Europhys. Lett. 2014, 105, 56006. [Google Scholar] [CrossRef] [Green Version]
  42. Chaudhury, M.K. Interfacial interaction between low-energy surfaces. Mater. Sci. Eng. R Rep. 1996, 16, 97–159. [Google Scholar] [CrossRef]
  43. Stachewicz, U.; Stone, C.A.; Willis, C.R.; Barber, A.H. Charge assisted tailoring of chemical functionality at electrospun nanofiber surfaces. J. Mater. Chem. 2012, 22, 22935–22941. [Google Scholar] [CrossRef]
  44. Stachewicz, U.; Barber, A.H. Enhanced wetting behavior at electrospun polyamide nanofiber surfaces. Langmuir 2011, 27, 3024–3029. [Google Scholar] [CrossRef] [PubMed]
  45. Stachewicz, U.; Hang, F.; Barber, A.H. Adhesion anisotropy between contacting electrospun fibers. Langmuir 2014, 30, 6819–6825. [Google Scholar] [CrossRef]
  46. Ma, M.; Mao, Y.; Gupta, M.; Gleason, K.K.; Rutledge, G.C. Superhydrophobic fabrics produced by electrospinning and chemical vapor deposition. Macromolecules 2005, 38, 9742–9748. [Google Scholar] [CrossRef]
  47. Wang, J.; Raza, A.; Si, Y.; Cui, L.; Ge, J.; Ding, B.; Yu, J. Synthesis of superamphiphobic breathable membranes utilizing SiO2 nanoparticles decorated fluorinated polyurethane nanofibers. Nanoscale 2012, 4, 7549–7556. [Google Scholar] [CrossRef] [PubMed]
  48. Stachewicz, U.; Benett, C.; Barber, A.H. Wetting of polyamide film surfaces with electrospun nanofibers. Mater. Res. Soc. Symp. Proc. 2012, 1403, 47–51. [Google Scholar] [CrossRef]
  49. Qin, X.H.; Xin, D.P. The study on the air volume fraction of electrospun nanofiber nonwoven mats. Fibers Polym. 2010, 11, 632–637. [Google Scholar] [CrossRef]
  50. Sadeghi, P.; Tavanai, H.; Khoddami, A. Hydrophobicity of fluorocarbon-finished electrospun poly (acrylonitrile) nanofibrous webs. J. Text. Inst. 2017, 108, 189–195. [Google Scholar] [CrossRef]
  51. Koysuren, O.; Koysuren, H.N. Characterization of poly(methyl methacrylate) nanofiber mats by electrospinning process. J. Macromol. Sci. Part A Pure Appl. Chem. 2016, 53, 691–698. [Google Scholar] [CrossRef]
  52. Konosu, Y.; Matsumoto, H.; Tsuboi, K.; Minagawa, M.; Tanioka, A. Enhancing the Effect of the Nanofiber Network Structure on Thermoresponsive Wettability Switching. Langmuir 2011, 27, 14716–14720. [Google Scholar] [CrossRef] [PubMed]
  53. Cassie, A.B.D.; Baxter, S. Wettability of porous surfaces. Trans. Faraday Soc. 1944, 40, 546–551. [Google Scholar] [CrossRef]
  54. Wenzel, R.N. Resistance of solid surfaces to wetting by water. Ind. Eng. Chem. 1936, 28, 988–994. [Google Scholar] [CrossRef]
  55. Metwally, S.; Karbowniczek, J.E.; Szewczyk, P.K.; Marzec, M.M.; Bernasik, A.; Stachewicz, U. Single-Step Approach to Tailor Surface Chemistry and Potential on Electrospun PCL Fibers for Tissue Engineering Application. Adv. Mater. Interfaces 2018, 1801211, 1801211. [Google Scholar] [CrossRef]
  56. Cha, B.G.; Kwak, H.W.; Park, A.R.; Kim, S.H.; Park, S.Y.; Kim, H.J.; Kim, I.S.; Lee, K.H.; Park, Y.H. Structural characteristics and biological performance of silk fibroin nanofiber containing microalgae spirulina extract. Biopolymers 2014, 101, 307–318. [Google Scholar] [CrossRef] [PubMed]
  57. Fan, Y.; Chen, Q.; Ayres, V.M.; Baczewski, A.D.; Udpa, L.; Kumar, S. Scanning probe recognition microscopy investigation of tissue scaffold properties. Int. J. Nanomed. 2007, 2, 651–661. [Google Scholar] [CrossRef]
  58. Stachewicz, U.; Szewczyk, P.K.; Kruk, A.; Barber, A.H.; Czyrska-Filemonowicz, A. Pore shape and size dependence on cell growth into electrospun fiber scaffolds for tissue engineering: 2D and 3D analyses using SEM and FIB-SEM tomography. Mater. Sci. Eng. C 2019, 95, 397–408. [Google Scholar] [CrossRef]
  59. Heller, W.; Cheng, M.H.; Greene, B.W. Surface tension measurements by means of the “microcone tensiometer”. J. Colloid Interface Sci. 1966, 22, 179–194. [Google Scholar] [CrossRef]
  60. Van Oss, C.J. Interfacial Forces in Aqueous Media; CRC Press: Boca Raton, FL, USA, 1995; Volume 26, ISBN 1420015761. [Google Scholar]
  61. Pagliaro, M.; Rossi, M. The Future of Glycerol; Green Chemistry Series; Royal Society of Chemistry: Cambridge, UK, 2008; ISBN 978-0-85404-124-4. [Google Scholar]
  62. Rulison, C. Two-Component Surface Energy Characterization as a Predictor of Wettability and Dispersability; KRÜSS GmbH: Hamburg, Germany, 2000; pp. 1–22. [Google Scholar]
  63. Rico, I.; Lattes, A. Formamide, a water substitute. 12. Krafft temperature and micelle formation of ionic surfactants in formamide. J. Phys. Chem. 1986, 90, 5870–5872. [Google Scholar] [CrossRef]
  64. Owens, D.K.; Wendt, R.C. Estimation of the surface free energy of polymers. J. Appl. Polym. Sci. 1969, 13, 1741–1747. [Google Scholar] [CrossRef]
  65. Stachewicz, U.; Li, S.; Bilotti, E.; Barber, A.H. Dependence of surface free energy on molecular orientation in polymer films. Appl. Phys. Lett. 2012, 100, 094104. [Google Scholar] [CrossRef]
  66. Stachewicz, U.; Dijksman, J.F.; Soudani, C.; Tunnicliffe, L.B.; Busfield, J.J.C.; Barber, A.H. Surface free energy analysis of electrospun fibers based on Rayleigh-Plateau/Weber instabilities. Eur. Polym. J. 2017, 91, 368–375. [Google Scholar] [CrossRef]
  67. Busolo, T.; Ura, D.P.; Kim, S.K.; Marzec, M.M.; Bernasik, A.; Stachewicz, U.; Kar-Narayan, S. Surface potential tailoring of PMMA fibers by electrospinning for enhanced triboelectric performance. Nano Energy 2018. [Google Scholar] [CrossRef]
  68. Szewczyk, P.K.; Knapczyk-Korczak, J.; Ura, D.P.; Metwally, S.; Gruszczyński, A.; Stachewicz, U. Biomimicking wetting properties of spider web from Linothele megatheloides with electrospun fibers. Mater. Lett. 2018, 233, 211–214. [Google Scholar] [CrossRef]
  69. Choi, G.R.; Park, J.; Ha, J.W.; Kim, W.D.; Lim, H. Superamphiphobic web of PTFEMA fibers via simple electrospinning without functionalization. Macromol. Mater. Eng. 2010, 295, 995–1002. [Google Scholar] [CrossRef]
  70. Reneker, D.H.; Yarin, A.L. Electrospinning jets and polymer nanofibers. Polymer 2008, 49, 2387–2425. [Google Scholar] [CrossRef]
  71. Bianco, A.; Iardino, G.; Bertarelli, C.; Miozzo, L.; Papagni, A.; Zerbi, G. Modification of surface properties of electrospun polyamide nanofibers by means of a perfluorinated acridine. Appl. Surf. Sci. 2007, 253, 8360–8364. [Google Scholar] [CrossRef]
  72. Liao, Y.; Wang, R.; Fane, A.G. Fabrication of bioinspired composite nanofiber membranes with robust superhydrophobicity for direct contact membrane distillation. Environ. Sci. Technol. 2014, 48, 6335–6341. [Google Scholar] [CrossRef]
  73. Can-Herrera, L.A.; Ávila-Ortega, A.; de la Rosa-García, S.; Oliva, A.I.; Cauich-Rodríguez, J.V.; Cervantes-Uc, J.M. Surface modification of electrospun polycaprolactone microfibers by air plasma treatment: Effect of plasma power and treatment time. Eur. Polym. J. 2016, 84, 502–513. [Google Scholar] [CrossRef]
  74. Russo, V.; Tammaro, L.; Di Marcantonio, L.; Sorrentino, A.; Ancora, M.; Valbonetti, L.; Turriani, M.; Martelli, A.; Cammà, C.; Barboni, B. Amniotic epithelial stem cell biocompatibility for electrospun poly(lactide-co-glycolide), poly(ε-caprolactone), poly(lactic acid) scaffolds. Mater. Sci. Eng. C 2016, 69, 321–329. [Google Scholar] [CrossRef]
  75. Kang, M.; Jung, R.; Kim, H.S.; Jin, H.J. Preparation of superhydrophobic polystyrene membranes by electrospinning. Colloids Surf. A Physicochem. Eng. Asp. 2008, 313–314, 411–414. [Google Scholar] [CrossRef]
  76. Li, S.; Barber, A.H. Creating superhydrophobic polycarbonate fiber network from hydrophilic polycarbonate through electrospinning. Mater. Res. Soc. Symp. Proc. 2012, 1403, 53–58. [Google Scholar] [CrossRef]
  77. Chen, J.-T.; Chen, W.-L.; Fan, P.-W.; Yao, I.-C. Effect of Thermal Annealing on the Surface Properties of Electrospun Polymer Fibers. Macromol. Rapid Commun. 2014, 35, 360–366. [Google Scholar] [CrossRef] [PubMed]
  78. Hejda, F.; Solař, P.; Kousal, J. Surface free energy determination by contact angle measurements—A comparison of various approaches. In WDS’10 Proceedings of Contributed Papers, Part III; Charles University: Prague, Czech Republic, 1969; pp. 25–30. [Google Scholar]
  79. Dalet, P.; Papon, E.; Villenave, J.J. Surface free energy of polymeric materials: Relevancy of conventional contact angle data analyses. J. Adhes. Sci. Technol. 1999, 13, 857–870. [Google Scholar] [CrossRef]
  80. Wu, S. Polymer Interface and Adhesion; CRC Press: Boca Raton, FL, USA, 1982; ISBN 9780824715335. [Google Scholar]
  81. Wu, S. Calculation of interfacial tension in polymer systems. J. Polym. Sci. Part C Polym. Symp. 2007, 34, 19–30. [Google Scholar] [CrossRef]
  82. Luk, J.Z.; Cork, J.; Cooper-White, J.; Grøndahl, L. Use of two-step grafting to fabricate dual-functional films and site-specific functionalized scaffolds. Langmuir 2015, 31, 1746–1754. [Google Scholar] [CrossRef]
  83. Cho, D.; Chen, S.; Jeong, Y.; Joo, Y.L. Surface hydro-properties of electrospun fiber mats. Fibers Polym. 2015, 16, 1578–1586. [Google Scholar] [CrossRef]
Figure 1. Scanning electron microscopy (SEM) images of electrospun fibers with fiber diameter (Df) histograms for (a) hydrophilic nylon 6 (PA6), (b) poly(methyl methacrylate) (PMMA) 1, (c) polyvinylidene fluoride (PVDF), (d) PMMA 2, (e) poly(lactic-co-glycolic acid) (PLGA), (f) polycarbonate (PC), (g) PMMA 3, (h) polycaprolactone (PCL), and (i) polystyrene (PS).
Polymers 11 00034 g001
Figure 2. Roughness Ra and fraction Ff as a function of average fiber diameter, Df, in three-dimensional (3D) meshes.
Polymers 11 00034 g002
Figure 3. Contact angles values on polymer films and meshes for water, glycerol, and formamide. The horizontal red dashed lines indicate the threshold contact angle of 90° between hydrophobic and hydrophilic properties and perpendicular blue dashed lines indicate the four groups according to the average fiber diameter, Df.
Polymers 11 00034 g003
Figure 4. The contact angle for water, glycerol, and formamide on PMMA mesh with three sets of Df: PMMA 1—0.34 μm, PMMA 2—1.43 μm, PMMA 3—2.57 μm.
Polymers 11 00034 g004
Figure 5. Water, glycerol, and formamide contact angles as a function of fiber diameters, Df roughness Ra, and Ff. The linear fittings to the experimental points with R2 values are indicated on the graphs.
Polymers 11 00034 g005
Figure 6. Owens–Wendt plots for all polymer films produced using Equation 2 for three probe liquids of different surface tension. The fitting function for the trend lines is presented in Supporting Information in Table S2.
Polymers 11 00034 g006
Figure 7. Changes in contact angle for water and glycerol on PMMA samples with a fraction of fibers in 3D meshes.
Polymers 11 00034 g007
Table 1. Details of solution preparation for electrospinning and spin-coating for all polymers including molecular weight (Mw), concentration w/w (C), solvents, stirring time (t), the rotation speed of stirrer (vr), and temperature of the hot plate during mixing.
PolymerSupplierMw [g·mol−1]SolventsC [%]t [h]vr [rpm]T [°C]
PA6BASF, Ludwigshafen, Germany24,000Formic Acid:Acetic Acid
1:1
12450025
PVDFSigma Aldrich275,000DMAc:Acetone
1:1
224150060
PMMA 1Sigma Aldrich150,000Formic Acid:(DMF)
7:3
12375045
PMMA 2Sigma Aldrich350,000DMF122.550055
PMMA 3Sigma Aldrich150,000DMF30375045
PLGASigma Aldrich66,000–107,000Chloroform:DMF
85:15
15250025
PCGoodfellow, Huntingdon, UK-DMF:THF
1:1
20490050
PCLPerstorp, Warrington, UK50,000Chloroform12270025
PSSigma Aldrich350,000DMF25650025
Table 2. The electrospinning and spin-coating parameters used to produce polymer fibers and films.
PolymerElectrospinningSpin-Coating
U [kV]Q [ml·h−1]D [cm]H [%]ts [s]vs [rpm]
PA6160.21540101000
PVDF154.21860403500
PMMA 1110.31040--
PMMA 2124.01535203500
PMMA 31231540--
PLGA179.51560603000
PC123.01550205000
PCL140.0012050603000
PS111.51540102000
Table 3. Surface tension and its components for all liquids: water [59,60], glycerol [61,62], and formamide [62,63] used in contact angle measurements.
Liquid γ l [mJm−2] γ l p [mJm−2] γ l d [mJm−2]
Water72.851.021.8
Glycerol64.030.034.0
Formamide58.218.739.5
Table 4. The thickness of electrospun samples from PMMA 2 fibers with characteristic electrospinning time and all other characteristic parameters, such as Df, Ra, Ff, and contact angles with water, glycerol, and formamide.
Fibers Deposition Time [min]Sample Thickness [μm]Df [μm]Ra [µm]Ff [%]Contact Angle [°]
WaterGlycerolFormamide
1535.321.43 ± 0.257.10 ± 0.9145.20 ± 15.55131.9 ± 3.3129.1 ± 3.0118.2 ± 3.1
3067.901.55 ± 0.256.76 ± 0.5245.41 ± 3.14125.2 ± 4.2126.1 ± 5.8119.6 ± 2.3
45134.681.70 ± 0.2010.18 ± 0.8241.18 ± 10.75130.3 ± 5.0126.7 ± 2.8118.6 ± 3.1
Table 5. Water contact angle on electrospun polymer fibers with Df as compared with the literature data.
Polymer FibersWater Contact Angle [°]Df [μm]
MeasuredLiterature Data with ReferencesMeasuredLiterature Data with References
PA651.7 ± 4.950.0 [71]0.12 ± 0.020.15 ± 0.03 [71]
PVDF136.3 ± 3.9142.8 ± 1.4 [72]1.23 ± 0.50~0.17 [72]
PMMA 1116.0 ± 4.2134.6 ± 3.0 [51]0.34 ± 0.090.34 ± 0.05 [51]
PMMA 2125.2 ± 4.2132.2 ± 4.1 [51]1.43 ± 0.191.42 ± 0.14 [51]
PMMA 3118.8 ± 5.8135.0 [77]2.57 ± 0.925.00 - 5.50 [77]
PLGA121.6 ± 8.5125.0 [74]1.81 ± 0.900.80 - 1.60 [74]
PC145.1 ± 2.6122.0 ± 0.7 [76]2.35 ± 0.53~0.75 [76]
PCL129.4 ± 3.3128.0 ± 6.0 [73]4.08 ± 1.711.30 ± 0.60 [73]
PS124.8 ± 4.9138.1 ± 0.7 [75]5.48 ± 0.4712.70 ± 1.60 [75]
Table 6. Summaries of surface free energy calculated for all polymer films based on Owens-Wendt plots shown in Figure 6 with data found in the literature and references.
PolymerSurface Free Energy [mJm−2]
CalculatedLiterature Data
γ s γ s p γ s d γ s γ s p γ s d Ref.
PA645.922.923.040.35.5034.9[44]
PVDF24.27.2017.130.37.0023.3[80]
PMMA35.912.823.132.09.0023.0[81]
PLGA31.715.716.0----
PC39.30.9038.544.01.0043.0[27]
PCL40.77.4033.333.010.022.0[82]
PS25.39.1016.232.15.4026.7[81]
Table 7. X-ray photoelectron microscopy (XPS) results, expressed as % atomic, for polymer films and fibers prepared from the same polymer solution for PA6, PVDF, PMMA, PLGA, PC, PCL, and PS.
Polymer SampleCOFNO/C
PA6fibers75.211.9-12.90.16
film78.010.2-11.80.13
PVDFfibers51.10.7048.1--
film53.2-46.8--
PMMA 2fibers69.529.9--0.43
film73.426.6--0.36
PLGAfibers60.139.9--0.66
film61.638.4--0.62
PCfibers82.917.1--0.21
film85.214.8--0.17
PCLfibers78.022.0--0.28
film77.522.5--0.29
PSfibers100.00.00--0.00
film100.00.00--0.00

