CO2 in Lyotropic Liquid Crystals: Monoethanolamine-Facilitated Uptake and Swelling


Abstract
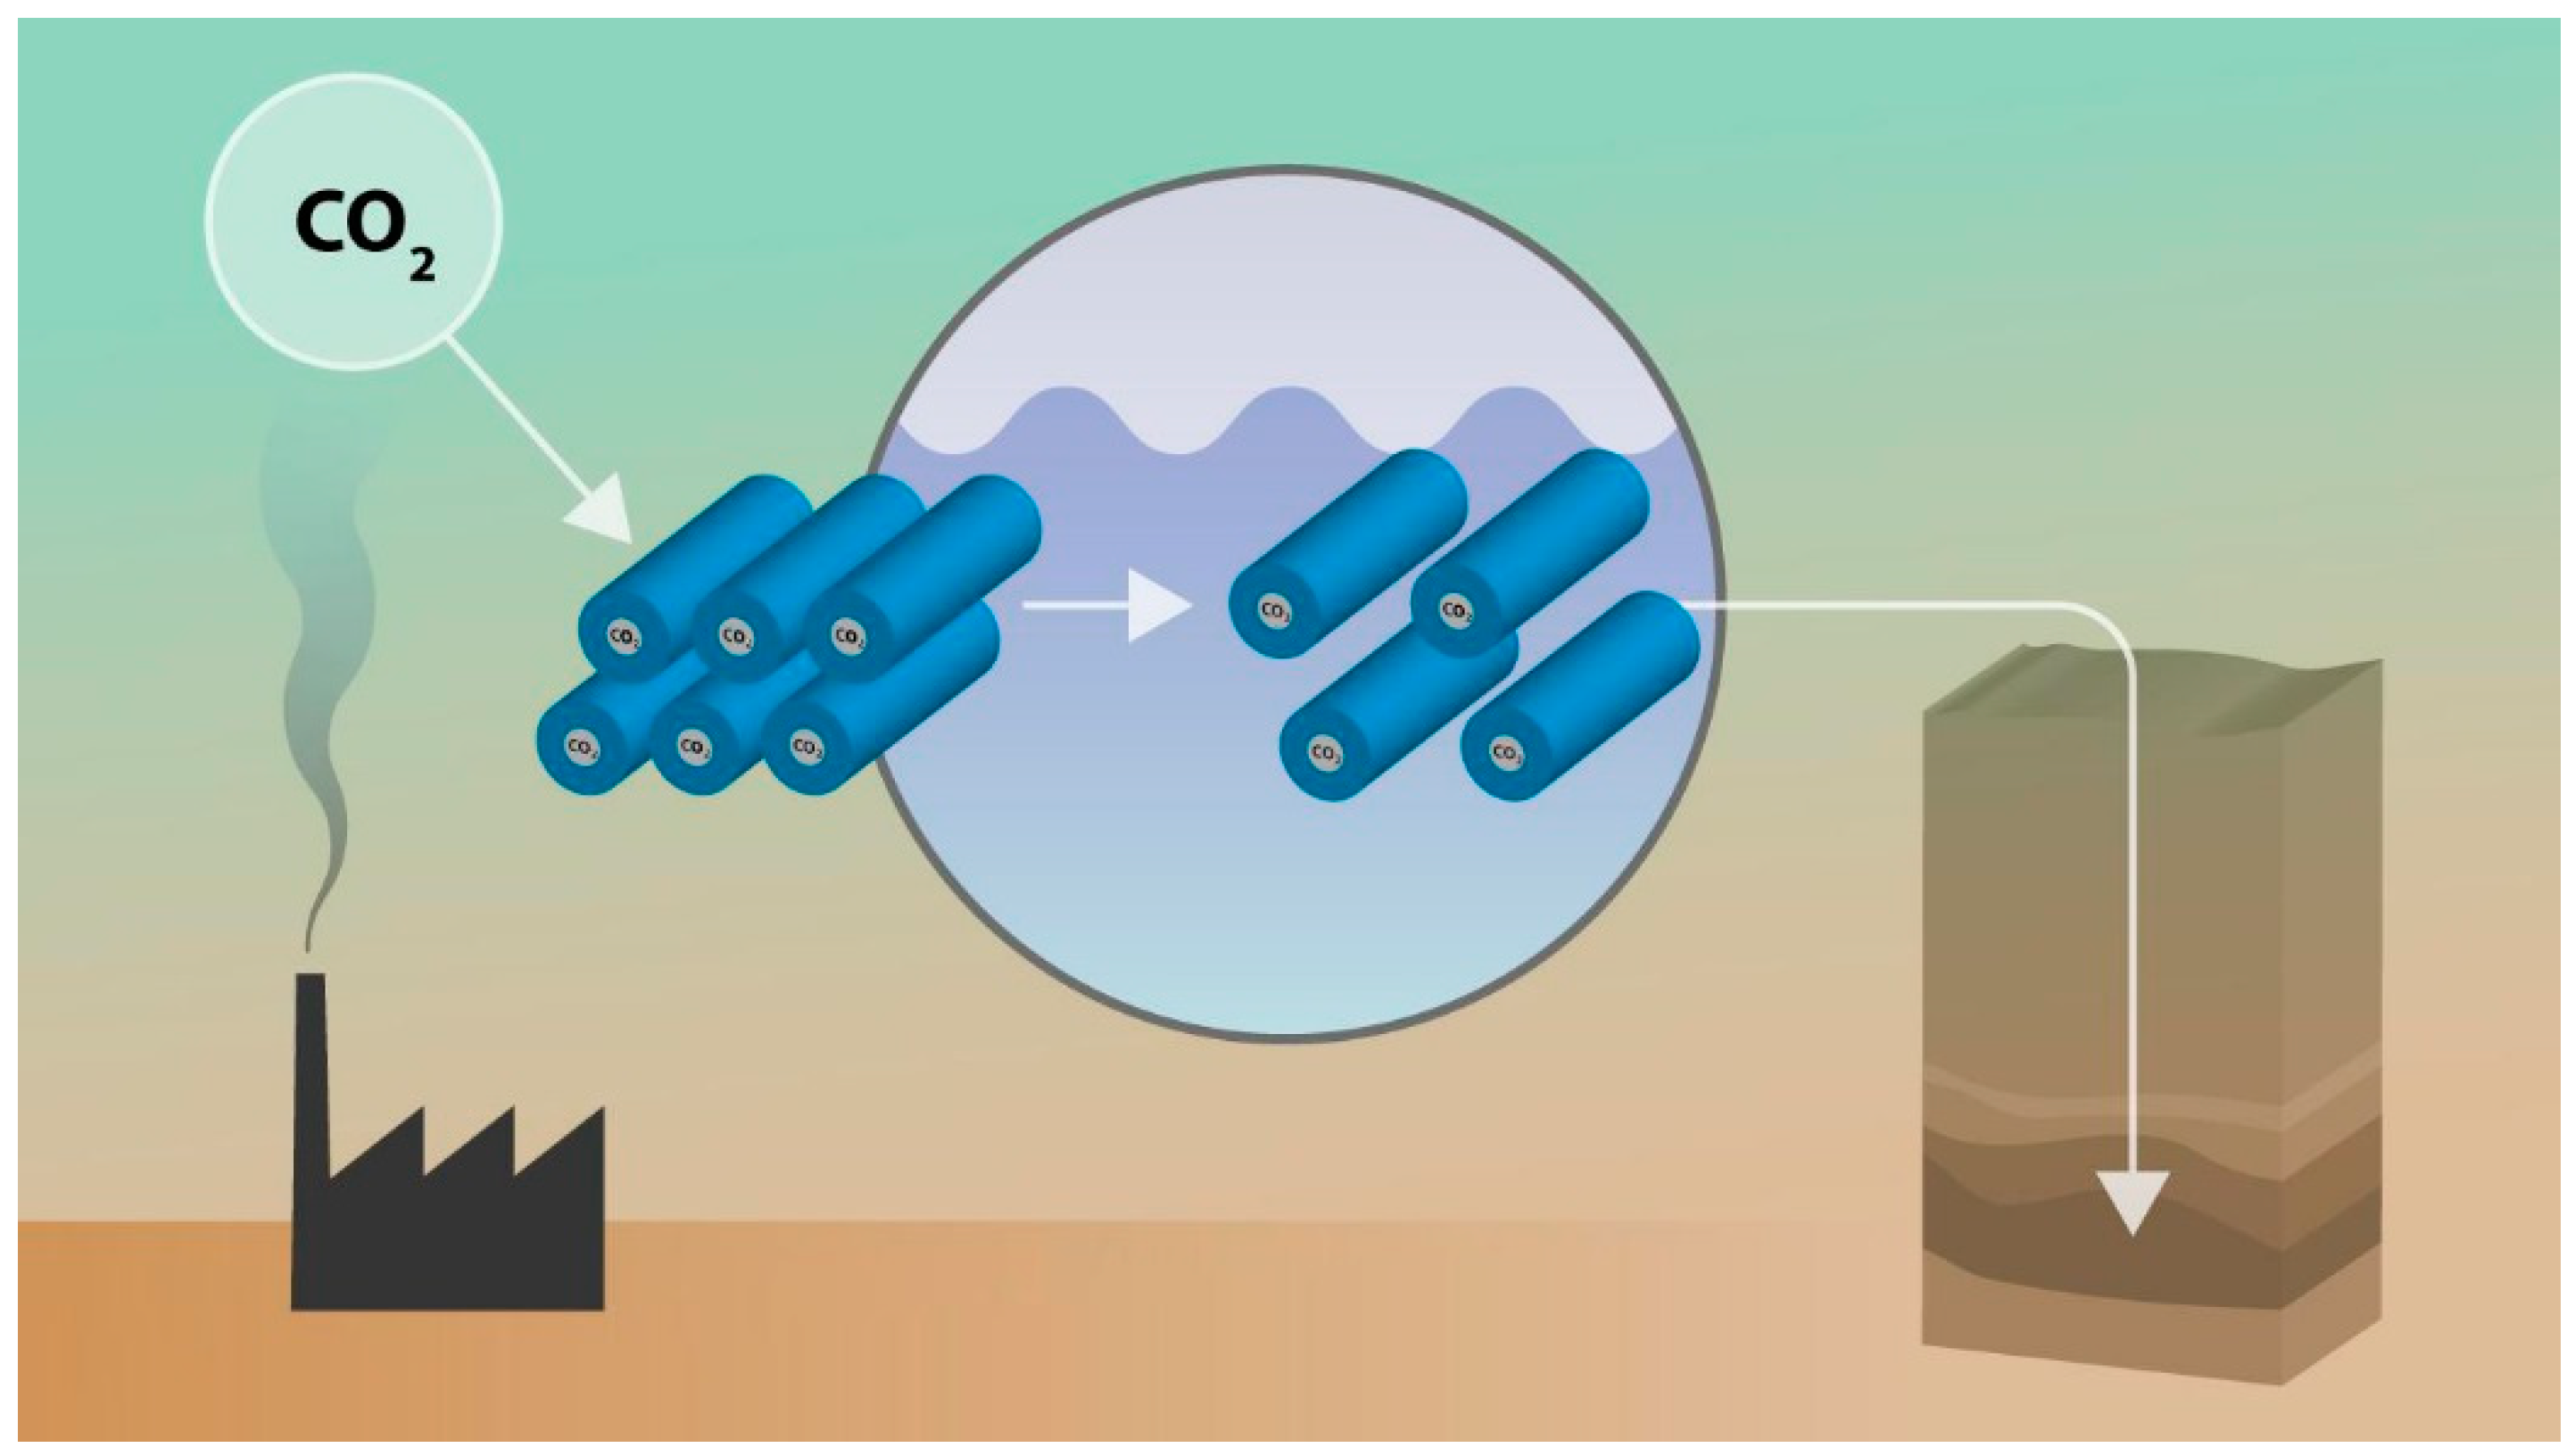
1. Introduction
2. Materials and Methods
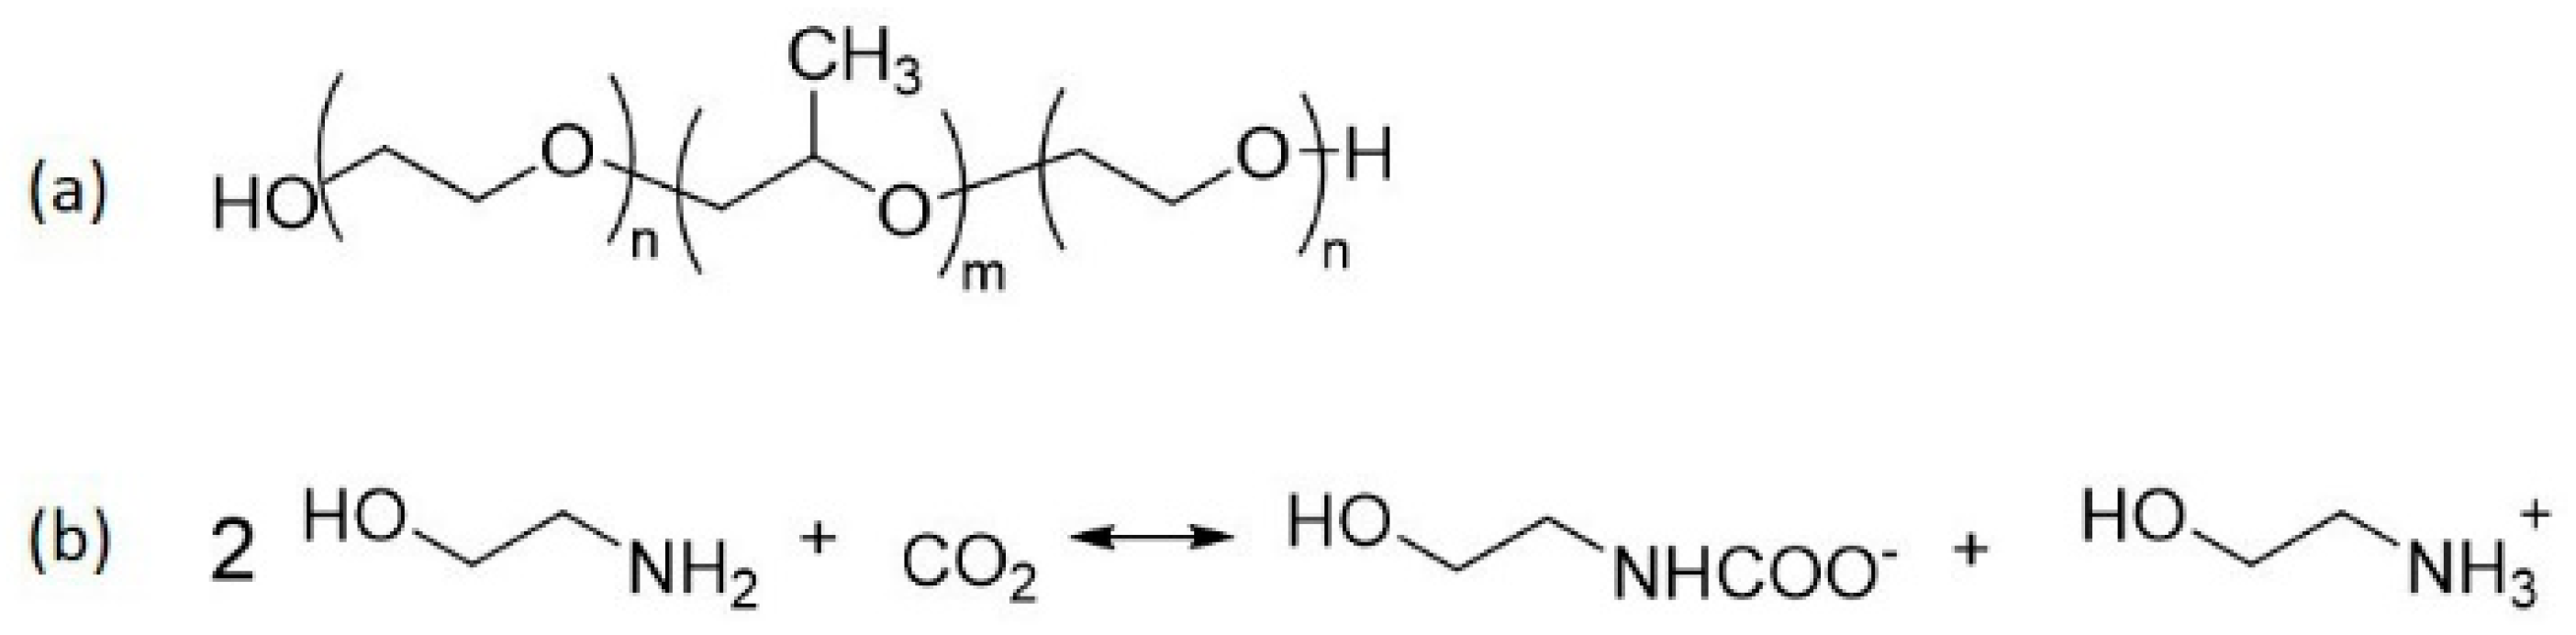
2.1. Materials
2.2. Loading of MEA with CO2
2.3. Total Inorganic Carbon (TIC) Analysis
2.4. Sample Preparation
2.5. Inspection under Polarized Light
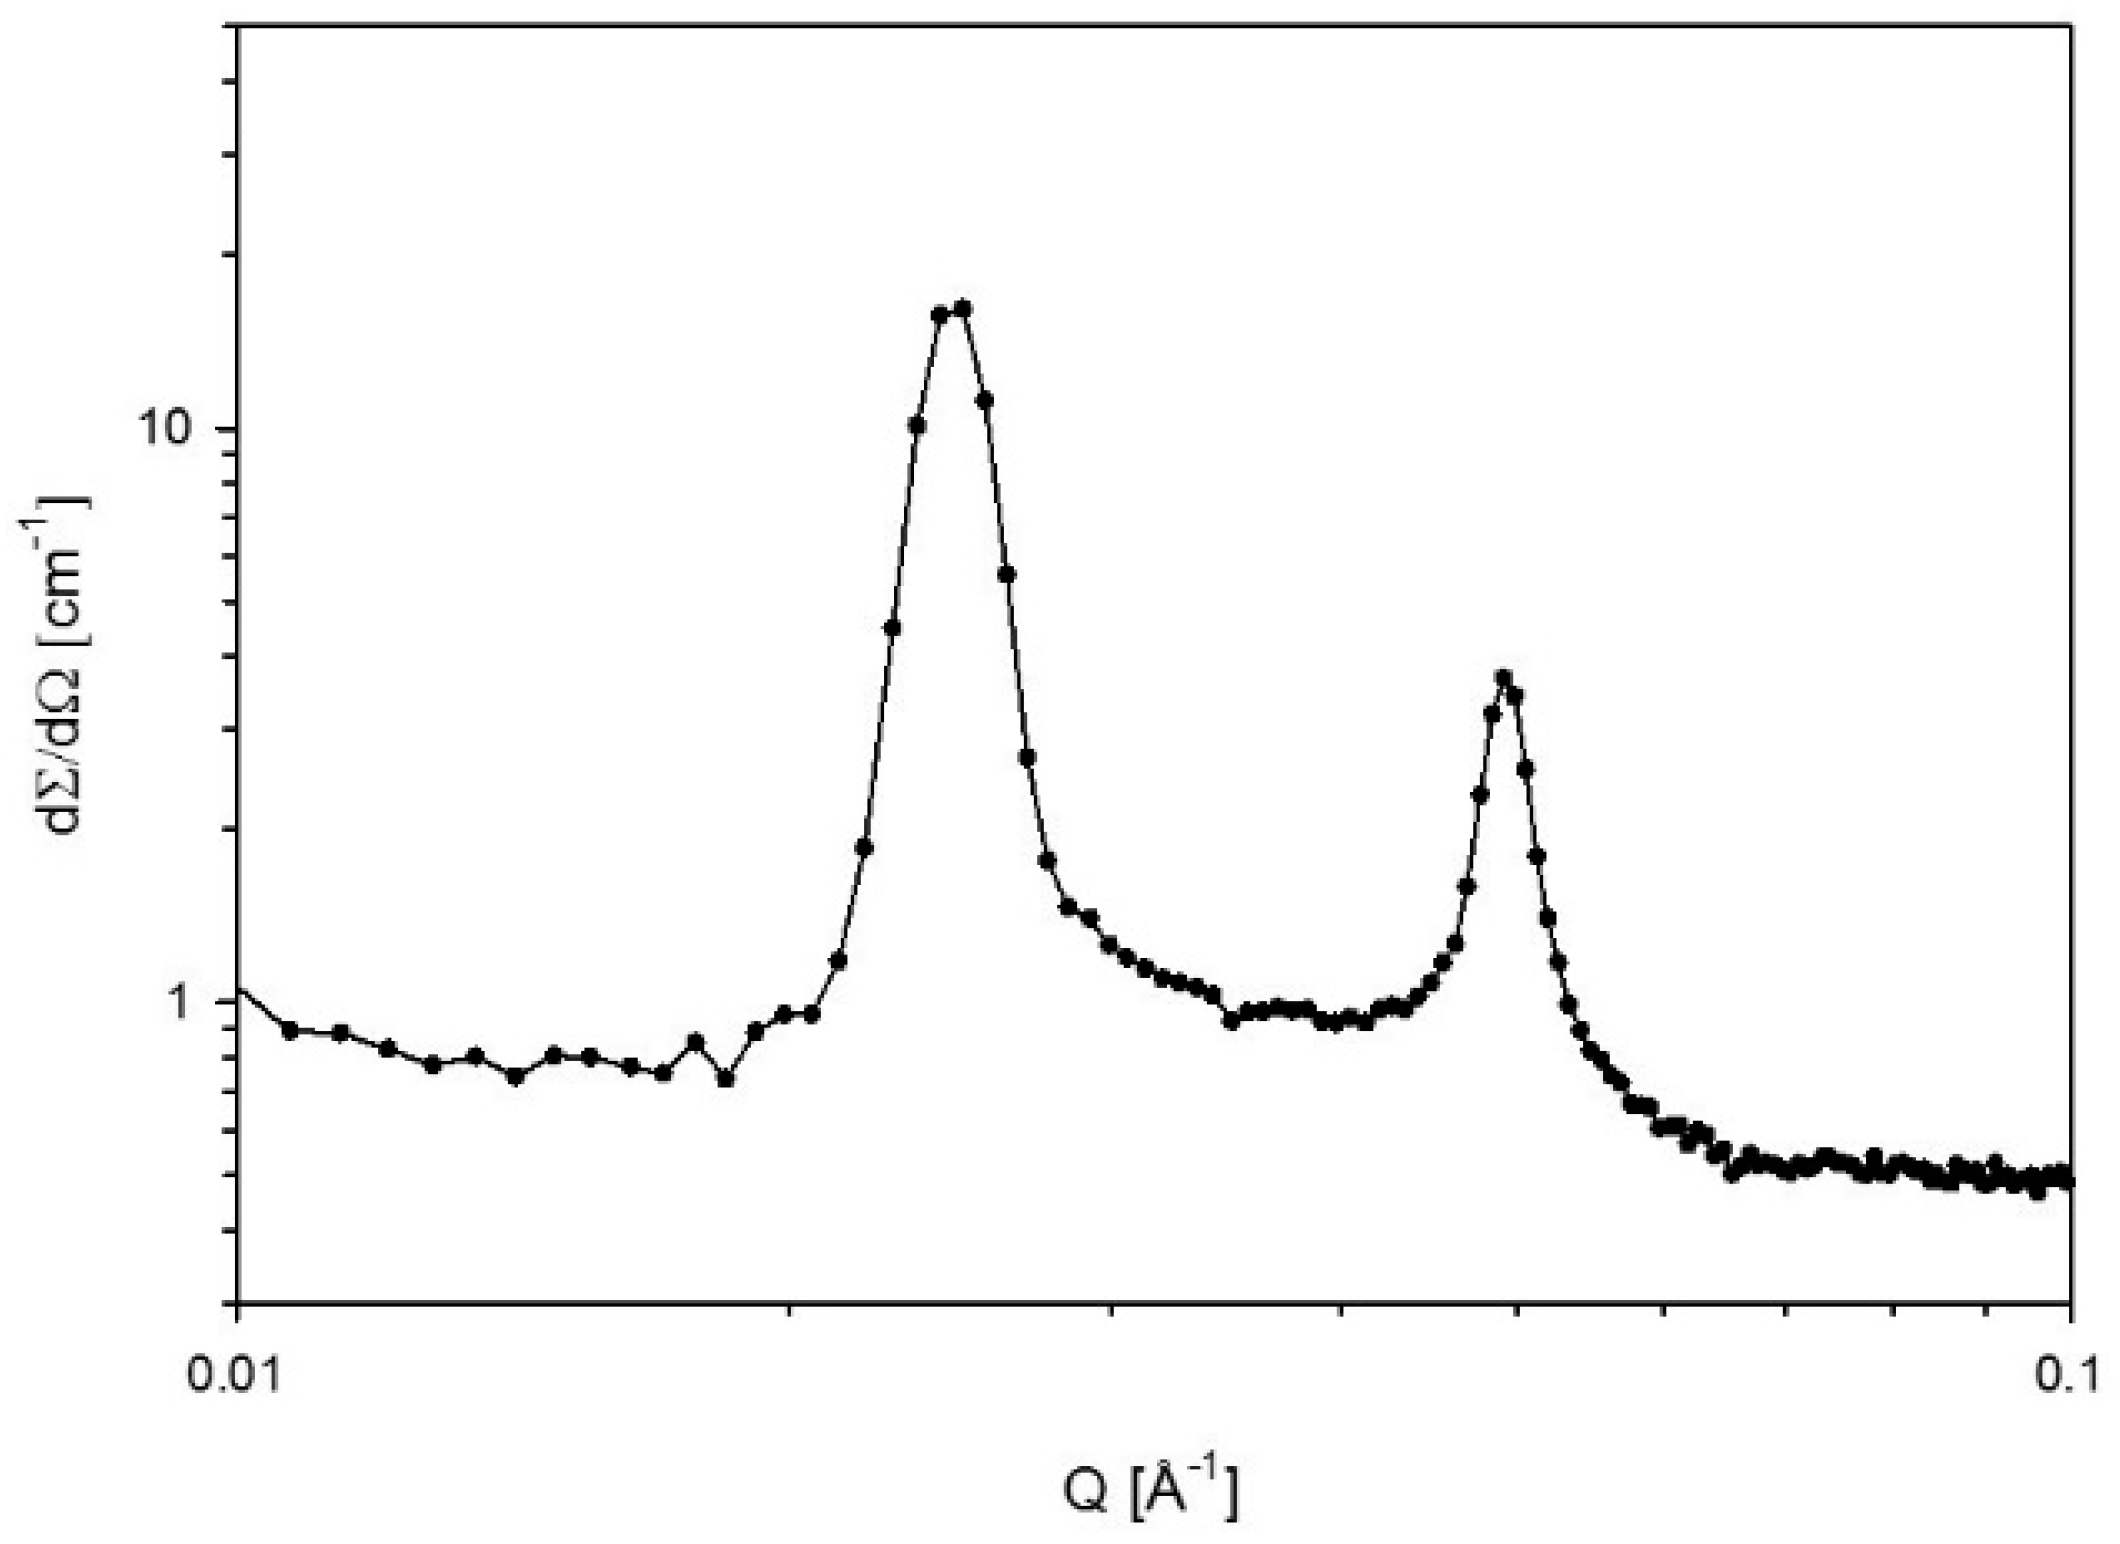
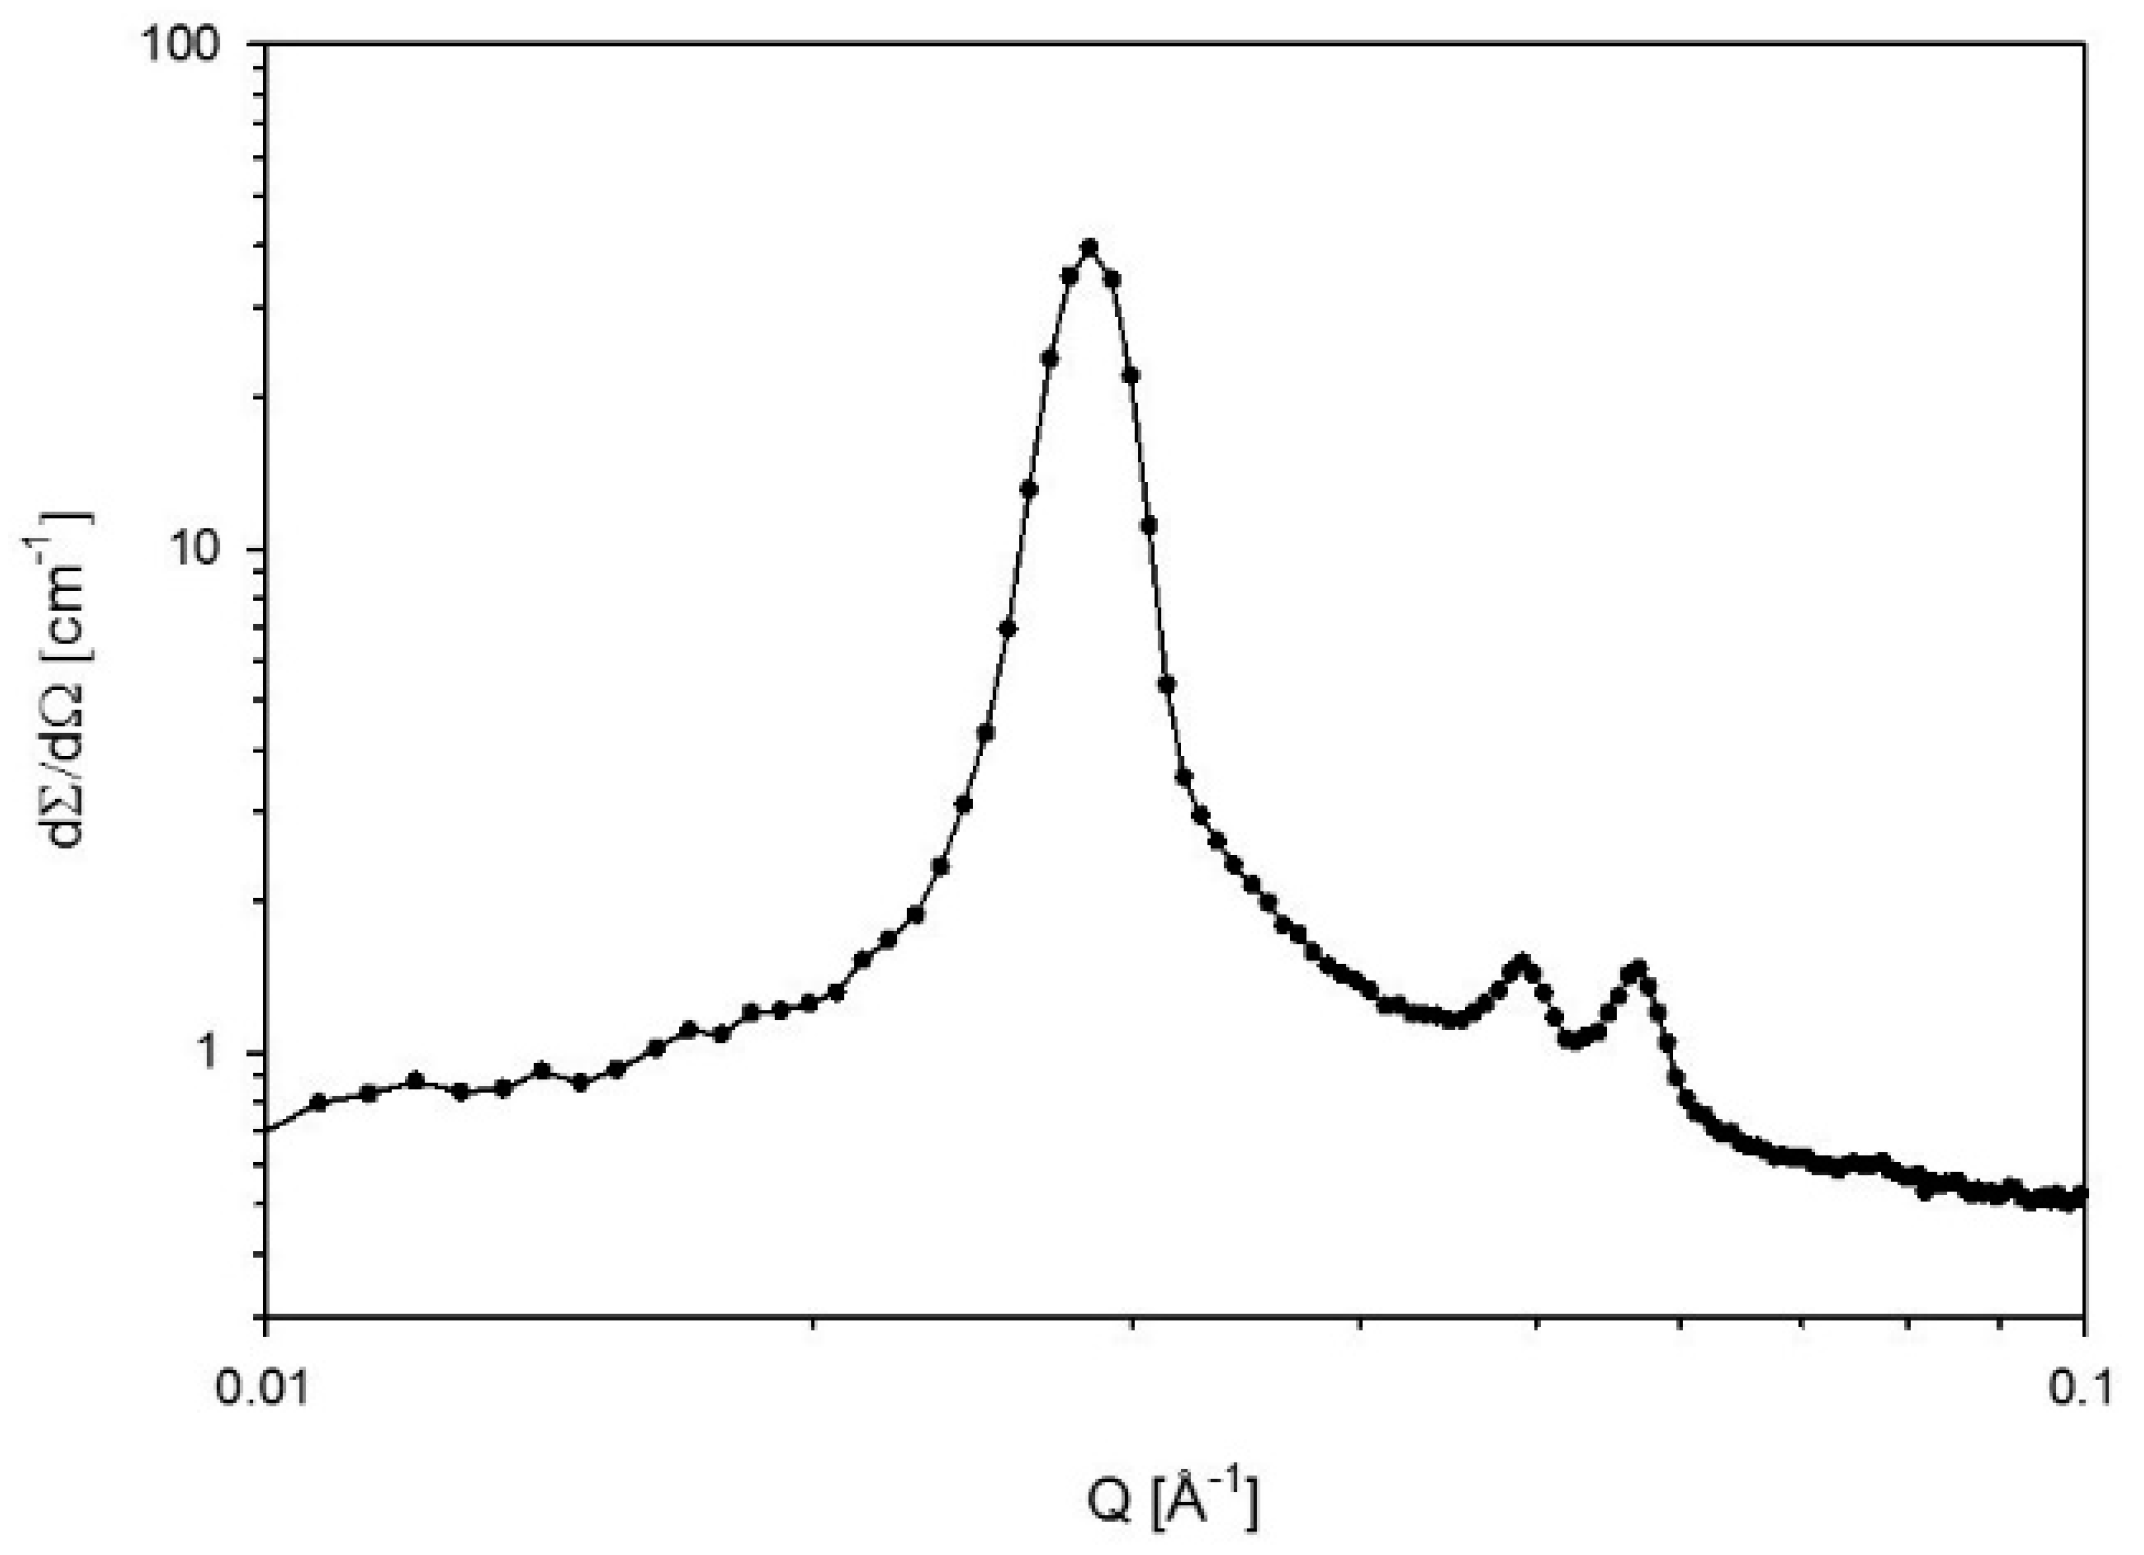
2.6. Small-Angle X-ray Scattering (SAXS)
Definition of Polar and Apolar Domains and Calculation of the Interfacial Area
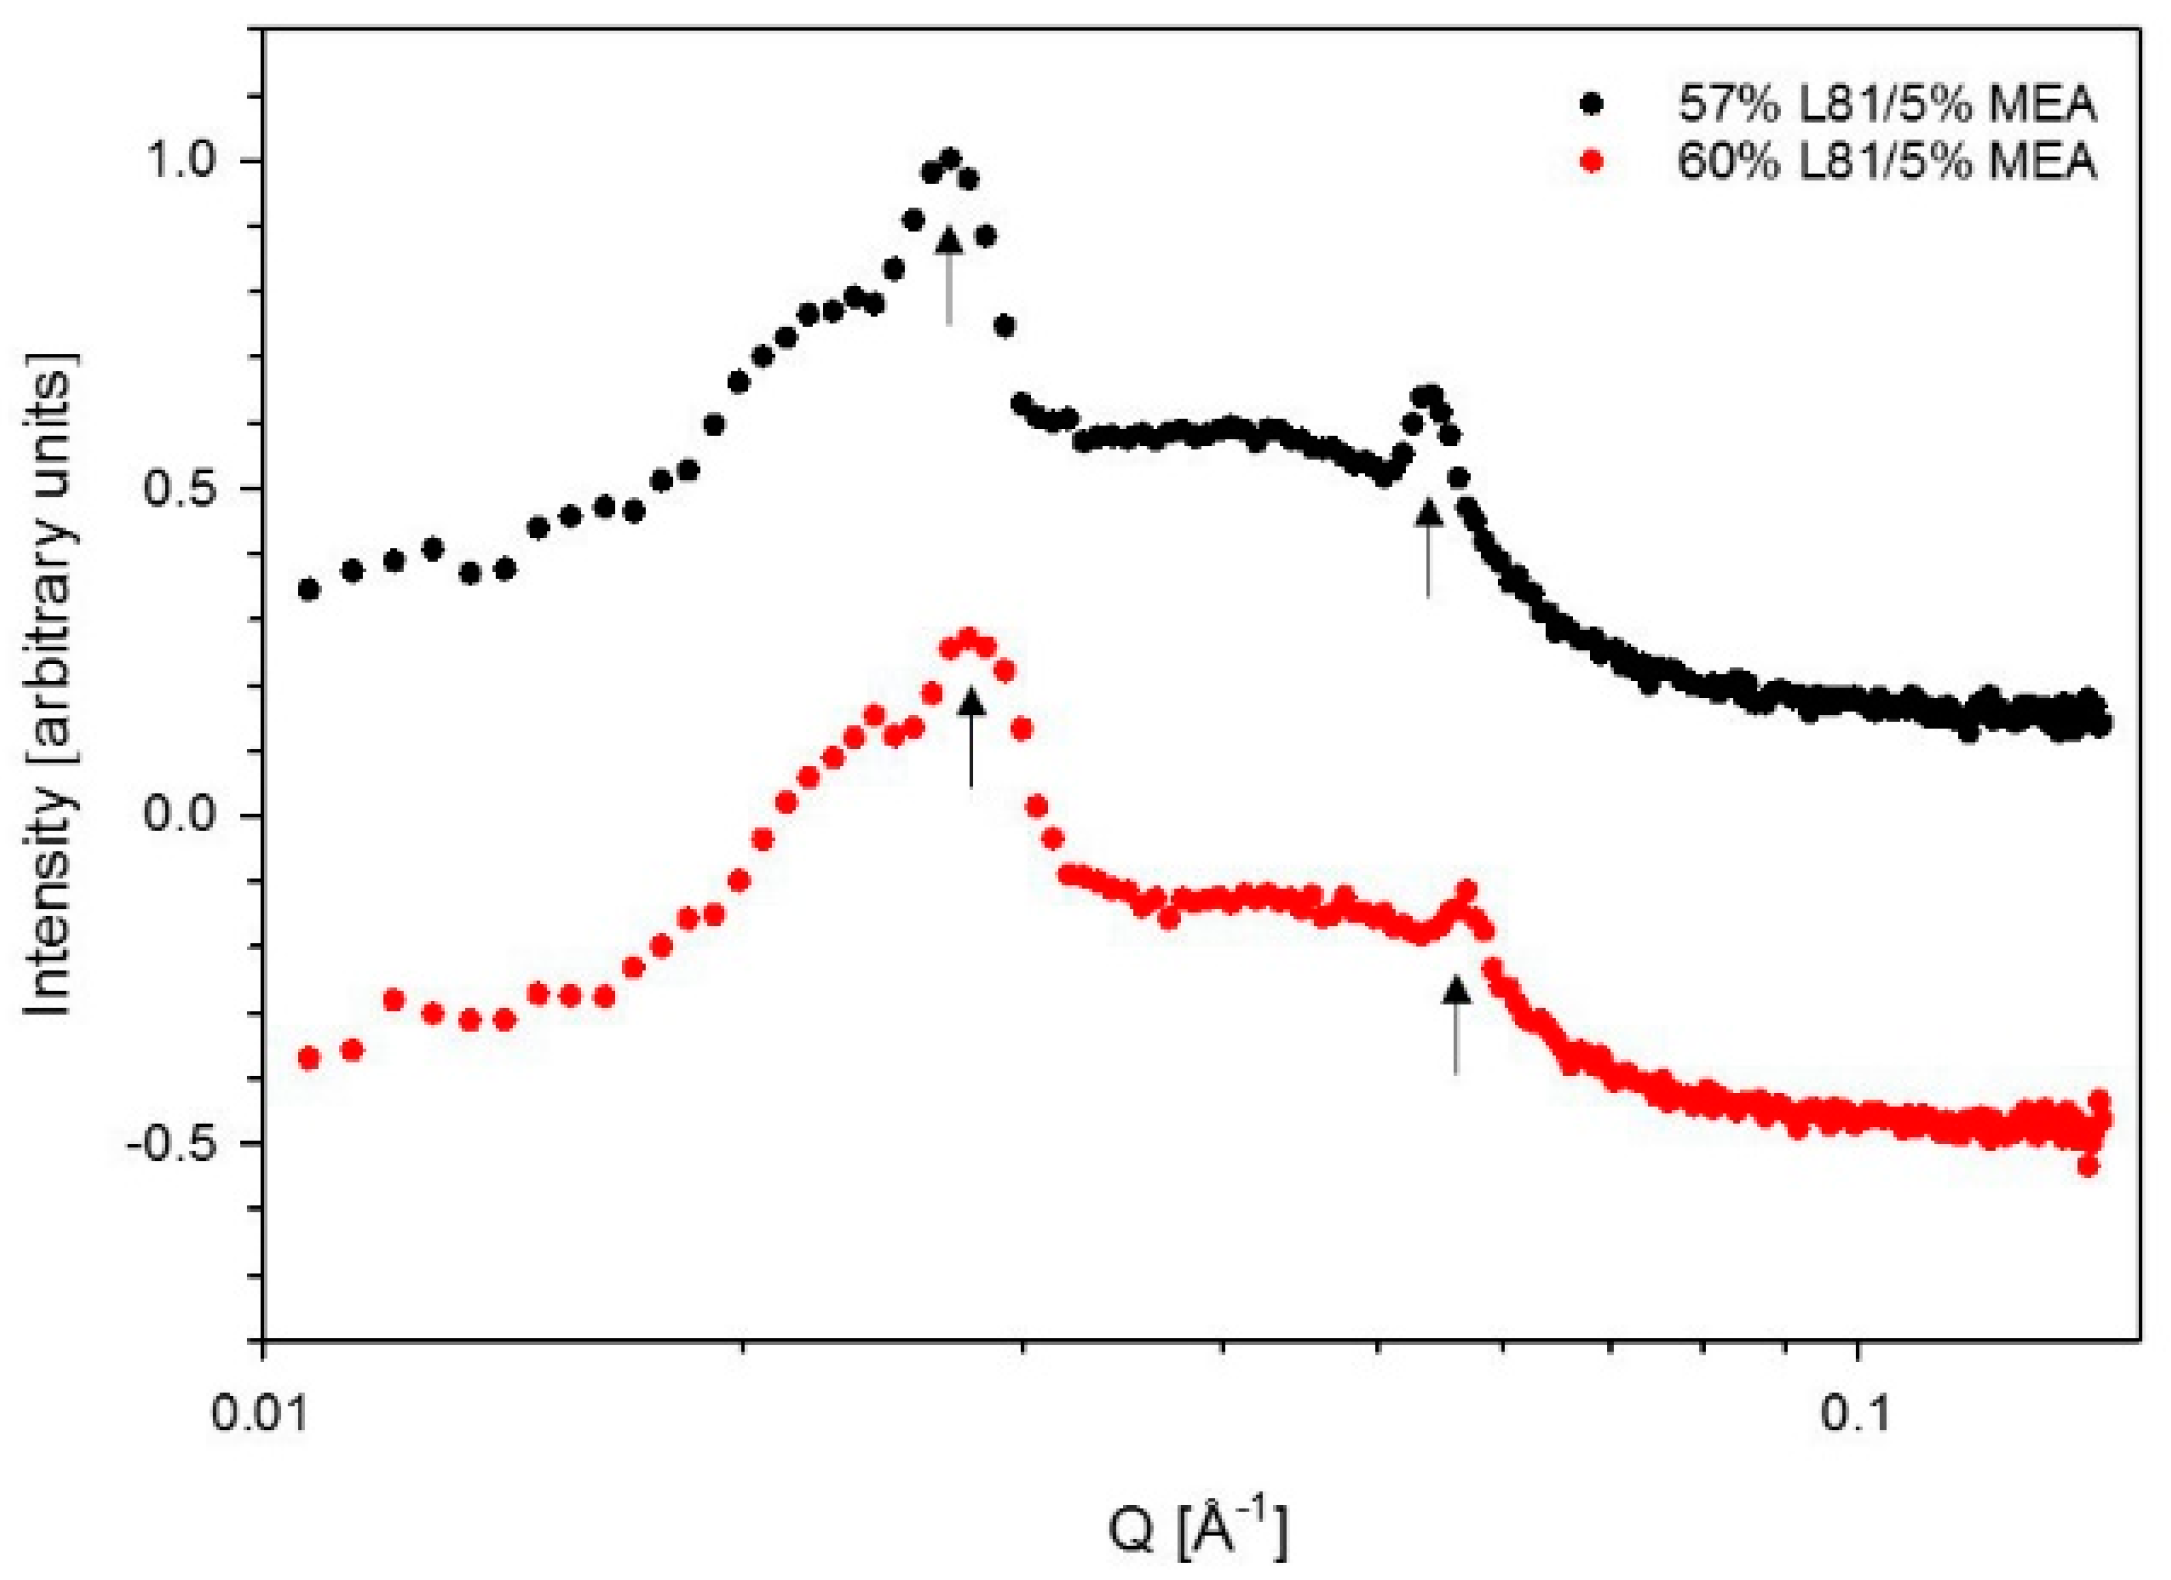
3. Results
3.1. Phase Behavior
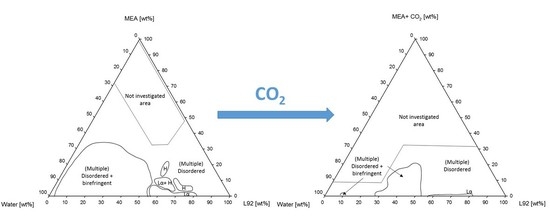
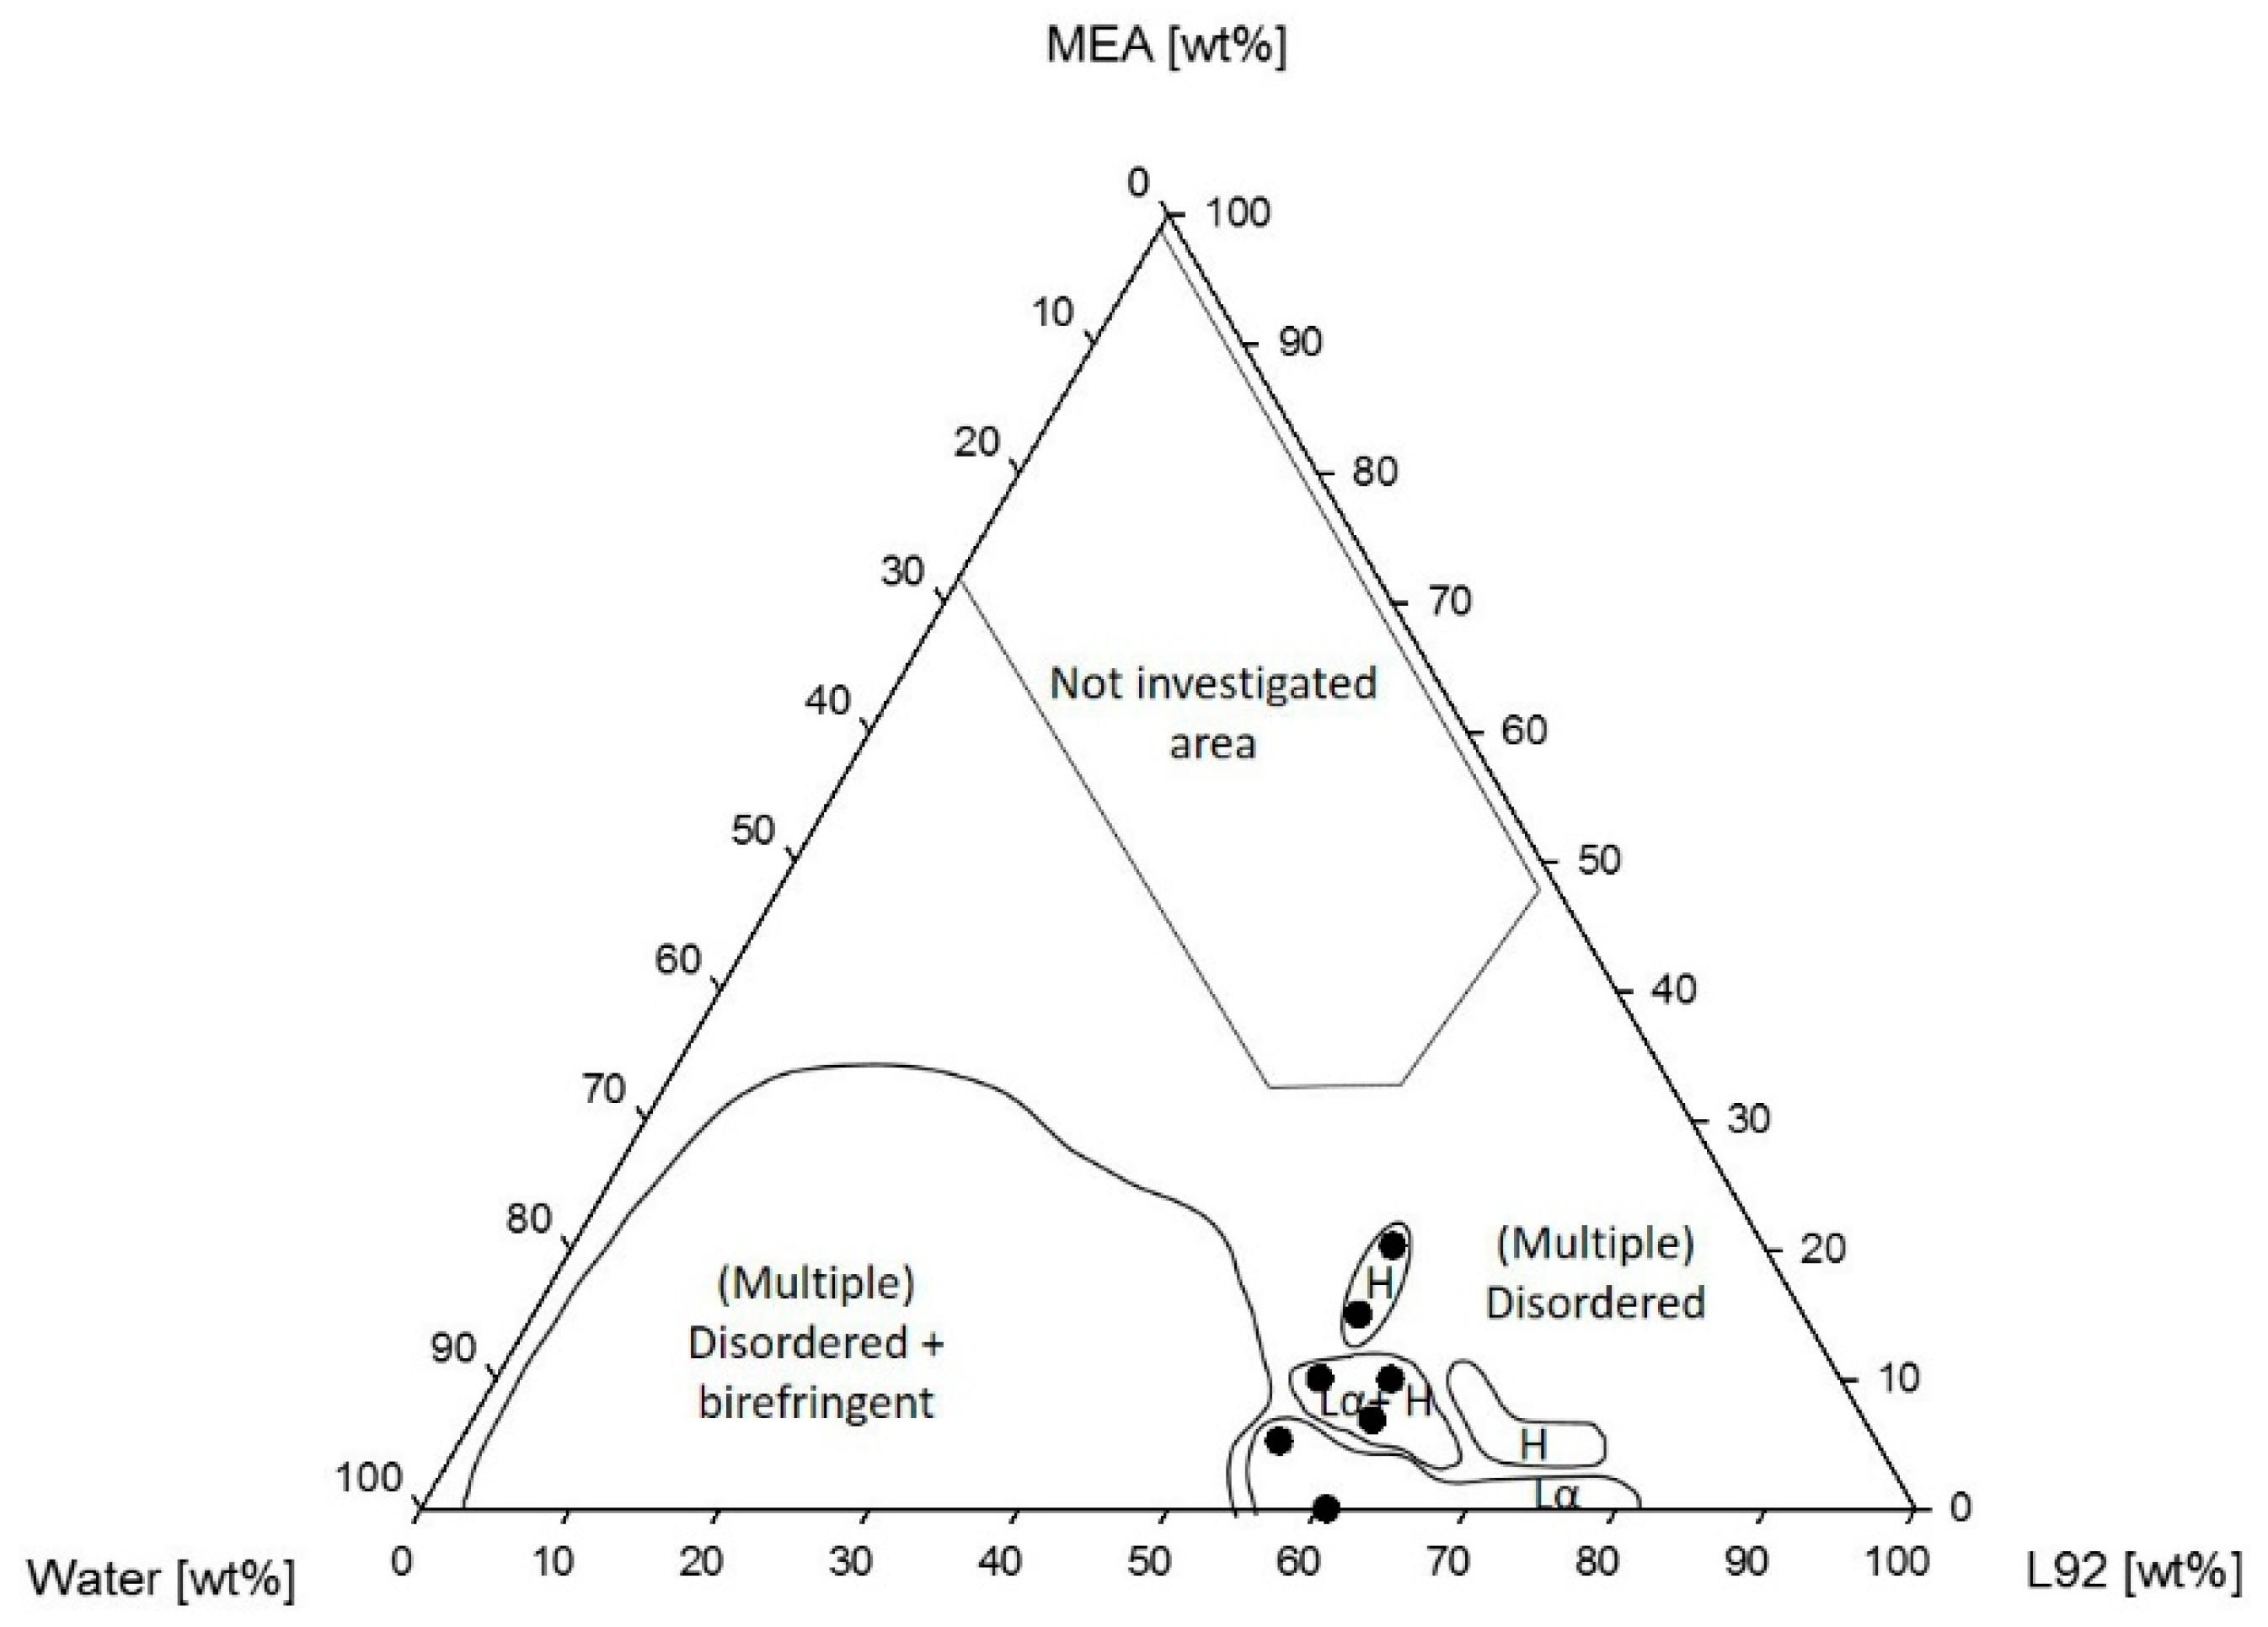
3.1.1. Phase Behavior of Pluronic L92/Water/MEA
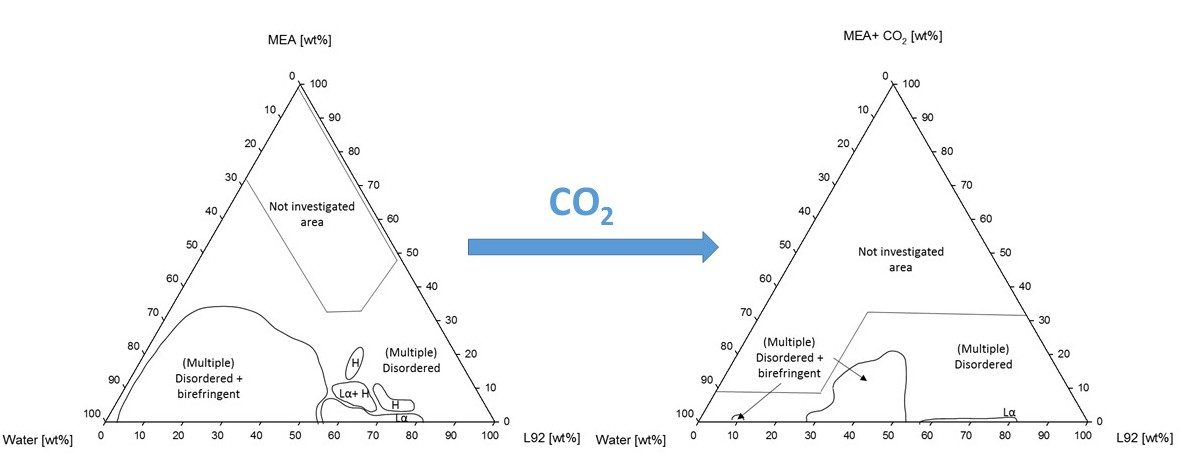
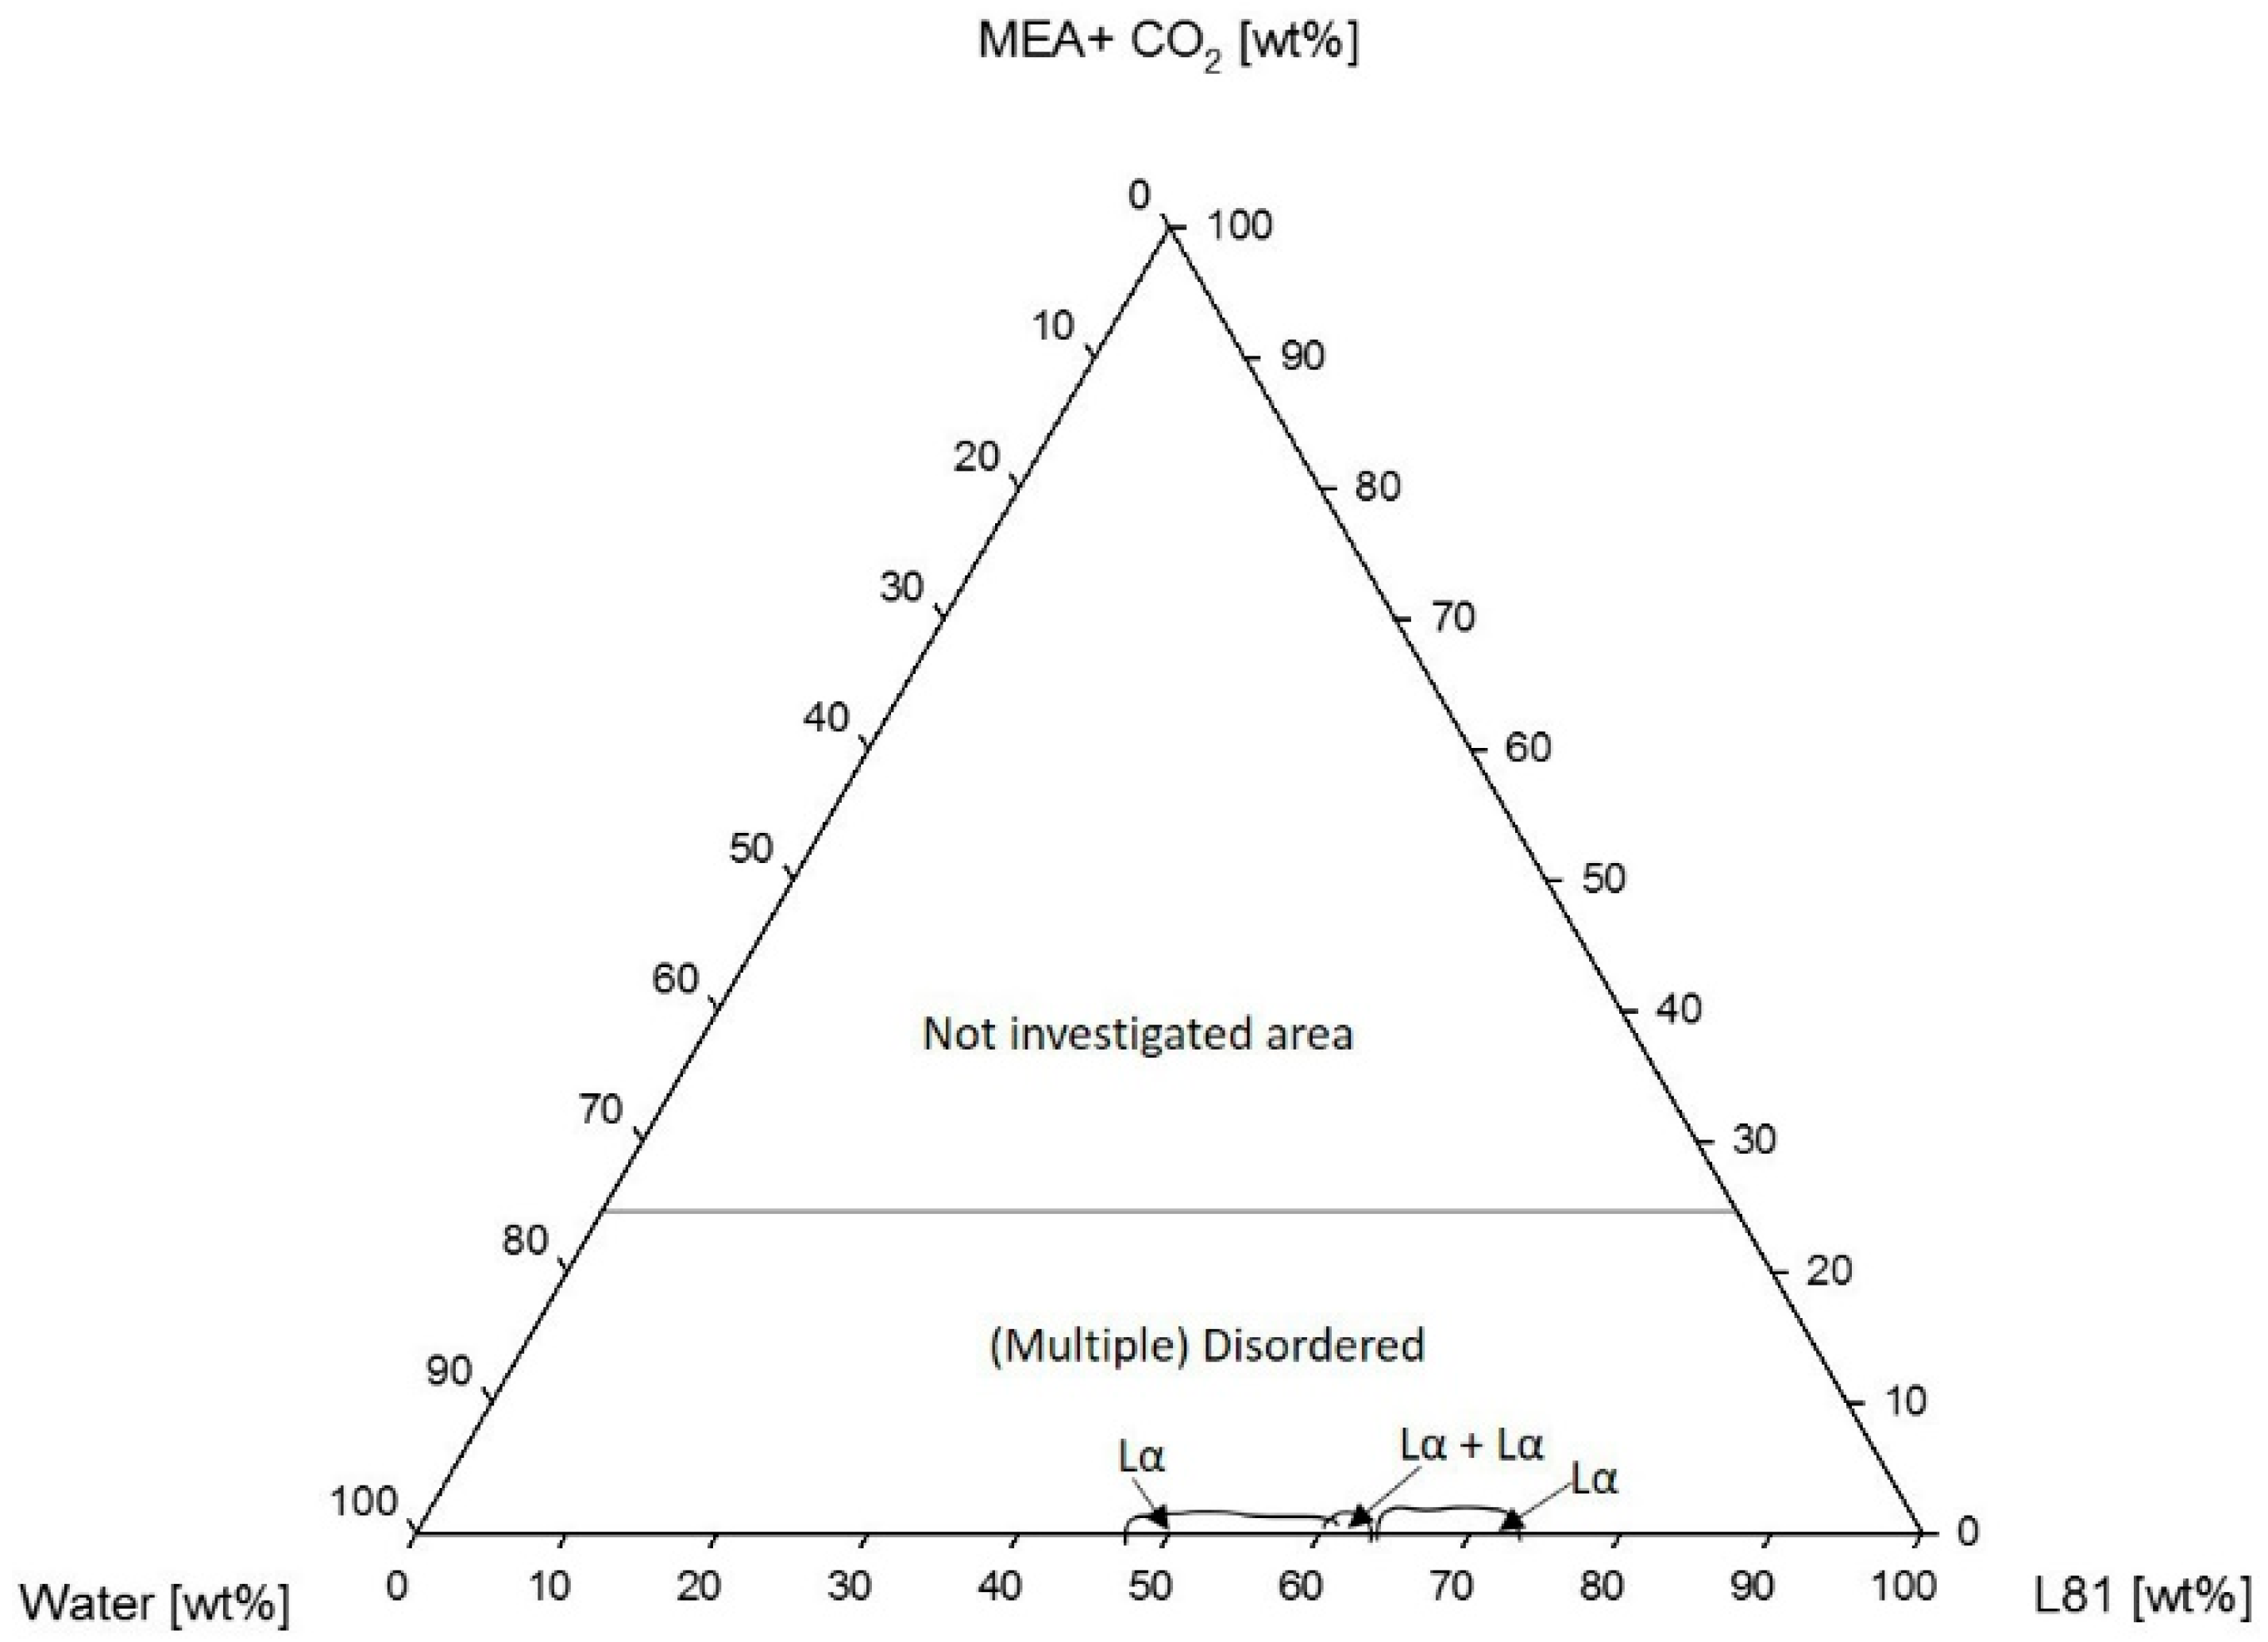
3.1.2. Phase Behavior of Pluronic L81/Water/MEA
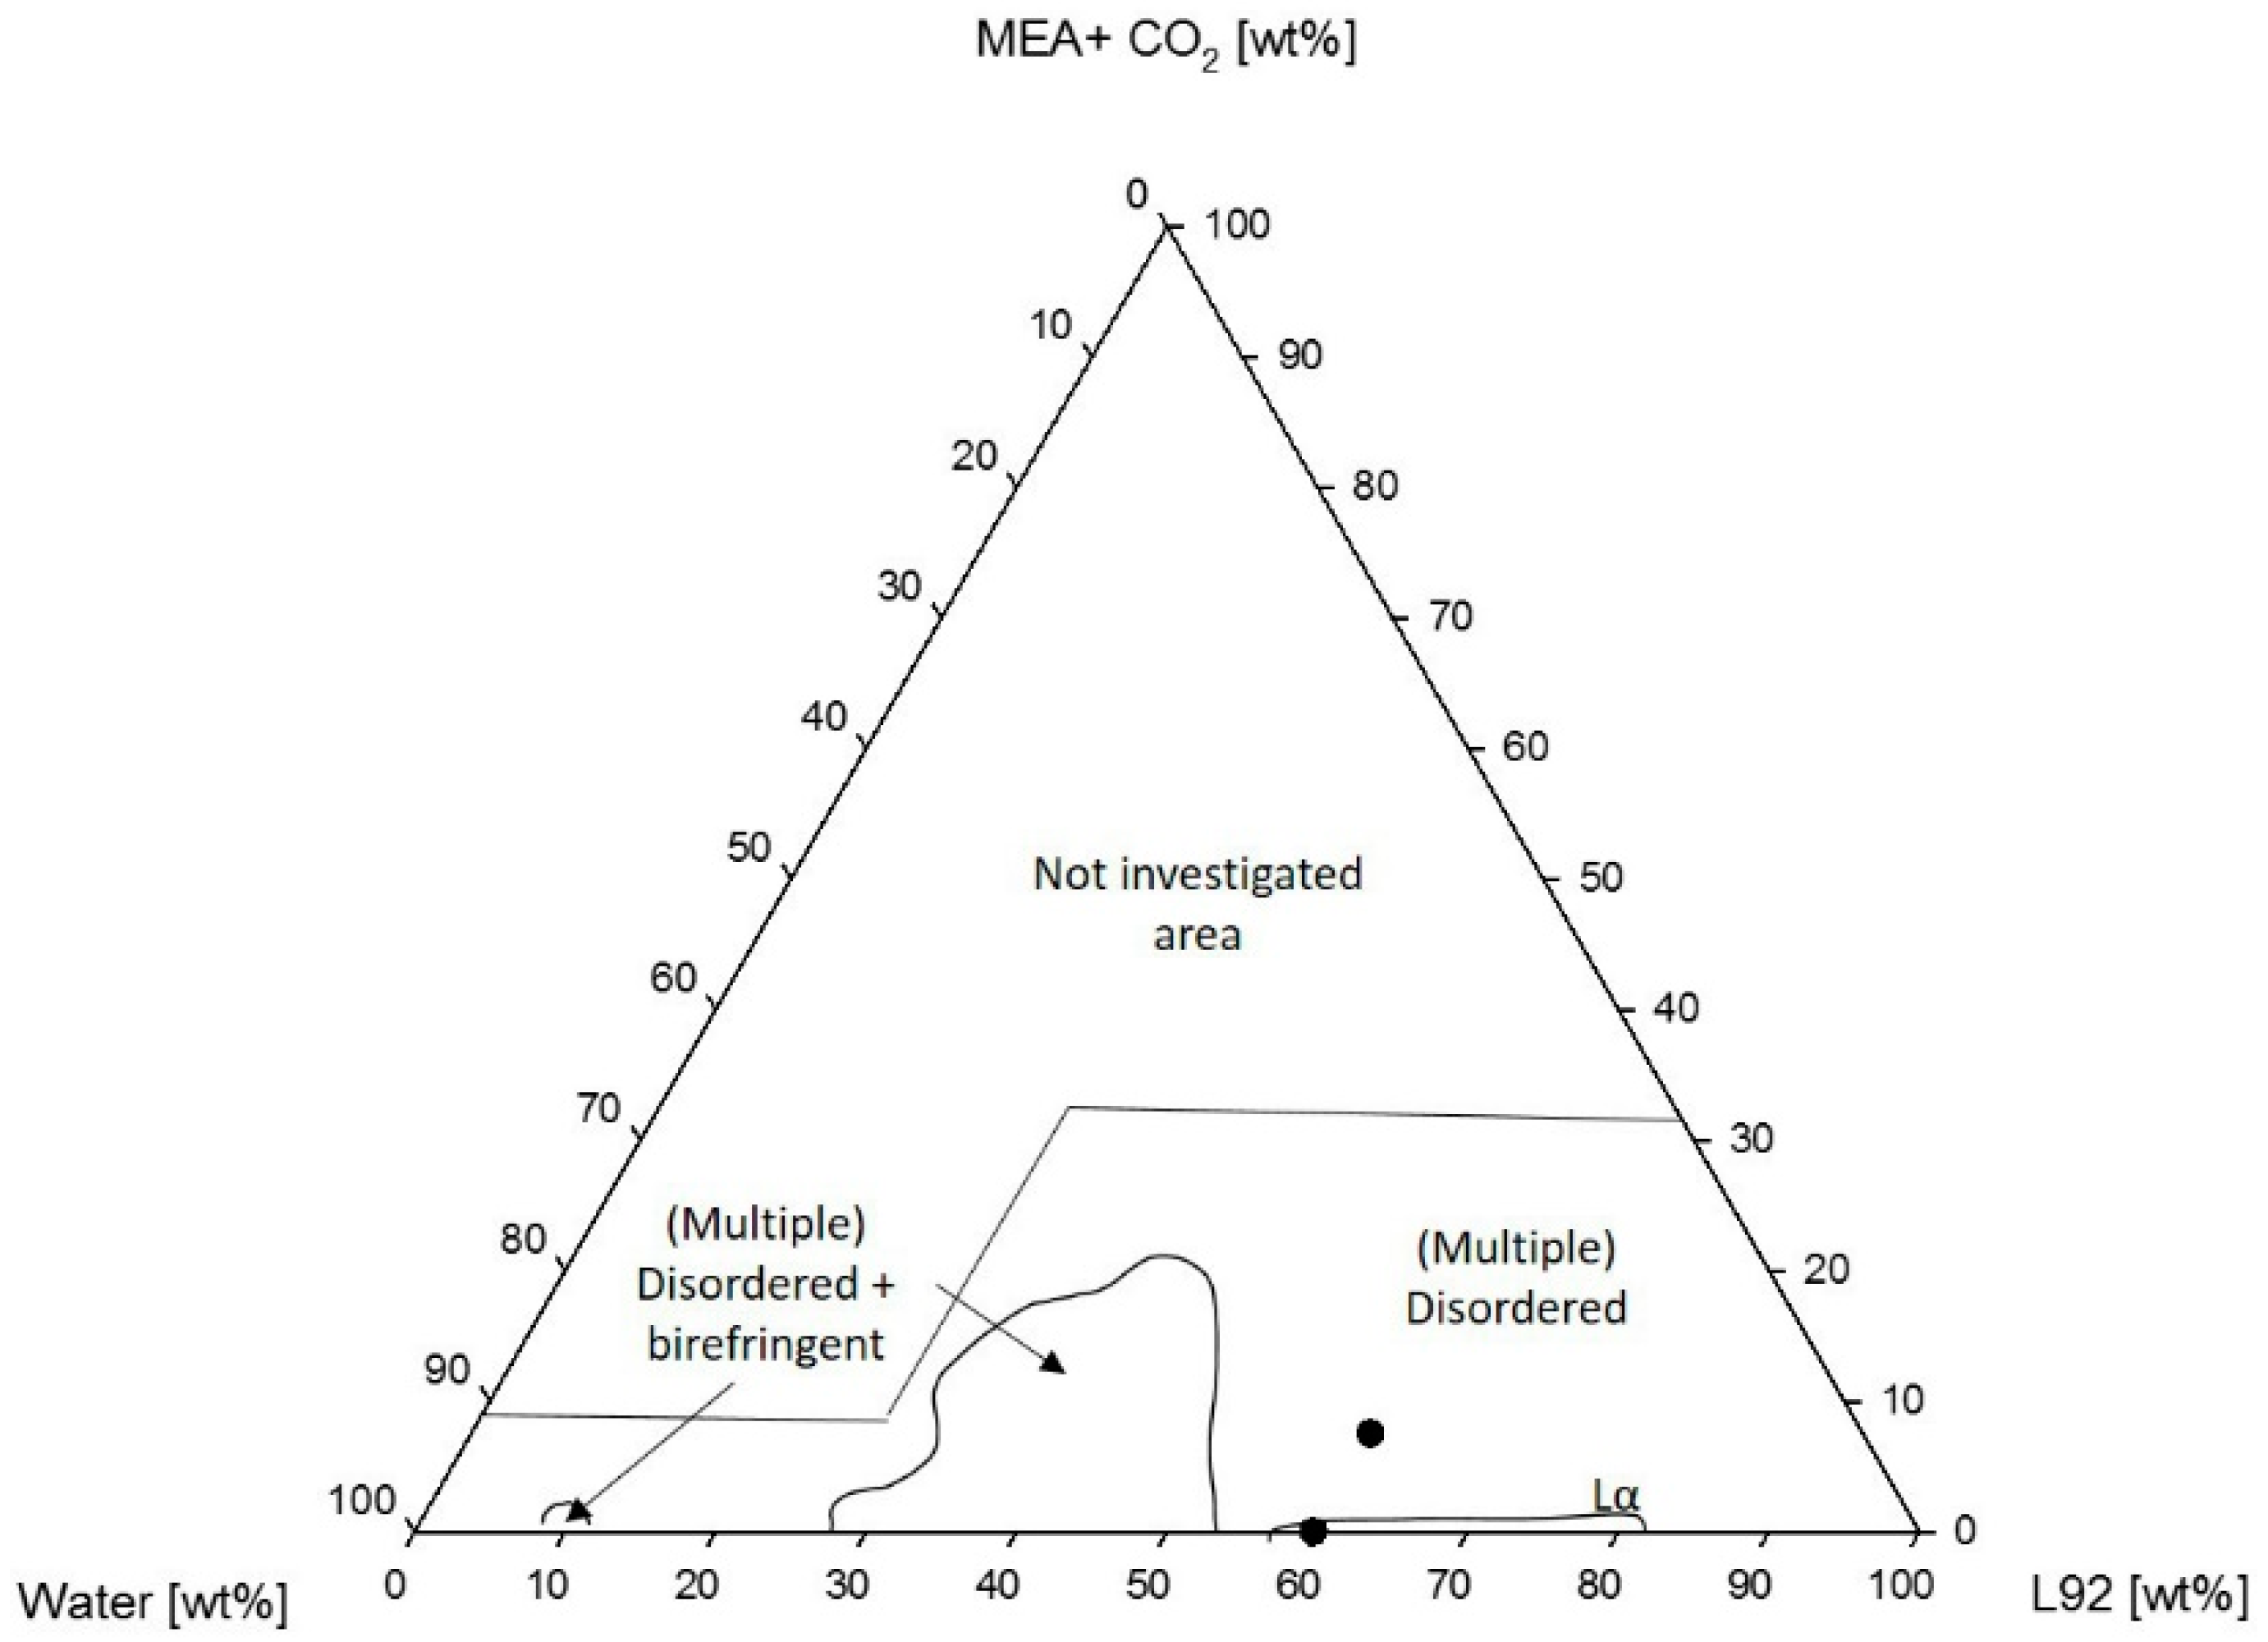
3.2. Swelling
4. Discussion
4.1. Phase Behavior
4.1.1. Phase Behavior of Pluronic L92/Water/MEA
4.1.2. Phase Behavior of Pluronic L81/Water/MEA
4.2. Swelling
5. Conclusions
Author Contributions
Funding
Acknowledgments
Conflicts of Interest
References
- Olivier, J.G.J.; Schure, K.M.; Peters, J.A.H.W. Trends in Global CO2 Emissions: 2017 Report; PBL: The Hague, The Netherlands, 2017. [Google Scholar]
- IPCC Special Report on Carbon Dioxide Capture and Storage. Prepared by Working Group III of the Intergovernmental Panel on Climate Change; Cambridge University Press: Cambridge, UK; New York, NY, USA, 2005.
- D’Alessandro, D.M.; Smit, B.; Long, J.R. Carbon Dioxide Capture: Prospects for New Materials. Angew. Chem. Int. Ed. 2010, 49, 6058–6082. [Google Scholar] [CrossRef] [PubMed]
- Wang, M.; Lawal, A.; Stephenson, P.; Sidders, J.; Ramshaw, C. Post-Combustion CO2 Capture with Chemical Absorption: A State-of-the-Art Review. Chem. Eng. Res. Des. 2011, 89, 1609–1624. [Google Scholar] [CrossRef]
- Rochelle, G.T. Amine Scrubbing for CO2 Capture. Science 2009, 325, 1652–1654. [Google Scholar] [CrossRef] [PubMed]
- Kohl, A.; Nielsen, R. Gas Purification, 5th ed.; Gulf Publishing Company: Houston, TX, USA, 1997; pp. 40–57. ISBN 0-88415-220-0. [Google Scholar]
- Gross, J.; Jansens, P.J. A Method for the Removal of a Gas from a Process Gas Stream by Means of Liquid Crystals. Patent WO 2008/147181 A1, 4 December 2008. [Google Scholar]
- De Groen, M.; Vlugt, T.J.H.; de Loos, T.W. Phase Behavior of Liquid Crystals with CO2. J. Phys. Chem. B 2012, 116, 9101–9106. [Google Scholar] [CrossRef] [PubMed]
- De Groen, M.; Matsuda, H.; Vlugt, T.J.H.; De Loos, T.W. Phase Behaviour of the System 4′-Pentyloxy-4-Cyanobiphenyl + CO2. J. Chem. Thermodyn. 2013, 59, 20–27. [Google Scholar] [CrossRef]
- De Groen, M.; Ramaker, B.C.; Vlugt, T.J.H.; de Loos, T.W. Phase Behavior of Liquid Crystal + CO2 Mixtures. J. Chem. Eng. Data 2014, 59, 1667–1672. [Google Scholar] [CrossRef]
- De Groen, M.; Vlugt, T.J.H.; de Loos, T.W. Binary and Ternary Mixtures of Liquid Crystals with CO2. AIChE J. 2015, 61, 2977–2984. [Google Scholar] [CrossRef]
- Chen, D.-S.; Hsiue, G.-H.; Schultze, J.D.; Song, B.; Springer, J. Gas Sorption Properties and Molecular States of a Liquid Crystal. Mol. Cryst. Liq. Cryst. A 1993, 237, 85–95. [Google Scholar] [CrossRef]
- Hsiue, G.-H.; Chen, D.-S.; Hsieh, C.-J. Gas Sorption Properties in a Smectic Liquid Crystal. Mol. Cryst. Liq. Cryst. A 1994, 241, 187–193. [Google Scholar] [CrossRef]
- Chen, G.-H.; Springer, J. Sorption and Diffusion of Gases in Liquid Crystalline Substances. Mol. Cryst. Liq. Cryst. A 2000, 339, 31–44. [Google Scholar] [CrossRef]
- Chen, D.-S.; Hsiue, G.-H. Gas Sorption in Side-Chain Liquid Crystalline Polymers. Polymer 1994, 35, 2808–2814. [Google Scholar] [CrossRef]
- De Groen, M.; Molet, O.M.; Vlugt, T.J.H.; De Loos, T.W. Phase Behavior of Binary Mixtures of a Liquid Crystal and Methane. J. Chem. Eng. Data 2015, 60, 2167–2171. [Google Scholar] [CrossRef]
- Coppola, L.; Oliviero, C.; Pogliani, L.; Ranieri, G.; Terenzi, M. A Self-Diffusion Study in Aqueous Solution and Lyotropic Mesophases of Amphiphilic Block Copolymers. Colloid Polym. Sci. 2000, 278, 434–442. [Google Scholar] [CrossRef]
- Zoller, U. Handbook of Detergents, Part E: Applications, 1st ed.; CRC Press: Boca Raton, FL, USA, 2009; pp. 345–362. ISBN 978-1-57444-757-6. [Google Scholar]
- Zu, S.-Z.; Han, B.-H. Aqueous Dispersion of Graphene Sheets Stabilized by Pluronic Copolymers: Formation of Supramolecular Hydrogel. J. Phys. Chem. C 2009, 113, 13651–13657. [Google Scholar] [CrossRef]
- Lee, S.; Iten, R.; Müller, M.; Spencer, N.D. Influence of Molecular Architecture on the Adsorption of Poly(Ethylene Oxide)-Poly(Propylene Oxide)-Poly(Ethylene Oxide) on PDMS Surfaces and Implications for Aqueous Lubrication. Macromolecules 2004, 37, 8349–8356. [Google Scholar] [CrossRef]
- Wulff-Pérez, M.; Torcello-Gómez, A.; Gálvez-Ruíz, M.J.; Martín-Rodríguez, A. Stability of Emulsions for Parenteral Feeding: Preparation and Characterization of O/W Nanoemulsions with Natural Oils and Pluronic F68 as Surfactant. Food Hydrocoll. 2009, 23, 1096–1102. [Google Scholar] [CrossRef]
- Svensson, M.; Alexandridis, P.; Linse, P. Phase Behavior and Microstructure in Binary Block Copolymer/Selective Solvent Systems: Experiments and Theory. Macromolecules 1999, 32, 637–645. [Google Scholar] [CrossRef]
- Noolandi, J.; Shi, A.-C.; Linse, P. Theory of Phase Behavior of Poly(Oxyethylene)-Poly(Oxypropylene)-Poly(Oxyethylene) Triblock Copolymers in Aqueous Solutions. Macromolecules 1996, 29, 5907–5919. [Google Scholar] [CrossRef]
- Alexandridis, P.; Zhou, D.; Khan, A. Lyotropic Liquid Crystallinity in Amphiphilic Block Copolymers: Temperature Effects on Phase Behavior and Structure for Poly(Ethylene Oxide)-b-Poly(Propylene Oxide)-B-Poly(Ethylene Oxide) Copolymers of Different Composition. Langmuir 1996, 12, 2690–2700. [Google Scholar] [CrossRef]
- Alexandridis, P.; Olsson, U.; Lindman, B. Self-Assembly of Amphiphilic Block Copolymers: The (EO)13(PO)30(EO)13-Water-P-Xylene System. Macromolecules 1995, 28, 7700–7710. [Google Scholar] [CrossRef]
- Alexandridis, P.; Olsson, U.; Lindman, B. A Record Nine Different Phases (Four Cubic, Two Hexagonal, and One Lamellar Lyotropic Liquid Crystalline and Two Micellar Solutions) in a Ternary Isothermal System of an Amphiphilic Block Copolymer and Selective Solvents (Water and Oil). Langmuir 1998, 14, 2627–2638. [Google Scholar] [CrossRef]
- Ivanova, R.; Lindman, B.; Alexandridis, P. Effect of Glycols on the Self-Assembly of Amphiphilic Block Copolymers in Water. 1. Phase Diagrams and Structure Identification. Langmuir 2000, 16, 3660–3675. [Google Scholar] [CrossRef]
- Ivanova, R.; Lindman, B.; Alexandridis, P. Modification of the Lyotropic Liquid Crystalline Microstructure of Amphiphilic Block Copolymers in the Presence of Cosolvents. Adv. Colloid Interface Sci. 2001, 89–90, 351–382. [Google Scholar] [CrossRef]
- Batrakova, E.; Lee, S.; Li, S.; Venne, A.; Alakhov, V.; Kabanov, A. Fundamental Relationships between the Composition of Pluronic Block Copolymers and Their Hypersensitization Effect in Mdr Cancer Cells. Pharm. Res. 1999, 16, 1373–1379. [Google Scholar] [CrossRef] [PubMed]
- Yang, Q.; Bown, M.; Ali, A.; Winkler, D.; Puxty, G.; Attalla, M. Greenhouse Gas Control Technologies 9a Carbon-13 Nmr Study of Carbon Dioxide Absorption and Desorption with Aqueous Amine Solutions. Energy Procedia 2009, 1, 955–962. [Google Scholar] [CrossRef]
- Vaidya, P.D.; Kenig, E.Y. CO2-Alkanolamine Reaction Kinetics: A Review of Recent Studies. Chem. Eng. Technol. 2007, 30, 1467–1474. [Google Scholar] [CrossRef]
- Glasscock, D.A.; Critchfield, J.E.; Rochelle, G.T. CO2 Absorption/Desorption in Mixtures of Methyldiethanolamine with Monoethanolamine or Diethanolamine. Chem. Eng. Sci. 1991, 46, 2829–2845. [Google Scholar] [CrossRef]
- Alexandridis, P.; Olsson, U.; Lindman, B. Structural Polymorphism of Amphiphilic Copolymers: Six Lyotropic Liquid Crystalline and Two Solution Phases in a Poly(Oxybutylene)-b-Poly(Oxyethylene)-Water-Xylene System. Langmuir 1997, 13, 23–34. [Google Scholar] [CrossRef]
- Samii, A.A.; Karlstrom, G.; Lindman, B. Phase Behavior of Poly(Ethylene Oxide)-Poly (Propylene Oxide) Block Copolymers in Nonaqueous Solution. Langmuir 1991, 7, 1067–1071. [Google Scholar] [CrossRef]
- Karlstrom, G.; Carlsson, A.; Lindman, B. Phase Diagrams of Nonionic Polymer-Water Systems. Experimental and Theoretical Studies of the Effects of Surfactants and Other Cosolutes. J. Phys. Chem. 1990, 94, 5005–5015. [Google Scholar] [CrossRef]
- Alexandridis, P. Structural Polymorphism of Poly(Ethylene Oxide)-Poly(Propylene Oxide) Block Copolymers in Nonaqueous Polar Solvents. Macromolecules 1998, 31, 6935–6942. [Google Scholar] [CrossRef]


| Composition | Phases | Lattice Parameters (Å) |
|---|---|---|
| 50% L81 | 1 phase: Lα | 196 |
| 55% L81 | 1 phase: Lα | 196 |
| 60% L81 | 1 phase: Lα | 188 |
| 62% L81 | 2 phases: Lα, Lα | 188, 205 |
| 65% L81 | 1 phase: Lα | 184 |
| 70% L81 | 1 phase: Lα | 173 |
| Polymer (w/w) | MEA (w/w) | 15 °C | 25 °C | 35 °C | ||||||
|---|---|---|---|---|---|---|---|---|---|---|
| Phases | a, d (Å) | ap (Å2) | Phases | a, d (Å) | ap (Å2) | Phases | a, d (Å) | ap (Å2) | ||
| 55% L92 | 5% | Lα | 252 | 86 | ||||||
| 10% | Lα + H | a = 407; d = 294 | H = 81; Lα = 73 | |||||||
| 15% | H | 340 | 68 | |||||||
| 20% | H | 269 | 100 | |||||||
| 60% L92 | 0% | Lα | 221 | 89 | ||||||
| 7% | Lα | 221 | 89 | Lα + H | a = 239; d = 300 | H = 85; Lα = 82 | H | 340 | 75 | |
| 10% | Lα | 121 | 164 | Lα + H | a = 126; d = 173 | H = 148; Lα = 157 | H | 176 | 146 | |
| 60% L92 | 7% + CO2 | Lα + Lα | 422; 465 | 47; 42 | ||||||
| 60% L81 | 0% | Lα | 188 | 80 | ||||||
| 5% | Lα | 221 | 69 | |||||||
© 2018 by the authors. Licensee MDPI, Basel, Switzerland. This article is an open access article distributed under the terms and conditions of the Creative Commons Attribution (CC BY) license (http://creativecommons.org/licenses/by/4.0/).
Share and Cite
Rodríguez-Fabià, S.; Norrman, J.; Sjöblom, J.; Paso, K. CO2 in Lyotropic Liquid Crystals: Monoethanolamine-Facilitated Uptake and Swelling. Polymers 2018, 10, 883. https://doi.org/10.3390/polym10080883
Rodríguez-Fabià S, Norrman J, Sjöblom J, Paso K. CO2 in Lyotropic Liquid Crystals: Monoethanolamine-Facilitated Uptake and Swelling. Polymers. 2018; 10(8):883. https://doi.org/10.3390/polym10080883
Chicago/Turabian StyleRodríguez-Fabià, Sandra, Jens Norrman, Johan Sjöblom, and Kristofer Paso. 2018. "CO2 in Lyotropic Liquid Crystals: Monoethanolamine-Facilitated Uptake and Swelling" Polymers 10, no. 8: 883. https://doi.org/10.3390/polym10080883
APA StyleRodríguez-Fabià, S., Norrman, J., Sjöblom, J., & Paso, K. (2018). CO2 in Lyotropic Liquid Crystals: Monoethanolamine-Facilitated Uptake and Swelling. Polymers, 10(8), 883. https://doi.org/10.3390/polym10080883