Article

Electro-Optical Switching of Dual-Frequency Nematic Liquid Crystals: Regimes of Thin and Thick Cells

UCCS Biofrontiers Center and Department of Physics, University of Colorado Colorado Springs, Colorado Springs, CO 80918, USA
*
Authors to whom correspondence should be addressed.
Crystals 2019, 9(6), 314; https://doi.org/10.3390/cryst9060314
Submission received: 29 May 2019 / Revised: 8 June 2019 / Accepted: 14 June 2019 / Published: 18 June 2019
(This article belongs to the Special Issue Advances in Nematic Liquid Crystals)

Abstract

:
Conventional display applications of liquid crystals utilize thin layers of mesogenic materials, typically less than 10 µm. However, emerging non-display applications will require thicker, i.e., greater than 100 µm, layers of liquid crystals. Although electro-optical performance of relatively thin liquid crystal cells is well-documented, little is known about the properties of thicker liquid crystal layers. In this paper, the electro-optical response of dual-frequency nematic liquid crystals is studied using a broad range (2–200 µm) of the cell thickness. Two regimes of electro-optical switching of dual-frequency nematics are observed and analyzed.

Graphical Abstract

1. Introduction

Liquid crystal (LC) materials have become cornerstones of modern devices, with applications ranging from displays [1] to adaptive optics [2] to, more recently, radio-frequency (RF) and microwave and millimeter wave frequencies (MMW) electronics [3]. Their ability to change the orientation of molecules under the action of a biasing electric field along with an anisotropy of their properties not only revolutionized the display industry but opened a new frontier in the development of tunable and reconfigurable devices for non-display applications. For such applications, both the switching time of the LC layer and the phase shift play important roles [3]. The phase shift is proportional to the thickness of the liquid crystal layer and its birefringence according to Equation (1) [4]:
Δ Φ = 2 π λ d Δ n
where ∆n—birefringence of liquid crystals, d—thickness of the liquid crystal sample and λ—wavelength of incoming wave. Therefore, a higher phase shift can be achieved by increasing the LC cell thickness or the LC birefringence.
A typical thickness of the liquid crystal layer in display applications is on the order of 5 µm. This was a major reason for a very limited range of the liquid crystal cell gaps typically utilized in experiments. Indeed, in the majority of the reported cases, this range of the liquid crystal cell gap was on the order of tens of micrometers or less [5]. Recently, advanced [6] and emerging non-display applications of liquid crystals have resulted in a growing interest to develop and study thicker cells [7]. Thick liquid crystal cells are characterized by a higher phase shift according to Equation (1). At the same time, their time response is very slow because it is a quadratic function of the cell gap [1,2,3]. To simultaneously achieve both thick and fast switching liquid crystal cells, several methods have been proposed: One is a polymer-liquid crystal composite [8,9], which allows for obtainment a rapid switching of thicker liquid crystal layers, but with the loss of phase retardation. The phase shift loss is equal to the weight percentage of the polymer in a polymer-liquid crystal composite. Also, there have been attempts to increase the birefringence of liquid crystals [10,11]. The research in this field is very active.
Another possibility that addresses the need for fast switching and high phase shifts of LC layers is the use of dual-frequency nematic liquid crystals (DFNLC) [12,13]. In regular nematic LC with positive dielectric anisotropy, the director of liquid crystal molecules in the presence of the electric field aligns parallel to its direction; those with negative dielectric anisotropy the director align perpendicular to the applied electrical field independent of the frequency of a biasing field. In contrast, in DFNLC, the dielectric anisotropy changes from a positive to negative value with the change in the frequency of the applied electric field. The frequency at which such a change of the dielectric anisotropy occurs is known as the crossover frequency. This distinctive behavior of DFNLC allows for control of the switching times of liquid crystals by changing the frequency of the biasing electric field [14].
In regular nematic liquid crystal films, turn-on time is described by the well-known Equation (2) [15]:
τ O N = γ d 2 K π 2 ( ( V V t h ) 2 1 )
And the turn-off time is given by the Equation (3):
τ O F F = γ d 2 K π 2
where V—is a driving voltage, Vth is a threshold voltage, γ is a rotational viscosity, K is an elastic constant (with single elastic constant approximation), and d is a cell gap. Equations (2) and (3) do not capture all electro-optical features, such as grayscale transitions [16]. However, they are useful for the analysis of experimental results.
As seen from Equation (3), the relaxation time (or turn-off time) depends only on the material characteristics of the liquid crystal and thickness of the cell; however, the turn-on time can be controlled and reduced by the applied voltage. In the case of dual-frequency liquid crystals, both processes can be understood as turn-on time, as seen in Equation (2). As a result, basic equations characterizing turn-on and turn-off times of dual-frequency nematics can be written as (4) and (5):
τ O N = γ d 2 K l f π 2 ( ( V l f V t h , l f ) 2 1 )
τ O F F = γ d 2 K h f π 2 ( ( V h f V t h , h f ) 2 1 )
where Vlf and Vhf are the driving voltages at low and high frequencies, Vth,lf and Vth,hf are the threshold voltages at low and high frequencies, Klf and Khf are the corresponding elastic constants. As a result of Equations (4) and (5), driving schemes, based on the voltage overdrive [17] to decrease not only the time to align the molecules to the filed but relaxation time, are commonly used for DFNLC switching. This makes dual-frequency nematic liquid crystals (DFNLC) suitable materials for applications that require high phase shift and fast switching times.
Although DFNLC are recognized as good candidates for the development of fast switching liquid crystal devices [18,19,20,21,22], their electro-optical performance over a broad range of liquid crystal layer thicknesses has not been studied. Typically, only a single value of the cell thickness has been considered. The goal of this paper was to fill this gap by analyzing the electro-optical response of dual-frequency nematics over a broad range of the cell thickness covering more than two orders of magnitude range (from 2 μm to 200 μm).

2. Materials and Methods

Measurements were conducted using a standard sandwich-like liquid crystal cell configuration with planar boundary conditions. Cells were made by spacing two indium-tin oxide (ITO) glass substrates spin-coated with polyimide (RN-1744, Nissan chemicals, Tokyo, Japan) films to align liquid crystals. Polyimide films were rubbed to provide an initial planar alignment. All cells were filled with a commercially available dual-frequency nematic liquid crystal MLC-2048 (from Merck, Darmstadt, Germany). Material parameters of the MLC-2048 are listed in the Table 1 [23]. This dual-frequency nematic was chosen because its dielectric and viscoelastic properties are well documented in existing literature [24,25].
Electro-optical measurements were performed using a standard system [26], which consisted of a He-Ne laser (632.8 nm), polarizer, analyzer, and photodetector in a straight optical arrangement. Liquid crystal cells were placed between crossed polarizer and analyzer, with an LC director set at ±45° with respect to the polarizer/analyzer’s axes, and were driven by a square wave voltage signal with modulated frequency and amplitude alternations. Voltage waveform generation, data acquisition, and analysis were performed in real time using a proprietary software developed for the electro-optical measuring system. The system is capable of measuring both time and static electro-optical response as well as performing the thickness evaluation of empty cells. Measurements of the turn-on time were performed at frequency fl = 1 kHz, below the crossover frequency fcross = 18 kHz. Measurements of the turn-off time were performed at frequency fh = 25 kHz, above the crossover frequency. The amplitude of the driving voltage was the same for both low- and high-frequency signals (Vlf = Vhf = V). Its values are shown in Table 2. These values correspond to the minimum voltage required to reorient liquid crystal molecules from a planar to a homeotropic state. All measurements were performed at room temperature (T = 292 K).

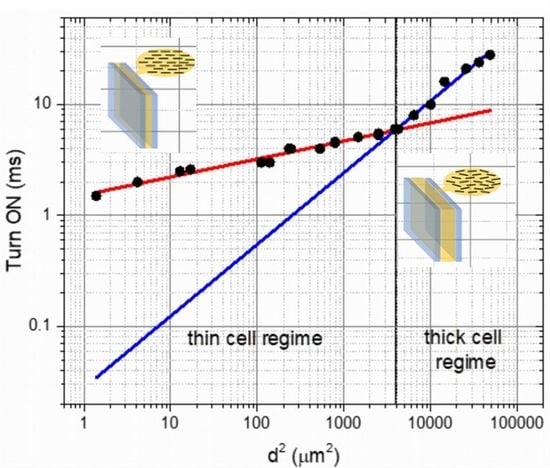
3. Results and Discussion

Initially, a low-frequency voltage was applied to liquid crystals characterized by a positive sign of their dielectric anisotropy (Δɛ > 0 if f < fcross), as seen (Table 1). As a result, liquid crystal molecules were reoriented from a planar to homeotropic state; in other words, the director changed its orientation along the applied electrical field. Subsequently, a high-frequency voltage was applied; because of the negative sign of the dielectric anisotropy (Δɛ < 0 if f > fcross), as seen in Table 1, liquid crystal molecules changed their orientation back to their initial planar alignment. An example of the modulated waveform (driving voltage) and the observed electro-optical response of the liquid crystal cell is shown in Figure 1. According to Figure 1, the magnitude of the turn-on time and turn-off time is nearly the same, on the order of several milliseconds.
Data similar to that shown in Figure 1 were obtained for liquid crystal cells characterized by different values of their thickness (from 2 µm to 200 µm). The dependence of the measured turn-on time on the cell thickness squared is shown in Figure 2a. A striking feature of the observed dependence was the existence of the two regimes accounting for thin and thick cells, as seen in Figure 2a. The existence of these two regimes is clearly seen in Figure 2. The slope of the curve corresponding to a thick cell regime is greater than that corresponding to a thin cell regime, as seen in Figure 2a.
In the case of MLC-2048 dual-frequency nematics, the thin cell regime was detected for the range of cell gaps below 60 µm. Cells thicker than 60 µm exhibited a thick-cell regime characterized by a greater slope of the measured curve, as seen in Figure 2a. The observed different slopes of curves that corresponded to two different regimes (thin cell regime and thick cell regime) can be understood by analyzing Equation (4). Physical parameters entering Equation (4), such as rotational viscosity and elastic constant, depend on the average orientational order of liquid crystal molecules. One might assume that a degree of the orientational order is higher in the case of thin cells when compared with the same quantity for thicker cells. By applying Equation (4) to the measured values of the turn on time, a ratio of the rotational viscosity to the elastic constant, γ/K, can be calculated, as seen in Figure 2b. The ratio of the rotational viscosity to the elastic constant was not the same for thin and thick cells. This ratio was a decreasing function of the cell gap for a thin cell regime and nearly constant in the case of a thick cell regime, as seen in Figure 2b. As a result, the slope of curves shown in Figure 2a and corresponding to two different regimes is not the same.
Optical absorbance measurements were also performed to test our assumption that the observed two regimes of electro-optical switching (turn-on time) originate from a different degree of the average orientational order of liquid crystal molecules in thin and thick cells. A quasi-monochromatic UV light with a central wavelength around 405 nm was utilized. The polarization of light was either parallel or perpendicular to the liquid crystal director.
Figure 3a demonstrates the asymptotical behavior of the absorbance as a function of the cell thickness for the UV light-polarized parallel and perpendicular to the liquid crystal director. We can differentiate between two different types of the optical absorbance behavior corresponding to thin and thick cell regimes. The measured optical absorbance of the studied thin and thick cells shown in Figure 3a indicate a greater value of an average degree of the orientational order in thin cells in comparison with the value in thick cells. Although a well-pronounced anisotropy of the measured optical absorbance was observed (AII > A) in thin cells, as seen in Figure 3a, this anisotropy gradually approached zero for thick-enough cells. Both AII and A approached an average value <A>, shown as dotted curve in Figure 3a. Data shown in Figure 3a can be used to estimate an effective value of the optical absorbance dichroic ratio (a ratio AII/A) for thin and thick cells as seen in Figure 3b. As expected, thin cells are characterized by higher values of this parameter in comparison with that of thick cells, indicating a greater magnitude of the degree of the orientational order of liquid crystal molecules in thinner cells [27,28].
The measured turn-off time exhibited the same behaviour over an entire range of the studied cell thicknesses, as seen in Figure 4. With regard to turn-off time, both thin and thick cells behaved similar to a thin-cell regime, as seen in Figure 2a. An inset in Figure 4 clearly indicates this similarity. The computed relative ratio of the rotational viscosity to the elastic constant shown in the inset of Figure 4 is analogous to that shown in Figure 2b for a thin-cell regime. The observed behaviour can be understood in the following way. Initially all molecules are in a homeotropic state imposed by the electric field oscillating at a frequency f < fcross. In this case, the external electric field imposes an additional orientational ordering of liquid crystal molecules along the field. When the frequency of the applied electric field changes (f > fcross), the sign of the dielectric anisotropy changes, resulting in the reorientation of liquid crystal molecules from a homeotropic to a planar state. Because the degree of the orientational order is enhanced by the external electric field, the turn-off time is described by a single regime, as seen in Figure 4.

4. Conclusions

The presented results, as seen in Figure 1, Figure 2, Figure 3 and Figure 4, have important practical implications. Advanced liquid crystal devices will rely on fast-switching materials capable of producing a large phase shift. Although the use of relatively thick dual-frequency nematics seems to be a trivial solution to achieve both large values of the phase shift and a relatively fast switching time, the existence of two switching regimes shown in Figure 2 is noteworthy. An average degree of the orientational order in thicker liquid crystal cells gets smaller, resulting in a slower response time than expected. Therefore, the existence of two regimes should be considered in the design of liquid crystal devices utilizing thick layers of nematics. Data shown in Figure 4 suggest that an external biasing field can impose the orientational ordering over a broad range of the cell thickness (a single regime). This finding suggests possible improvements in the device speed by implementing additional aligning (biasing) field to achieve a faster switching speed.

Author Contributions

D.B.-B. designed experiments and measuring tools. O.M. performed all measurements. Y.G. and A.G. supervised the project. O.M., Y.G. and A.G. wrote the paper. All co-authors discussed the obtained results and read the paper.

Funding

O.M. and Y.G. were supported by the UCCS Biofrontiers Center.

Acknowledgments

The authors would like to acknowledge support provided by the UCCS BioFrontiers Center at the University of Colorado: Colorado Springs.

Conflicts of Interest

The authors declare no conflict of interest.

References

  1. Castellano, J.A. Liquid crystal display applications past, present & future. Liq. Cryst. Today 1991, 1, 4–6. [Google Scholar]
  2. Arines, J. Impact of liquid crystals in active and adaptive optics. Materials 2009, 2, 549–561. [Google Scholar] [CrossRef]
  3. Camley, R.; Celinski, Z.; Garbovskiy, Y.; Glushchenko, A. Liquid crystals for signal processing applications in themicrowave andmillimeter wave frequency ranges. Liq. Cryst. Rev. 2018, 6, 17–52. [Google Scholar] [CrossRef]
  4. Khoo, I.-C. Liquid Crystals; Wiley & Sons Inc.: Hoboken, NJ, USA, 2007; p. 368. [Google Scholar]
  5. Nie, X.; Lu, R.; Xianyu, H.; Wu, T.X.; Wu, S.T. Anchoring energy and cell gap effects on liquid crystal response time. J. Appl. Phys. 2007, 101, 103110. [Google Scholar] [CrossRef] [Green Version]
  6. He, Z.; Gou, F.; Chen, R.; Yin, K.; Zhan, T.; Wu, S.-T. Liquid Crystal Beam Steering Devices: Principles, Recent Advances, and Future Developments. Crystals 2019, 9, 292. [Google Scholar] [CrossRef]
  7. Di Pietro, V.M.; Residori, S.; Bortolozzo, U.; Jullien, A.; Forget, N. Dynamical optical response of nematic liquid crystal cells through electrically driven Fréedericksz transition: Influence of the nematic layer thickness. Opt. Express 2018, 26, 10716–10728. [Google Scholar] [CrossRef]
  8. Mucha, M.; Nastal, E. Complex study of reorientational dynamics of the liquid crystal in PDLC films. Liq. Cryst. 1997, 23, 749–758. [Google Scholar] [CrossRef]
  9. Melnyk, O.; Garbovskiy, Y.; Glushchenko, A. Science and technology of stressed liquid crystals: Display and non-display applications. Phase Transit. 2017, 90, 773–779. [Google Scholar] [CrossRef]
  10. Wen, C.-H. High Birefringence and Low Viscosity Liquid Crystals. Ph.D. Thesis, University of Central Florida, Orlando, FL, USA, 2006; p. 148. [Google Scholar]
  11. Dąbrowski, R.; Kula, P.; Herman, J. High Birefringence Liquid Crystals. Crystals 2013, 3, 443–482. [Google Scholar] [CrossRef]
  12. Xianyu, H.; Wu, S.T.; Lin, C.L. Dual frequency liquid crystals: A review. Liq. Cryst. 2009, 36, 717–726. [Google Scholar] [CrossRef]
  13. Mrukiewicz, M.; Perkowski, P.; Piecek, W.; Mazur, R.; Chojnowska, O.; Garbat, K. Two-step switching in dual-frequency nematic liquid crystal mixtures. J. Appl. Phys. 2015, 118, 173104. [Google Scholar] [CrossRef]
  14. Pianelli, A.; Parka, J.; Perkowski, P.; Caputo, R.; Otón, E.; Mrukiewicz, M.; Mazur, R.; Sielezin, K.; Garbat, K. Investigations of dual-frequency nematic liquid crystals doped with dichroic dye. Liq. Cryst. 2018, 1–12. [Google Scholar] [CrossRef]
  15. Oh-e, M.; Kondo, K. Response mechanism of nematic liquid crystals using the in-plane switching mode. Appl. Phys. Lett. 1996, 69, 623–625. [Google Scholar] [CrossRef]
  16. Wu, S.T. Design of a liquid crystal based tunable electrooptic filter. Appl. Opt. 1989, 28, 48–52. [Google Scholar] [CrossRef] [PubMed]
  17. Wu, S.T.; Wu, C.S. High-speed liquid-crystal modulators using transient nematic effect. J. Appl. Phys. 1989, 65, 527–532. [Google Scholar] [CrossRef]
  18. Yu, J.-P.; Chen, S.; Fan, F.; Cheng, J.-R.; Xu, S.-T.; Wang, X.-H.; Chang, S.-J. Tunable terahertz wave-plate based on dual-frequency liquid crystal controlled by alternating electric field. Opt. Express 2018, 26, 663–673. [Google Scholar] [CrossRef] [PubMed]
  19. Duan, W.; Chen, P.; Ge, S.-J.; Liang, X.; Hu, W. A Fast-Response and Helicity-Dependent Lens Enabled by Micro-Patterned Dual-Frequency Liquid Crystals. Crystals 2019, 9, 111. [Google Scholar] [CrossRef]
  20. Li, B.-X.; Xiao, R.-L.; Paladugu, S.; Shiyanovskii, S.V.; Lavrentovich, O.D. Dye-doped dual-frequency nematic cells as fast-switching polarization-independent shutters. Opt. Express 2019, 27, 3861–3866. [Google Scholar] [CrossRef] [Green Version]
  21. Mrukiewicz, M.; Perkowski, P.; Garbat, K.; Dabrowski, R.; Parka, J. Dielectric properties of compounds creating dual frequency nematic liquid crystals. Acta Phys. Pol. A 2013, 124, 940–945. [Google Scholar] [CrossRef]
  22. Bennis, N.; Herman, J.; Kalbarczyk, A.; Kula, P.; Jaroszewicz, L.R. Multifrequency driven nematics. Crystals 2019, 9, 275. [Google Scholar] [CrossRef]
  23. Li, Y.W.; Kwok, H.S. Bistable twisted-bend and twisted-nematic liquid crystal display. Appl. Phys. Lett. 2009, 95, 2009–2011. [Google Scholar] [CrossRef]
  24. Yin, Y. Dielectric Relaxation and Electro-Optical Effects in Nematic Liquid Crystals. Ph.D. Thesis, Kent State University, Kent, OH, USA, 2007; p. 113. [Google Scholar]
  25. Golovin, A.B.; Shiyanovskii, S.V.; Lavrentovich, O.D. Fast switching dual-frequency liquid crystal optical retarder, driven by an amplitude and frequency modulated voltage. Appl. Phys. Lett. 2003, 83, 3864–3866. [Google Scholar] [CrossRef]
  26. Kumar, S. Liquid Crystals: Experimental Study of Physical Properties and Phase Transitions; Cambridge University Press: Cambridge, UK, 2008; p. 487. [Google Scholar]
  27. Nishikawa, M.; West, J.L. Order Parameter of Liquid Crystal on Polyimide with Polarized Ultraviolet-Light Exposure. Jpn. J. Appl. Phys. 2002, 38, L331–L333. [Google Scholar] [CrossRef]
  28. Uchida, T.; Shishido, C.; Seki, H.; Wada, M. Guest-Host Interactions in Liquid Crystals. Mol. Cryst. Liq. Cryst. 1977, 39, 39–52. [Google Scholar] [CrossRef]
Figure 1. Electro-optical response of the 2-μm-thick cell filled with dual-frequency nematic liquid crystals.
Crystals 09 00314 g001
Figure 2. (a) Turn-on time of the liquid crystal cell as a function of the cell thickness. Dots represent experimental values. Solid curves are calculated using Equation (4). Thin and thick cell regimes are labeled. The frequency of the driving voltage is 1 kHz. (b) Calculated ratio of the rotational viscosity to the elastic constant, γ/K, as a function of the cell thickness.
Crystals 09 00314 g002
Figure 3. (a) UV absorbance of the studied cells as a function of the cell thickness. (b) Effective absorbance ratio AII/A as a function of the cell thickness.
Crystals 09 00314 g003
Figure 4. Turn-off time of the liquid crystal cell as a function of the cell thickness. Dots represent experimental values. Straight line is calculated using Equation (5). The frequency of the driving voltage is 25 kHz. Inset shows the computed relative ratio of the rotational viscosity to the elastic constant as a function of the cell thickness.
Crystals 09 00314 g004
Table 1. Material parameters of the MLC-2048 according to paper [23].
Optical Properties (at λ = 550 nm)Dielectric Properties
ne1.7192∆ε at 1 kHZ3.00
no1.4978∆ε at 50 kHz−2.8
n0.2214fcross18 kHz
Table 2. Applied voltage and cell thicknesses used in experiments.
Cell Thickness (µm)Applied Voltage (V)Cell Thickness (µm)Applied Voltage (V)Cell Thickness (µm)Applied Voltage (V)
1.181015.625050.0085
2.041223.006062.3190
3.582023.0076065.1190
4.132228.0175100120
10.554028.1075150130
11.814038.1780200140
15.315038.2280220190

