Optical Characterization of Cesium Lead Bromide Perovskites

 , ,
, ,  , , and
Abstract
:1. Introduction
2. Materials and Methods
2.1. Synthesis of CsPbBr3 and Cs4PbBr6 Powders
2.2. Synthesis of Cs4PbBr6 Nanocrystal (NC) Films
2.3. X-Ray Diffraction Measurements
2.4. Spectral Measurements
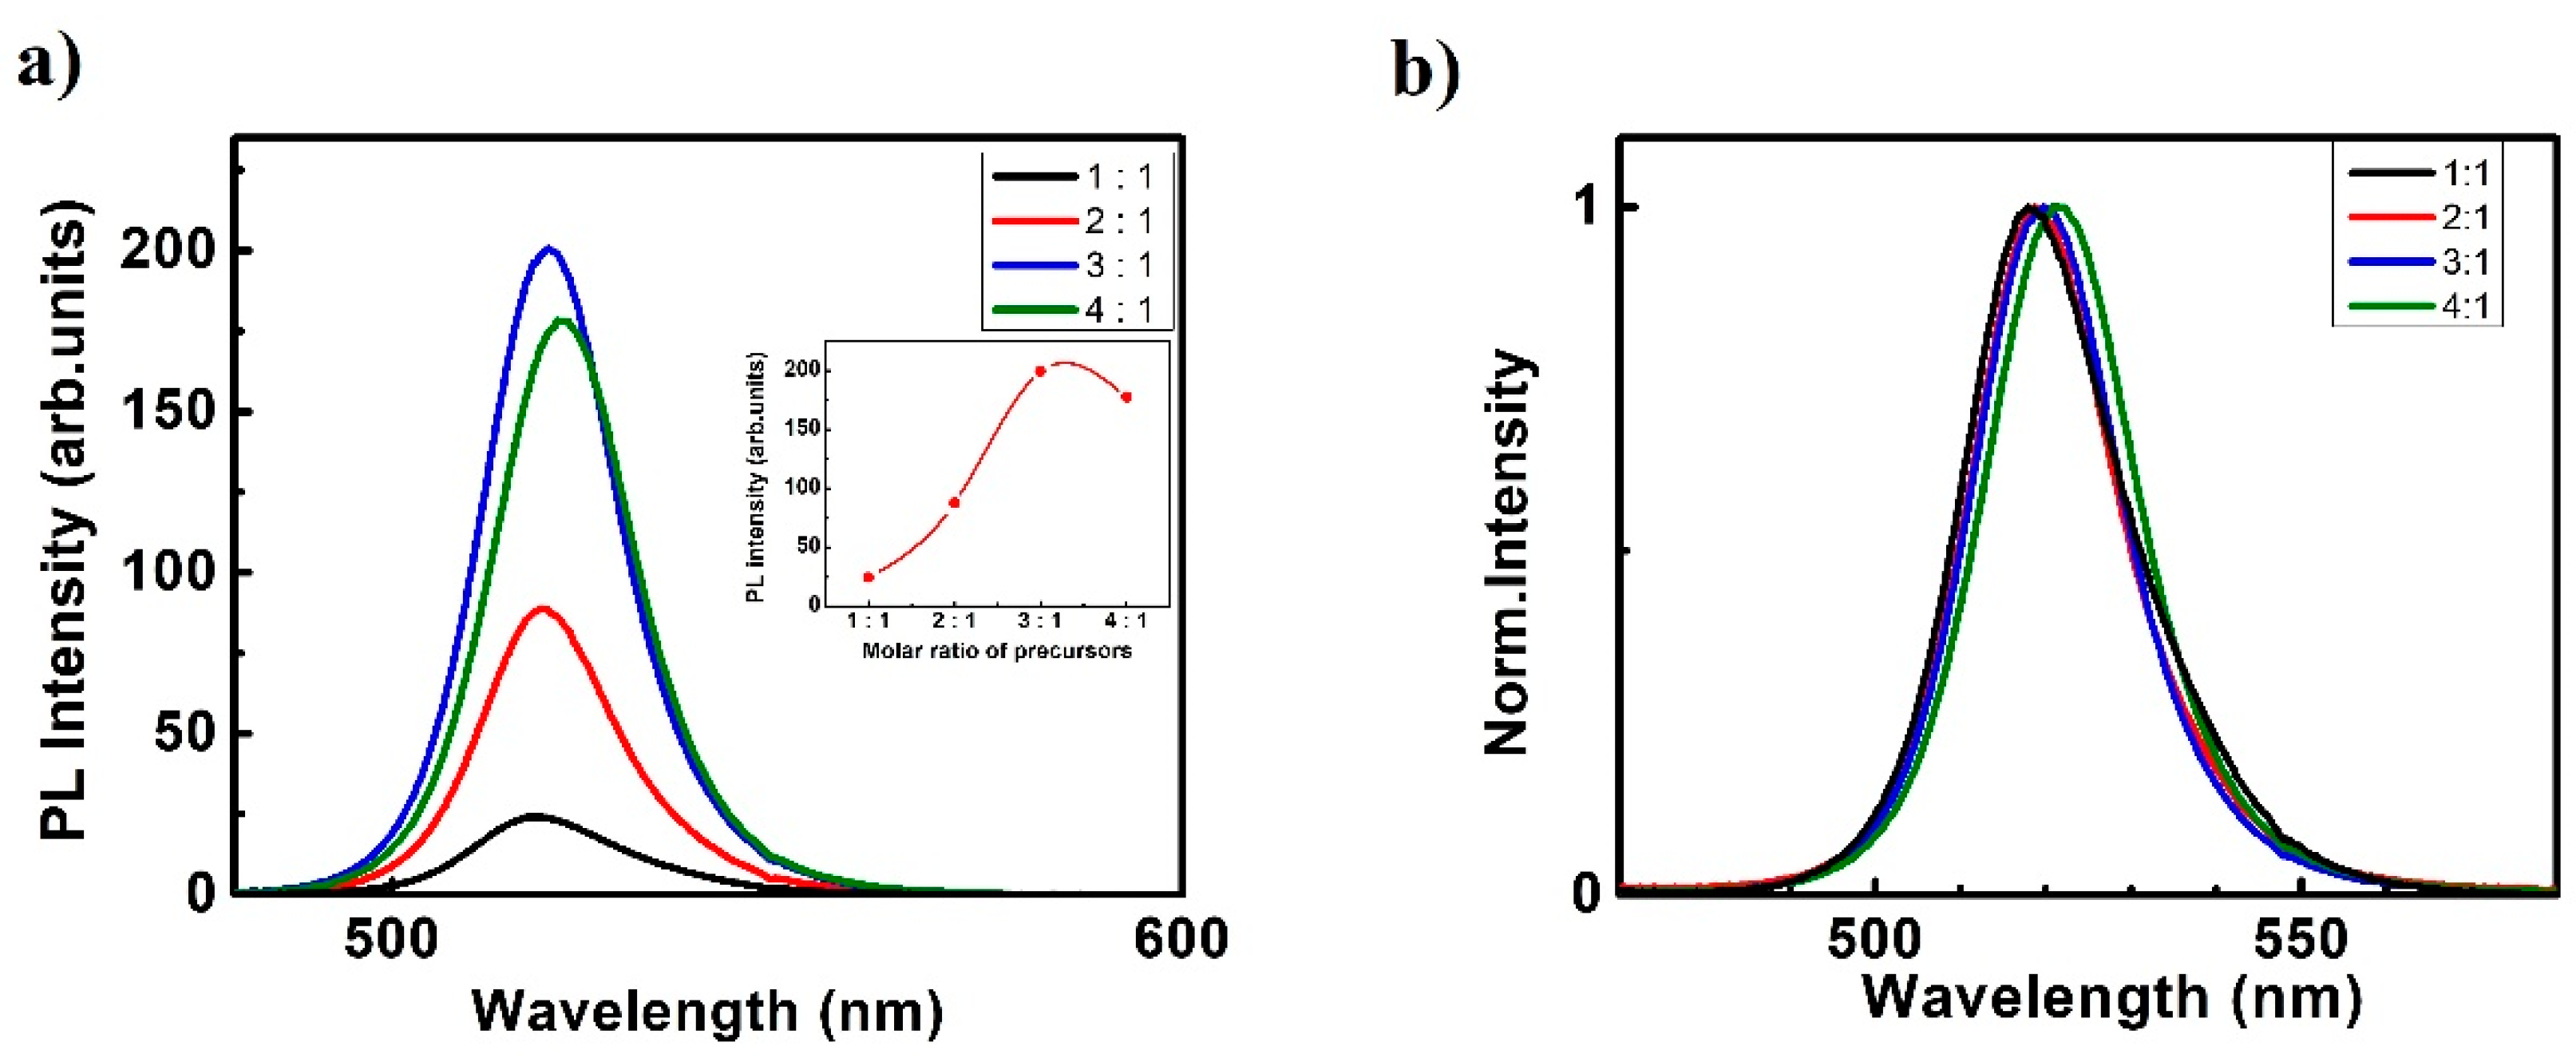
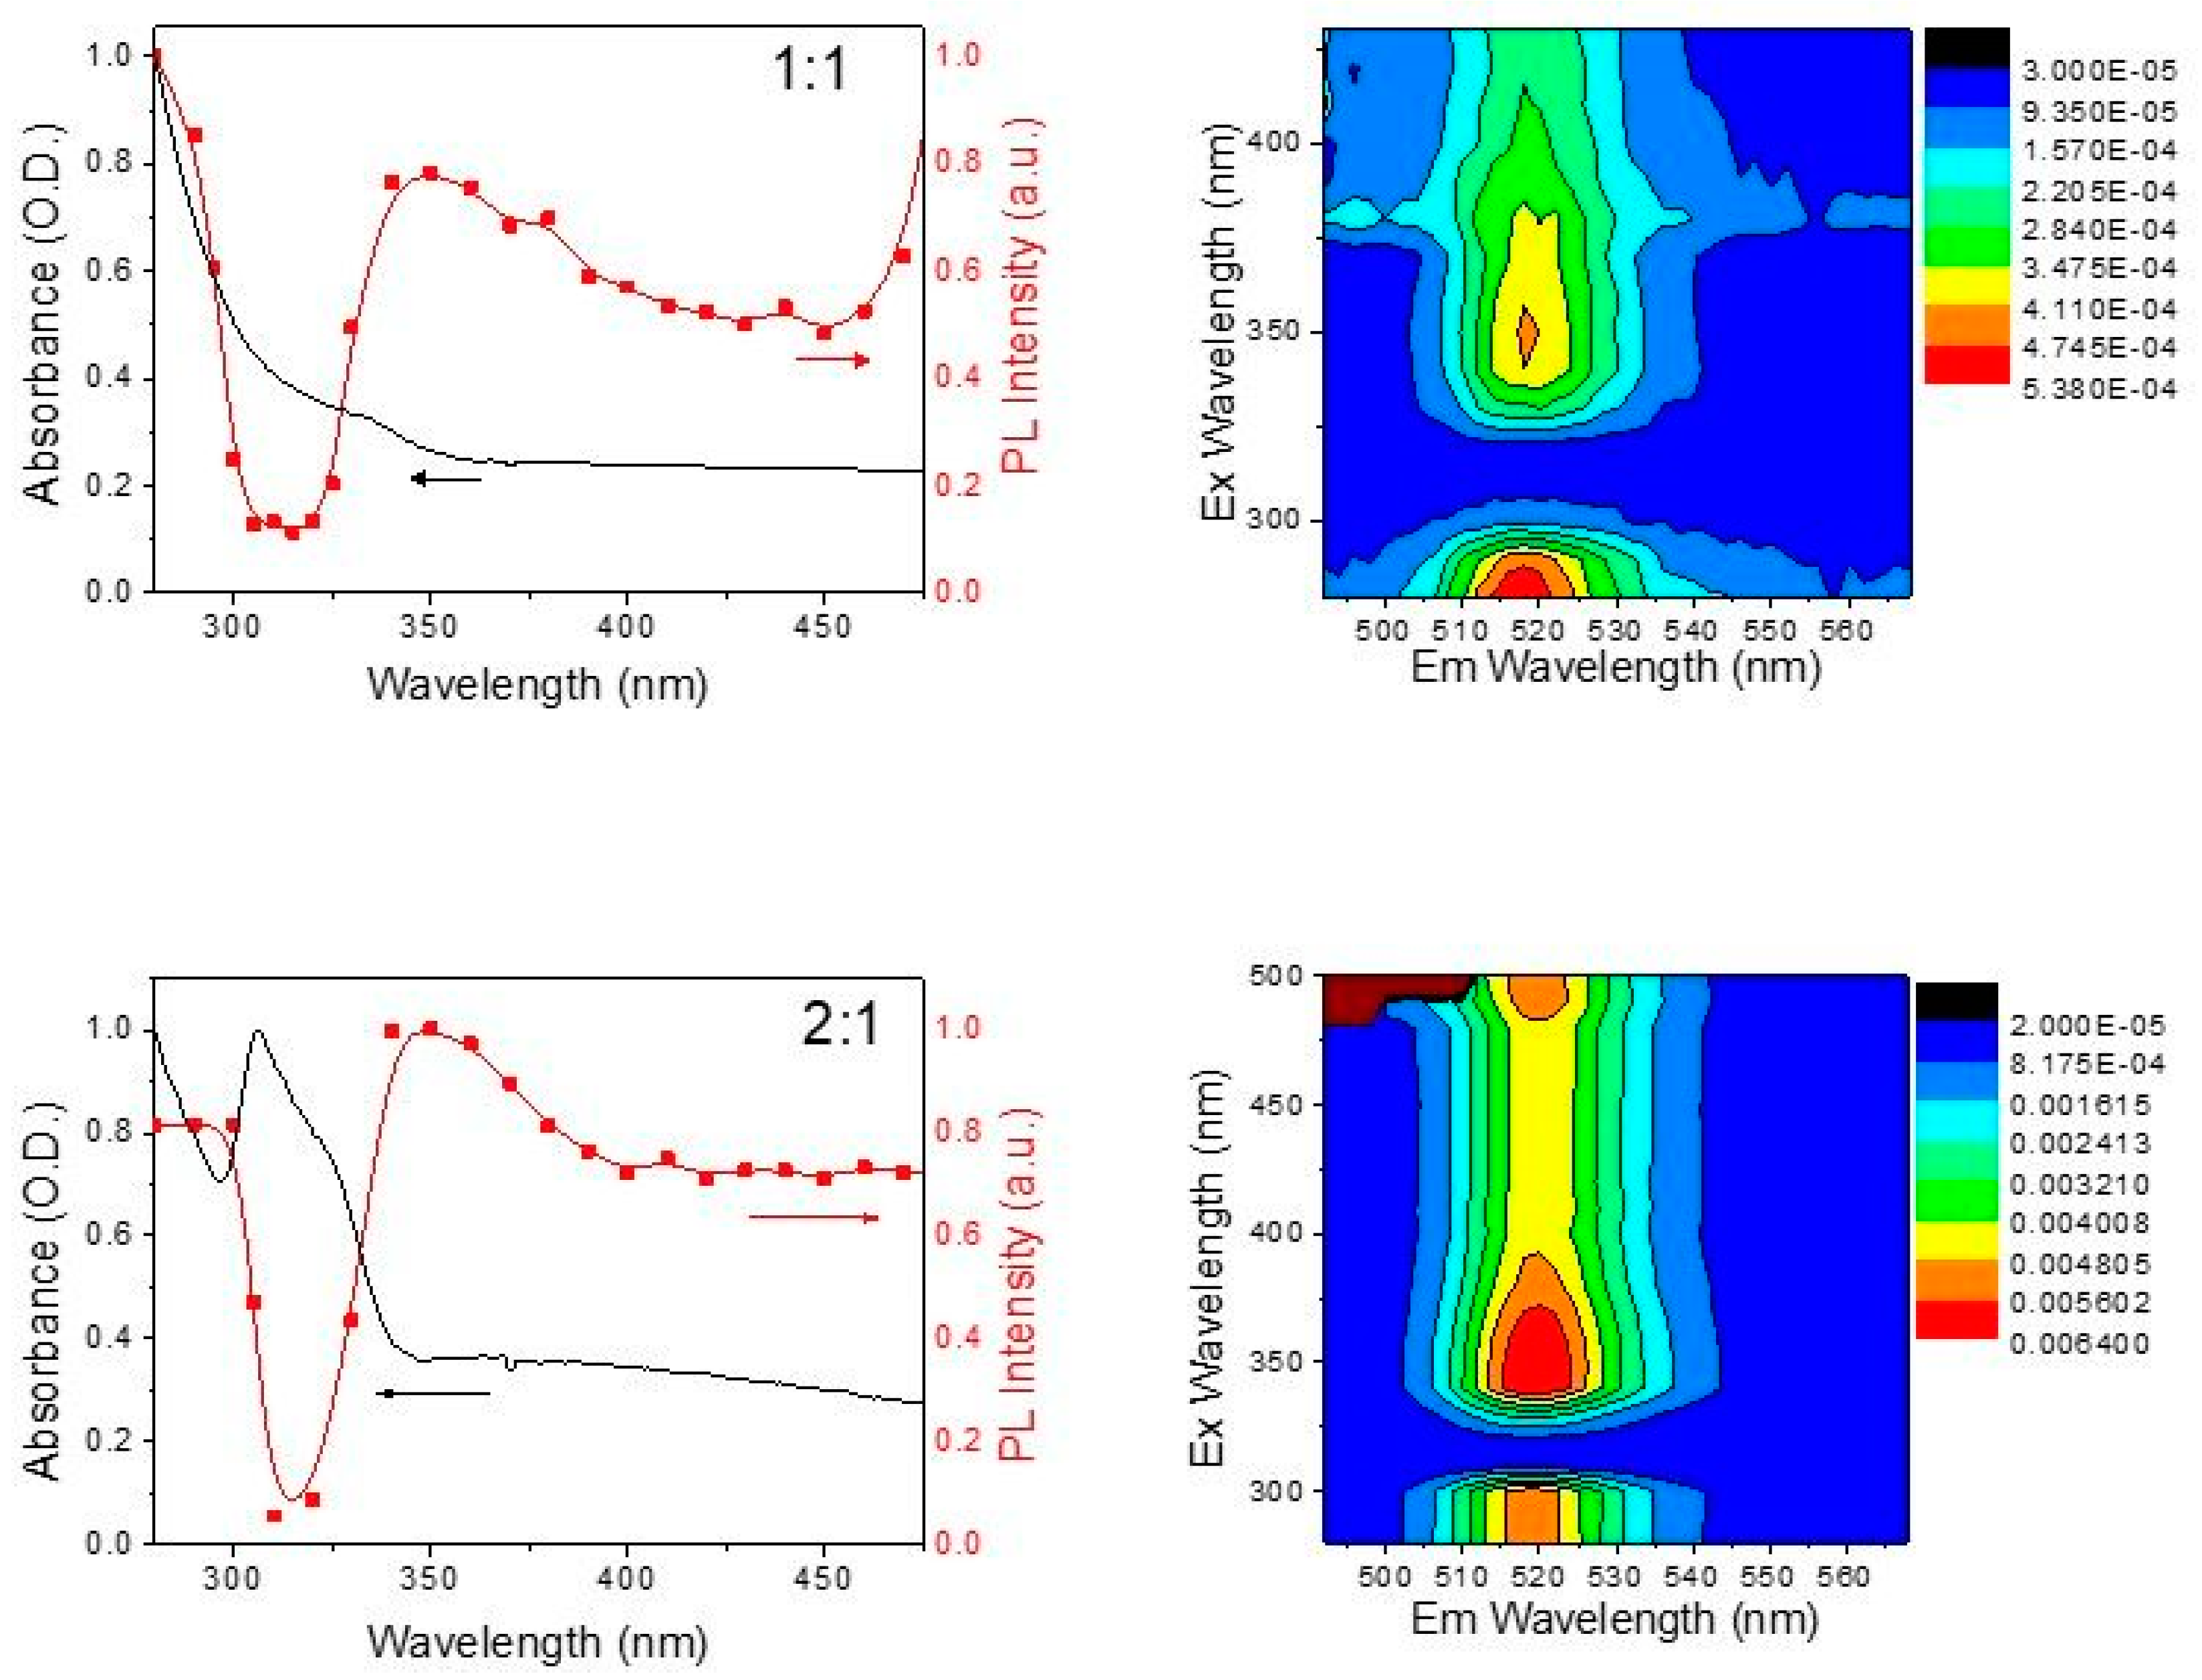
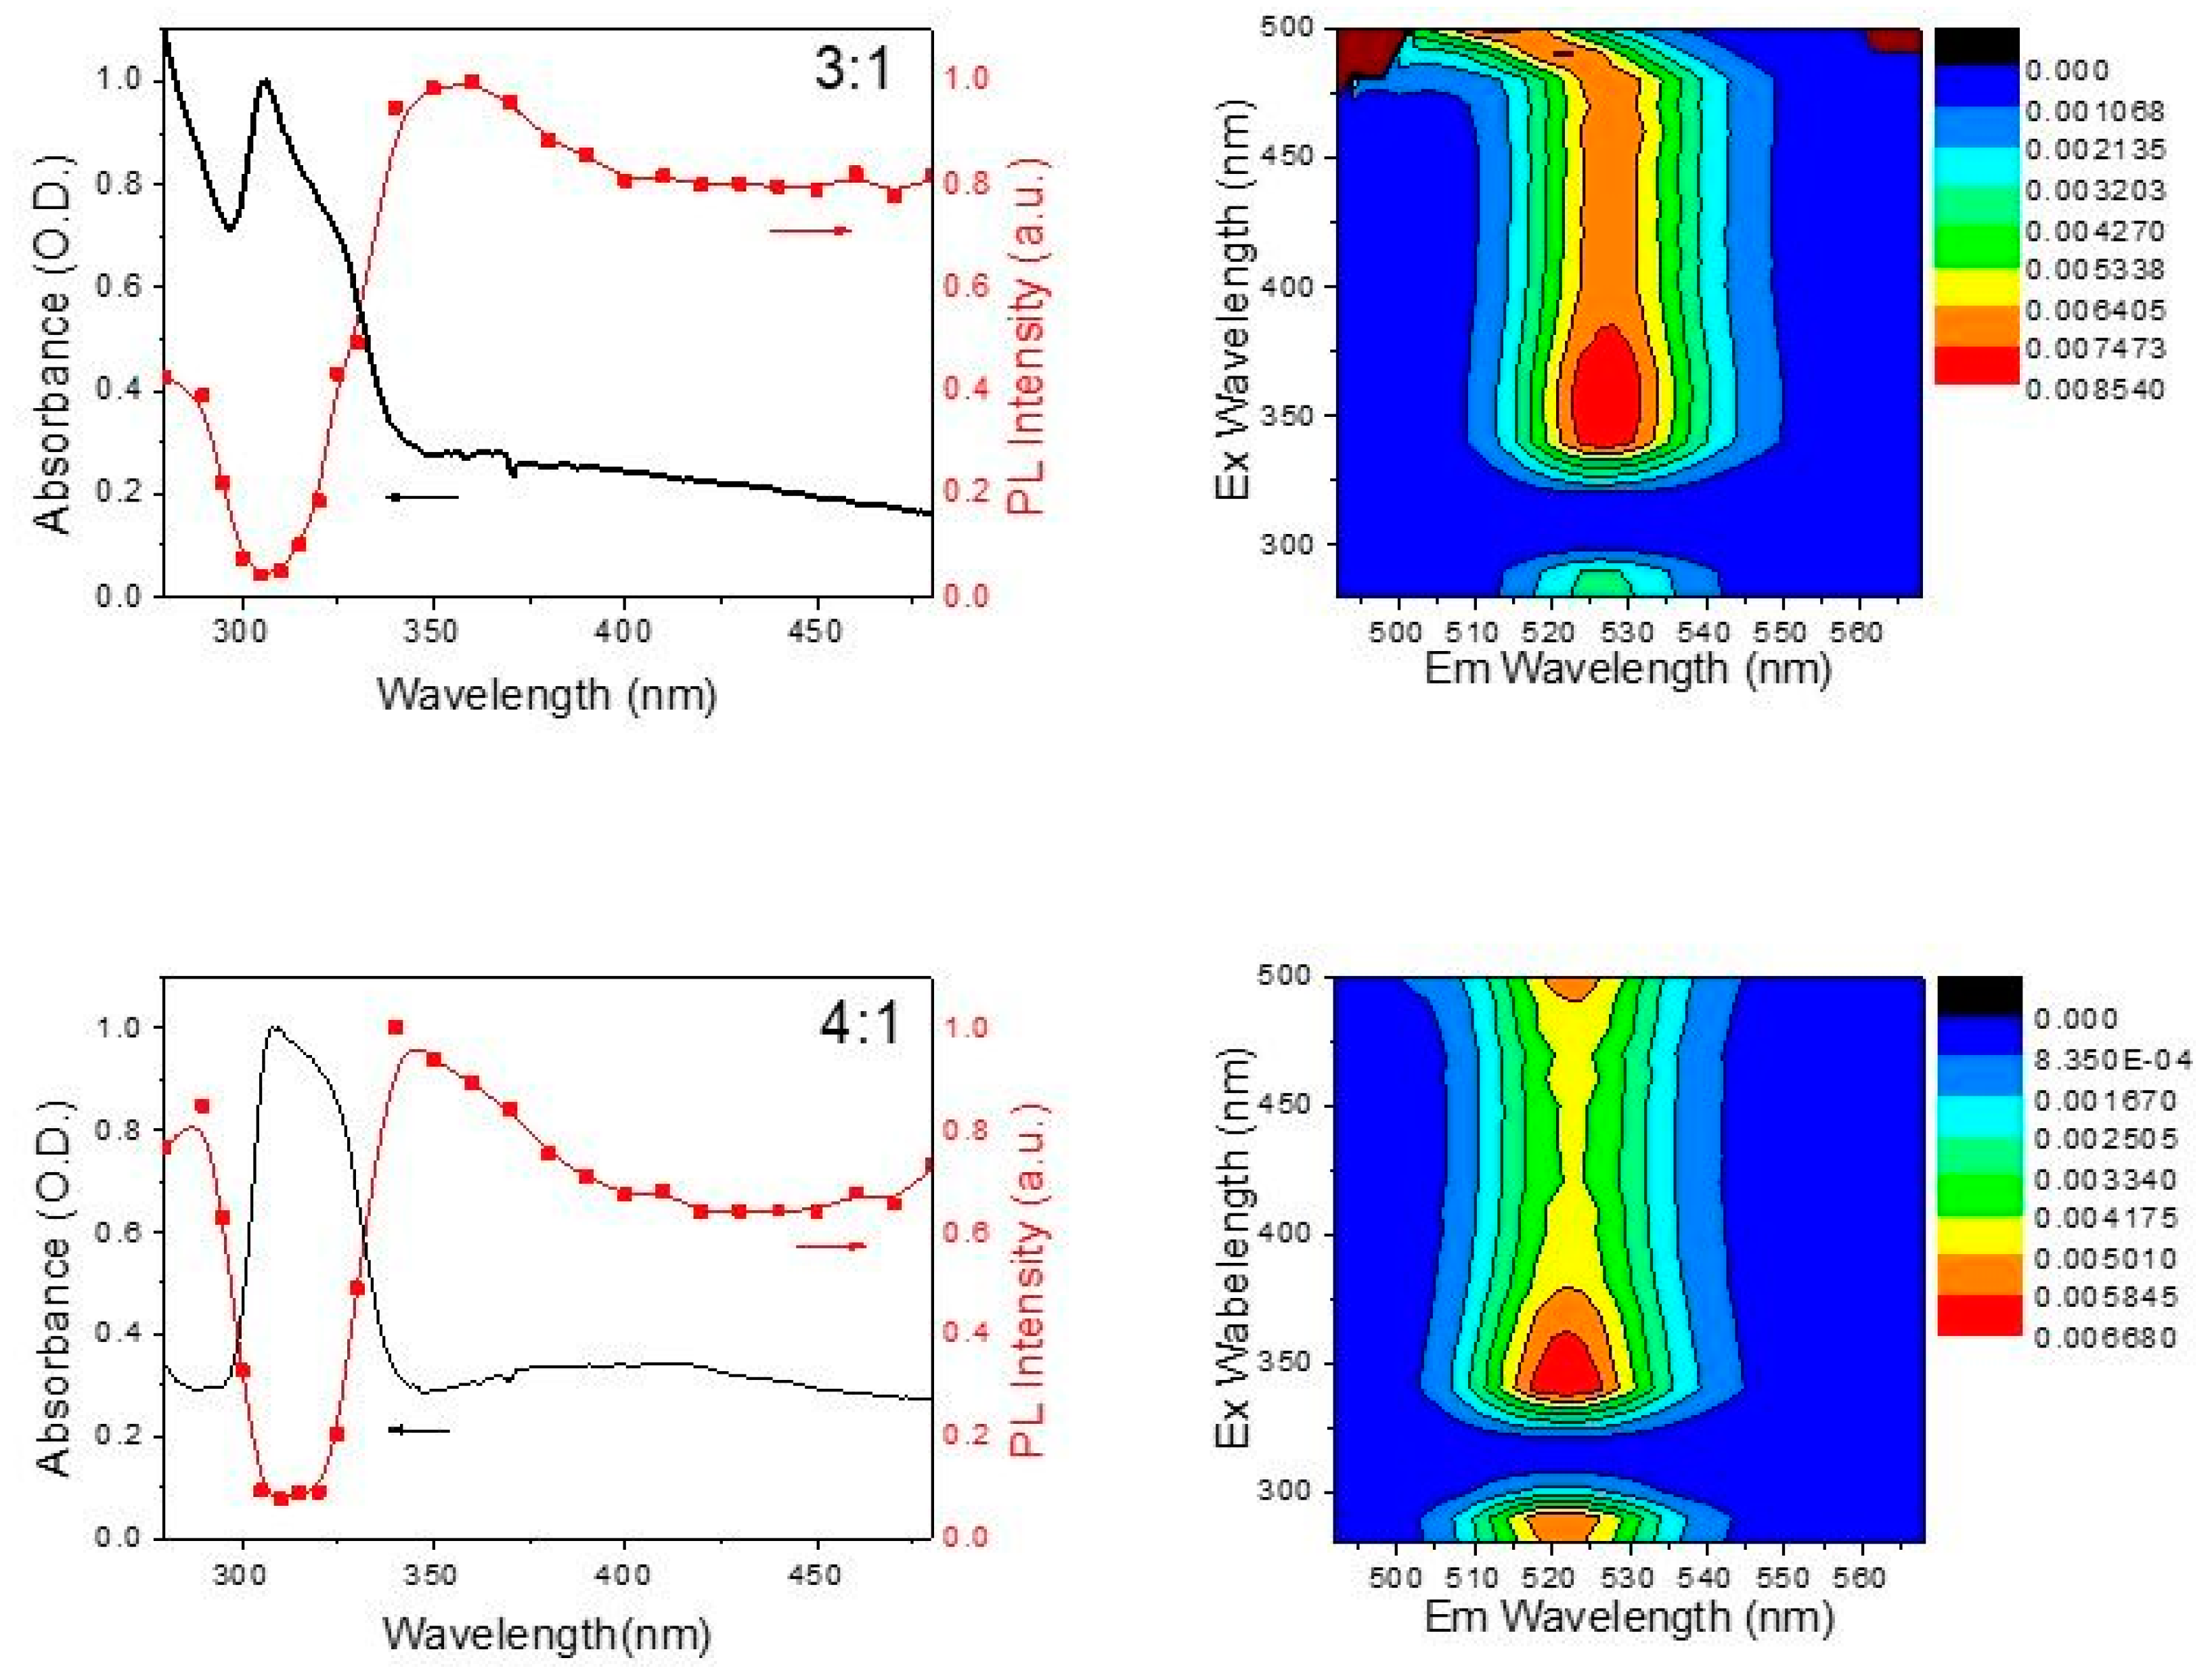
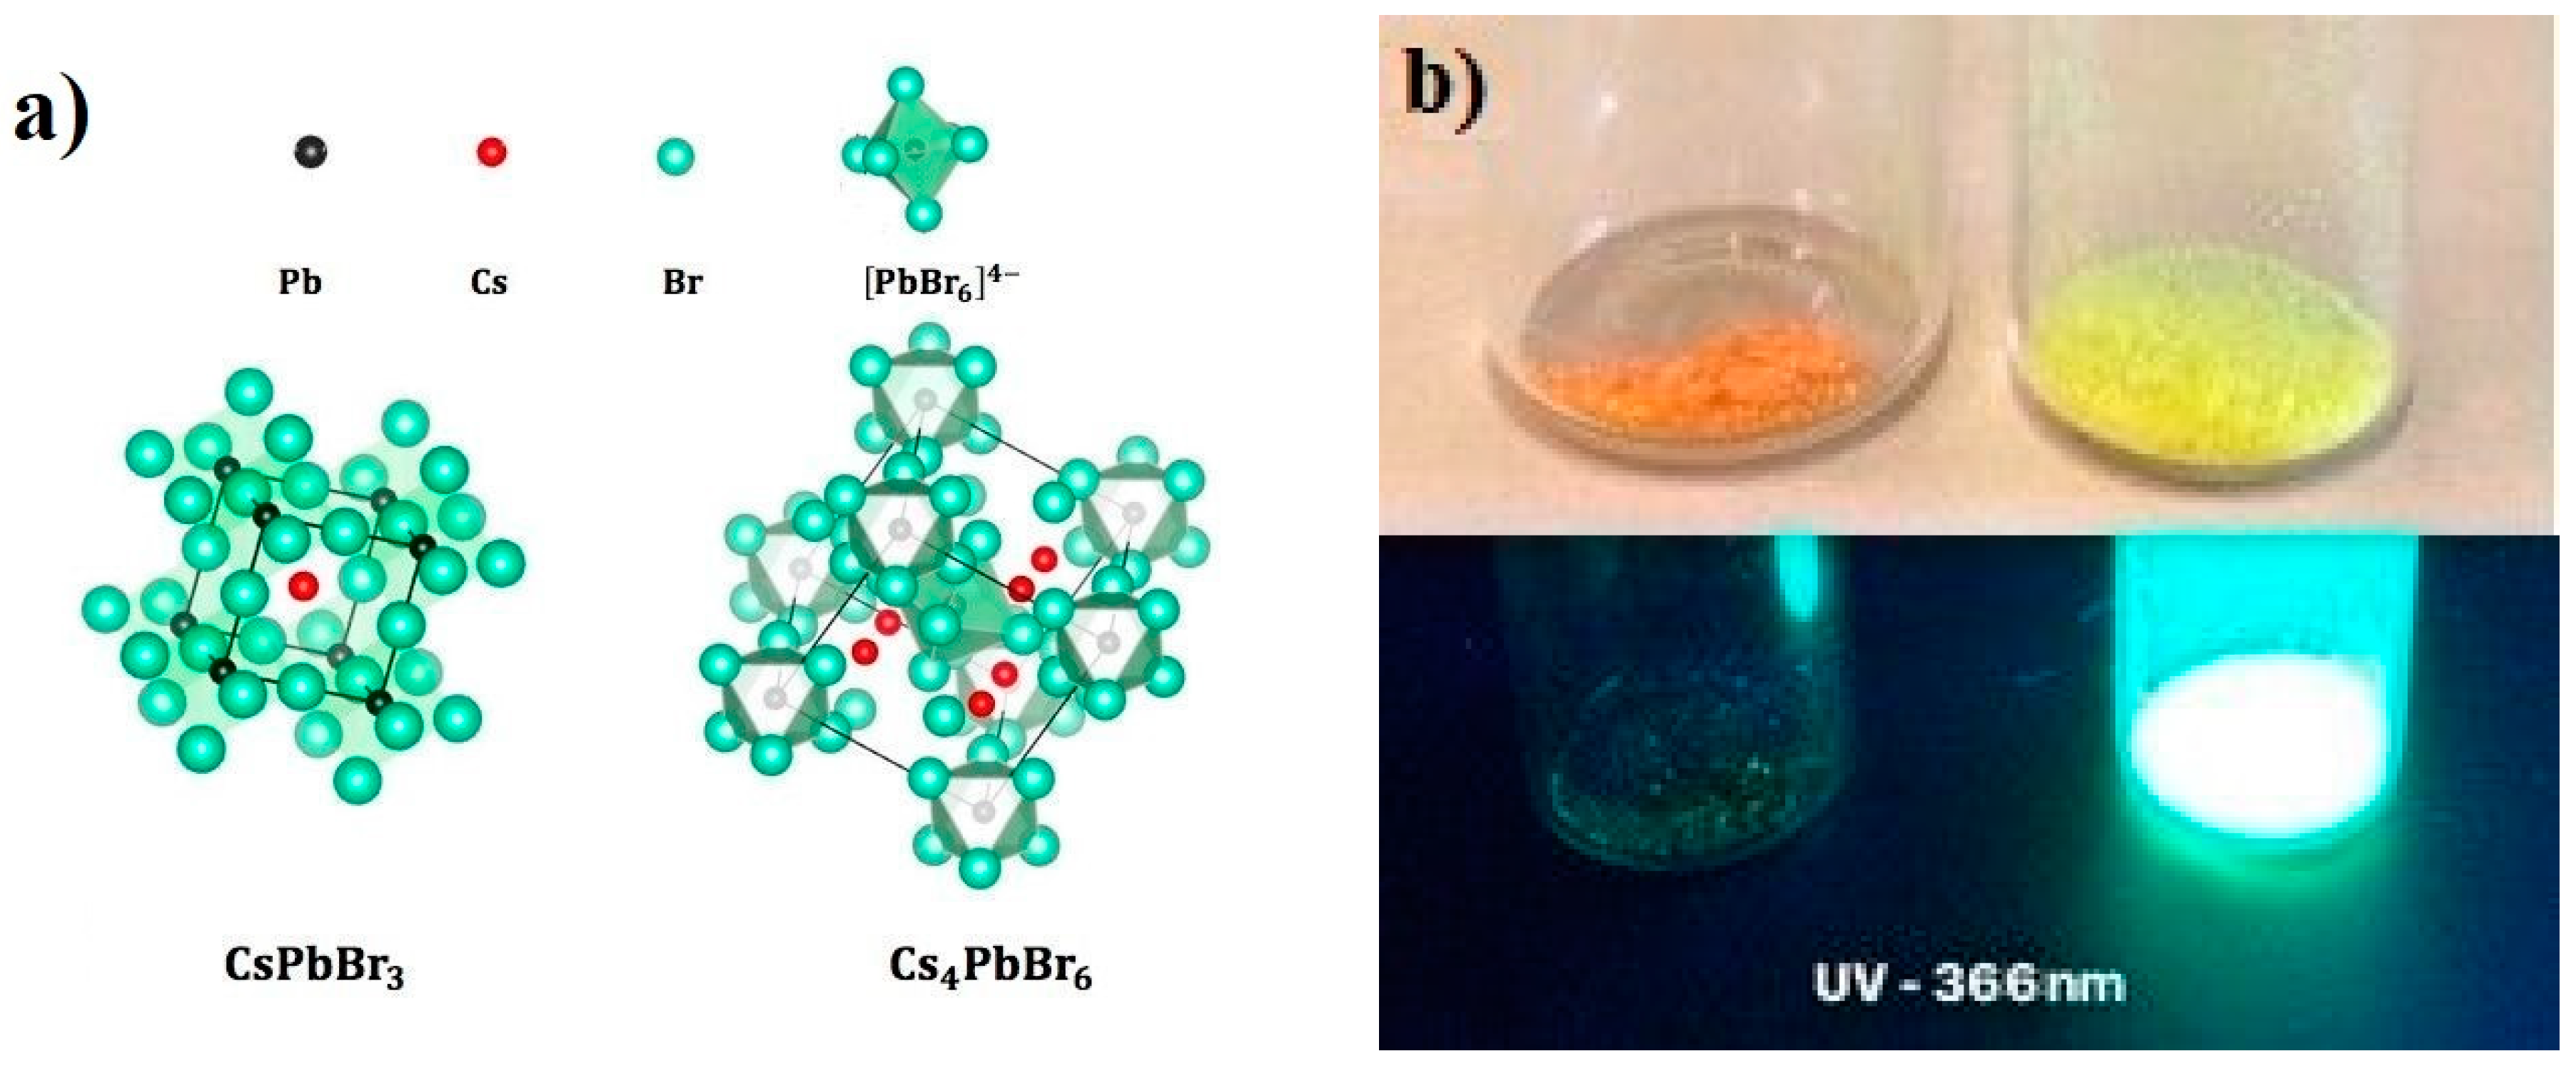
3. Results and Discussion
4. Conclusions
Author Contributions
Funding
Acknowledgments
Conflicts of Interest
References
- Editorial. Perovskites keep on giving. Nat. Mater. 2018, 17, 371. [Google Scholar] [CrossRef] [PubMed]
- Green, M.A.; Ho-Baillie, A.; Snaith, H.J. The emergence of perovskite solar cells. Nature Phot. 2014, 8, 506–514. [Google Scholar] [CrossRef]
- Berry, J.; Buonassisi, T.; Egger, D.A.; Hodes, G.; Kronik, L.; Loo, Y.-L.; Lubomirsky, I.; Marder, S.R.; Mastai, Y.; Miller, J.S.; et al. Hybrid Organic-Inorganic Perovskites (HOIPs): Opportunities and Challenges. Adv. Mater. 2015, 27, 5102–5112. [Google Scholar] [CrossRef]
- Snaith, H.J. Present status and future prospects of perovskite photovoltaics. Nature Mater. 2018, 17, 372–376. [Google Scholar] [CrossRef]
- Paci, B.; Generosi, A.; Wright, J.; Ferrero, C.; Di Carlo, A.; Brunetti, F. Planar Perovskite Solar Cells: Local Structure and Stability Issues. Sol. RRL 2017, 1, 1700066. [Google Scholar] [CrossRef]
- Kakavelakis, G.; Paradisanos, I.; Paci, B.; Generosi, A.; Papachatzakis, M.; Maksudov, T.; Najafi, L.; Esaú Del Rio Castillo, A.; Kioseoglou, G.; Stratakis, E. Extending the Continuous Operating Lifetime of Perovskite Solar Cells with a Molybdenum Disulfide Hole Extraction Interlayer. Adv. Energy Mater. 2018, 8, 1702287. [Google Scholar] [CrossRef]
- Barettin, D.; Di Carlo, A.; De Angelis, R.; Casalboni, M.; Prosposito, P. Effect of dielectric Bragg grating nanostructuring on dye sensitized solar cells. Opt. Expr. 2012, 20, A888–A897. [Google Scholar] [CrossRef]
- Yantara, N.; Bhaumik, S.; Yan, F.; Sabba, D.; Dewi, H.A.; Mathwes, N.; Boix, P.P.; Demir, H.V.; Mhaisalkar, S. Inorganic Halide Perovskites for Efficient Light-Emitting Diodes. J. Phys. Chem. Lett. 2015, 6, 4360–4364. [Google Scholar] [CrossRef]
- Xu, J.; Huang, W.; Li, P.; Onken, D.R.; Dun, C.; Guo, Y.; Ucer, K.B.; Lu, C.; Wang, H.; Geyer, S.M.; et al. Imbedded Nanocrystals of CsPbBr3 in Cs4PbBr6: Kinetics, Enhanced Oscillator Strength, and Application in Light-Emitting Diodes. Adv. Mater. 2017, 29, 1703703. [Google Scholar] [CrossRef]
- Chakraborty, A.; Pizzoferrato, R.; Agresti, A.; De Matteis, F.; Orsini, A.; Medaglia, P.G. Wet-chemical synthesis of ZnO nanowires on low temperature photo-activated ZnO-rGO composite thin film with enhanced photoconduction. J. Electr. Mater. 2018, 10, 5863–5869. [Google Scholar] [CrossRef]
- Veldhuis, S.A.; Boix, P.P.; Yantara, N.; Li, M.; Sum, T.C.; Mathews, N.; Mhaisalkar, S.G. Perovskite Materials for Light-Emitting Diodes and Lasers. Adv. Mater. 2016, 28, 6804–6834. [Google Scholar] [CrossRef]
- Suzuki, H.; Ogura, K.; Matsumoto, N.; Schutzmann, S. Polymethine Dyes as Novel Efficient Infrared Electroluminescence Materials. Mol. Cryst. Liq. Cryst. 2006, 444, 51–59. [Google Scholar] [CrossRef]
- Lamastra, F.R.; De Angelis, R.; Antonucci, A.; Salvatori, D.; Prosposito, P.; Casalboni, M.; Congestri, R.; Melino, S.; Nanni, F. Polymer composite random lasers based on frustules as scatterers. RSC Adv. 2014, 4, 61809–61816. [Google Scholar] [CrossRef]
- Wei, H.; Fang, Y.; Mulligan, P.; Chuirazzi, W.; Fang, H.-H.; Wang, C.; Ecker, B.R.; Gao, Y.; Loi, M.A.; Cao, L. Sensitive X-ray detectors made of methylammonium lead tribromide perovskite single crystals. Nat. Photonics 2016, 10, 333–339. [Google Scholar] [CrossRef]
- Dohner, E.R.; Hoke, E.T.; Karunadasa, H.I. Self-Assembly of Broadband White-Light Emitters. J. Am. Chem. Soc. 2014, 136, 1718–1721. [Google Scholar] [CrossRef]
- Yuan, Z.; Zhou, C.; Tian, Y.; Shu, Y.; Messier, J.; Wang, J.C.; van de Burgt, L.J.; Kountouriotis, K.; Xin, Y.; Holt, E.; et al. One-dimensional organic lead halide perovskites with efficient bluish white-light emission. Nat. Commun. 2017, 8, 14051. [Google Scholar] [CrossRef]
- Zhou, C.; Lin, H.; Tian, Y.; Yuan, Z.; Clark, R.J.; Chen, B.; van de Burgt, B.; Wang, J.C.; Zhou, Y.; Hanson, K. Luminescent zero-dimensional organic metal halide hybrids with near-unity quantum efficiency. Chem. Sci. 2018, 9, 586–593. [Google Scholar] [CrossRef] [PubMed]
- Dong, Q.; Fang, Y.; Shao, Y.; Mulligan, P.; Qiu, J.; Cao, L.; Huang, J. Electron-hole diffusion lengths > 175 μm in solution-grown CH3NH3PbI3 single crystals. Science 2015, 347, 967–970. [Google Scholar] [CrossRef] [PubMed]
- Xing, G.; Mathews, N.; Sun, S.; Lim, S.S.; Lam, Y.M.; Graetzel, M.; Mhaisalkar, S.; Sum, T.C. Long-Range Balanced Electron- and Hole-Transport Lengths in Organic-Inorganic CH3NH3PbI3. Science 2013, 342, 344–347. [Google Scholar] [CrossRef] [PubMed]
- Zuo, C.; Bolink, H.J.; Han, H.; Huang, J.; Cahen, D.; Ding, L. Advances in Perovskite Solar Cells. Adv. Sci. 2016, 3, 1500324. [Google Scholar] [CrossRef]
- Han, D.; Shi, H.; Ming, W.; Zhou, C.; Ma, B.; Saparov, B.; Ma, Y.Z.; Chen, S.; Du, M.H. Unraveling luminescence mechanisms in zero-dimensional halide perovskites. J. Mater. Chem. C 2018, 6, 6398. [Google Scholar] [CrossRef]
- Saidaminov, M.I.; Almutlaq, J.; Sarmah, S.; Dursun, I.; Zhumekenov, A.A.; Begum, R.; Pan, J.; Cho, N.; Mohammed, O.F.; Bakr, O.M. Pure Cs4PbBr6: Highly Luminescent Zero-Dimensional Perovskite Solids. ACS Energy Lett. 2016, 1, 840–845. [Google Scholar] [CrossRef]
- De Bastiani, M.; Dursun, I.; Zhang, Y.; Alshankiti, B.A.; Miao, X.H.; Yin, J.; Yengel, E.; Alarousu, E.; Turedi, B.; Almutlaq, J.M.; et al. Inside Perovskites: Quantum Luminescence from Bulk Cs4PbBr6 Single Crystals. Chem. Mater. 2017, 29, 7108. [Google Scholar] [CrossRef]
- Zhang, Y.; Saidaminov, M.I.; Dursun, I.; Yang, H.; Alarousu, B.E.; Yengel, E.; Alshankiti, B.A.; Bakr, O.M.; Mohammed, O.F. Zero-dimensional Cs4PbBr6 Perovskite Nanocrystals. J. Phys. Chem. Lett. 2017, 8, 961–965. [Google Scholar] [CrossRef]
- Cha, J.-H.; Han, J.; Yin, W.; Park, C.; Park, Y.; Ahn, T.K.; Cho, J.H.; Jung, D.-Y. Photoresponse of CsPbBr3 and Cs4PbBr6 Perovskite Single Crystals. J. Phys. Chem. Lett. 2017, 8, 565–570. [Google Scholar] [CrossRef]
- Nikl, M.; Mihokova, E.; Nitsch, K.; Somma, F.; Giampaolo, C.; Pazzi, G.P.; Fabeni, P.; Zazubovich, S. Photoluminescence of Cs PbBr crystals and thin films. Chem. Phys. Lett. 1999, 306, 280–284. [Google Scholar] [CrossRef]
- Riesen, N.; Lockrey, M.N.; Badek, K.; Riesen, H. On the origins of the green luminescence in the “zero-dimensional perovskite” Cs4PbBr6: Conclusive results from cathodoluminescence imaging. Nanoscale 2019, 11, 3925–3932. [Google Scholar] [CrossRef] [PubMed]
- Chen, X.; Zhang, F.; Ge, Y.; Shi, L.; Huang, S.; Tang, J.; Lv, Z.; Zhang, L.; Zou, B.; Zhong, H. Centimeter-Sized Cs4PbBr6 Crystals with Embedded CsPbBr3 Nanocrystals Showing Superior Photoluminescence: Nonstoichimetry Induced Transformation and Light-Emitting Applications. Adv. Funct. Mater. 2018, 28, 1706567. [Google Scholar] [CrossRef]
- Burratti, L.; De Matteis, F.; Casalboni, M.; Francini, R.; Pizzoferrato, R.; Prosposito, P. Polystyrene photonic crystals as optical sensors for volatile organic compounds. Mat. Chem. Phys. 2018, 212, 274–281. [Google Scholar] [CrossRef]
- Ciotta, E.; Paoloni, S.; Richetta, M.; Prosposito, P.; Tagliatesta, P.; Lorecchio, C.; Venditti, I.; Fratoddi, I.; Casciardi, S.; Pizzoferrato, R. Sensitivity to Heavy-Metal Ions of Unfolded Fullerene Quantum Dots. Sensors 2017, 17, 2614. [Google Scholar] [CrossRef]
- Ricci, A.; Chiarini, M.; Sterzo, C.L.; Pizzoferrato, R.; Paoloni, S. Synthesis and photophysical properties of poly (arylene ethynylene) small-molecules and polymers derivatized with leucine substituents. J. Photochem. Photobiol. A Chem. 2015, 298, 1–8. [Google Scholar] [CrossRef]
- Moller, C.K. The structure of perovskite-like caesium plumbo CsPbI3. Mat.-Fys. Medd. K. Dan. Vidensk. Selsk. 1959, 32, 1. [Google Scholar]
- Moller, C.K. Electrochemical investigation of the transition from tetragonal to cubic cæsium plumbo chloride. Mat.-Fys. Medd. K. Dan. Vidensk. Selsk. 1960, 32, 3. [Google Scholar]
- Cola, M.; Massarotti, V.; Riccardi, R.; Sinistri, C.Z. Binary Systems Formed by Lead Bromide with (Li, Na, K, Rb, Cs and Tl)Br: a DTA and Diffractometric Study. Naturforsch. A 1971, 26, 1328. [Google Scholar] [CrossRef]
- Rakita, Y.; Kedem, N.; Gupta, S.; Sadhanala, A.; Kalchenko, V.; Bohm, M.L.; Kulbak, M.; Friend, R.H.; Cahen, D.; Hodes, G. Low-Temperature Solution-Grown CsPbBr3 Single Crystals and Their Characterization. Cryst. Growth Des. 2016, 16, 5717–5725. [Google Scholar] [CrossRef]
- Shi, Z.; Li, Y.; Zhang, Y.; Chen, Y.; Li, X.; Wu, D.; Xu, T.; Shan, C.; Du, G. High-efficiency and air-stable perovskite quantum dots light-emitting diodes with all-inorganic heterostructure. Nano Lett. 2017, 17, 313–321. [Google Scholar] [CrossRef]
- Yang, L.; Li, D.; Wang, C.; Yao, W.; Wang, H.; Huang, K. Room-temperature synthesis of pure perovskite-related Cs4PbX6 nanocrystals and their ligand-mediated evolution into highly luminescent CsPbBr3 nanosheets. J. Nanopart. Res. 2017, 19, 258. [Google Scholar] [CrossRef]
- Akkerman, Q.A.; Radicchi, E.; Park, S.; Nunzi, F.; Mosconi, E.; De Angelis, F.; Brescia, R.; Rastogi, P.; Prato, M.; Manna, L. Nearly Monodisperse Insulator Cs4PbX6 (X = Cl, Br, I) Nanocrystals, Their Mixed Halide Compositions, and Their Transformation into CsPbX3 Nanocrystals. Nano Lett. 2017, 17, 1924–1930. [Google Scholar] [CrossRef] [PubMed]
- Babin, V.; Fabeni, P.; Mihokova, E.; Nikl, M.; Pazzi, G.P.; Zazubovich, N.; Zazubovich, S. Luminescence of Cs4PbBr6 aggregates in As-grown and in annealed CsBr:Pb single crystals. Phys. Status Solidi B 2000, 219, 205–214. [Google Scholar] [CrossRef]
- Chen, Y.-M.; Zhou, Y.; Zhao, Q.; Zhang, J.-Y.; Ma, J.-P.; Xuan, T.-T.; Guo, S.-Q.; Yong, Z.-J.; Wang, J.; Kuroiwa, Y.; et al. Cs4PbBr6/CsPbBr3 Perovskite Composites with Near-Unity Luminescence Quantum Yield: Large-Scale Synthesis, Luminescence and Formation Mechanism, and White Light-Emitting Diode Application. ACS Appl. Mater. Interfaces 2018, 10, 15905–15912. [Google Scholar] [CrossRef] [PubMed]
- Quan, L.N.; Quintero-Bermudez, R.; Voznyy, O.; Walters, G.; Jain, A.; Fan, J.Z.; Zheng, X.; Yang, Z.; Sargent, E.H. Highly Emissive Green Perovskite Nanocrystals in a Solid State Crystalline Matrix. Adv. Mater. 2017, 29, 1605945. [Google Scholar] [CrossRef]
- De Angelis, R.; Casalboni, M.; De Matteis, F.; Hatami, F.; Masselink, W.T.; Zhang, H.; Prosposito, P. Chemical sensitivity of InP/In0.48Ga0.52P surface quantum dots studied by time-resolved photoluminescence spectroscopy. J. Lumin. 2015, 168, 54–58. [Google Scholar] [CrossRef]
- Tian, Y.; Scheblykin, I.G. Artifacts in Absorption Measurements of Organometal Halide Perovskite Materials: What Are the Real Spectra? J. Phys. Chem. Lett. 2015, 6, 3466–3470. [Google Scholar] [CrossRef] [Green Version]
- Seth, S.; Samanta, A. Photoluminescence of Zero-Dimensional Perovskites and Perovskite-Related Materials. J. Phys. Chem. Lett. 2018, 9, 176–183. [Google Scholar] [CrossRef]


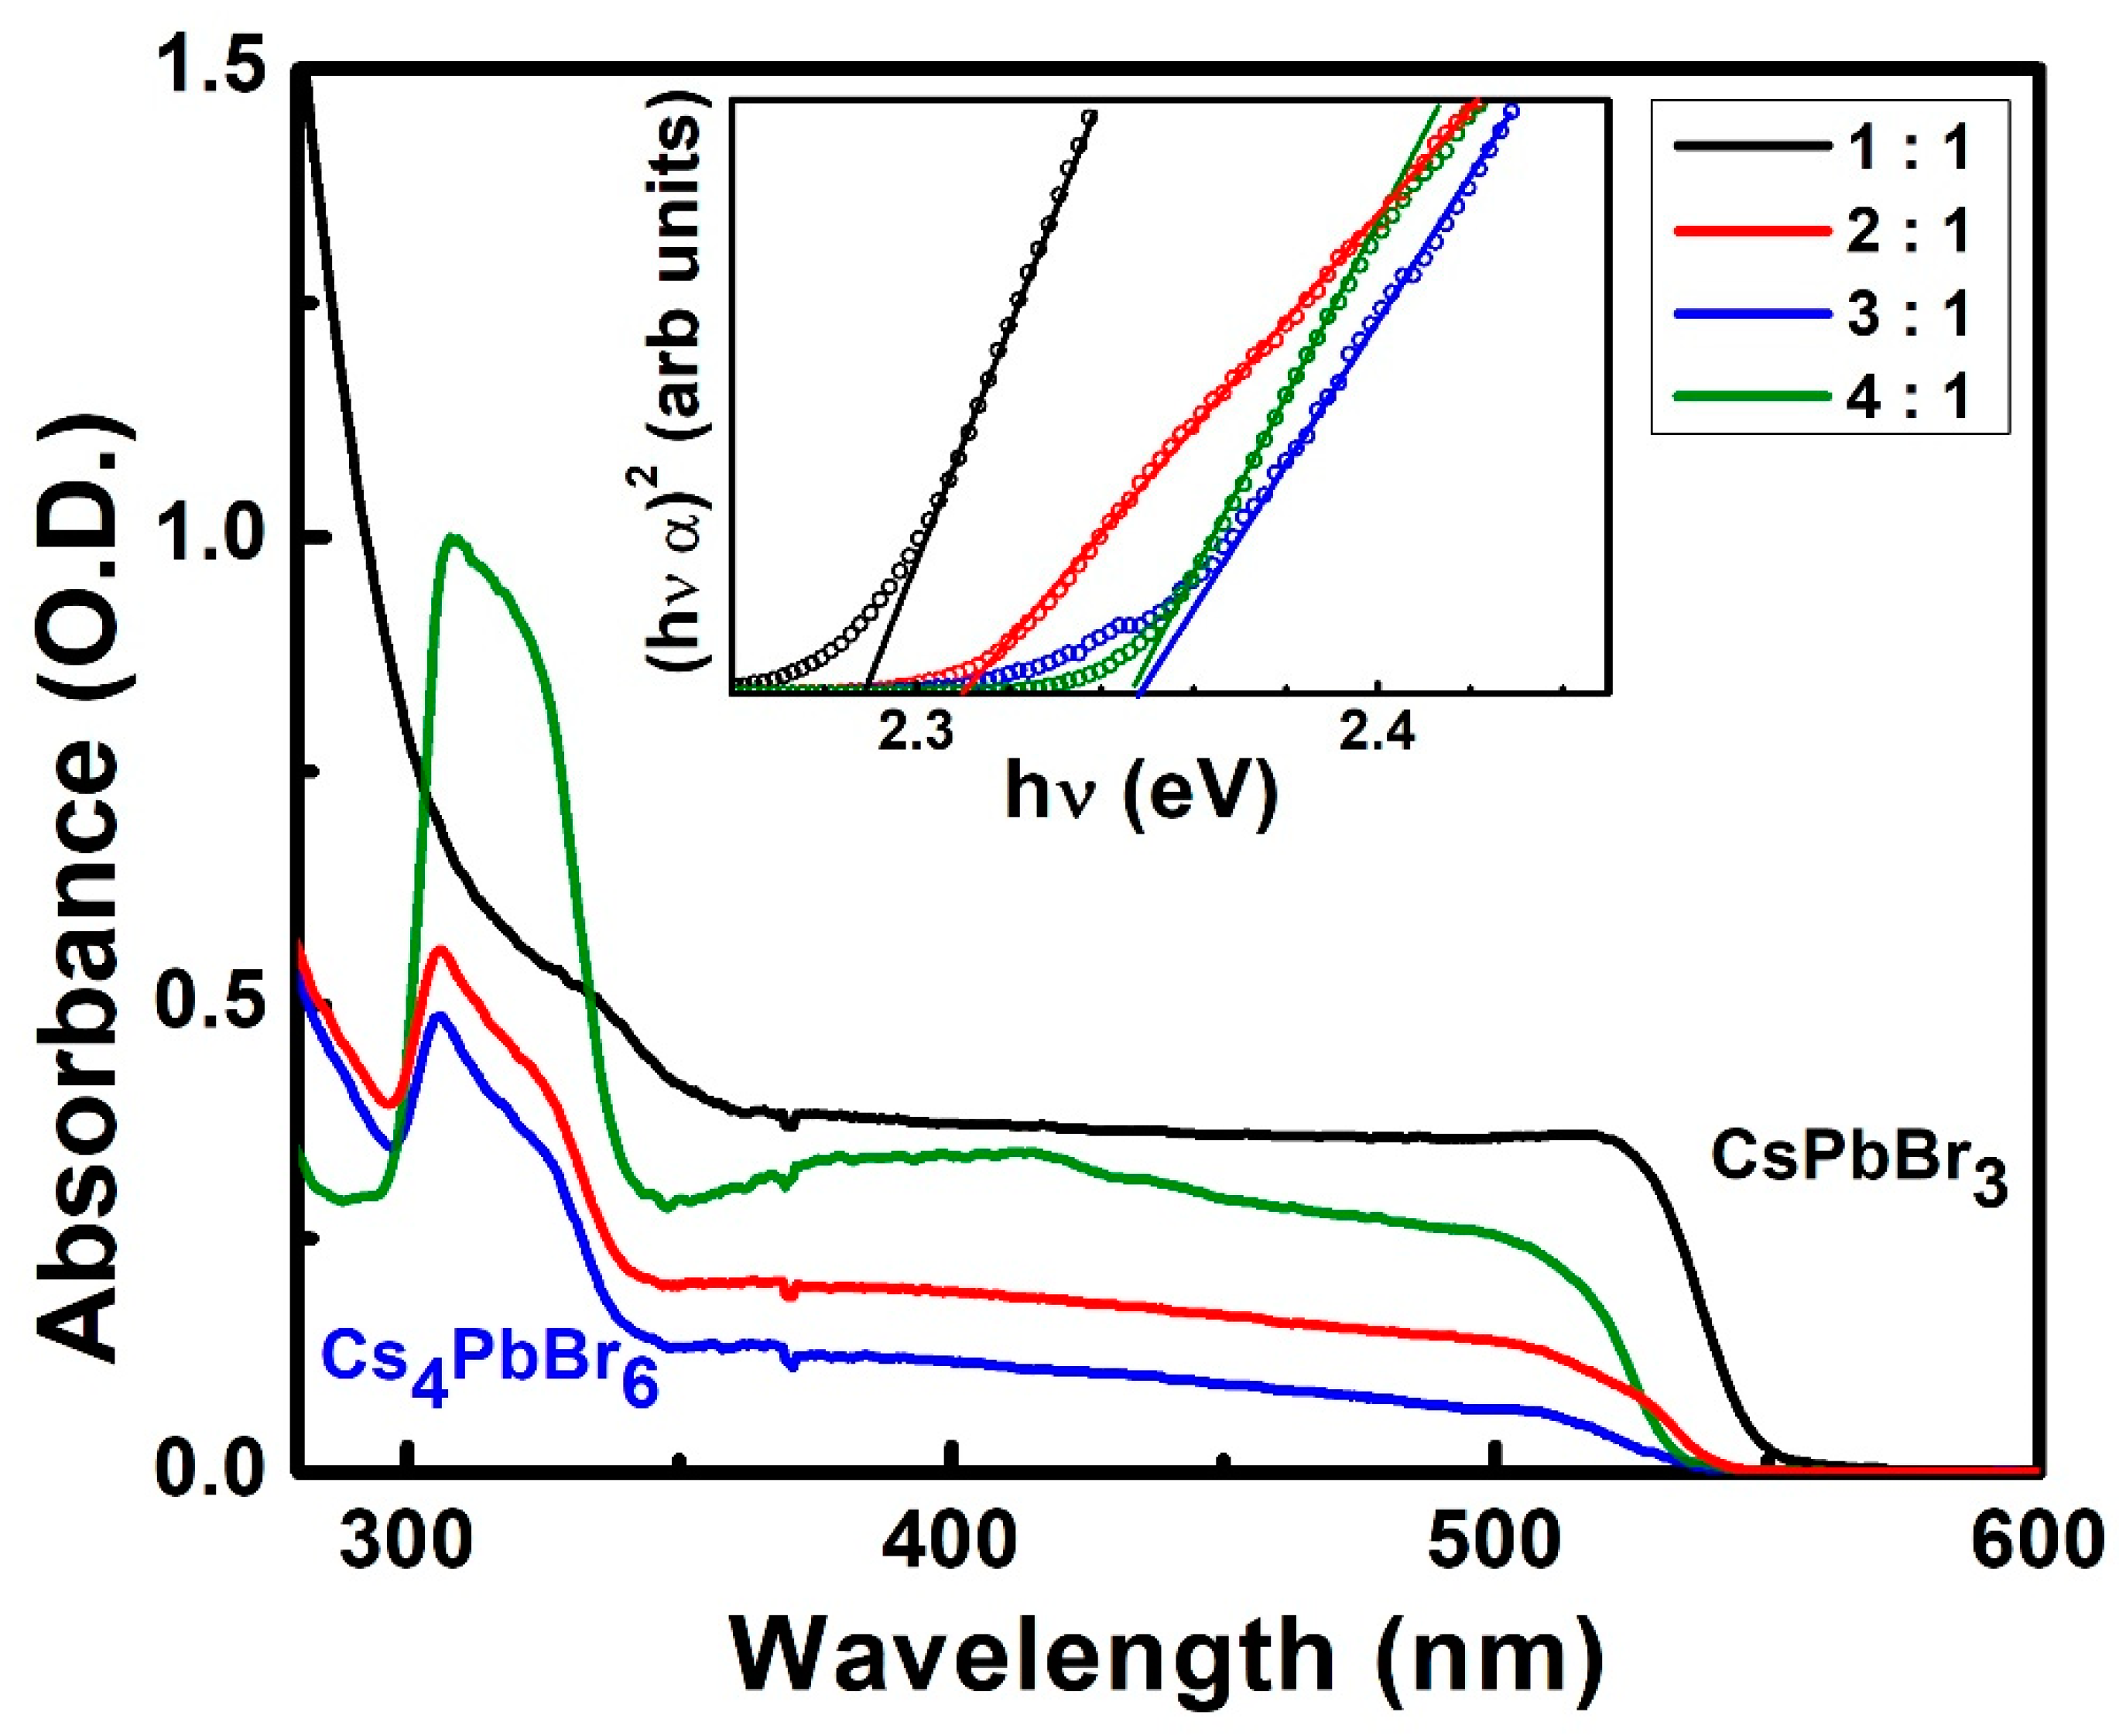
| Sample | Edge of Absorption | |
|---|---|---|
| (nm) | (eV) | |
| 1:1 | 541 | 2.29 |
| 2:1 | 537 | 2.31 |
| 3:1 | 528 | 2.35 |
| 4:1 | 528 | 2.35 |
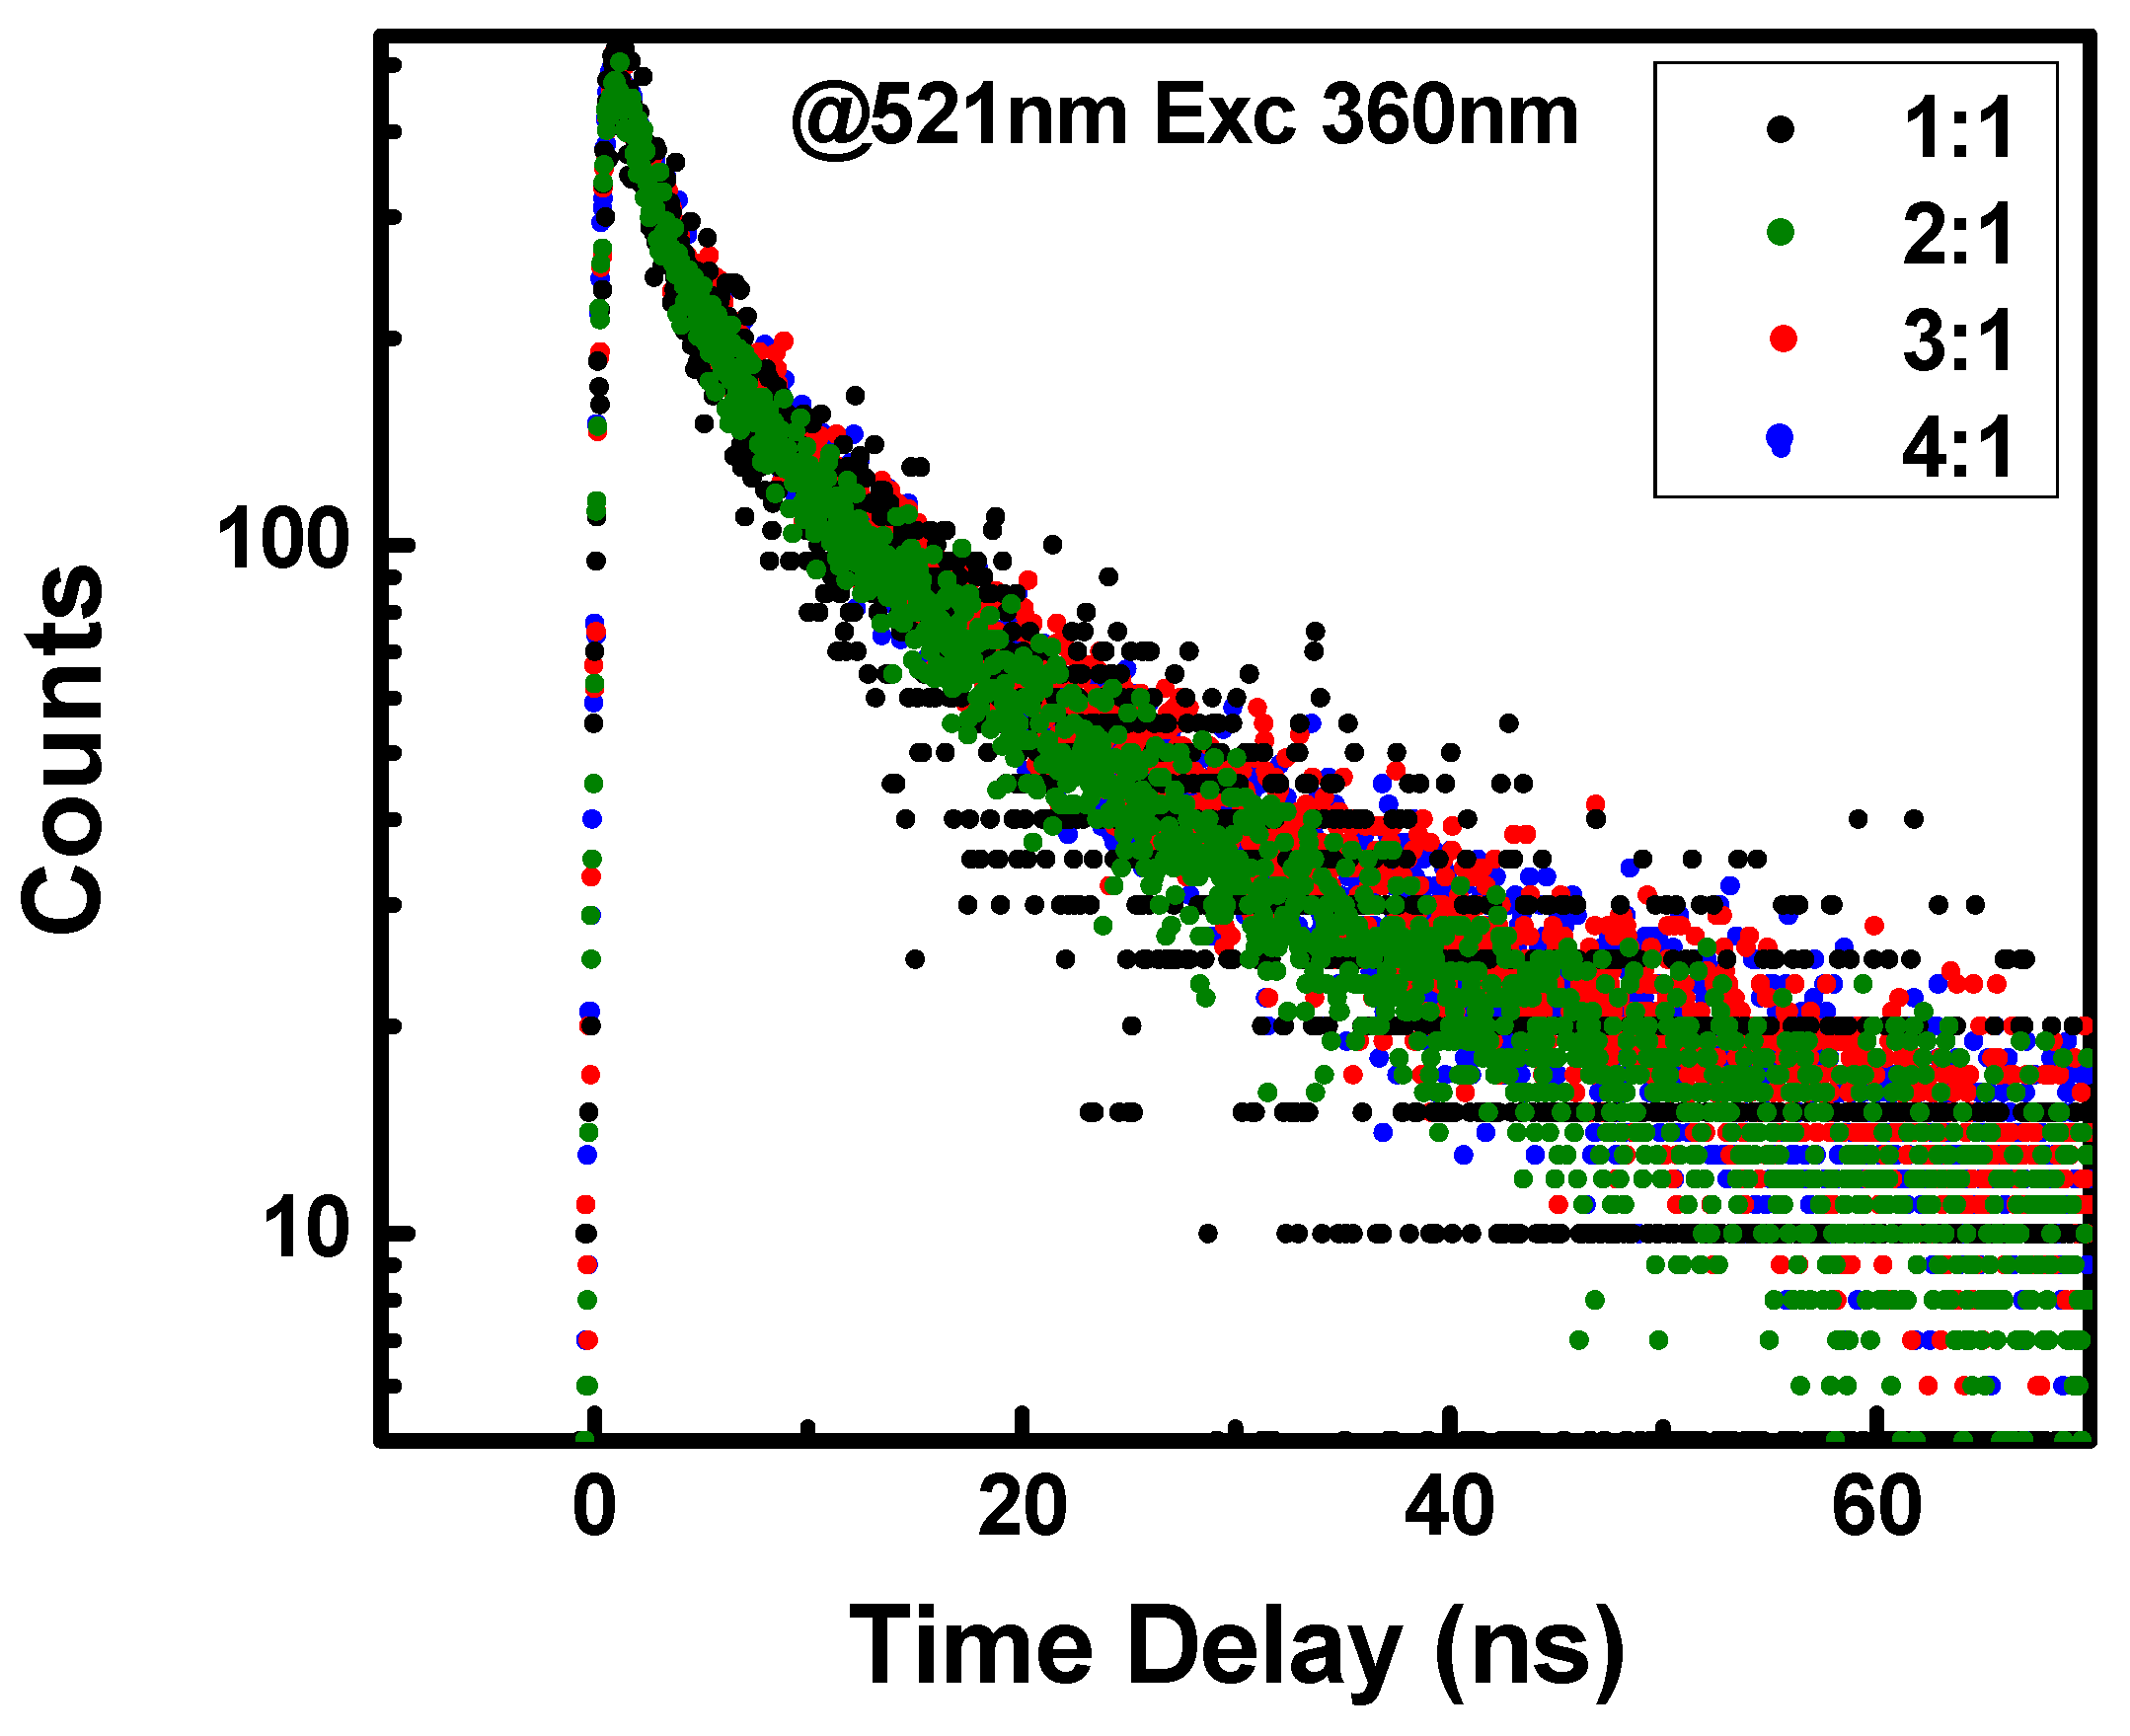
| Sample | τ1 (ns) | τ2 (ns) |
|---|---|---|
| 1:1 | 3.3 ns | 17.0 ns |
| 2:1 | 3.0 ns | 14.7 ns |
| 3:1 | 3.4 ns | 16.0 ns |
| 4:1 | 3.3 ns | 15.1 ns |
© 2019 by the authors. Licensee MDPI, Basel, Switzerland. This article is an open access article distributed under the terms and conditions of the Creative Commons Attribution (CC BY) license (http://creativecommons.org/licenses/by/4.0/).
Share and Cite
De Matteis, F.; Vitale, F.; Privitera, S.; Ciotta, E.; Pizzoferrato, R.; Generosi, A.; Paci, B.; Di Mario, L.; Pelli Cresi, J.S.; Martelli, F.; et al. Optical Characterization of Cesium Lead Bromide Perovskites. Crystals 2019, 9, 280. https://doi.org/10.3390/cryst9060280
De Matteis F, Vitale F, Privitera S, Ciotta E, Pizzoferrato R, Generosi A, Paci B, Di Mario L, Pelli Cresi JS, Martelli F, et al. Optical Characterization of Cesium Lead Bromide Perovskites. Crystals. 2019; 9(6):280. https://doi.org/10.3390/cryst9060280
Chicago/Turabian StyleDe Matteis, Fabio, Francesco Vitale, Simone Privitera, Erica Ciotta, Roberto Pizzoferrato, Amanda Generosi, Barbara Paci, Lorenzo Di Mario, Jacopo Stefano Pelli Cresi, Faustino Martelli, and et al. 2019. "Optical Characterization of Cesium Lead Bromide Perovskites" Crystals 9, no. 6: 280. https://doi.org/10.3390/cryst9060280
APA StyleDe Matteis, F., Vitale, F., Privitera, S., Ciotta, E., Pizzoferrato, R., Generosi, A., Paci, B., Di Mario, L., Pelli Cresi, J. S., Martelli, F., & Prosposito, P. (2019). Optical Characterization of Cesium Lead Bromide Perovskites. Crystals, 9(6), 280. https://doi.org/10.3390/cryst9060280