Article

Structure, Optical, and Thermal Properties of 9, 10-Diphenylanthracene Crystals

Institute of Nuclear Physics and Chemistry, China Academy of Engineering Physics, 919-215 Mail Box, Mianyang, Sichuan 621999, China
*
Author to whom correspondence should be addressed.
Crystals 2019, 9(10), 512; https://doi.org/10.3390/cryst9100512
Submission received: 28 July 2019 / Revised: 25 September 2019 / Accepted: 27 September 2019 / Published: 1 October 2019

Abstract

:
9,10-diphenylanthracene (DPA) single crystal is a promising scintillator material for fast-neutron detection. Two centimetre-sized polymorph crystals of DPA were grown by melting and solution methods (DPA-Melt and DPA-Solution, respectively), and characterised by single-crystal X-ray diffraction, Raman spectroscopy, Fourier-transform infrared spectroscopy, fluorescence spectroscopy, UV-Vis absorbance spectroscopy, and thermogravimetric/differential scanning calorimetry. The DPA-Melt crystal possessed a P21/n structure, with excitation bands at approximately 331, 348, 367, and 387 nm, and the strongest emission wavelength at approximately 454 nm. On the other hand, the DPA-Solution crystal possessed a C2/c structure, with excitation bands at approximately 335, 353, 372, and 396 nm, and the strongest emission wavelength at approximately 468 nm. The two kinds of DPA crystals have the same molecular formula but different crystal structures, crystal lattice constants, and cell parameters. The theoretical density of the DPA-Solution crystal was 1.239 g/cm3, while that of the DPA-Melt crystal was 1.211 g/cm3. The two types of crystals exhibited the same melting point, but the thermal stability of the DPA-Solution crystal is better than that of the DPA-Melt crystal.

1. Introduction

Neutron radiation sites often possess a large number of gamma rays. The ability to efficiently detect low levels of high-energy neutrons in a strong gamma ray background is crucial for nuclear non-proliferation and detection of illicit nuclear materials. Since fast neutrons strongly signify the presence of fissile materials, such as plutonium and highly-enriched uranium, their detection is very important [1]. Currently, fast neutrons are mainly detected using organic scintillator detectors, which are employed not only because of their high content of hydrogen that allows neutron detection via proton recoil, but also because of their ability to discriminate neutrons and gamma rays using pulse shape discrimination (PSD). In the past decades, single-crystal stilbene has proven to be the most effective material for discrimination [2,3,4]. However, trans-stilbene cannot be applied at higher temperature conditions due to a lower melting point (124 °C). Researchers have been working on low-cost crystal growth methods and stilbene alternatives [5,6,7]. Research results from the Lawrence Livermore National Laboratory of America show that 9, 10-diphenylanthracene (DPA) has a higher light yield than stilbene for heavy particles [8,9]. Moreover, the melting point of DPA is more than 120 °C higher than that of stilbene. DPA is more stable at room temperature and can be used as a scintillator in a wider temperature range. Because DPA has excellent neutron/gamma discrimination, high light yield, fast scintillation decay, and good thermal stability, it will become a promising fast-neutron detection material once large crystals can be grown. However, research on DPA is relatively scarce; its properties have not been studied deeply, the technology of its growth is still not mature, and research on its performance is not adequately comprehensive.
Loef et al. [8,10] have reported the luminescence spectra of DPA crystals and the time spectra of scintillation attenuation of neutrons and γ-rays. However, only one crystal obtained by the Bridgman technique has been studied in detail. Ren [11] obtained a micron-sized DPA crystal from silica gel and phenyl-modified silica gel, and explored the interaction between the gel networks and the crystal in three-dimensional space. Salzillo et al. [12] studied the properties of a micrometre-sized DPA crystal. The difference between micrometre crystals and ordinary bulk crystals is analysed by Raman and X-ray diffraction. As the structure and the properties of the crystals prepared by different methods are different, crystals with better performance can be selected only by studying the differences between them in detail. Subsequently, the application conditions more suitable for the crystals can be designed, so that the discrimination efficiency of the crystals is improved. Most of the researches currently focus on the properties of one kind of DPA, without focusing on the performance comparison between different DPA polymorphic crystals, since an investigation on DPA polymorphism would require a more systematic study. In this study, two polymorphs of DPA crystals were grown by the solution method and the melting method. The crystal structure, optical properties, and thermal properties of the two kinds of crystals were systematically studied and compared.

2. Experimental Methods

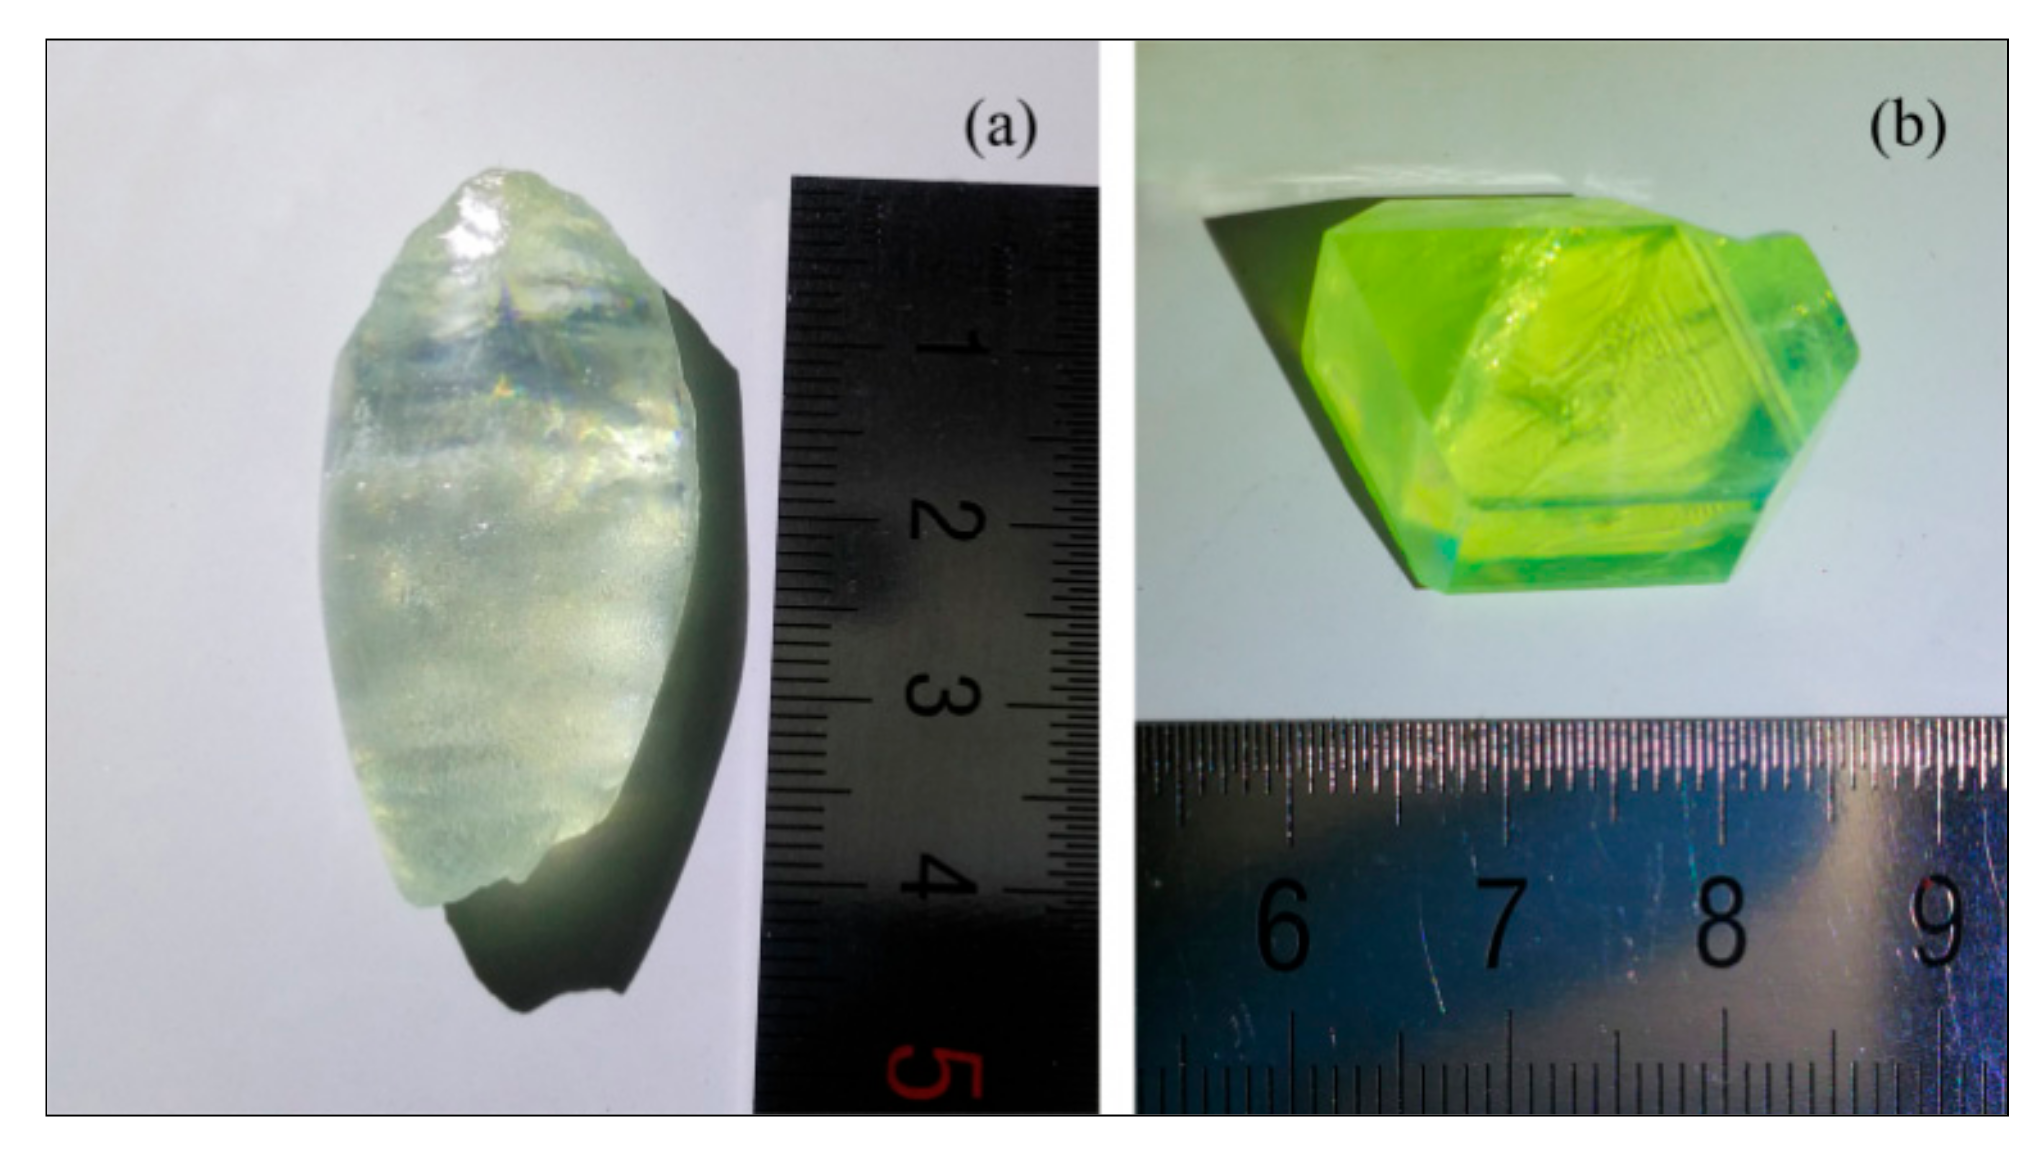
2.1. Growth of DPA Crystals

The DPA crystals were grown by the melt method and the solution method (hereafter referred to as DPA-Melt and DPA-Solution, respectively). DPA powder (purity >98%, Shanghai Aladdin biochemical Technology Co., Ltd., Shanghai, China) was used as the starting material without further purification. The DPA crystal was prepared by the melt method according to the following procedure: (1) DPA powders were loaded into a double-walled quartz glass ampoule (Chengdu Haihong Experimental instrument Co., Ltd., Chengdu, China); the lower end of the inner tube had a capillary of diameter ~1 mm. (2) The ampoule was evacuated to 10−3 Pa, then filled with high purity nitrogen and kept for 15 min. Subsequently, a vacuum of 10−2 Pa was maintained. After repeating the above operation three times, the ampoule was sealed when the vacuum reached ~10−3 Pa. (3) The ampoule was placed in a vertical Bridgman furnace (Fuzhou Keres Test equipment Co., Ltd., Fuzhou, China). (4) The DPA powders were melted at ~258 °C for two days. Subsequently, the ampoule was moved slowly from the top oven to the lower oven, which was at a lower temperature, at a rate of 0.3−1.2 mm/h. The resulting DPA-Melt crystal was colourless and transparent.
The solution method for the preparation of the DPA crystal is as follows: (1) A saturated solution of DPA was prepared in toluene(Tianjin Kemiou Chemical Reagent Co.,Ltd, Tianjin, China) at ~56 °C in a quartz glass crystalliser(Chengdu Haihong Experimental instrument Co., Ltd., Chengdu, China). (2) The solution was heated to a temperature a few degrees higher than the saturation temperature, following which the crystal seeds were added into the solution. (3) The temperature of the solution was reduced at a rate of 0.12 °C/h to ~20 °C. The crystal was then obtained after a dozen days. The DPA-Solution crystal was light-yellow and transparent. Figure 1 shows the photographs of both the DPA crystals.

2.2. Characterisation of DPA Crystals

Single-crystal X-ray diffraction analysis was performed with an Oxford Xcalibur Eos diffractometer (Renishaw, Wotton-under-Edge, UK) using Mo-Kα radiation (λ = 0.71073 Å). The crystal was maintained at 293(2) K during data collection. Using Olex2 [13], the structure was solved with the XS [14] structure solution program using direct methods and refined with the ShelXL [15] refinement package using least squares minimisation. Raman spectra were recorded in the range of 2000−300 cm−1 on the surface of DPA crystals on a Renishaw inVia Raman Microscope (Renishaw, Wotton-under-Edge, UK). Raman excitation was performed using a laser tuned at 785 nm. The fluorescence spectra of the DPA crystals were recorded with an Edinburgh instruments FLSP920 fluorescence spectrometer (Edinburgh Instruments Ltd., Livingston, UK). The excitation source was a Xe lamp. The UV-Vis absorption spectra of the crystals were obtained with a Shimadzu SolidSpec-3700 UV-Vis-NIR-spectrophotometer (Shimadzu Corp., Kyoto, Japan). The partial DPA-Melt crystal and the entire DPA-Solution crystal were fixed on the sample rack with double-sided adhesive tape and then the transmission UV-Vis spectra were tested. The IR transmission spectra were recorded in the range of 2000−400 cm−1 on a Thermo fisher NICOLET 6700 Fourier-transform infrared spectrometer (Thermo Fisher Scientific Inc., Waltham, MA, USA). The infrared spectra were determined by solid pressing method: Cut a small piece of crystal from a big crystal, add potassium bromide powder, grind evenly and press the sheet, and then determine its infrared spectrum. Thermogravimetric (TG) and differential scanning calorimetry (DSC) data were recorded on a NETZSCH STA 449C instrument (NETZSCH-Gerätebau GmbH, Selb, Germany). The samples (~3 mg) were placed in alumina crucibles and heated from room temperature to 500 °C at a heating rate of 5 °C/min under N2 atmosphere (30 mL/min).

3. Results and Discussion

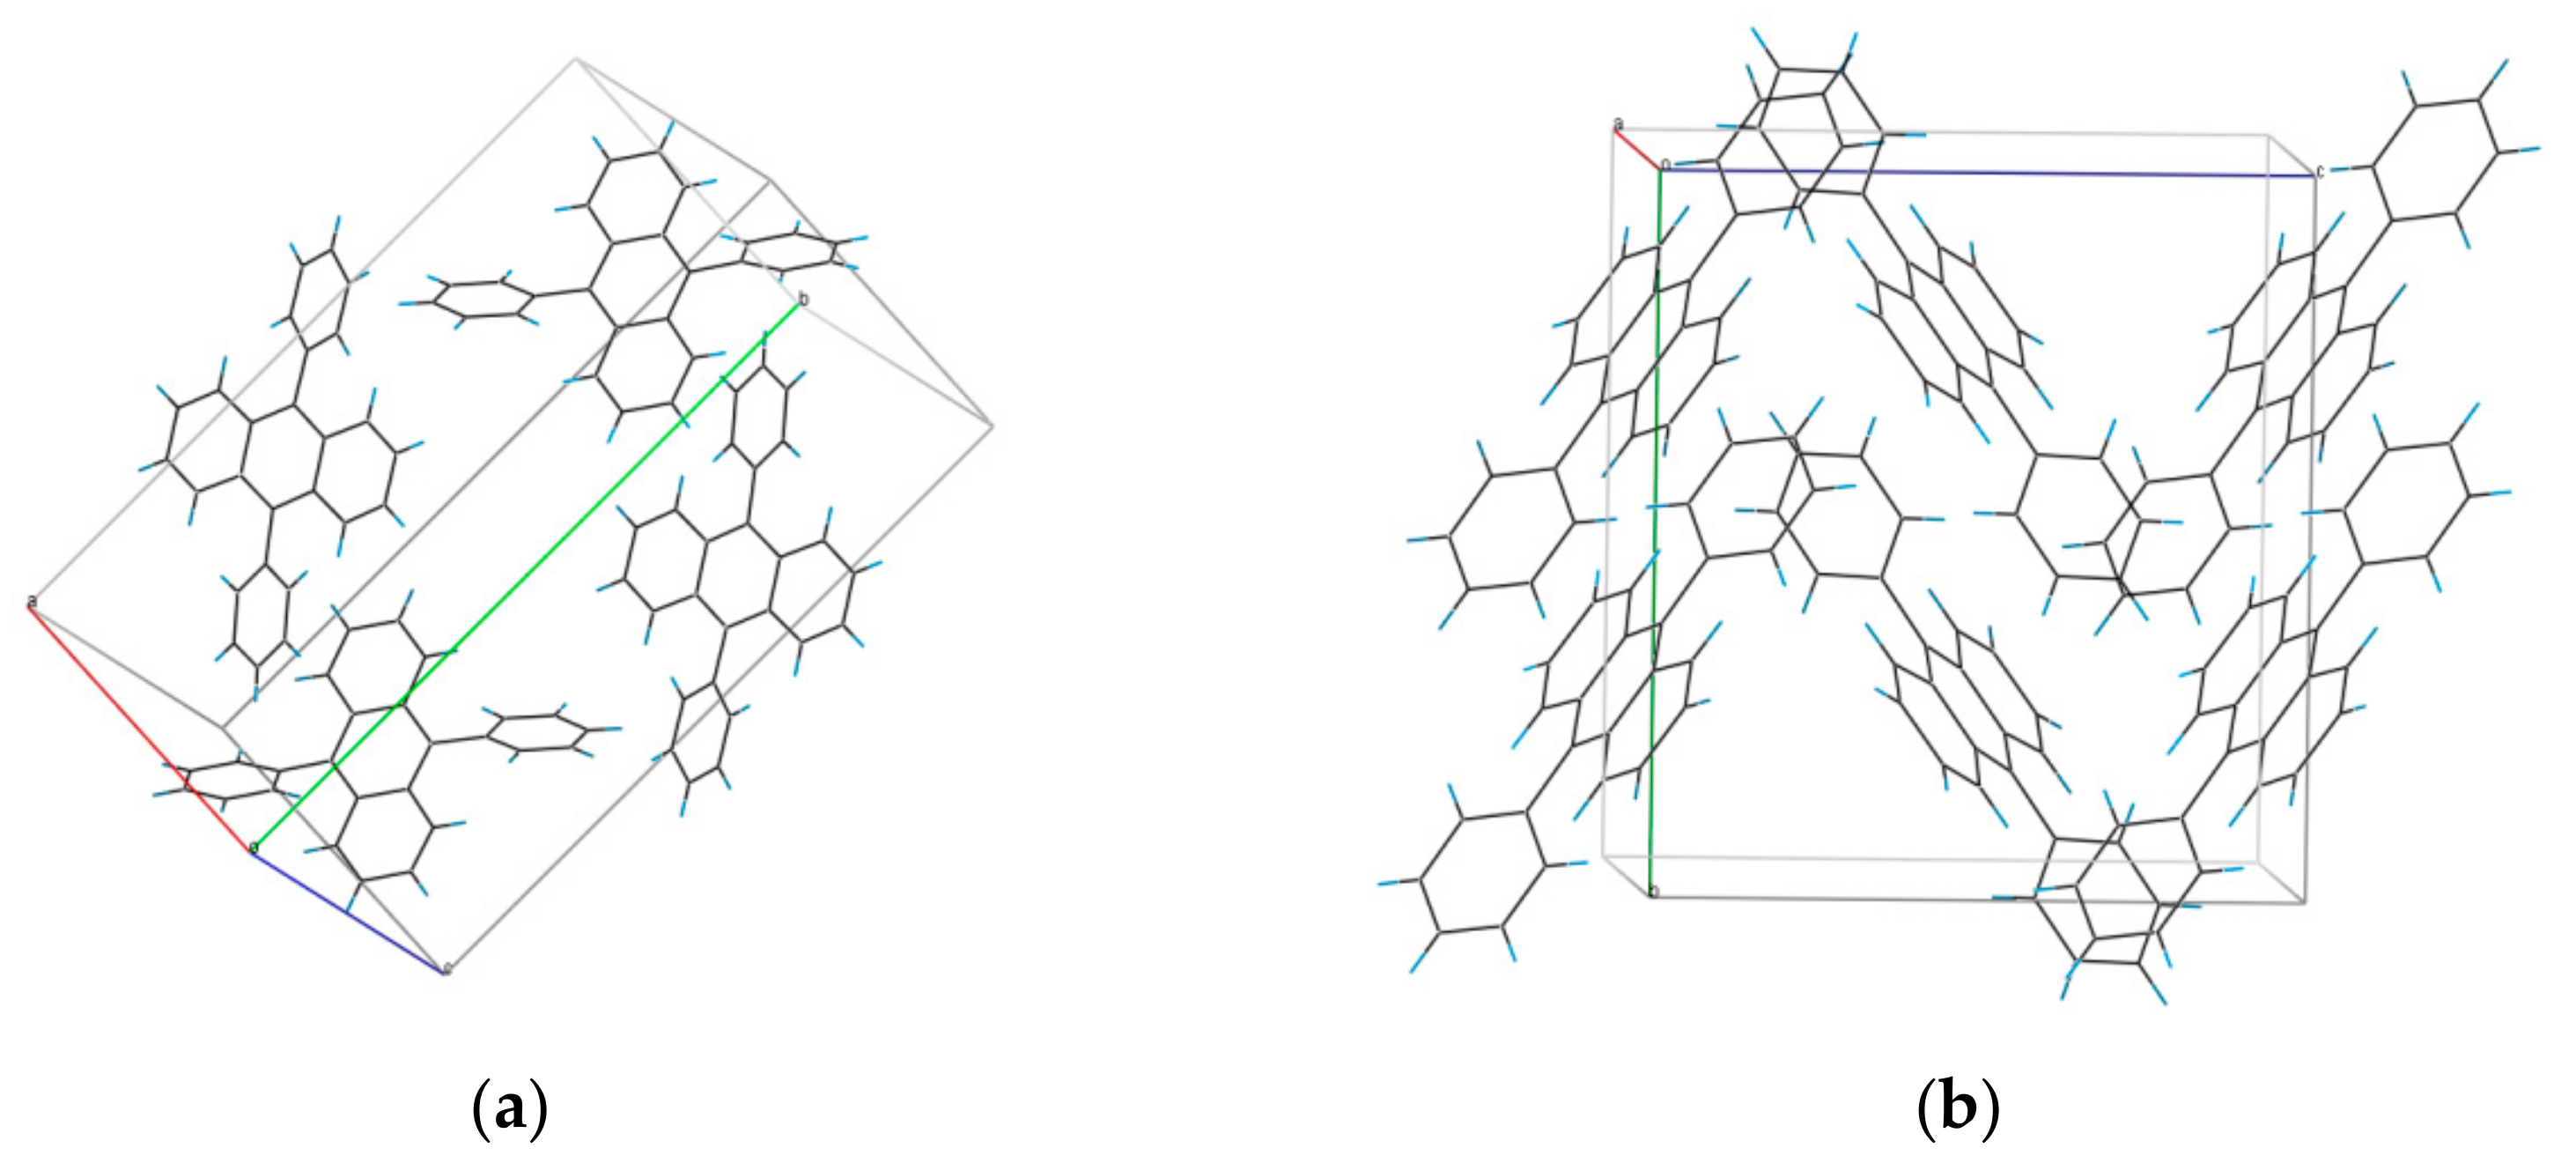
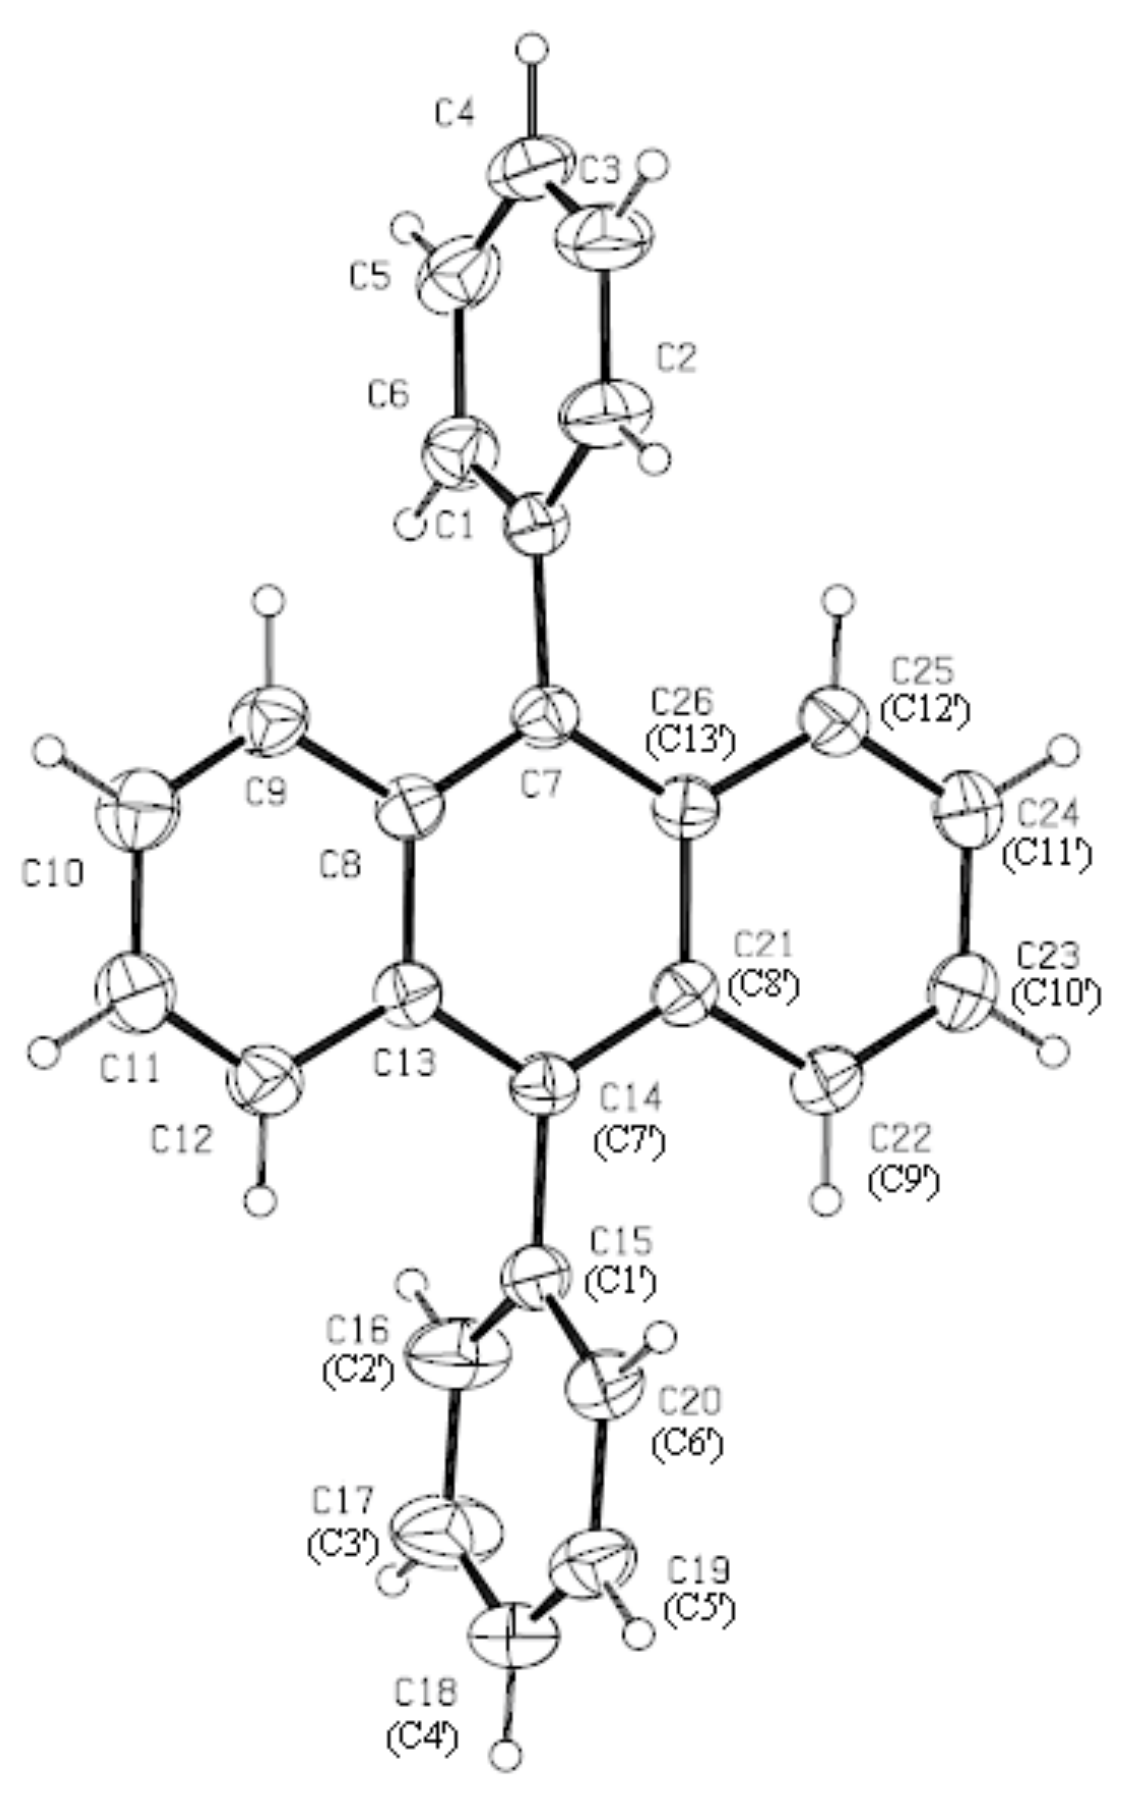
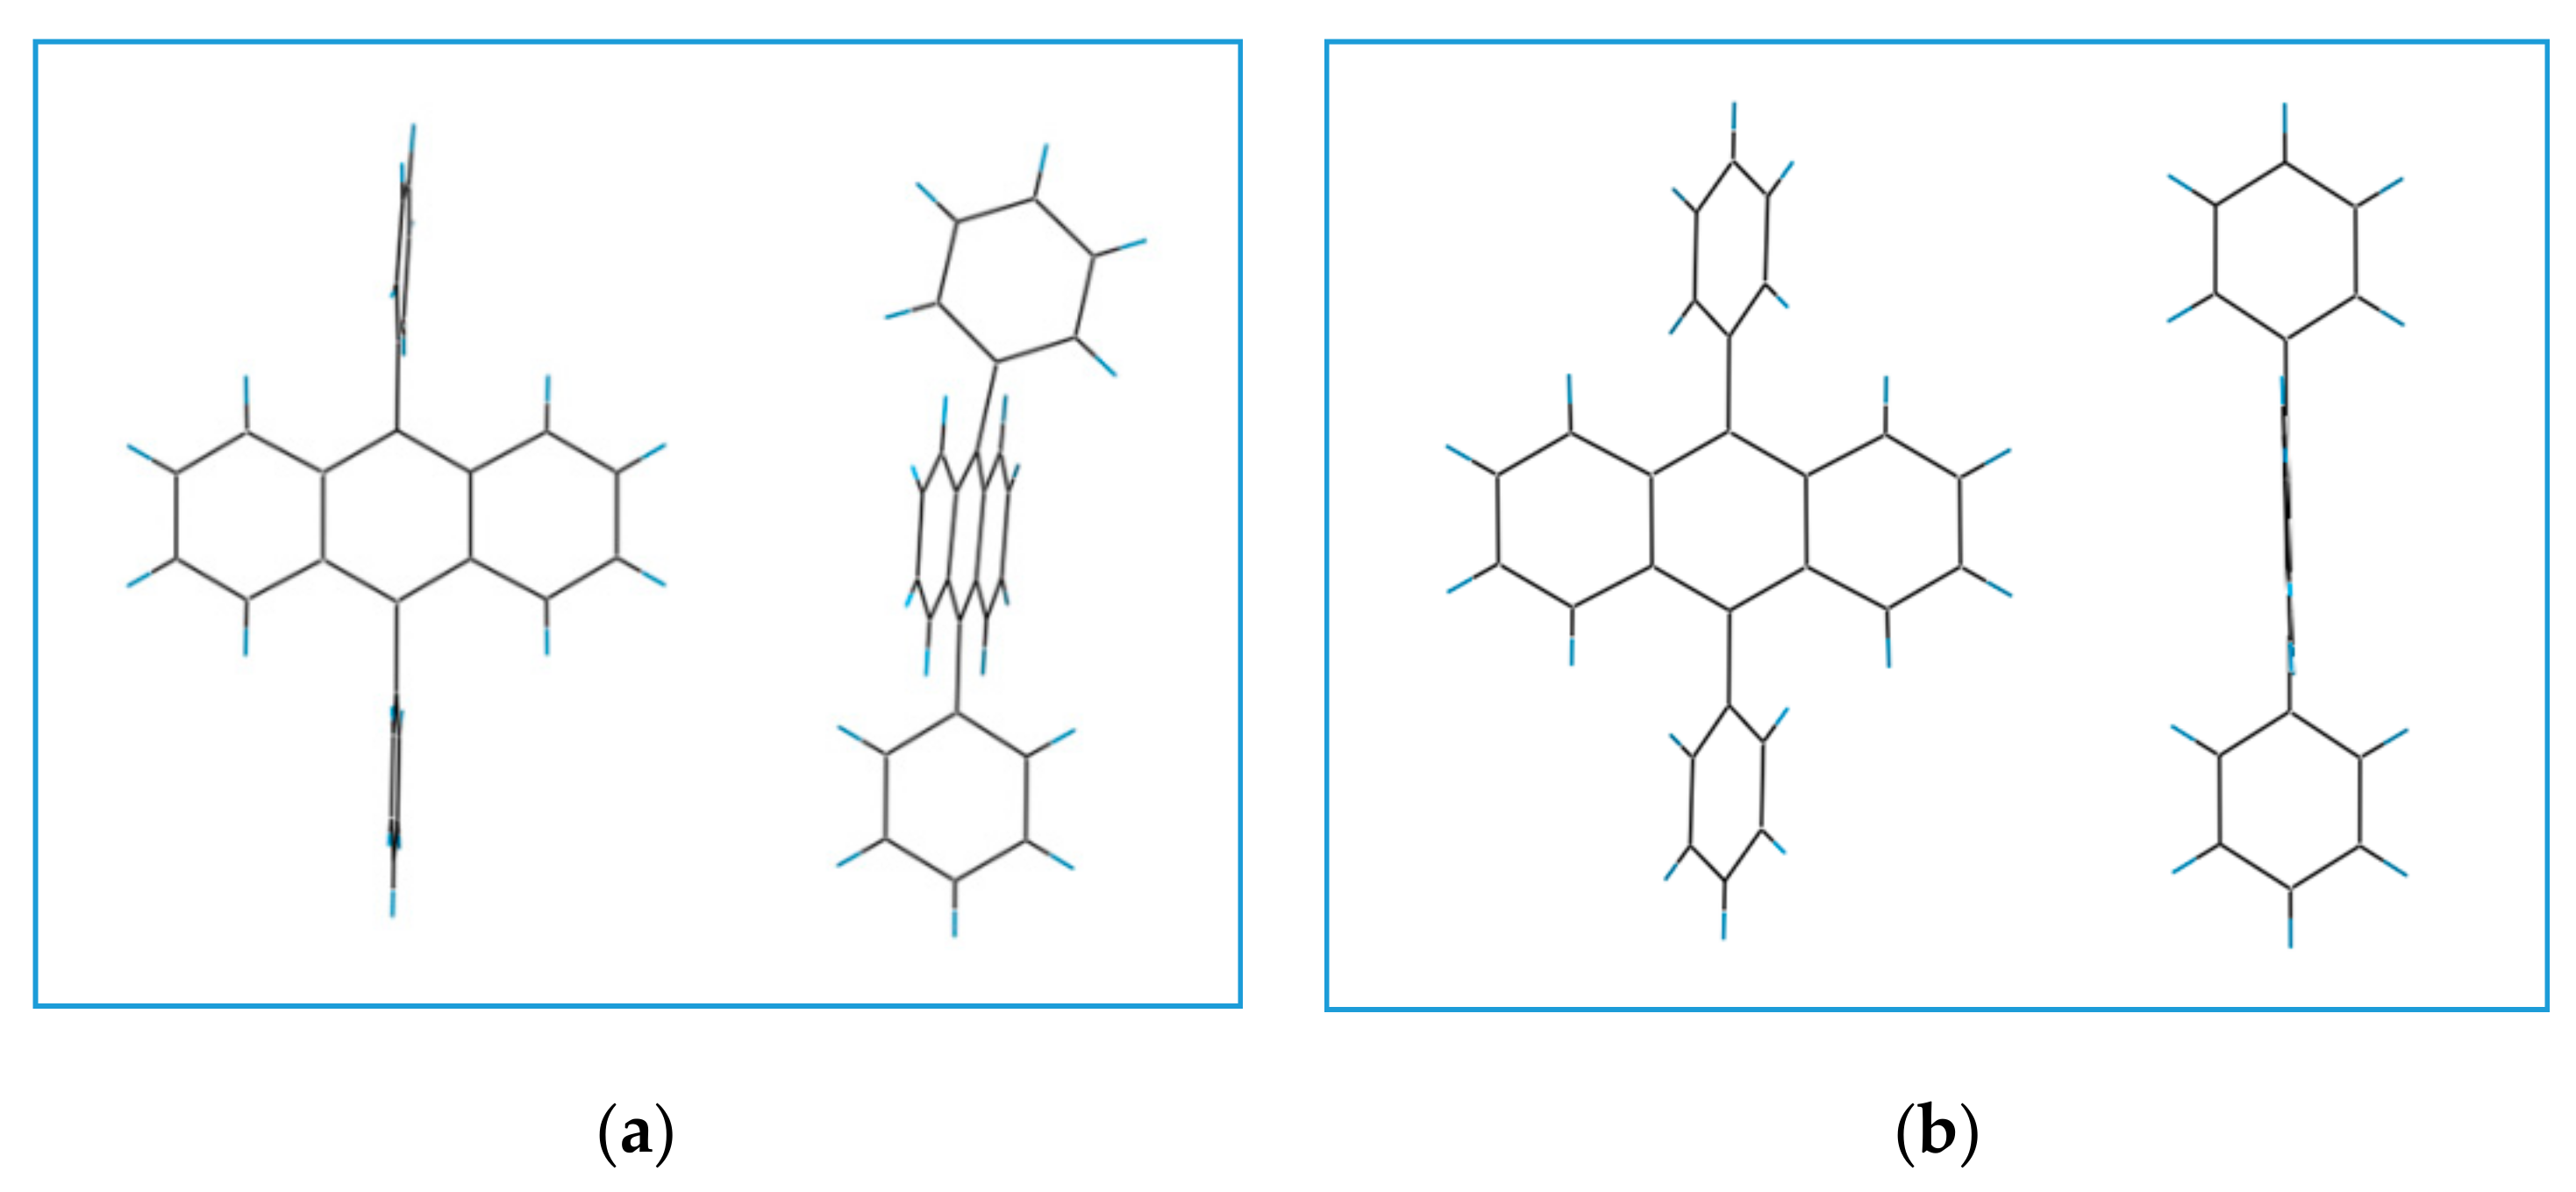
3.1. Structure of DPA Crystals

The unit cells of DPA-Melt and DPA-Solution are shown in Figure 2a,b, respectively, and their crystallographic data are presented in Table 1. The DPA-Melt crystal possesses the P21/n structure, whereas the DPA-Solution crystal possesses the C2/c structure. The structures of the DPA-Melt crystal and the DPA-Solution crystal are the same as the γ-DPA and α-DPA, respectively, reported by Salzillo et al. [12]. The results reported by Salzillo come from the test results of micron crystals. Compared with the results of Salzillo, the cell volume of γ-DPA and α-DPA crystal in this paper is smaller, the β angle and the crystal density are larger. These differences are not only related to the measurement error of the instrument, but also to the size of the crystal. The molecule has crystallographically-imposed centrosymmetry. In the DPA-Melt crystal, the full molecule constitutes the asymmetric unit, while in the DPA-Solution crystal, only half of the molecule constitutes the asymmetric unit because it is centrally symmetric. For comparison, each atom is numbered, as shown in Figure 3.
The torsion angle data of the DPA crystals is shown in Table 2. The dihedral angle between the phenyl and the anthracene groups is 87.5−93.1°, close to 90°. The unit cell of the DPA-Solution crystal is smaller than that of the DPA-Melt crystal. The C1–C13 and the C14–C26 moieties of the molecule are related by centre of symmetry. The dihedral angle between the phenyl and the anthracene groups is 66.18−67.5°. This angle is consistent with that of the DPA crystal grown in xylene [16]. The theoretical density of the DPA-Solution crystal is 1.239 g/cm3, while that of the DPA-Melt crystal is 1.211 g/cm3. The cell volume of the DPA-Melt crystal is bigger than that of the DPA-Solution crystal. The lower density of the DPA-Melt crystal may be related to the sparse arrangement of the molecules because it has a larger unit cell.

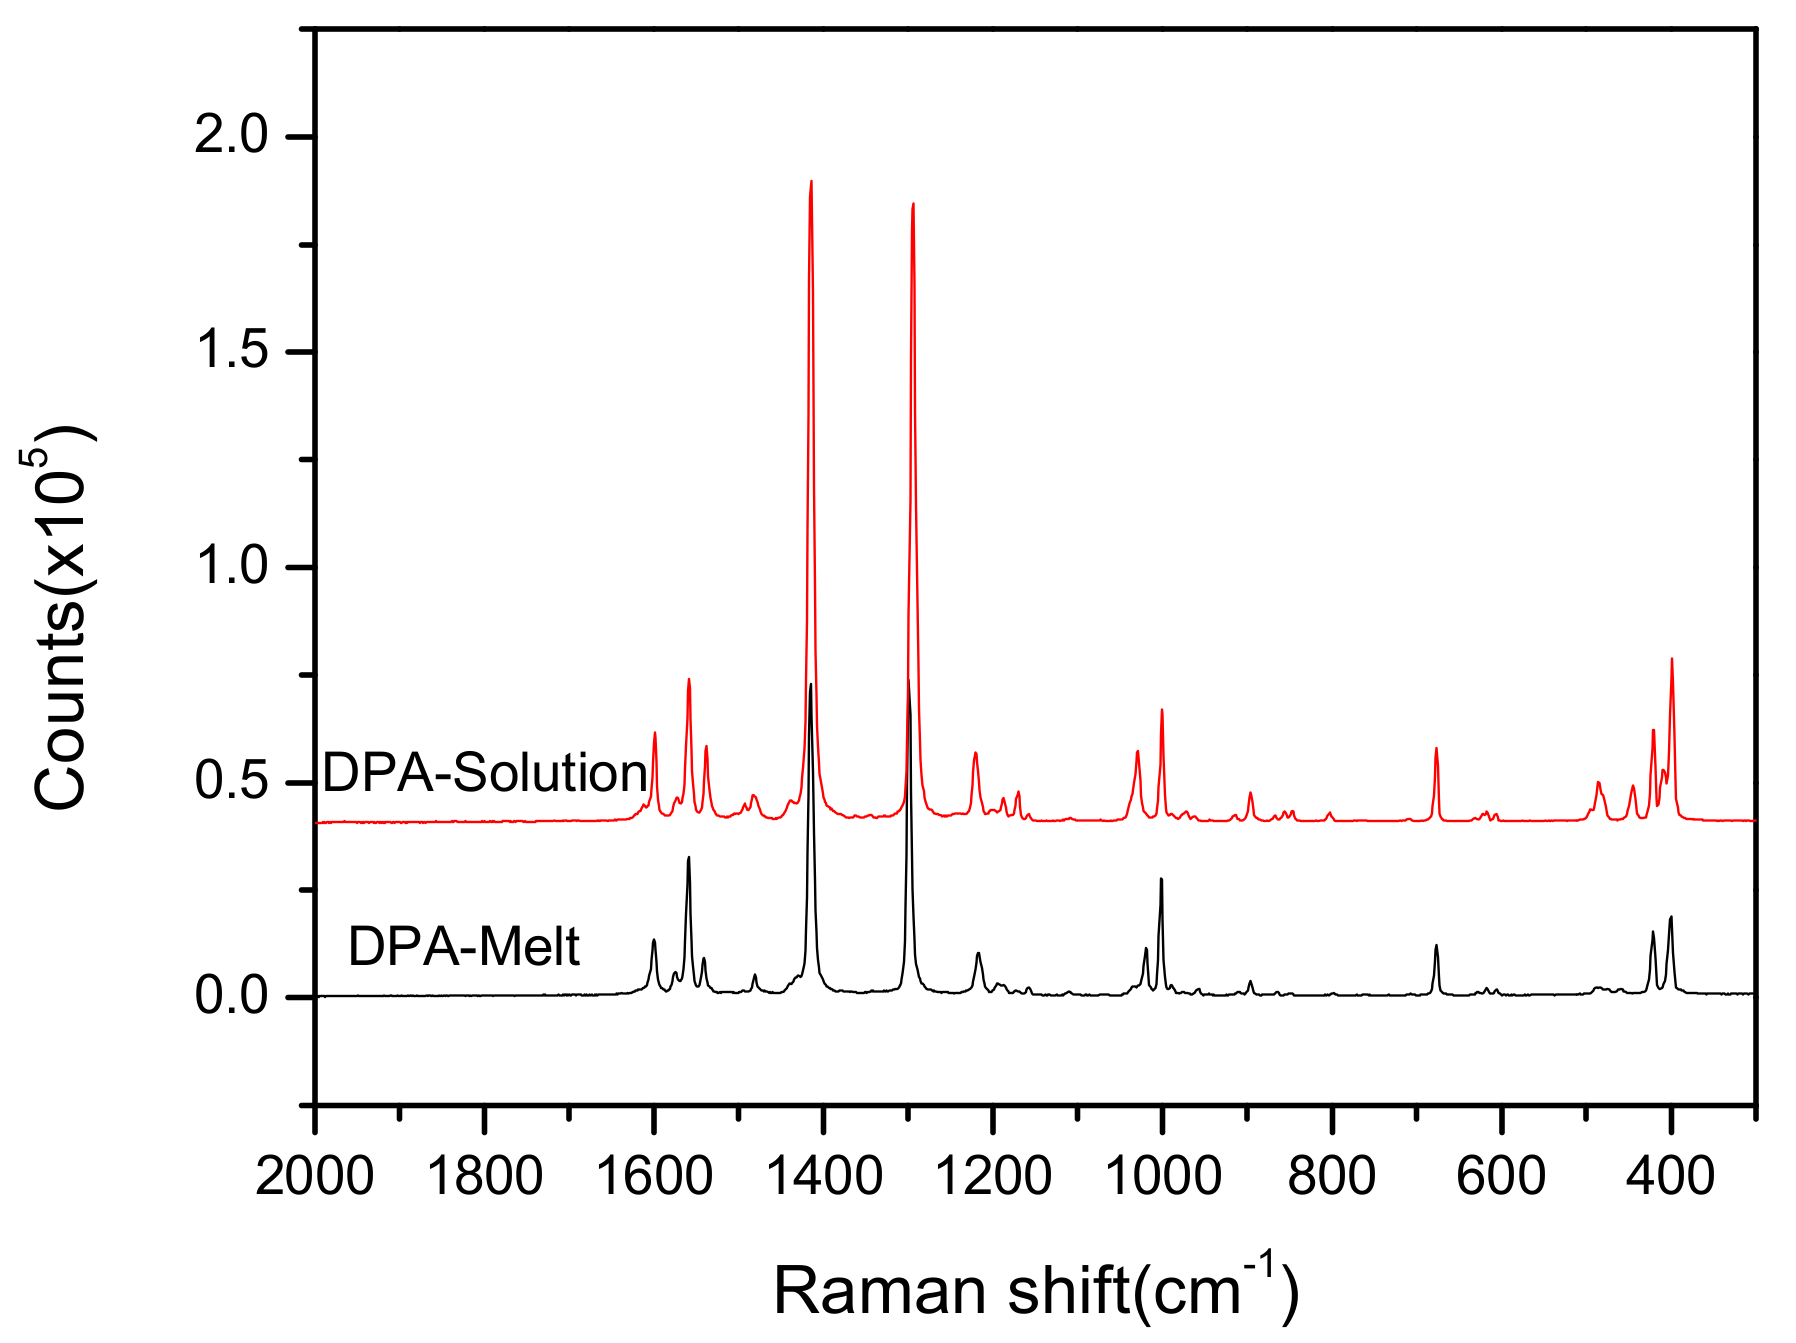
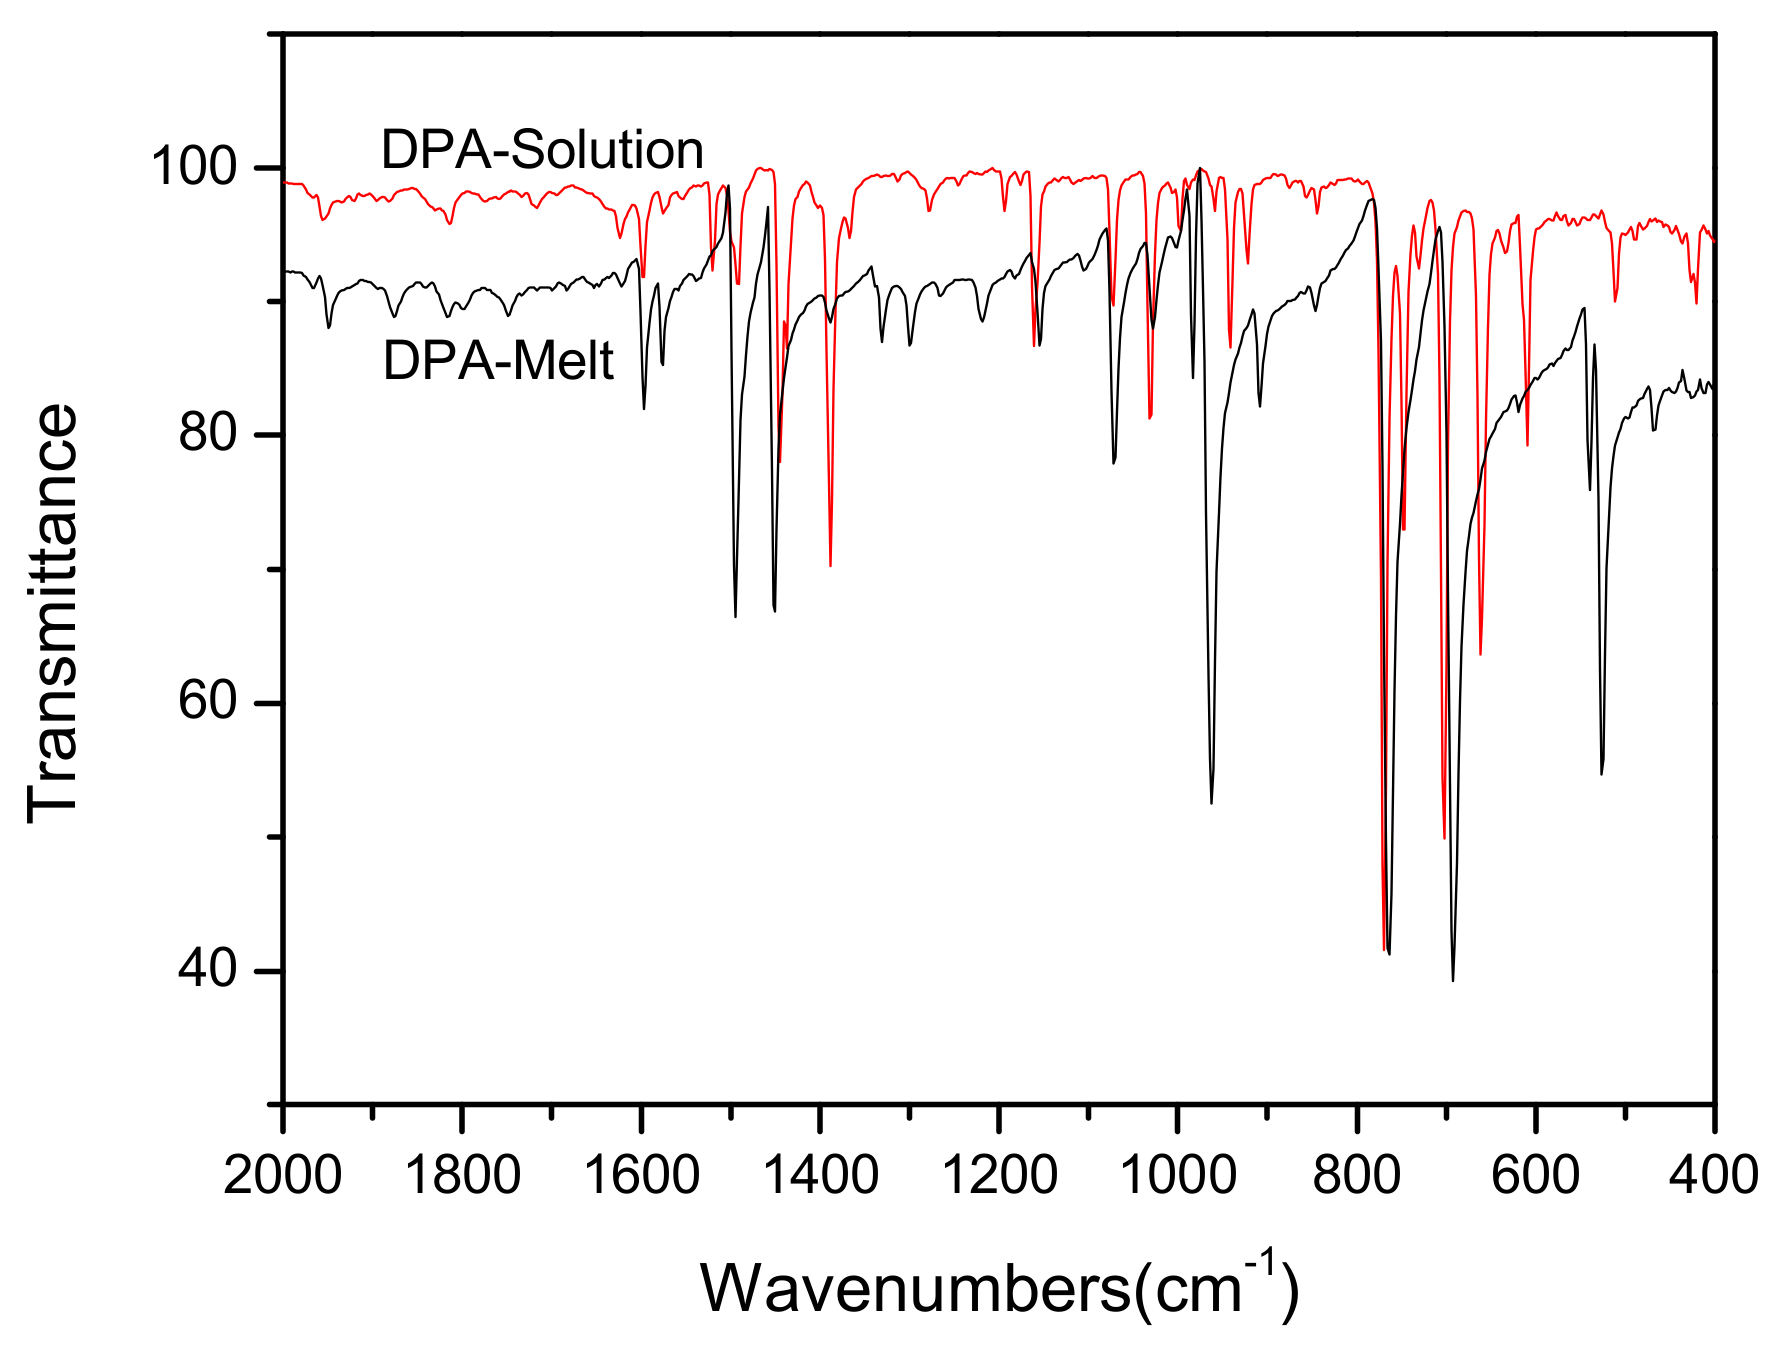
3.2. Analysis of Raman and IR Spectra

Figure 4 shows the Raman spectra of the DPA crystals in the range of 2000−300 cm−1. Figure 5 shows the typical infrared spectra of the DPA crystals in the range of 2000−400 cm−1. The Raman spectra show very strong absorption bands at 1414 and 1294 cm−1, which are respectively attributed to the stretching vibrations of the anthracene framework loop [17] and the CC bridge bond between the benzene rings, which is invisible in the Raman spectra of pure anthracene and benzene [17,18].
Some moderately strong absorption bands are also observed in the Raman spectra. The absorption peaks at 1630−1350 cm−1 are attributed to the CC skeleton vibrations of phenyl and anthryl groups [19,20]. The absorption peaks at 1120−1010 cm−1 correspond to the in-plane bending vibrations of monosubstituted benzene. These absorption peaks also exist in the Raman spectra of toluene [21]. The absorption peak at 1001 cm−1 originates from the symmetric stretching vibrations of the benzene ring. The absorption peaks at 680−660 cm−1 may be attributed to the breathing vibrations of substituted anthracycline compounds, which do not exist in the Raman spectra of anthracene and toluene [17]. The absorption peaks at wavenumbers <700 cm−1 arise from the CC deformed vibrations bending off the plane of the benzene ring and anthracycline [22].
The Raman spectra and the infrared spectra of the two kinds of crystals are significantly different. In the Raman spectra, there is a distinct difference between DPA-Melt and DPA-Solution in the wavenumber ranges of 1200−1010 cm−1 and 490−400 cm−1. DPA-Melt exhibits a Raman peak at 1020 cm−1, whereas DPA-Solution exhibits a Raman peak at 1029 cm−1. Unlike DPA-Melt, DPA-Solution also exhibits a Raman peak at 445 cm−1. In the IR spectrum, the intensity of the absorption peak of the DPA-Melt crystal at 1494, 963, and 525 cm−1 is stronger than that of the DPA-Solution crystal.
The characteristic frequency of a group is related to the chemical environment in which the group is located in the molecule. The vibration of each group in the molecule is affected by the other groups within the molecule, and hence, the vibrational frequency of the group varies. As the crystal structure of the two crystals and the space environment of the molecules are different, the spatial conformation of the molecules is also quite different. The typical spatial structure is shown in Figure 6. The angle between the benzene ring and the anthracene skeleton of the DPA molecule is different for DPA-Melt and DPA-Solution; from the results of single-crystal diffraction, it is ~90° in the DPA-Melt crystal, but ~67° in the DPA-Solution crystal. Owing to this difference, the ring respiration and the CH in-plane-deformed ring vibration environment of the benzene ring are different, resulting in changes in the molecular polarisability and the dipole moment. During molecular vibrations, a change in the molecular dipole moment affects the spectral peaks in the IR absorption spectrum, whereas a change in the molecular polarisability affects the intensity and the shift of the peaks in the Raman spectrum.

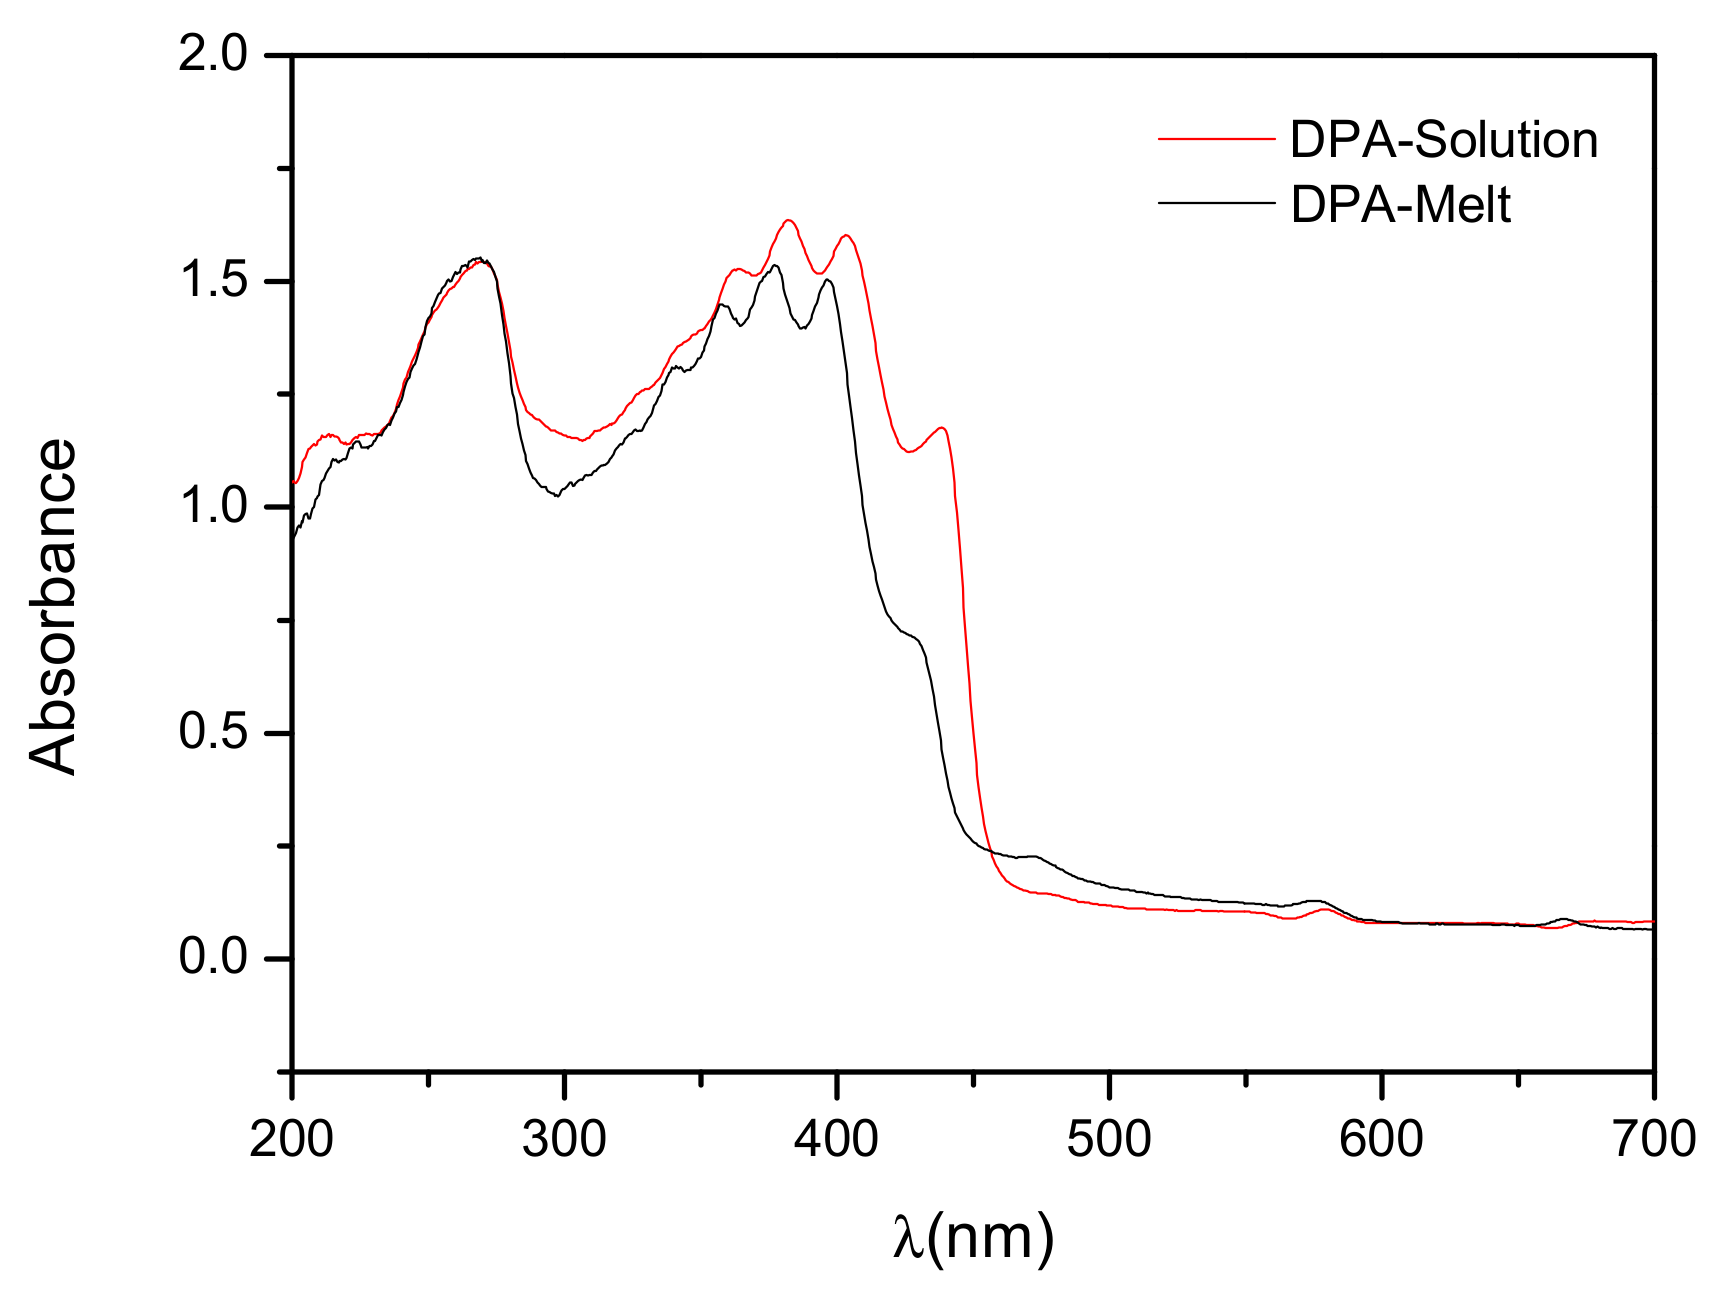
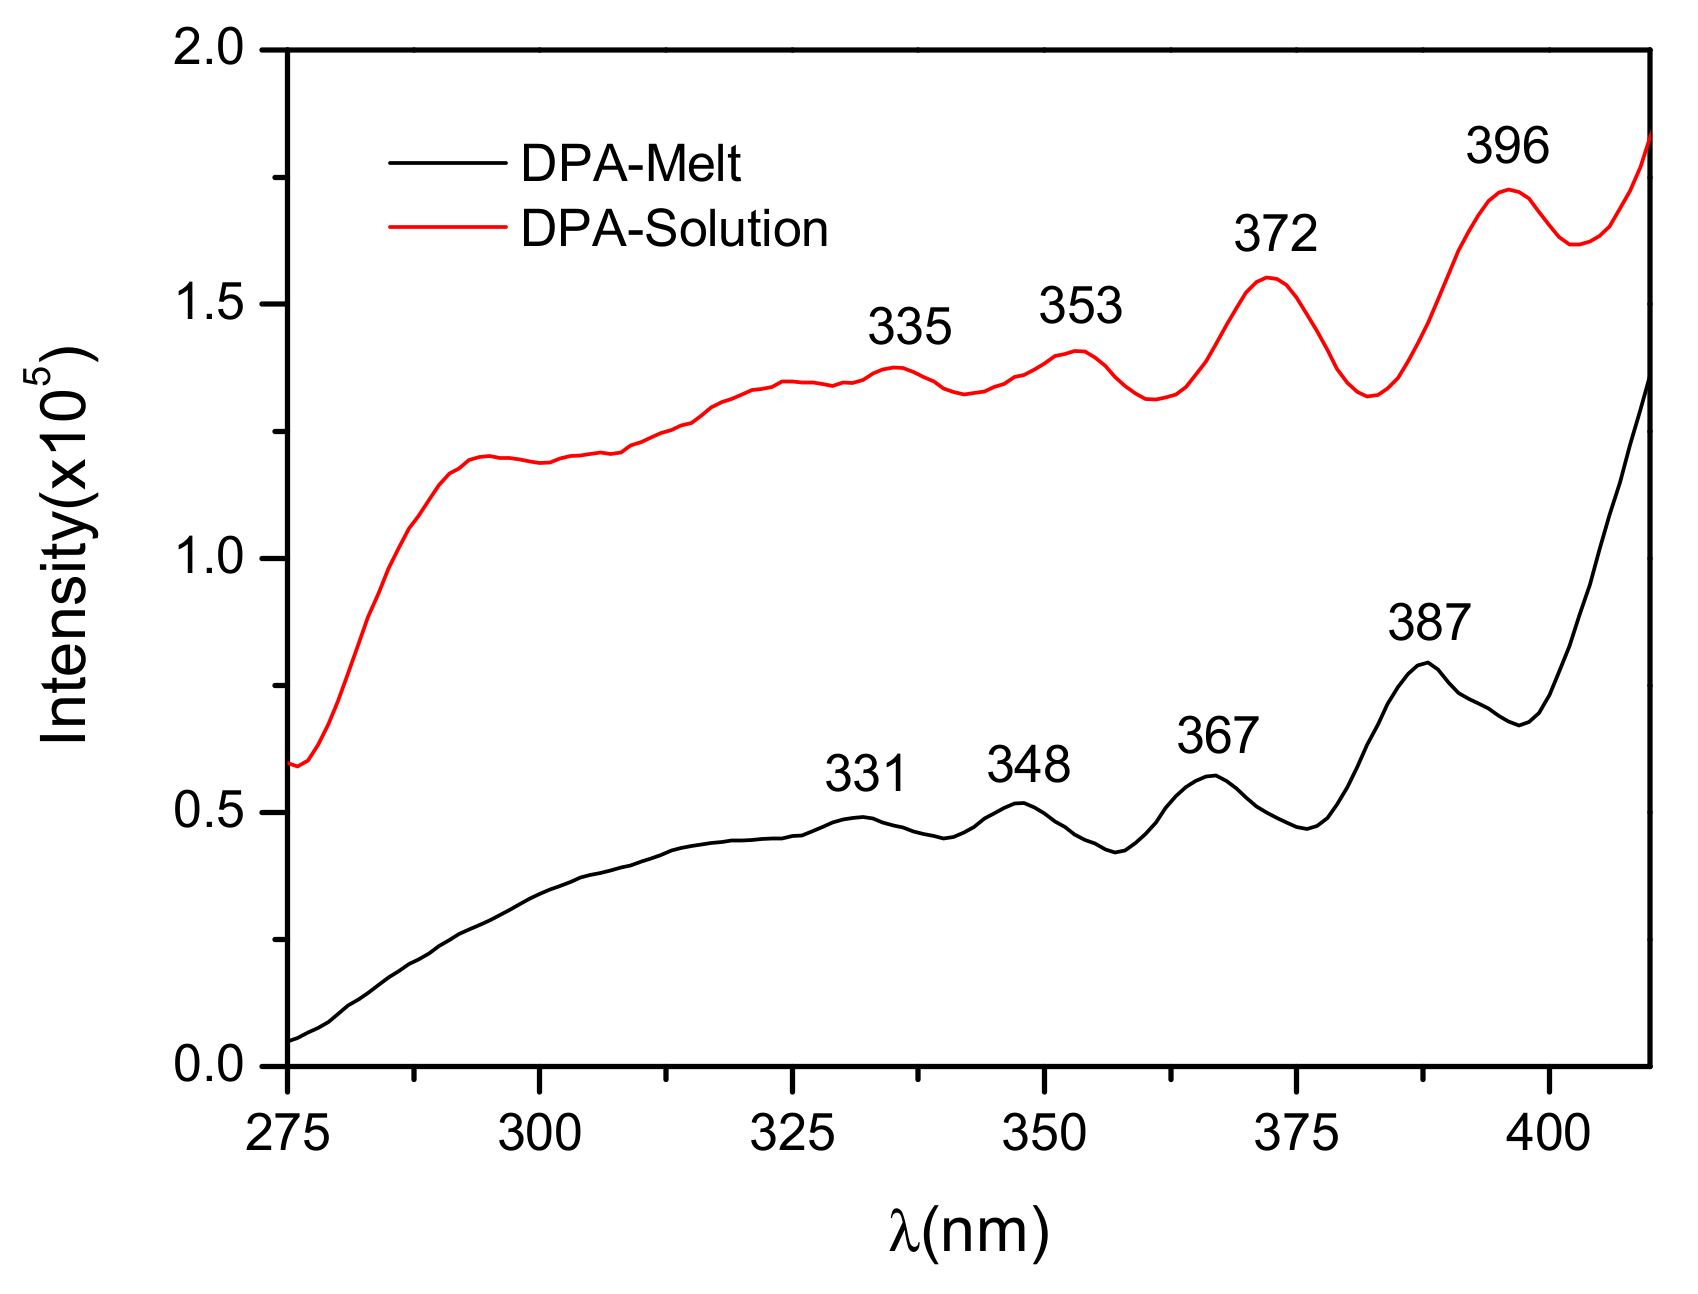
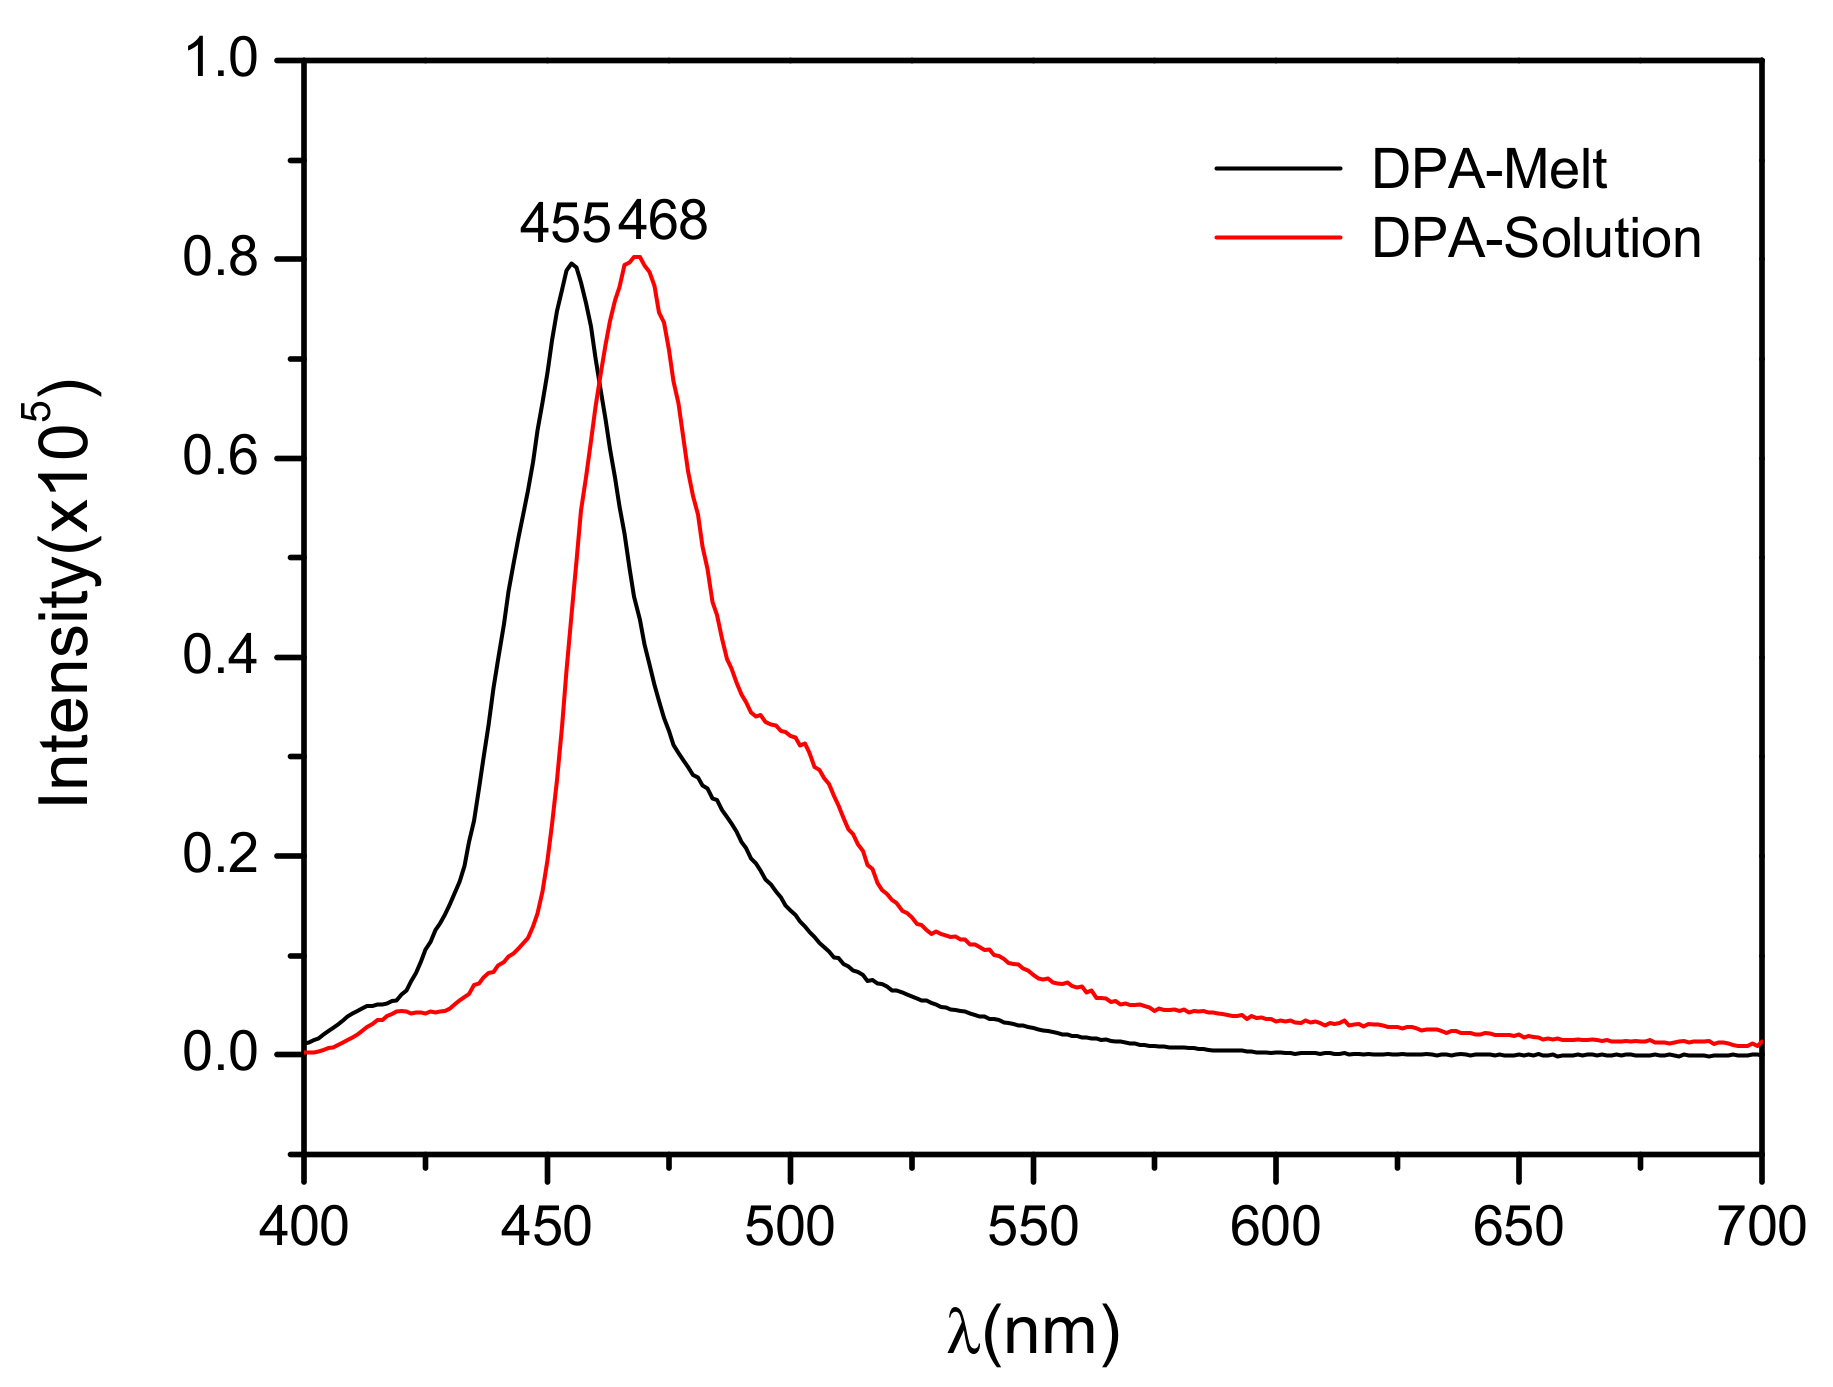
3.3. Optical Properties of DPA Crystals

The UV-Vis absorption curves of the DPA crystals are shown in Figure 7. There are four strong absorption peaks at 268, 357, 377, and 396 nm and a weak absorption peak at 429 nm for the DPA-Melt crystal, with the absorption band edge at ~446 nm. On the other hand, the DPA-Solution crystal exhibits strong absorption peaks at 268, 362, 382, 403, and 438 nm, with the absorption band edge at ~455 nm. The higher-intensity absorption bands of these two crystals in the range of 200−400 nm may be attributed to the π–π* transition of the corresponding aryl groups [23], whereas the lower-intensity absorption bands in the range of 430−440 nm are attributed to the characteristic π–π* transition of the anthryl group [24]. The absorption wavelength of DPA-Solution is slightly red-shifted, compared to that of DPA-Melt.
The fluorescence properties of the DPA crystals determine their potential application as a scintillator material. Figure 8 and Figure 9 show the fluorescence excitation and emission spectra of the DPA crystals, respectively, at room temperature. The emission spectrum of the DPA-Melt crystal shows one emission broadband at approximately 455 nm, and its excitation spectra show four excitation bands at approximately 331, 348, 367, and 387 nm. For the DPA-Solution crystal, the excitation bands are at approximately 335, 353, 372, and 396 nm and there is one emission broadband at approximately 468 nm. The excitation and the emission wavelengths of the DPA crystals grown by the solution method are thus higher than those of the DPA crystals grown by the melt method.

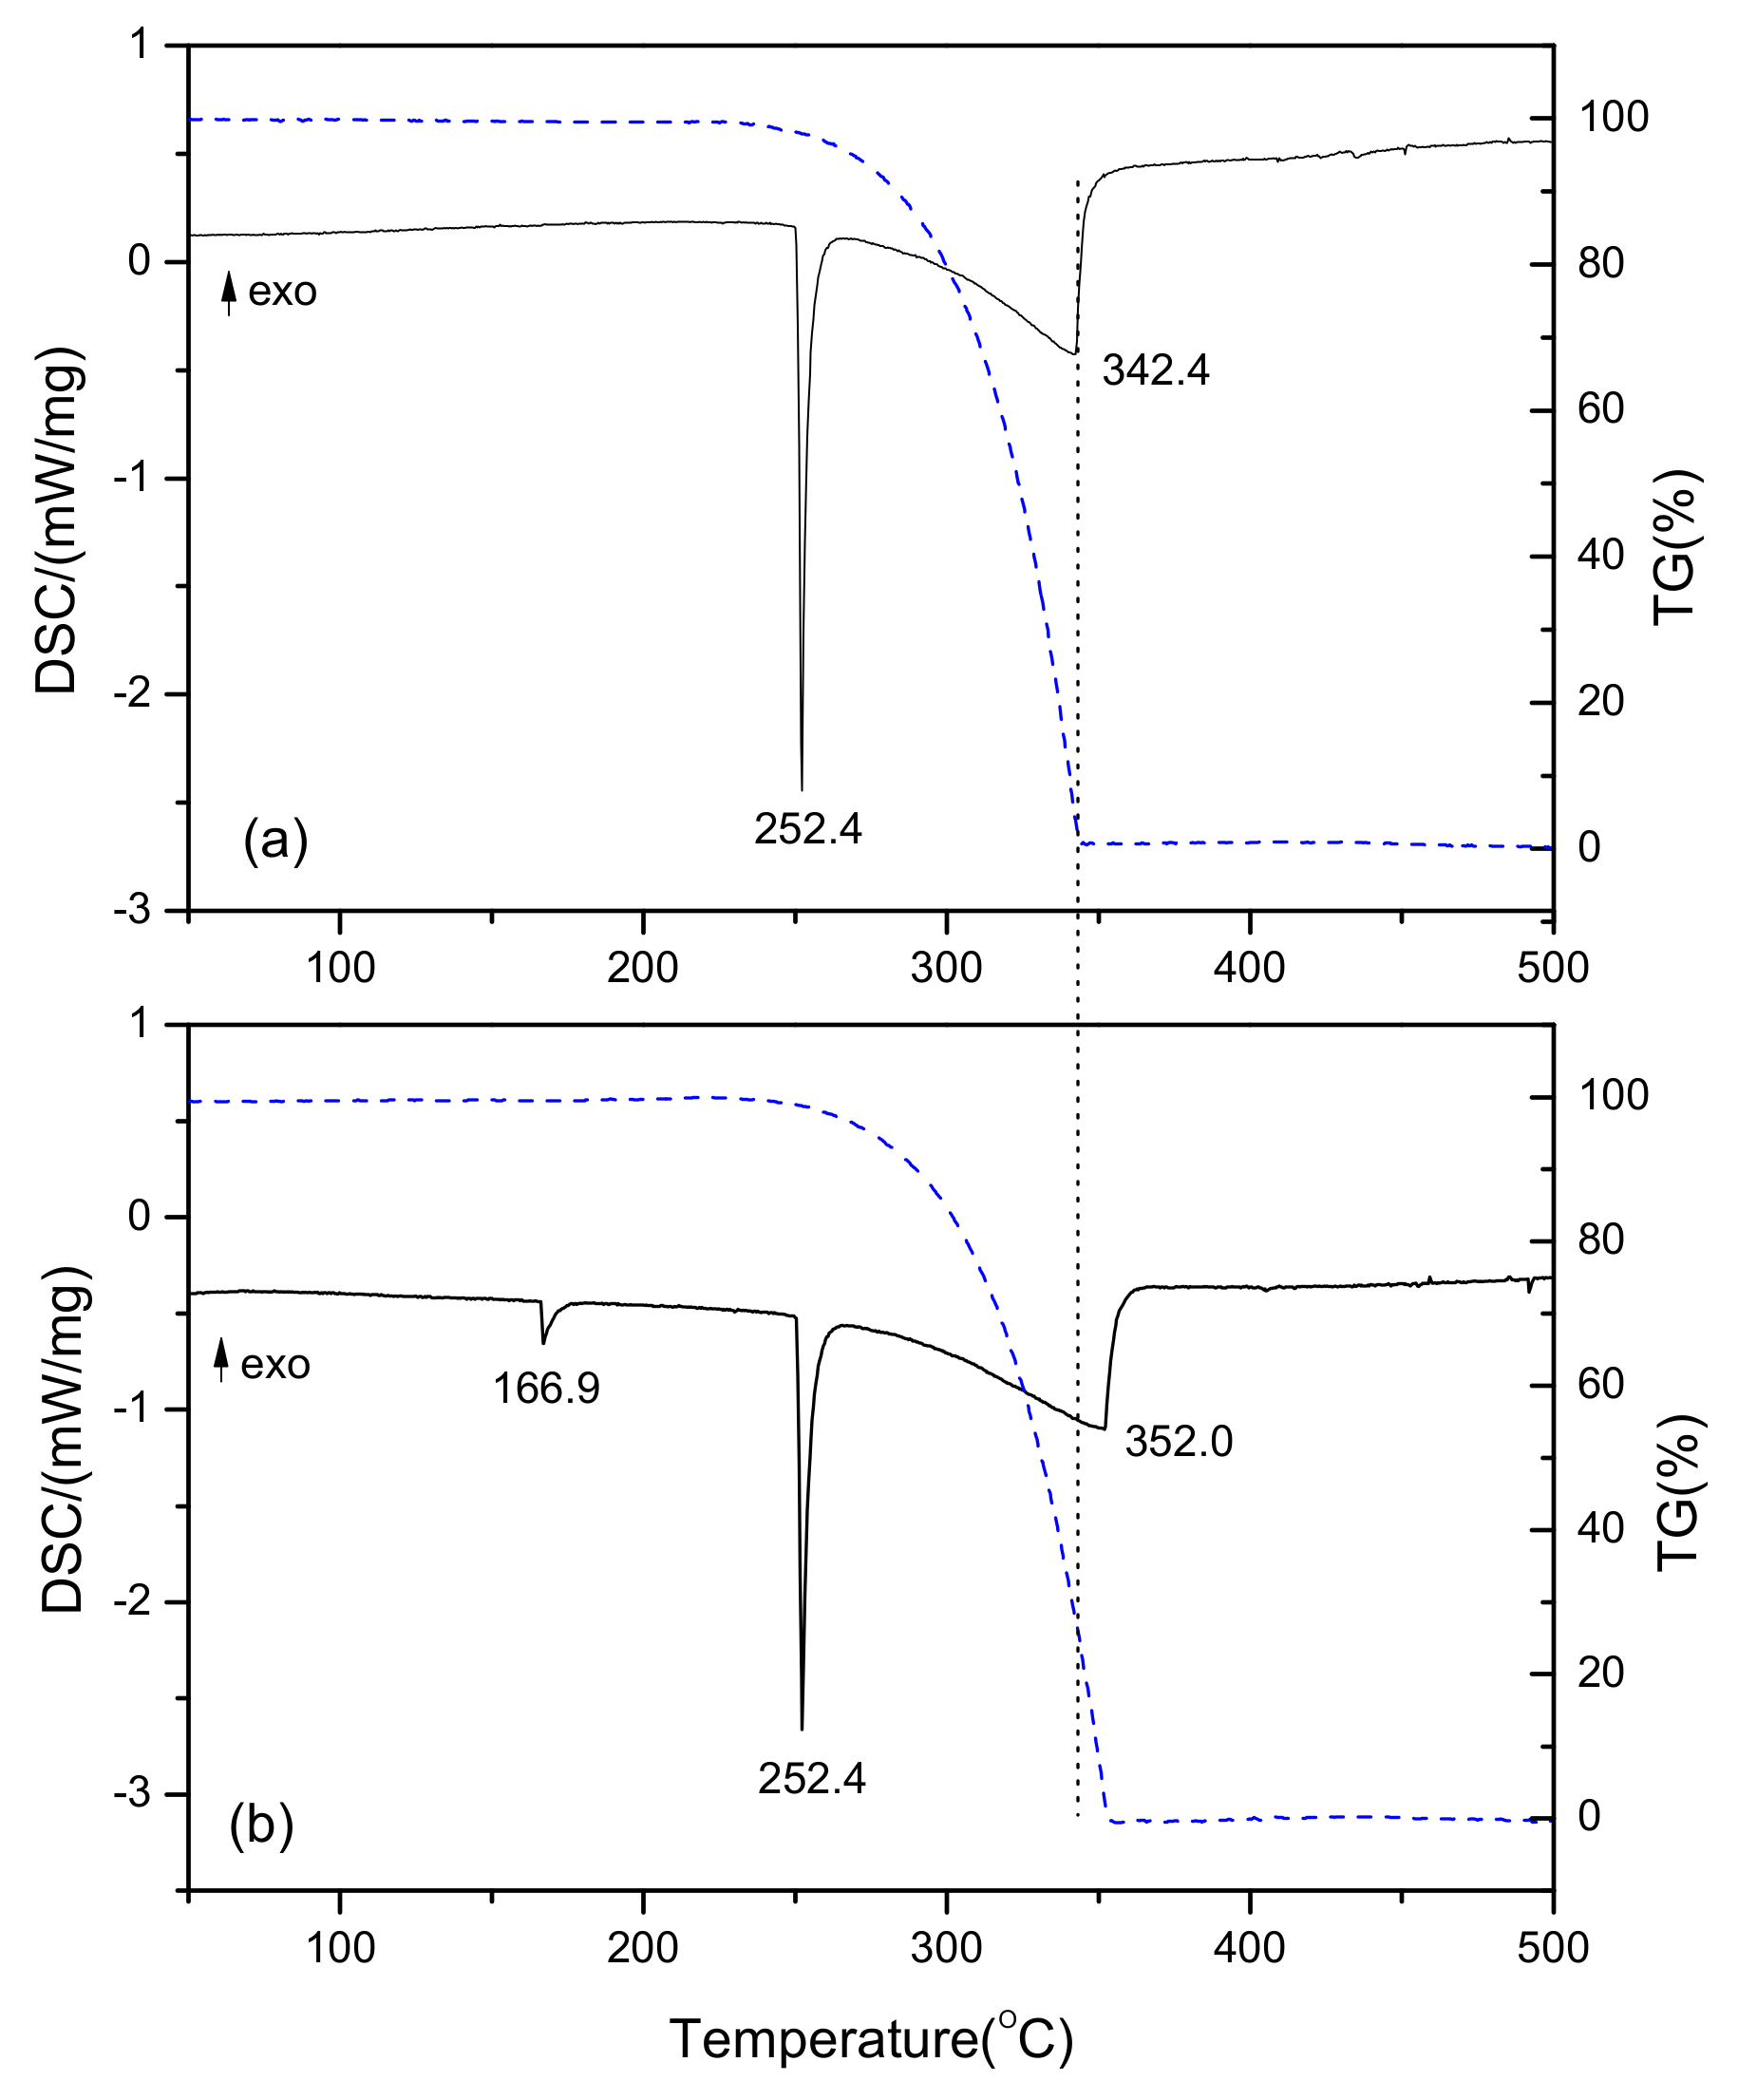
3.4. Analysis of Thermal Properties

The TG–DSC curves of the DPA crystals measured in N2 atmosphere are shown in Figure 10. The DSC curve of the DPA-Solution crystal shows a weak endothermic peak at 166.9 °C, which corresponds to the glass transition temperature (Tg) [25,26], while no glass transition was exhibited by the DPA-Melt crystal. The endothermic effect, with a peak at 252.4 °C in the DSC curves of both the crystals, corresponds to the melting temperature of the crystals (Tm). Both the crystals begin to melt at 250 °C and melt completely at 252.4 °C; thus, they have the same melting point. The TG curve has a small amount of weightlessness below 250 °C, which may be attributed to the sublimation of DPA. With increase in the temperature, the TGA curve shows a rapid weight loss, whereas an endothermic peak appears in the DSC curve. The endothermic peaks of the DPA-Melt crystal and the DPA-Solution crystal are at 342.4 and 352.0 °C, respectively. This indicates that the thermal stability of DPA-Solution is better than that of DPA-Melt, which is consistent with that reported by Salzillo et al. [12]. The calculation results of Salzillo show that α-DPA (the same as DPA-Solution) is the most thermodynamically stable phase in DPA polymorphs for its deepest minimum of the potential energy and also of the free energy.

4. Conclusions

The spatial configuration and the arrangement of molecules influence the optical and the thermodynamic properties of DPA crystals. The DPA-Melt crystal belongs to the P21/n space group, whereas the DPA-Solution crystal belongs to the C2/c one. Although the molecular composition of the two crystals is the same, the spatial conformation and the lattice parameters are different, leading to different macroscopic properties. Compared with the DPA-Melt crystal, the DPA-Solution crystal has a lower cell volume, higher density, higher thermal decomposition temperature, and exhibits a red-shift of the characteristic peak in the UV-Vis absorption and fluorescence spectra. Differences in the physical and the chemical properties of the two crystals may have an impact on their scintillation performance, thus affecting their neutron-γ discrimination ability. Preliminary studies show that the DPA-Melt crystal has a better PSD performance than the DPA-Solution crystal, and this will be discussed in detail in another paper.

Author Contributions

Crystal growth and writing—original draft preparation, X.L.; the retrieval of references, T.Z. and X.L.; characterization of fluorescence spectra, Q.H.; analysis of Raman Spectroscopy, L.D.; project administration and funding acquisition, Z.T.

Funding

This research was funded by the National Science Foundation of China (Grant No. 415731227).

Conflicts of Interest

The authors declare no conflict of interest.

References

  1. Cieślak, M.J.; Gamage, K.A.A.; Glover, R. Critical review of scintillating crystals for neutron detection. Crystals 2019, 9, 480–497. [Google Scholar]
  2. Vijayana, N.; Bhagavannarayana, G.; Maurya, K.K.; Haranath, D.; Rathi, B.; Balamurugan, N.; Sharma, Y.K.; Ramasamy, P. Effect of annealing on Bridgman grown organic scintillation material of trans-stilbene. Mater. Chem. Phys. 2012, 132, 453–457. [Google Scholar] [CrossRef]
  3. Carman, L.; Zaitseva, N.; Martinez, H.P.; Rupert, B.; Pawelczak, I.; Glenn, A.; Mulcahy, H.; Leif, R.; Lewis, K.; Payne, S. The effect of material purity on the optical and scintillation properties of solution-grown trans-stilbene crystals. J. Cryst. Growth. 2013, 368, 56–61. [Google Scholar] [CrossRef]
  4. Arulchakkaravarthi, A.; Santhanaraghavan, P.; Ramasamy, P. Crystal growth of Trans-stilbene by vertical Bridgman technique with modified growth vessels and its characterisation. J. Cryst. Growth. 2001, 224, 89–94. [Google Scholar] [CrossRef]
  5. Yamato, S.; Yamaji, A.; Kurosawa, S.; Yoshino, M.; Ohashi, Y.; Kamada, K.; Yokota, Y.; Yoshikawa, A. Crystal growth and luminescence properties of organic crystal scintillators for α-rays detection. Opt. Mater. 2019, 94, 58–63. [Google Scholar] [CrossRef]
  6. Glebov, V.Y.; Forrest, C.; Knauer, J.P.; Pruyne, A.; Romanofsky, M.; Sangster, T.C.; Shoup, M.J., 3rd; Stoeckl, C.; Caggiano, J.A.; Carman, M.L.; et al. Testing a new NIF neutron time-of-flight detector with a bibenzyl scintillatoron OMEGA. Rev. Sci. Instrum. 2012, 83, 10D309. [Google Scholar] [CrossRef] [PubMed]
  7. Zaitseva, N.; Glenn, A.; Carman, L.; Hatarik, R.; Hamel, S.; Faust, M. Brandon Schabes, Nerine Cherepy, and Stephen Payne, Pulse shape discrimination in impure and mixed single-crystal organic scintillators. Ieee T. Nucl. Sci. 2011, 58, 3411–3420. [Google Scholar] [CrossRef]
  8. Loef, E.V.V.; Glodo, J.; Shirwadkar, U.; Zaitseva, N.; Shah, K.S. Solution growth and scintillation properties of novel organic neutron detectors. Nucl. Instrum. Methods Phys. Res. Sect. A 2001, 652, 424–426. [Google Scholar]
  9. Hull, G.; Zaitseva, N.P.; Cherepy, N.J.; Newby, J.R.; Stoeffl, W.; Payne, A.S. New organic crystals for pulse shape discrimination. Ieee T. Nucl. Sci. 2009, 56, 899–903. [Google Scholar] [CrossRef]
  10. Loef, E.V.V.; Mukhopadhyay, S.; Zaitseva, N.; Payne, S.; Shah, K.S. Crystal growth and characterization of 9,10-diphenylanthracene. J. Cryst. Growth. 2012, 352, 103–105. [Google Scholar] [CrossRef]
  11. Ren, J.; Huang, B.N.; Chen, L.; Liu, Y.J.; Ye, T.; Liu, W.; Jin, X.Y.; Xu, Z.K.; Chen, H.Z.; Li, H.Y. Constructing bulk-contact inside single crystals of organic semiconductors through gel incorporation. CrystEngComm 2016, 18, 800–806. [Google Scholar] [CrossRef]
  12. Salzillo, T.; Valle, R.G.D.; Venuti, E.; Brillante, A.; Siegrist, T.; Masino, M.; Mezzadri, F.; Girlando, A. Two New Polymorphs of the Organic Semiconductor 9,10-Diphenylanthracene Raman and X-ray Analysis. J. Phys. Chem. C 2016, 120, 1831–1840. [Google Scholar] [CrossRef]
  13. Dolomanov; Bourhis, L.J.; Gildea, R.J.; Howard, J.A.K.; Puschmann, H. A complete structure solution, refinement and analysis program. J. Appl. Cryst. 2009, 42, 339–341. [Google Scholar] [CrossRef]
  14. Sheldrick, G.M. A short history of SHELX. Acta Cryst. A 2008, 64, 112–122. [Google Scholar] [CrossRef]
  15. Sheldrick, G.M. Crystal structure refinement with SHELXL. Acta Cryst. C 2015, 71, 3–8. [Google Scholar] [CrossRef] [PubMed]
  16. Adams, J.M.; Ramdas, S. The Crystal Structure of Solution-Grown 9,10-Diphenylanthracene. A Combined Computational and X-ray Study. Acta Cryst. B 1979, 35, 679–683. [Google Scholar] [CrossRef]
  17. Valovicova, V.; Plevová, E.; Vaculiková, L.; Ritz, M.; Vallova, S. Thermal polycondensation of anthracene for carbon precursors. J. Therm. Anal. Calorim. 2016, 124, 261–267. [Google Scholar] [CrossRef]
  18. Yükselici, M.H.; Aşıkoğlu, A. A vibrational study of liquid benzene through dispersive Raman spectroscopy using advanced optical elements. Opt. Laser Eng. 2009, 47, 842–846. [Google Scholar] [CrossRef]
  19. Bratschkov, C. FTIR spectroscopy study of the UV irradiation induced changes in an anthracene containing copolymer. Eur. Polym. J. 2001, 37, 1145–1149. [Google Scholar]
  20. Shinohara, H.; Yamakita, Y.; Ohno, K. Raman spectra of polycyclic aromatic hydrocarbons. Comparison of calculated Raman intensity distributions with observed spectra for naphthalene, anthracene, pyrene, and perylene. J. Mol. Struct. 1998, 442, 221–234. [Google Scholar] [CrossRef]
  21. Adichtchev, S.V.; Surovtsev, N.V. Raman line shape analysis as a mean characterizing molecular glass-forming liquids. J. Non-Cryst. Solids 2011, 357, 3058–3063. [Google Scholar] [CrossRef]
  22. Abasbegović, N.; Vukotić, N.; Colombo, L. Raman Spectrum of Anthracene. J. Chem. Phys. 1964, 41, 2575–2577. [Google Scholar]
  23. Chung, S.J.; Kim, K.K.; Jin, J.I. Fluorescing wholly aromatic polyesters containing diphenylanthracene fluorophores. Polymer 1999, 40, 1943–1953. [Google Scholar] [CrossRef]
  24. Dong, Y.K.; Kim, Y.S.; Song, E.L.; Kim, Y.K.; Yoon, S.S. 9,10-Diphenylanthracene derivative substituted with indole moiety for blue organic light-emitting diodes. Mol. Cryst. Liq. Cryst. 2017, 644, 197–204. [Google Scholar]
  25. Zhuang, S.; Shangguan, R.; Huang, H.; Tu, G.; Wang, L.; Zhu, X. Synthesis, characterization, physical properties, and blue electroluminescent device applications of phenanthroimidazole derivatives containing anthracene or pyrene moiety. Dye. Pigment. 2014, 101, 93–102. [Google Scholar] [CrossRef]
  26. Karasawa, S.; Hagihara, R.; Abe, Y.; Harada, N.; Todo, J.; Koga, N. Thermal properties, and emission behaviors of N,N-R-Phenyl-7-amino-2,4-trifluoromethylquinoline derivatives: Supercooled liquid-to-crystal transformation induced by mechanical stimuli. Cryst. Growth Design. 2014, 14, 2468–2478. [Google Scholar] [CrossRef]
Figure 1. Photographs of the (a) DPA-Melt and the (b) DPA-Solution crystals.
Crystals 09 00512 g001
Figure 2. Unit cells of (a) DPA-Melt and (b) DPA-Solution.
Crystals 09 00512 g002
Figure 3. DPA molecule.
Crystals 09 00512 g003
Figure 4. Raman spectra of the DPA crystals.
Crystals 09 00512 g004
Figure 5. IR spectra of the DPA crystals.
Crystals 09 00512 g005
Figure 6. Spatial conformation of the (a) DPA-Melt and the (b) DPA-Solution crystals.
Crystals 09 00512 g006
Figure 7. UV-Vis absorption spectra of the DPA crystals.
Crystals 09 00512 g007
Figure 8. Excitation spectra of the DPA crystals.
Crystals 09 00512 g008
Figure 9. Fluorescence emission spectra of the DPA crystals.
Crystals 09 00512 g009
Figure 10. TG–DSC curves of (a) DPA-Melt and (b) DPA-Solution crystals.
Crystals 09 00512 g010
Table 1. Crystallographic data of DPA-Melt and DPA-Solution.
CrystalDPA-Melt(γ-DPA)DPA-Solution(α-DPA)
Empirical formula C26H18 C26H18
Temperature/K293(2)293.15
Formula weight 330.40 330.40
Crystal systemMonoclinicMonoclinic
Space groupP21/nC2/c
a/Å9.2004(4)10.6842(7)
b/Å21.0836(8)13.5461(8)
c/Å10.0367(4)12.2430(8)
α/°9090
β/°111.446(5)90.615(6)
γ/°9090
Volume/Å31812.10(14)1771.82(19)
Z44
ρcalcg/cm31.2111.239
μ/mm−10.0680.070
F(000) 696.0 696.0
Crystal size/mm30.2 × 0.08 × 0.050.4 × 0.35 × 0.25
RadiationMoKα (λ = 0.71073)MoKα (λ = 0.71073)
2Θ range for data collection/°7.256 to 52.7365.864 to 52.734
Index ranges−11 ≤ h ≤ 8, −26 ≤ k ≤ 20, −12 ≤ l ≤ 12−13 ≤ h ≤ 11, −16 ≤ k ≤ 16, −8 ≤ l ≤ 15
Reflections collected114253856
Independent reflections3699 [Rint = 0.0278, Rsigma = 0.0332]1823 [Rint = 0.0222, Rsigma = 0.0408]
Data/restraints/parameters3699/0/2361823/0/118
Goodness-of-fit on F21.0681.073
Final R indexes [I >= 2σ (I)]R1 = 0.0523, wR2 = 0.1286R1 = 0.0533, wR2 = 0.1141
Final R indexes [all data]R1 = 0.0802, wR2 = 0.1470R1 = 0.0772, wR2 = 0.1320
Table 2. Part of torsion angle data of DPA.
The Number of the AtomAngle/°
ABCDDPA-MeltDPA-Solution
C8C7C1C6−89.0(2)113.15(16)
C8C7C1C293.1(2)−67.5(2)
C26(C131)C7C1C2−90.4(2)−66.18(19)
C26(C131)C7C1C687.5(2)113.22(17)

