Abstract
Typically, protein crystals inherit the polymorphic form selected by nuclei arising in the solution. However, a transition of a polymorphic form may also occur at a later crystal growth stage. Unfortunately, due to the molecular-scale processes involved, the earliest stages of protein crystal nucleation and polymorph selection remain poorly understood. This paper attempts to elucidate the polymorph selection and crystal growth process in proteins (and colloidal crystals) using 2D Monte Carlo simulations and a computational model with short-range attraction for ‘protein-like’ patchy particles (PPs) of a specific patch geometry, bond width and strength. A relatively narrow temperature range is established whereby parts of the PPs monomers arrange initially in a rapidly growing unstable rhombohedral lattice (Rh). Stable trimers form simultaneously from the monomers remaining in the solution and monomers released from the Rh lattice. These trimers serve as building blocks of a more stable Kagome trihexagonal lattice (TriHex), which appears after a prolonged simulation time. The step-by-step scenario of this polymorphic transition and the specific role of PPs’ geometric and interaction anisotropies are discussed in detail.
1. Introduction
Crystal polymorphism [1], which is the ability of a substance of the same chemical composition to exist in more than one crystal structure, is decisive for the therapeutic function of drug formulations. Therefore, crystal polymorphism is of particular interest to the pharmaceutical industry. The medical significance of crystal polymorphism has been examined thoroughly in “Polymorphism in the Pharmaceutical Industry” [2]. Whilst they have identical chemical properties, polymorphs can differ markedly in their physical properties; for instance, crystal polymorphs may have different dissolution rates and mechanisms. As a rule, the most thermodynamically stable form is always the least soluble polymorph, which means it has the lowest bioavailability. In contrast, enhanced solubility accelerates dissolution, providing better drug bioavailability in the body. This is why it is crucial for the therapeutic function of a drug formulation to identify not only all polymorphic forms of a given bioactive molecule but also their respective thermodynamic stability. Besides this, a less stable crystal polymorph can exhibit a different dissolution mechanism; for instance, crystals can disintegrate not only into single molecules but also into dimers, trimers etc. Being differently hydrated (generally, solvated), these species may have diverse physiological impacts. Furthermore, the bioactive substance must maintain its polymorphic form irrespective of temperature and humidity variations during processing or shelf-life. Ritonavir is a good example of the potential for the therapeutic effect of the same molecule to be present or absent depending on the particular crystal polymorphic form [3,4]. In addition, any change in the solid form may render the drug toxic. All this requires crystalline drugs to be manufactured in a consistent, pure and reproducible manner, as a single physiologically active polymorph, because even the smallest amount of a more stable polymorphic form can evoke spontaneous polymorphic transition. Practically, it is necessary to know (otherwise, to find) conditions under which protein molecules, scattered homogeneously in the solution, are constrained to form stable crystal nuclei of only the physiologically active polymorph.
Currently, polymorph selection processes are largely conducted on the basis of trial and error, rather than on molecular design [5]. Emerging polymorphs are controlled via phase diagrams, focusing predominantly on solubility differences between polymorphs. Molecular design is not applied in polymorph selection mainly because there is no clear understanding of the earliest stages of crystal nucleation which, in the majority of cases, predetermine the polymorphic crystal form. Especially with proteins, adjusting the solution conditions so that the system is well past the solubility may lead the crystallization process to produce several crystal polymorphs (the reason being the diversity of possible protein-protein interactions). Furthermore, the Ostwald rule of stages [6,7] stipulates that the crystallizing phase does not need to be the most stable one thermodynamically; on the contrary, a metastable phase may appear first because crystal nucleus formation requires the surmounting of a lower energy barrier. Afterwards, the system may undergo a polymorphic form transition towards another metastable phase or directly to the most stable phase.
Using rates of crystal polymorph nucleation that are determined from nucleation barriers, Stranski and Totomanov [8] have pioneered the explanation of the Ostwald rule of stages. In a solution supersaturated in respect to several polymorphs, tiny differences between nucleation barriers of competing polymorphs can evoke huge differences in nucleation rates. Indeed, crystallization is dominated by the phase with the lowest nucleation barrier. Exploring competitive polymorphism in steady-state nucleation (running according to the classical nucleation mechanism), Sun et al. [9] have analyzed the probability of the appearance of polymorphs with different nucleation barriers. From the perspective of competing induction processes, and treating microscopic nuclei formation as a stochastic event, the authors note that during the nucleation stage, along with the predominant formation of nuclei of a lower nucleation barrier phase, there is also a non-zero probability of the formation of a nucleus of a higher nucleation barrier phase. This indicates the stochastic nature of exponential races between polymorphs, which determines polymorphic form selection. If two polymorphs are competing in the same local space region, the polymorph that nucleates first will be the polymorph that crystallizes. However, even if the metastable phase proceeds to complete crystal growth—i.e., consuming the solute until the solution is no longer supersaturated in respect to the metastable phase—the solution will still remain supersaturated in respect to the stable polymorph. Moreover, the presence of the metastable polymorph can “catalyze” the formation of the stable phase [9]. The reason for this is that the pre-existing bulk metastable phase can serve as a substrate for a heterogeneous nucleation, thereby reducing the nucleation barrier of the stable phase. Although diverse polymorphs can coexist for a while, eventually the stable phase consumes the metastable phase. This scenario of crystal polymorph transition is confirmed by our 2D Monte Carlo simulations (see below).
Despite the rather intensive research, the mechanisms of protein crystal nucleation and polymorph selection at the molecular level need further exploration. What is known for certain is that both physical and biochemical factors play a role in this process [10]. Together, they make protein crystal nucleation a self-assembly process with high precision. This process produces stable clusters formed as a result of selective and directional interactions among biological macromolecules. It is worth noting that, in respect to binding into crystalline clusters, there is a principal difference between small inorganic molecules (and metal atoms) and huge protein molecules. Small molecules have a homogeneous surface functionality, and irrespective of their spatial orientation, in supersaturated media, every hit between them has the potential to prompt the formation of a crystal bond. Huge protein molecules have a highly inhomogeneous and patchy surface (which is essential for their biological role), and after colliding, a crystalline bond may form only when molecules have a proper spatial orientation [11,12]. This means that protein–protein associations are subject to steric restrictions that substantially postpone protein crystal nucleation and growth. Information about crystal lattice contacts (appearing as final result of the protein crystallization) shows unambiguously that patches able to create crystal lattice contacts are strictly selected and occupy relatively small fractions of molecule surfaces [13]. All this lays the groundwork for the so-called bond selection mechanism (BSM) [14] which was devised to explain the experimental observations showing that protein crystal nucleation runs at much slower rates than those in the case of small molecule substances, irrespective of the unusually high supersaturations applied in the former case. BSM also accounts for the studies of Wukovitz and Yeates [15], who based on reliable statistic data have revealed that, in order to form crystal structures, biological macromolecules require a geometric arrangement that is appropriate for creating crystallographic symmetry. In proteins, this is reflected in a tendency to crystallize in a small number of preferred space groups where it is easiest to achieve connectivity [15]. Similar to BSM are the ‘sticky patch’ models that are becoming increasingly popular. Computer simulations (including the Monte Carlo method) are very well suited to studying protein crystal nucleation and polymorphism [16,17,18,19,20,21]. Other different approaches to crystal polymorphism were reported recently [22,23,24,25].
In this paper, the molecular-scale mechanism of the earliest stages of 2D protein-like crystal nucleation and the crystal polymorph transition scenario mentioned before were examined via a patchy particle interaction model. Two-dimensional Monte Carlo (MC) simulations were performed using patchy particles (PPs) (a computational model proposed by Doye et al. [26]). Modifications were introduced by adding anisotropy to the PPs, namely two couples of ‘strong and narrow’ (SN) and ‘weak and wide’ (WW) patch–patch interactions of the same type only. The patchy particles (PPs) used possessed specific anisotropies (both from geometric and energy perspective), enabling the system to exhibit a non-trivial two-stage polymorphic transition in a relatively narrow temperature range.
However, although anisotropic in shape, our PPs are merely highly simplified models for proteins. So, the simulation of colloid crystallization is envisaged as well. There is a large quantity of literature on crystals formed of patchy particles (and such polymorphs); for instance, it has been shown that the rational design of patch shape and symmetry can drive patchy colloids to crystallize in a single, selected morphology by structurally suppressing the undesired competing crystal and favoring the self-assembly of the desired structure [27]. This is the central idea of Romano and Sciortino, who studied the crystallization of the so-called “triblock Janus” colloids with two triangular patches oriented in a staggered geometry and eclipsed patch arrangement.
Because ordered colloidal crystal lattices have broad utility in a wide range of optical and catalytic devices, their formation was simulated using patchy particles that form open colloidal crystals of a desired (and single) polymorphic form [28]. The study in reference [28] is motivated by the circumstance that open colloidal crystals have lattice constants comparable to the light wavelength and thus can find practical application. Mahynski et al. [28] exploit polymers as “structure-directing agents” during Monte Carlo and Molecular Dynamics Simulations of the crystallization of triblock Janus colloids decorated with two circular polar patches.
The self-assembly scenario of patchy colloidal particles was also simulated in a two-dimensional system by Romano and Sciortino [29]. The authors performed this study to reproduce the experimentally observed self-assembly of spherical colloidal particles (micrometre-sized spheres with interactions by electrostatic repulsion in the middle and hydrophobic attraction at the poles, the “triblock Janus” colloids) into a Kagome two-dimensional lattice [30]. To study the formation of 2D crystals of patchy particles, the authors used the Kern-Frenkel two-patch model, wherein two attractive patches are symmetrically arranged as polar caps on a hard sphere. With model parameters that are selected to match the experimental values, and on the basis of free energy calculations, Romano and Sciortino showed that the Kagome lattice is stable at low temperature and low pressure, but that it transforms into a hexagonal lattice with alternating attractive and repulsive bands with increasing pressure. Patchy colloidal particles, which include binary mixtures as well as attraction and repulsion between the patches, were studied by Doppelbauer et al. [31]; using optimization techniques based on genetic algorithms, the authors identified a broad variety of highly non-trivial ordered structures.
2. Model PPs and Computational Model
The model PPs used (red, Figure 1) had four attractive patches in total: a pair of relatively “strong and narrow” (SN; deep blue) patches and a pair of relatively “weak and wide” (WW; light blue) patches. The two patch couples were diametrically opposite each other on the PPs, and the corresponding patches of the same type were displaced at 60 degrees in each couple. As per the common PP geometry notation, the angular distribution was (60–120–60–120) degrees. Such PPs were obtained from particles possessing six regularly distributed patches (at 60 degrees from each other), whereby two diametrically opposing patches were removed. The quasi-homogeneous energetic interactions of the former (regularly distributed) particles produced only the closest-packed structures common for metal crystals but very rare for proteins. The decreased symmetry (due to the missing two opposite patches), accounting for interactions between patches of the same type only, made it possible to predict the PP-enabled formation of two regular 2D periodic structures (instead of only one: the closest-packed). This arrangement of sticky patches onto the PPs allowed for the formation of zig-zag chains which interconnected into a 2D crystal lattice, namely a rhombohedral 2D lattice (Figure 2a). Another possibility was the formation of stable trimers (Figure 3) to serve as building blocks for the second regular 2D periodic crystal lattice: a trihexagonal (Kagome) lattice (Figure 2b).

Figure 1.
The patchy particle (PP) monomer (red) used in the simulations and the two pairs of patches: strong and narrow (SN; deep blue) and weak and wide (WW; light blue).
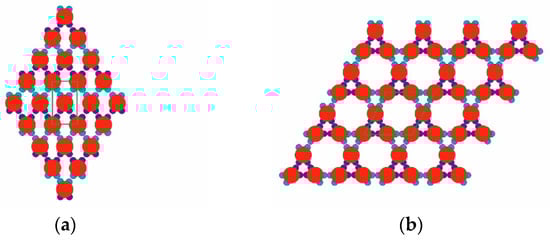
Figure 2.
Two possible periodic arrangements of model PPs: rhombohedral (a) and tri-hexagonal (b) 2D crystal lattices; the unit cells (green) for both structures are also shown.
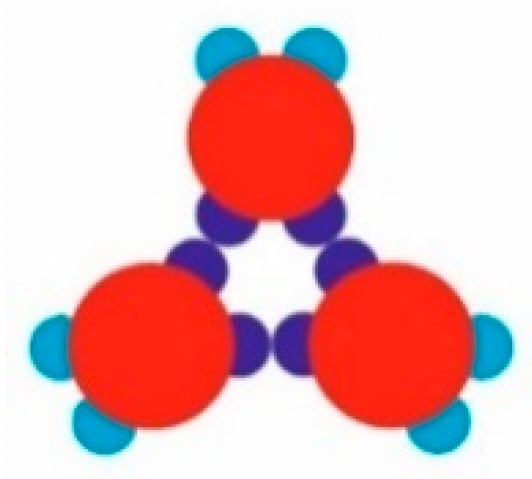
Figure 3.
A stable trimer of model PPs: three monomers, mutually oriented at 120 degrees, connected by three SN-SN patch bonds.
As already mentioned, our computational model is based on the widely-used PP model proposed by Doye and co-workers [26]. Interactions between patches of the same type were modelled by their modulated Lennard-Jones (LJ) potential: the repulsion for the very short range interaction of the core particles (), where no patch–patch interactions are available (this is the excluded volume interaction, which is in fact “repulsion”, represented by the repulsion part of the LJ potential, namely the so-called WCA (Weeks-Chandler-Anderson) potential), and the LJ attraction () multiplied by the factor dependant on the mutual orientation of similar patches with respect to the inter-core particle vector, connecting monomer Mi and Mj (see Figure 4). Here, is the distance between the centre of mass of monomer Mi and monomer Mj. Thus, the interaction potential between similar patches from monomer Mi and monomer Mj at a distance is given by , where and . Here, the index accounts for similar patches (SN-SN or WW-WW only), where and are the angles enclosed by the core particle vector and the corresponding patch vector, and the parameter Ωp gives the patchy extent in degrees (or the so-called patchy width) along the particle circumference. We perform a classical Metropolis sampling scheme on a canonical NVT ensemble (constant number of particles, N, constant volume, V, and constant temperature, T). At each MC sweep cycle, we randomly scan all the particles in the system and perform a random trial small move (roto-translation: both random translation in 2D space and random rotation in 2D space) for each particle. We apply hard wall boundary conditions and we use a “concentration” of a number density of 0.4 in a square box with a length of 30 σ. In all the simulations, the temperature is expressed in terms of the reduced temperature , and we use the following values of the model parameters:
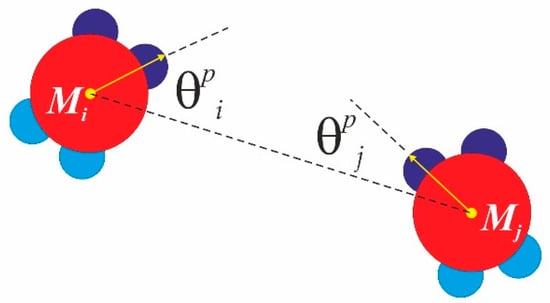
Figure 4.
Minimal patchy angle for monomer Mi and for monomer Mj. These angles are used to evaluate the modulated Lennard-Jones (LJ) interaction potential between the monomers.
3. Simulation Results and Discussion
The PP monomers used in our 2D MC simulations were designed to possess anisotropy in both their interaction strength (couples of SN and of WW patches) and geometry (the patches were not regularly distributed on particle circumference). These anisotropies are the key reason for the crystal polymorph selection, which we report as a main result of this study. Spontaneous crystal polymorph transition was observed in a relatively narrow temperature range, very close to the ‘optimal’ temperature of T* = 0.10 (image sequence in Figure 5) (similarly, protein crystallization occurred in a narrow temperature range, starting from about 0 to 50–60 °C). For comparison purposes, Monte Carlo simulations were also performed at temperatures higher and lower than T* = 0.10.
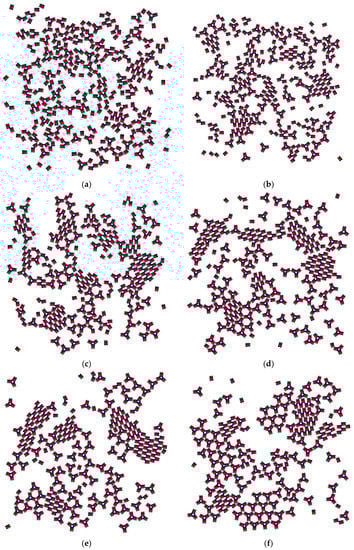
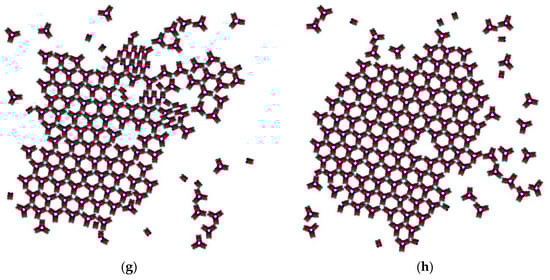
Figure 5.
Snapshots from the Monte Carlo (MC) simulation at T* = 0.1 ((a) 1 × 10³ MCS; (b) 2 × 10³ MCS; (c) 5 × 10³ MCS; (d) 1 × 10⁴ MCS; (e) 5 × 10⁵ MCS; (f) 1 × 10⁶ MCS; (g) 3×10⁶ MCS; (h) 6 × 10⁶ MCS).
The initial simulation stages gave rise to a rhombohedral-like arrangement (Rh) appearing from monomers distributed and oriented randomly in the medium (Figure 5a). Simultaneously, some monomers began to arrange into stable trimers, interconnected by three SN-SN patch bonds (Figure 3). The remaining six WW patches (two patches for each monomer) were dangling (non-saturated bonds) away from the trimer, with each couple at 120° from each other. Due to the specific patch distribution, trimers were expected to appear regardless of the need to have three patch–patch bonds of the same type formed in a synchronic way. This means that when one bond is formed in a proper orientation, the second bond must be formed at the same time. It is worth noting that when the two patch–patch bonds were established, the third one appeared ‘automatically’ for purely geometric reasons. Shortly after the simulation onset, the randomly generated PP monomer system transformed into Rh structured phases surrounded by single trimers. A small number of monomers and dimers were also present, with the latter being unstable at T* = 0.10 (Figure 5b). Thus, the Rh phase appeared first and grew by adding single monomers to the circumference of the growing cluster, always having a few non-saturated SN patches at the periphery. However, Rh phase growth was limited to some extent because of the rivalry with the stable trimers formed (once formed, the trimers remained stable at T* = 0.10 and did not disintegrate to dimers and/or monomers). Afterwards, the metastable Rh phase reached its growth maximum at T* = 0.10 (Figure 5c,d), because in growing it simultaneously released some monomers. Importantly, monomer release from the Rh phase did not occur rapidly, giving monomers ample time and space to reassemble into trimers. Indeed, some of the monomers released reattached to the Rh phase, but the iterative process of reattachment/release eventually resulted in trimer formation. This process sequence led to polymorph transition, expressed through trihexagonal (TriHex) phase formation and growth; Figure 5d depicts the initial stages of TriHex phase formation. Remarkably, the simulations showed that the TriHex phase appeared first on the circumference of the already grown Rh phase rather than in the “free” 2D space (Figure 5e). Being a catalytic-like surface for the formation and growth of this more stable TriHex phase, the unstable Rh phase continued serving building units for the TriHex phase. This scenario confirms the prediction by Sun et al. [9].
The process continued (Figure 5f,g) with a slow dissolution of the Rh phase. The monomers released assembled into trimers that further attached to the TriHex phase. The longest simulation time produced a single big cluster assembled from the existing TriHex lattice clusters (Figure 5h), thus fulfilling the thermodynamic requirement for the minimum free energy of the system. This single big cluster could be considered the final stage of a two-stage TriHex phase formation process. Put simply, the process progression could be perceived as an example of dissolution/reprecipitation iteration, leading slowly towards the building of a more stable phase.
During TriHex phase formation, stable trimers interconnected via three WW-WW patch bonds (Figure 5f–h) which determined the stability of the whole structure. From a purely geometric point of view, these three WW-WW patch bonds were identical to the trimer bonding formed by three SN–SN bonds (Figure 6). However, there was a significant difference between these two types of ‘triple’ bonding: although trimers with three WW-WW patch bonds did appear at some simulation instances, they were very short-lived and disintegrated into monomers.
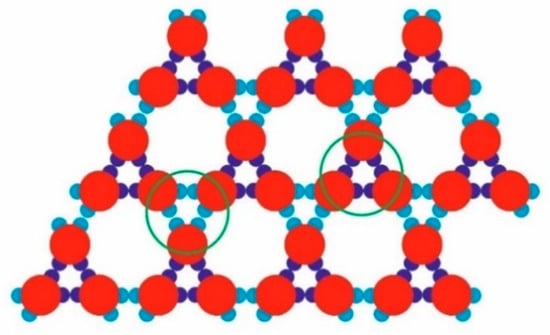
Figure 6.
Two types of alternating trimers bonded by three SN or three WW bonds (marked with green circles), observed in the already formed TriHex periodic structure.
Figure 7 depicts the quantitative kinetic curves of all processes involved in the polymorph transition from the Rh to TriHex phase at T* = 0.10; i.e., the initial Rh formation and growth, stable trimer formation, Rh structure gradual dissolution and TriHex cluster formation and growth. TriHex structure formation is a self-limiting growth process described by an S-shaped curve (green curve in Figure 7a) with two distinctive slopes, with one being steeper than the other. The curve reflects the consumption of monomers, which is randomly dispersed in the medium initially and later involved in the formation of both fast-growing Rh structures and stable trimers (Figure 7b). Despite the rapid exhaustion of monomers, trimer formation accelerates gradually because of the monomer detachment from the rhombohedral structure forming abruptly (blue line in Figure 7a). Upon reaching a critical supersaturation threshold, trimers begin shaping TriHex structure(s), which consumes some of the already formed trimers (depicted by the steeper curve slope, ending at approximately 1.5 × 10⁶ MCS). Then, the process slowed down because stable trimer formation relied entirely on monomer detachment from the Rh phase, which proceeds relatively slowly (second portion of the S-shaped curve). The process finishes with the Rh phase being completely transformed into the TriHex phase, thus marking the end of the two-stage polymorphic transition.
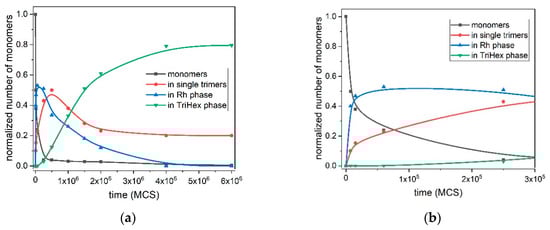
Figure 7.
Kinetics of all processes involved in the polymorph transition from the Rh to TriHex phase at T* = 0.1: up to 6 × 10⁶ MCS. (a). Monomers (black) are used as building units of the Rh phase (blue) and stable trimers (red); the latter serve as a second source of building units for the TriHex phase (green). The simulation points are averaged over 10 simulation runs and fitted by a spline curve. Initial stages up to 3 × 10⁵ MCS are shown in (b). It should be noted that the term “time” is conventional; it refers to the number of the performed Monte Carlo steps (sweeps), and not to ordinary time.
The stand-alone stable trimers (containing about 20–25% of the monomers in the system) remain around the TriHex phase even at very long simulation times (Figure 7a). The reason for this could be the trimers that constantly attached/detached to/from the TriHex phase and behaved like a “vapour phase” in a dynamic exchange with the crystalline structure. At this point of the process, the trimer concentration reaches the solubility value; i.e., zero supersaturation. Under such conditions, the probability of securing a further strong and stable trimer attachment is negligible because of the insufficiently strong binding of a single trimer. To attach itself to a TriHex phase, a single trimer forms two weak bonds, yet this is too weak to hold it stable on this structure. A simultaneous attachment of a second trimer hooked to the first one already bound to the TriHex phase edge was required to secure firm (five weak bonds) attachment. However, as mentioned above, zero supersaturation made such bond formation highly unlikely.
As already noted, TriHex phase growth depended on Rh phase dissolution. Consecutive process stages and details are presented in the image sequence in Figure 8a–f. Since simulations were performed on a system containing 40 monomers only, a single Rh-phase cluster was observed. On prolonged simulation, this transformed into a single TriHex cluster. The consecutive polymorph transition stages followed the scenario depicted in Figure 5.
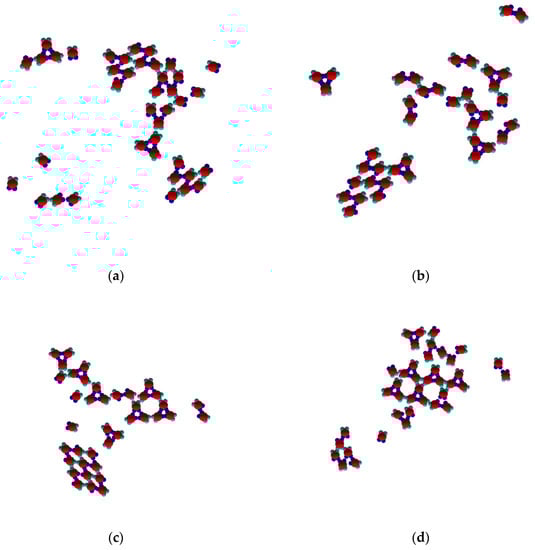
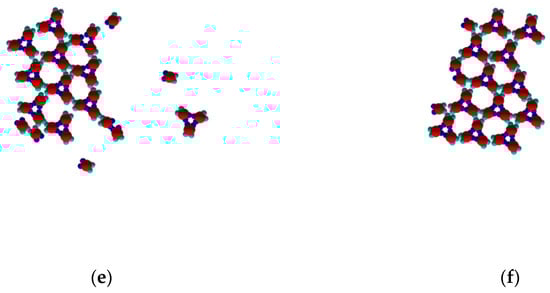
Figure 8.
Sequence of images (a–f) revealing the details and different stages of transformation from Rh to TriHex 2D clusters at T* = 0.1 (a: 1 × 10³ MCS; b: 2 × 10³ MCS; c: 5 × 10³ MCS; d: 1 × 10⁴ MCS; e: 1 × 10⁵ MCS; f: 5 × 10⁵ MCS).
3.1. Role of Temperature and Thermal Destruction of the Ordered Clusters
To establish the role of temperature in polymorph transition, changes occurring at temperatures somewhat above and below the optimal temperature of T* = 0.10 were examined. No stable structures appeared at a relatively high temperature of T* = 0.15, and only monomer diffusion in the 2D space was observed. Evidently, the thermal energy was too large and tore up both types of patch–patch bonds. Stable trimers started forming at the very beginning of the simulation at T* = 0.12. Almost no Rh phase was formed, or if there was any, it disintegrated immediately into monomers. The process continued with the formation of several TriHex clusters which ultimately merged into a single large TriHex cluster. No polymorphic transition was observed at T* = 0.12; however, as with T* = 0.10, polymorphic transition from Rh to TriHex phases was observed at T* = 0.09, but it proceeded at a relatively low rate. The formation of both an Rh phase and stable trimers (which started assembling in TriHex clusters) was observed at a lower temperature of T* = 0.08. Nearly no monomers (or a negligibly small amount) detached from the Rh phase at this temperature (Figure 9a) while the coexistence of the Rh and TriHex phases took place. The Rh phase predomination could be explained by the slower release, movement and reorientation of monomers at this temperature. A further decrease in temperature to T* = 0.05 (Figure 9b) led to an interesting result: monomers began forming trimers with not only three SN bonds but three WW bonds as well. Moreover, at this temperature, the overall number of WW trimers was higher than the number of SN trimers. This could be attributed to two factors: 1. the difference in SN and WW bond strengths diminished at such a low temperature; 2. as a consequence, the greater WW patch width compared to the SN patch width becomes a predominant factor: due to the decreased particle reorientation capability at low temperatures (as compared with higher temperatures), the greater patch width leads to a higher probability of WW trimers being formed. However, the “enhanced production” of trimers did not reinforce TriHex phase formation because the trimer mobility (as well as monomer mobility) was too low. It could be expected that further temperature drops may render stabilized ‘soft’ trimers (held by WW–WW patch bonds), but the simulations showed that the rather limited monomer mobility at lower temperatures made the formation of both trimer types virtually impossible. It was very unlikely to have PPs oriented simultaneously in an appropriate direction since the system was at a literally frozen state. Merely several clusters of only 2–3 monomers bonded irregularly were observed. In conclusion, temperature adjustments would allow the fine-tuning of the interplay between patch strength and patch width.
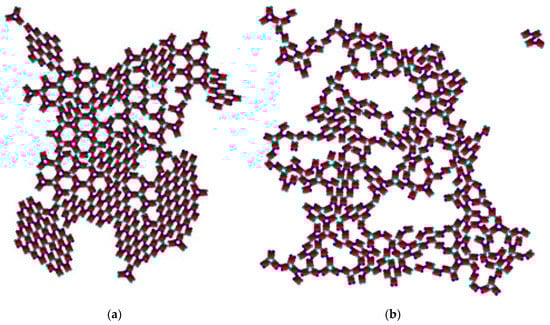
Figure 9.
Coexistence of the Rh and the TriHex structure at T* = 0.08 (a); ramified structure at T* = 0.05 (b) with two kinds of trimers and small parts of the Rh phase.
Because the TriHex lattice superseded the Rh structure, it was logical to assume that the former is the more stable phase. To investigate this, a system constituting TriHex and Rh clusters was set at a temperature of T* = 0.12. As with a temperature of T* = 0.10, it was observed that only the Rh clusters released monomers (in the case of T* = 0.12, the process was faster) which formed trimers that contributed to the TriHex phase growth.
3.2. Role of Patch-Patch Strength Anisotropy
To reveal the importance of different (SN and WW) patch-patch interactions, monomers of the same patch geometry (60–120–60–120) degrees and only one type of patch-patch interactions (strong SN) were explored.
At T* = 0.10, the process commenced with small Rh phase clusters and stable trimers being formed rather quickly as a result of the strong SN patch-patch interactions. Then, the trimers began assembling into rings, shaped partially or completely. Because bonding was strong, thermal energy was insufficient to disintegrate the Rh phase clusters. The system remained in a quasi-steady state whereby thermal movement did not support the integration of individual clusters (Figure 10a). The final structure obtained constituted of randomly connected small Rh phase crystalline clusters and predominantly uncompleted TriHex rings.
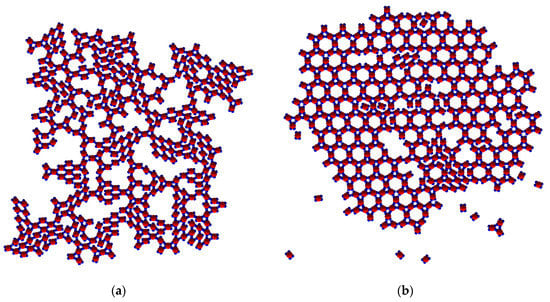
Figure 10.
Patches with equal strength, SN type only, at T* = 0.10: (a) randomly interconnected small Rh phase crystalline clusters and a small number of TriHex rings; (b) polymorph transition at T* = 0.15: the final structure contains many more defects in comparison with the final structure at T* = 0.10 and two types (SN and WW) of interacting patches.
As at T* = 0.10 with patch–patch interactions of different strengths, a spontaneous polymorphic transition occurred also at T* = 0.15, but more rapidly that the one in the former case. However, the TriHex structure produced contained man more crystal lattice defects (Figure 10b). At T* = 0.20, single monomers were predominant, while only very small and unstable Rh phase clusters were observed; neither a TriHex structure nor rings formed from the few trimers available at this temperature. Evidently, the relatively high thermal energy prohibited the formation of any crystal-like structure.
4. General Comments on the Results
Irrespective of some definitive results obtained in the present study, there are questions which still remain unanswered; for instance, why is the polymorph transition temperature range so narrow; why does the Rh phase form first; and why does the TriHex phase become the more stable one and supersede the Rh phase?
As already stated (in Section 3.1), T* = 0.10 is the temperature at which a single SN-SN patch bond is much more likely to remain unbroken in contrast to a single WW-WW patch bond. It is worth recalling that the strength of a patch-patch bond depends strongly on the mutual orientation of the two patches and decreases abruptly with patch angular shifts from the inter-core PP connecting vector. It is reasonable to assume that the narrow transition temperature range is related to the sharp change in interaction strength.
At the onset of the simulation process, monomers randomly dispersed and oriented in the medium diffuse by random moves which are both translational and rotational. This enables Rh phase growth by the addition of single monomers to the phase. A prerequisite for such an attachment to occur is merely to have a monomer properly oriented against the growing cluster. In contrast to the Rh phase, growing a TriHex phase requires stable trimers (see Figure 3) to be formed in advance. However, their formation occurs slowly, and that is why the TriHex phase appears at a later simulation stage and grows more slowly (also, experimental observations of the self-assembly of “triblock Janus” colloidal particles show that the development of a Kagome two-dimensional lattice requires a relatively long time [30]). However, the faster growth rate of the Rh phase does not imply that it is more stable thermodynamically than the TriHex phase at this particular temperature; finally, the latter superseded the former.
The stability of the Rh and TriHex phases is of utmost importance when trying to understand the observed polymorph transition. Note that there are the same numbers of saturated strong (SN-SN) and weak (WW-WW) bonds in the “bulk” of sufficiently large Rh and TriHex phases. It is also important to recall that all the bonds in the TriHex phase (whether SN-SN or WW-WW) are “grouped” in triples and are arranged in one and the same manner: the three WW-WW bonds between the already formed trimers possess the symmetry of the three SN-SN bonds of the trimers (see Figure 6). However, evidently, the overall stability of the clusters depends (mainly) on the weak (WW-WW) bonds. Although three couples of weak bonds connect the trimers in the TriHex phase, due to their special arrangement, such bonds oppose the disintegration more strongly than the same number of weak bonds in the Rh phase. The results of the simulated dissolution of a system constituted of TriHex and Rh clusters (at temperature T* = 0.12) confirmed the higher stability of the TriHex phase.
Evidently, if the number of bonds in each polymorph is the same, the relative polymorph stability is dictated by entropy only. The difference between the two polymorphs is that point defects, both interstitials (Figure 10) and vacancies (Figure 11), appear in the TriHex crystal structures, but never in the initial Rh structures; growing particle-by-particle, the PPs are filled tightly by these clusters. The existence of point defects provides a plausible explanation of the higher stability of the TriHex crystal structures: increasing the configurational entropy, the point defects contribute to its higher thermodynamic stability. An understanding of the contribution of configurational entropy to the TriHex stability can be gained by a comparison with the energy of the imposed supersaturation.
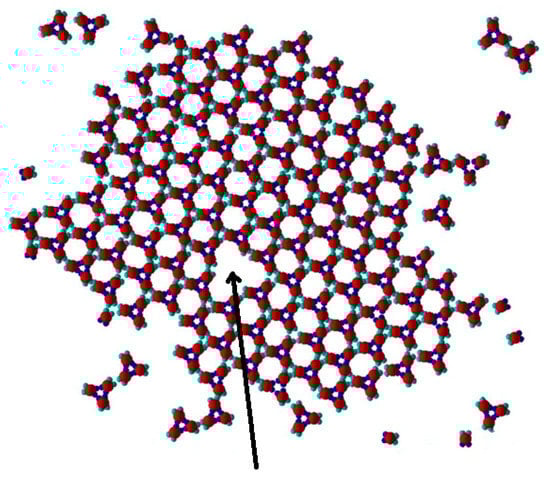
Figure 11.
The missing trimer (a vacancy) (see Figure 5h) is shown by an arrow (patch geometry 60–120–60–120 degrees, and anisotropic energetic interactions at T* = 0.10).
As is well known, point defects increase the configurational entropy, and thus overcompensate for the energy needed for their creation [32]. Thus, such defects stand in equilibrium with the crystal lattice [33]. Importantly, because spontaneous processes occur due to a decrease in the system’s free energy, they do not need to be driven by an outside source of energy. Requiring a negative change in the Gibbs free energy (G), crystallization occurs in supersaturated systems (at constant temperature and pressure) spontaneously, in one direction only; i.e., the crystals grow but not dissolve. As is well known, ΔG depends on changes of both crystallization enthalpy (H) and entropy (S):
ΔG = ΔH − TΔS < 0
The second law of thermodynamics states that the entropy of an isolated system (also including our MC simulation box) always increases for a spontaneous (i.e., a naturally occurring) process; i.e., ΔS > 0.
The famous Boltzmann equation renders the statistical definition of the entropy:
where W is the number of different ways in which the energy of the system can be achieved by rearranging the molecules among their available states; i.e., their different configurations.
S = kBlnW
The configurational entropy of the vacancies and interstitials in the crystal lattice is calculated easily [33]:
where N is the total number of knots in the crystal lattice, and n is the number of point defects (the entropy increment of a vacancy due to vibration is much less than that from configuration, and so it is neglected).
ΔSconf = kBln[N!/(N − n)! n!]
Point defects are missing in the Rh structure, and so 0! = 1 and ΔSconf = 0. In a TriHex structure constituted by 100 knots (approximately as many as in the case shown in Figure 11) which contains one vacancy, Equation (3) gives ΔSconf = 4.6kB, i.e., TΔS = 4.6kBT. For more point defects in a 2D crystal lattice possessing 100 knots, see Table 1.

Table 1.
Dependence of the configurational entropy contribution of the vacancies and interstitials (in kBT units) on the number (n) of point defects.
The equipartition theorem postulates that any degree of freedom has an average energy of 0.5kBT. In a two-dimensional system, a particle from the “solution” attaching to the crystal loses three degrees of freedom: two translational and one rotational. Hence, the entropy loss is 1.5kBT. It is seen in Table 1 that the configurational entropy contribution of the vacancies and interstitials is somewhat greater: it is in the same order of magnitude as the energy of the imposed supersaturation, Δμ = kBTln(c/ce), where c is the actual concentration and ce is the equilibrium concentration. For instance, with ln(c/ce) ≈ 3 to 3.7 for insulin crystal nucleation [34], Δμ is 3 to 3.7 times kBT. Additionally, because the relative contribution of entropy to the systems’ free energy can be modulated via temperature changes (see Equation (1)), it is logical to conclude that the optimal polymorphic transition temperature (T* = 0.10) is determined from the optimal entropy contribution (which is high enough to make ΔG negative, but not too high to create disorder) needed for this spontaneous process.
The simulations showed that a polymorph transition from the Rh to TriHex phase occurred spontaneously only when there was a very specific patch arrangement on model PPs, even for patches of equal bonding strengths. These outcomes allow us to deduce that polymorphic transition depends on patch arrangement, while the transition temperature depends on the interaction strength anisotropies in patch-patch bonds.
Usually, polymorph transitions are associated with first-order phase transitions, but we do not have direct evidence for such a kind of transition, and we do not claim this. During the MC simulation process, we monitored the free energy of the system, which goes towards a minimal and constant value. Thus, we were not able to pin-point any abrupt change (discontinuity) in the free energy of the system. However, commenting on the free energies of the two polymorph phases, we would like to point out that (due to the fact that the patch–patch interaction is quite sensitive to the mutual patch–patch orientation) the value of the free energy in the equilibrium state of the system is quite “noisy” in both cases. Furthermore, since the number of saturated bonds is almost equal, the free energies of both polymorphs are almost equal. These are the reasons, implemented in the model that we use, which do not allow us to clearly identify the polymorph transition observed by us as a classical first-order phase transition.
5. Conclusions
The spontaneous polymorphic form transition observed in the Monte Carlo simulations with protein-resembling patchy particles reveals a non-trivial two-stage process which involves the preliminary formation of building blocks of a more stable (trihexagonal, TriHex) phase. The process sequence is the following: first, a metastable rhombohedral (Rh) phase appears promptly and grows quickly; in parallel, stable trimers (under critical number) begin forming and metastable phase dissolution is initiated, releasing monomers at a slow rate; the second step involves the formation of an overcritical number of stable trimers (monomers bind further into stable trimers) which shape a stable TriHex (Kagome) phase that grows further. As indicated above, the spontaneous polymorphic transition is contingent on the selected patch arrangement on the surface of “protein-like” patchy particles. Transition is feasible only in a narrow temperature range, which depends on the strength of patch-patch bonds.
Author Contributions
Conceptualization, B.R. and C.N.; methodology, B.R. and C.N.; software, B.R.; validation, C.N. and B.R.; formal analysis, B.R. and C.N.; investigation, B.R. and C.N.; writing—original draft preparation, B.R. and C.N.; writing—review and editing, B.R. and C.N.; visualization, B.R. and C.N.
Funding
This research received no external funding.
Acknowledgments
B.R. acknowledges the support by the European Regional Development Fund within the OP Science and Education for Smart Growth 2014–2020, Project CoE National center for mechatronics and clean technologies, No.BG05M2OP001-1.001-0008. C.N. would like to express his gratitude to the National Science Fund of the Bulgarian Ministry of Science and Education for the support by contract DCOST 01/22.
Conflicts of Interest
The authors declare no conflict of interest. The founding sponsor had no role in the design of the study; in the collection, analyses, or interpretation of data; in the writing of the manuscript, and in the decision to publish the results.
References
- Bernstein, J. Polymorphism in Molecular Crystals; Clarendon Press: Oxford, UK, 2002. [Google Scholar]
- Polymorphism in the Pharmaceutical Industry; Hilfiker, R., Ed.; Wiley-VCH: Weinheim, Germany, 2006; ISBN 3-527-31146-7. [Google Scholar]
- Chemburkar, S.R.; Bauer, J.; Deming, K.; Spiwek, H.; Patel, K.; Morris, J.; Henry, R.; Spanton, S.; Dziki, W.; Porter, W.; et al. Dealing with the impact of ritonavir polymorphs on the late stages of bulk drug process development. Org. Proc. Res. Dev. 2000, 4, 413–417. [Google Scholar] [CrossRef]
- Bauer, J.; Spanton, S.; Henry, R.; Quick, J.; Dziki, W.; Porter, W.; Morris, J. Ritonavir: An Extraordinary Example of Conformational Polymorphism. Pharm. Res. 2001, 18, 859–866. [Google Scholar] [CrossRef] [PubMed]
- Alberstein, R.G.; Tezcan, F.A. Observations of the birth of crystals. Nature 2018, 556, 41–42. [Google Scholar] [CrossRef] [PubMed]
- Ostwald, W. Studien über die Bildung und Umwandlung fester Körper. Z. Phys. Chem. 1897, 22, 289–330. [Google Scholar] [CrossRef]
- Nývlt, J. The Ostwald rule of stages. Cryst. Res. Technol. 1995, 30, 443–449. [Google Scholar] [CrossRef]
- Stranski, I.N.; Totomanov, D. Rate of formation of (crystal) nuclei and the Ostwald step rule. Z. Phys. Chem. 1933, 163, 399–408. [Google Scholar]
- Sun, W.; Ceder, G. Induction time of a polymorphic transformation. Cryst. Eng. Comm. 2017, 19, 4576–4585. [Google Scholar] [CrossRef]
- Nanev, C.N. Phenomenological consideration of protein crystal nucleation; the physics and biochemistry behind the phenomenon. Crystals 2017, 7, 193. [Google Scholar] [CrossRef]
- Nanev, C.N. Protein crystal nucleation: Recent notions. Cryst. Res. Technol. 2007, 42, 4–12. [Google Scholar] [CrossRef]
- Nanev, C.N. Peculiarities of protein crystal nucleation and growth. Crystals 2018, 8, 422. [Google Scholar] [CrossRef]
- Dasgupta, S.; Iyer, G.H.; Bryant, S.H.; Lawrence, C.E.; Bell, J.A. Extent and nature of contacts between protein molecules in crystal lattices and between subunits of protein oligomers. Proteins Struct. Funct. Genet. 1997, 28, 494–514. [Google Scholar] [CrossRef]
- Nanev, C.N. Kinetics and intimate mechanism of protein crystal nucleation. Prog. Cryst. Growth Charact. Mater. 2013, 59, 133–169. [Google Scholar] [CrossRef]
- Wukovitz, S.W.; Yeates, T.O. Why protein crystals favor some space-groups over others. Nat. Struct. Biol. 1995, 2, 1062–1067. [Google Scholar] [CrossRef] [PubMed]
- Nada, H. Computer Simulations: Essential Tools for Crystal Growth Studies. Crystals 2018, 8, 314. [Google Scholar] [CrossRef]
- Shiau, L.D. Modelling of the Polymorph Nucleation Based on Classical Nucleation Theory. Crystals 2019, 9, 69. [Google Scholar] [CrossRef]
- Dorsaz, N.; Filion, L.; Smallenburg, F.; Frenkel, D. Spiers Memorial Lecture: Effect of interaction specificity on the phase behaviour of patchy particles. Faraday Discuss. 2012, 159, 9–21. [Google Scholar] [CrossRef]
- Duguet, É.; Hubert, C.; Chomette, C.; Perro, A.; Ravaine, S. Patchy colloidal particles for programmed self-assembly. Comptes Rendus Chimie 2016, 19, 173–182. [Google Scholar] [CrossRef]
- Bianchia, E.; van Oostrumc, P.D.J.; Likosa, C.N.; Kahl, G. Inverse patchy colloids: Synthesis, modeling and self-organization. Curr. Opin. Colloid Interface Sci. 2017, 30, 8–15. [Google Scholar] [CrossRef]
- Teixeira, P.I.C.; Tavares, J.M. Phase behaviour of pure and mixed patchy colloids—Theory and simulation. Curr. Opin. Colloid Interface Sci. 2017, 30, 16–24. [Google Scholar] [CrossRef]
- Hao, X.; Liu, J.; Luo, H.; Han, Y.; Hu, W.; Liu, J.; Li, J.; He, X. Crystal Structure Optimization and Gibbs Free Energy Comparison of Five Sulfathiazole Polymorphs by the Embedded Fragment QM Method at the DFT Level. Crystals 2019, 9, 256. [Google Scholar] [CrossRef]
- Martínez-Caballero, S.; Cuéllar-Cruz, M.; Demitri, N.; Polentarutti, M.; Rodriguez-Romero, A.; Moreno, A. Glucose isomerase polymorphs obtained using an ad hoc protein crystallization temperature device and a growth cell applying an electric field. Cryst. Growth Des. 2016, 16, 1679–1686. [Google Scholar] [CrossRef]
- Kwokal, A.; Roberts, K.J. Direction of the polymorphic form of entacapone using an electrochemical tuneable surface template. Cryst. Eng. Comm. 2014, 16, 3487–3493. [Google Scholar] [CrossRef]
- Di Profio, G.; Reijonen, M.T.; Caliandro, R.; Guagliardi, A.; Curcio, E.; Drioli, E. Insights into the polymorphism of glycine: Membrane crystallization in an electric field. Phys. Chem. Chem. Phys. 2013, 15, 9271–9280. [Google Scholar] [CrossRef] [PubMed]
- Doye, J.P.K.; Louis, A.A.; Lin, I.C.; Allen, L.R.; Noya, E.G.; Wilber, A.W.; Kok, H.C.; Lyus, R. Controlling crystallization and its absence: Proteins, colloids and patchy models. Phys. Chem. Chem. Phys. 2007, 9, 2197–2205. [Google Scholar] [CrossRef] [PubMed]
- Romano, F.; Sciortino, F. Patterning symmetry in the rational design of colloidal crystals. Nat. Commun. 2012, 3, 975. [Google Scholar] [CrossRef] [PubMed]
- Mahynski, N.A.; Rovigatti, L.; Likos, C.N.; Panagiotopoulos, A.Z. Bottom-Up Colloidal Crystal Assembly with a Twist. ACS Nano 2016, 10, 5459–5467. [Google Scholar] [CrossRef]
- Romano, F.; Sciortino, F. Two dimensional assembly of triblock Janus particles into crystal phases in the two bond per patch limit. Soft Matter 2011, 7, 5799. [Google Scholar] [CrossRef]
- Chen, Q.; Bae, S.C.; Granick, S. Directed self-assembly of a colloidal kagome lattice. Nature 2011, 469, 381. [Google Scholar] [CrossRef]
- Doppelbauer, G.; Bianchi, E.; Kahl, G. Self-assembly scenarios of patchy colloidal particles in two dimensions. J. Phys. Condens. Matt. 2010, 22, 104105. [Google Scholar] [CrossRef]
- Hull, D.; Bacon, D.J. Introduction to Dislocations; Butterworth-Heinemann: Oxford, UK, 2001. [Google Scholar]
- Van Bueren, H.G. Imperfections in Crystals; North-Holland Publishing Company: Amsterdam, The Netherlands, 1960. [Google Scholar]
- Nanev, C.N.; Hodzhaoglu, F.V.; Dimitrov, I.L. Kinetics of insulin crystal nucleation, energy barrier, and nucleus size. Cryst. Growth Des. 2011, 11, 196–202. [Google Scholar] [CrossRef]
© 2019 by the authors. Licensee MDPI, Basel, Switzerland. This article is an open access article distributed under the terms and conditions of the Creative Commons Attribution (CC BY) license (http://creativecommons.org/licenses/by/4.0/).