Article

Transitions and Geometric Evolution of Cu309 Nanocluster during Slow Cooling Process

1
College of Electric and Mechanical Engineering, Pingdingshan University, Pingdingshan 467000, China
2
College of Materials Science and Engineering, Jilin University, Changchun 130022, China
*
Author to whom correspondence should be addressed.
Crystals 2018, 8(5), 231; https://doi.org/10.3390/cryst8050231
Submission received: 12 April 2018 / Revised: 16 May 2018 / Accepted: 17 May 2018 / Published: 21 May 2018

Abstract

:
Since the nucleation and growth of clusters is usually a non-equilibrium condensation process, a distribution of structural isomers for a given cluster size may be encountered even under the same conditions. In this work, molecular dynamics simulations are performed on sets of molten clusters of Cu309 to study their structures at low temperatures while controlling the cooling rate. Several different final structures including perfect icosahedra (ICO), imperfect Mark’ decahedra (MDEC) and imperfect FCC truncated octahedra (TOCT) are obtained even at the same cooling rate. It is calculated that the most favorable structure is icosahedra, which becomes more and more favorable as the cooling rate is slowed. To better understand the process of crystallization, several techniques, including potential-temperature curves, common neighbor analysis (CNA) and radial distribution function (RDF), are used to analyze and study the structural transition. Results show that different structures are obtained under identical conditions due to the stochastic nature of nucleation and relatively small energy difference between isomers. The process of geometrical evolution for icosahedra is given by comparing and analyzing the time evolution of the root-mean-square deviation (RMSD) of atoms located in every shell.

1. Introduction

Metal nanoclusters containing tens to thousands of metal atoms with a large surface area to volume ratio, showing many specific differences in physical and chemical properties from the corresponding bulk, are considered to have great potential applications in efficient catalytic [1,2,3,4,5], nano-equipment assembly [6,7] and other innovative technology fields [8,9]. In recent years, due to scientific research and technological progress, self-assembly and artificial assembly of nanostructure systems or devices have been increasingly attracting attention [10]. The design and generation of nano-units (nanoclusters, nanotubes, nanorods, etc.) with a specific size and structure are required to meet technological applications in accordance with people’s idea. In other words, the requirement for nanomaterial accuracy in terms of size and structure is becoming more and more urgent. However, it is difficult to prepare a large ensemble of nanoclusters with a narrow size distribution, as well as a unified structure, in experiments [11,12,13,14]. Therefore, the application of a metal cluster as an element cell in nanodevices and other innovative technology calls for exact knowledge of nucleation, growth and geometrical evolution required for the selection of reasonable experimental conditions for controlling the sizes and structures [15,16].
Cu nanoclusters attract great interest because of their catalytic activity, high conductivity and excellent plasmon response, which allow them to be widely used in industrial catalysis [17], nano-photoelectric equipment [18] and sensor technology [19]. However, these properties and applications strongly depend, not only on cluster size, but also on their structures. This dependence has inspired extensive exploration on size- and shape-controlled synthesis. Theoretical and experimental results have shown that the morphology of Cu clusters strongly depends on the size and the heat treatment process, indicating that large-size clusters tend to produce face-centered cubic (FCC) stacking structures, while small-size clusters tend to form icosahedrons (ICO) [20,21,22,23]. However, for the intermediate-size, a distribution of structural isomers may be encountered because of the small energy gap between different configurations and the randomness of nucleation from the non-equilibrium condensation process [24,25,26]. Thus, it is necessary to consider this randomness of nucleation in a more rigorous simulation. As for the heat treatment process, most studies focused on the correlation between the heating/cooling processes and the structural transformation or evolution [21,22,23,24,25,26], but there are very few statistical investigations into the cooling rate and structural diversification. Yuan et al. [15,27] have done some work on this, although their investigations were limited to the statistics of cooling rate and lack research on structural diversity samples. Considering the potential utilization of Cu clusters in complex and diverse environments, the stability of structures becomes essential, especially for small-size clusters. Magic-size clusters show great potential because they have more perfect and stable structures. In this work, the magic-size Cu309 is therefore adopted as a projectile of double statistics investigations into cooling rates and diversified structures.
In this paper, 10 molten Cu clusters containing 309 Cu atoms are randomly selected as the initial configurations. Molecular dynamics method is performed to detect the possible final structures at different cooling rates during slow condensation. To better understand the process of structural transition, several analytical techniques, including potential temperature curves, common neighbor analysis (CNA), radial distribution function (RDF) and root-mean-square deviation (RMSD), are adopted. With these techniques, the structural transition behavior of several typical competitive structures, including perfect icosahedra (ICO), imperfect Mark’ decahedra (MDEC) and imperfect FCC truncated octahedral (TOCT), obtained at the same cooling rate, is presented. Furthermore, we sketch out clear dynamic images of geometric evolution for icosahedra clusters by backtracking the root-mean-square deviation (RMSD) of atoms located in different shells.

2. Simulation Details

In this work, the massively parallel LAMMPS code package [28] was used to perform molecular dynamics simulations. The embedded atomic method (EAM) model was employed to describe the interaction potential between Cu atoms. The original parameters of Cu EAM were derived from Mishin et al [29], which have been proved to successfully model Cu crystal and cluster [30,31,32]. The Verlet method was used to integrate the classical equation of motion with a time-step of 2.5 fs. All molecular dynamics (MD) simulations are performed in a conserved system with fixed number of atoms N, system volume V and temperature T (NVT ensemble). The temperature is controlled by a Nose-Hoover thermostat with a relaxation time of 250 fs (100 times time-step).
A nanosphere containing approximately 309 Cu atoms was cut off from a face centered cubic (FCC) Cu bulk and placed in a larger cubic simulation box. First of all, the simulation system containing 309 Cu atoms was heated from 300 K to 1200 K to ensure that the Cu cluster was in a well-defined liquid state [33,34] and, additionally, to equilibrate the system with 40 million time-steps at 1200 K. A configuration every 20,000 time-steps was recorded during the equilibrating process and, meanwhile, a total of 10 initial structures of the molten clusters were randomly obtained for cooling runs.
Annealing procedures were applied to the 10 initial structures by controlling the cooling rate using the following equations: γ 1 = 8.0 × 10 4 K/fs, γ 2 = 4.0 × 10 4 K/fs, γ 3 = 8.0 × 10 5 K/fs, γ 2 = 4.0 × 10 5 K/fs, γ 5 = 2.0 × 10 5 K/fs and γ 6 = 1.0 × 10 5 K/fs. First, the system was cooled from 1200 K to room temperature (300 K), with temperature steps of 20 K, and equilibrated at each temperature level with the same time-steps as the cooling phase. Then, it was steeply cooled from 300 K down to 0 K. A total of 60 final configurations, obtained at 0 K, were used to investigate the possible isomers and their distributions [35]. Here, the cooling rates were calculated by considering only the time spent during the cooling process (excluding equilibrium time). Considering the time spent in the equilibrium phase at every temperature level, the average cooling rates were half those of the rates given here.

3. Results and Discussion

3.1. Effect of Cooling Rate on Structures

Common neighbor analysis (CNA), described in Faken [36] and Tsuzuki [37], was adopted to identify the types of final structures and analyze the process of structural transition. The CNA methodology is a useful measure of the local crystal structure around an atom. In the LAMMPS modifier with CNA, there are five kinds of CNA patterns, recognized as FCC = 1, HCP = 2, BCC = 3, ICO = 4 and unknown = 5, respectively. Here, the cutoff distance, a threshold distance criterion which was used to determine whether a pair of atoms is bonded or not in simulation, was 3.15 Å, attained according to the position of the first minimum in the RDF of an FCC Cu crystal structure. Meanwhile, a computation of the Centro-symmetry parameter for each atom in the group was used as an auxiliary means to characterize whether an atom was part of a perfect lattice, a local defect or a surface [38].
Several different final structures, including perfect ICO, imperfect MDEC and imperfect TOCT, were detected by CNA with the auxiliary of the Centro-symmetry parameter (as shown in Figure 1). A perfect ICO is presented in Figure 1a. It is comprised of 20 structurally-identical FCC tetrahedral units with (1 1 1) surfaces, where adjacent tetrahedral faces meet at a twin plane and all tetrahedral units share a common vertex atom located in the icosahedra center. In a tetrahedral unit, there are three kinds of local environment atoms distributed in three different sites, namely an FCC environment, corresponding to internal atoms of a tetrahedral unit, a hexagonal close packed (HCP) local symmetry, corresponding to the atoms on the twinning plane, and a 5-fold symmetry, which lies on the connection lines between the central atom and the surface vertex atoms. In this perfect ICO structure, only the shared vertex atom located at the center is a truly icosahedra local symmetry. An imperfect MDEC structure with 5-fold symmetric features is presented in Figure 1b. Similar to the ICO, the MDEC consists of 5 slightly distorted truncated FCC tetrahedral units with 10 (1 1 1) and 5 (1 0 0) faces joined together by a shared line. Between the adjacent (1 0 0) faces, the grooving with one atomic layer thickness was cut open. The atoms on the shared line were 5-fold symmetrical structures, and the 5 cut-off tetrahedrons with an FCC local structure adjacent to each other formed multiple twins, where the atoms on the twin planes also had HCP local symmetry. A set of FCC crystal structures with TOCT features is presented in Figure 1c–f, and a single crystal containing 8 closely packed (1 1 1) faces and 6 square stacked (1 0 0) faces with only one crystal orientation (as shown in Figure 1c). A twin crystal with two crystals orientation is presented in Figure 1d, and polycrystalline structures with two crystal planes containing three crystals orientation are presented in Figure 1e,f. The atoms that make up the crystal interfaces of twin crystals and polycrystalline have an HCP local structure. In those polycrystalline structures, two crystal faces were parallel or intersect. Except for the perfect icosahedra structure, the other final structures were almost imperfect, namely, they contained local defects, and the shapes were not standardized.
The distributions of final structures for Cu309 clusters, frozen according to different cooling rates, were added up (as shown in Table 1). Clearly, in the entire cooling rate range, the most favorable structure was the perfect icosahedra. However, the other two types of MDEC and TOCT (including single crystal, twin, polycrystalline), even though they accounted for a few, were also formed spontaneously. It is also obvious, from Table 1, that the structure of ICO became more and more favorable as the cooling rate was slowed, and it had almost 100% probability when the cooling rate was reduced to γ 6 = 1.0 × 10 5 K/fs. It seems that even the slowest cooling rate in the simulation was so quick that it was difficult to achieve in real experiments. This is because of the difference in time scales between MD simulations and real experiments. In MD simulations, a quicker cooling rate is often employed to obtain an undercooled liquid, from which nucleation occurs spontaneously [39]. In this work, we first used a quicker cooling rate, by controlling the number of time-steps in the cooling phase, and then a slower average cooling rate was obtained by adding a number of time-steps, equilibrated at each temperature level.

3.2. Structural Transition Process

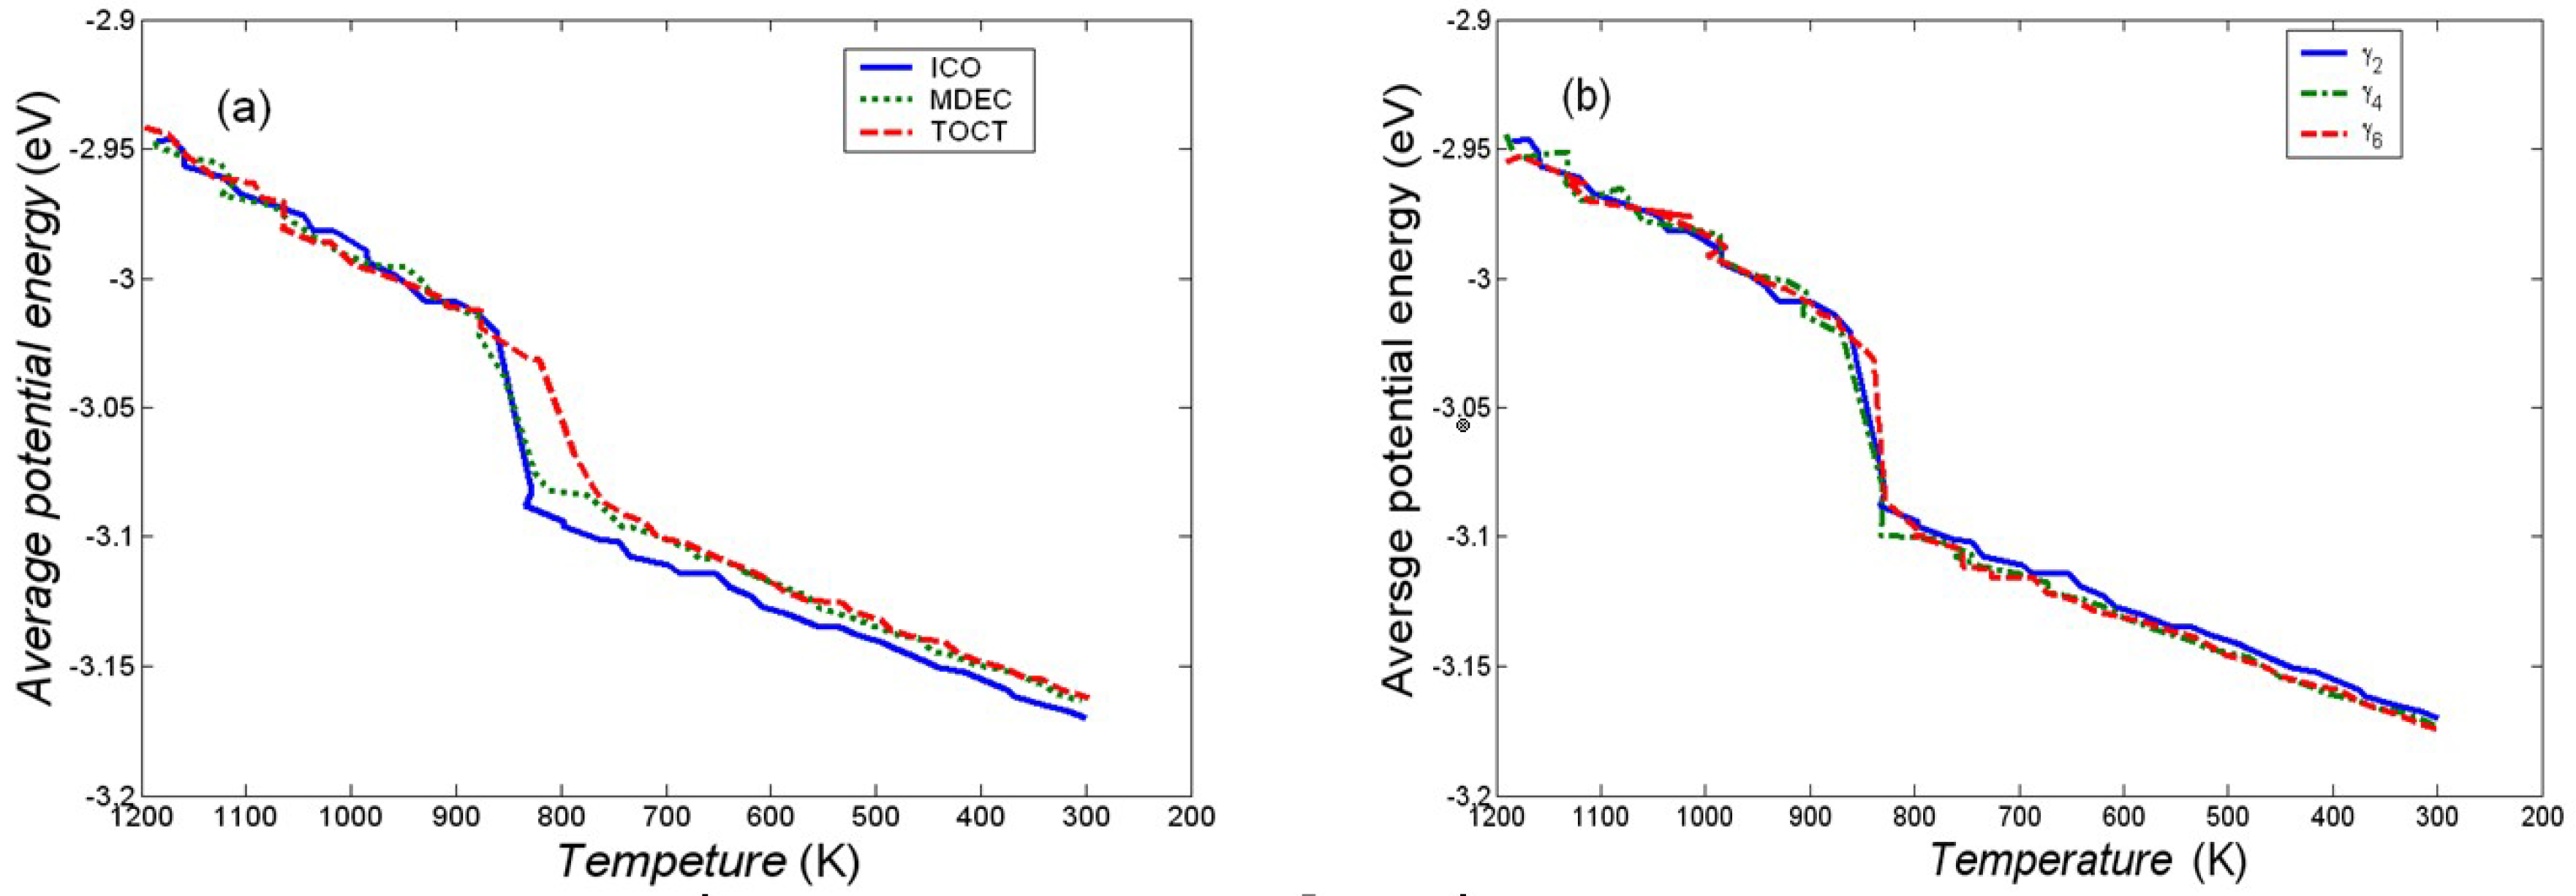
The average atomic potential energy as a function of temperature can reflect thermodynamic information and behaviors in structural transition process, such as freezing point, system stability and heat capacity [40]. The average atomic potential energy dependence on temperature, with respect to the three typical competitive structures obtained at the same cooling rate of γ 2 = 4.0 × 10 4 K/fs, is shown in Figure 2a. It can be seen, from Figure 2a, that the curves of the three competing structures were obviously undulating and intertwined in the higher temperature interval (1200~900 K), while in the lower temperature interval (780~300 K), the curves were almost linear. It is worth noting that in the middle, during a shorter temperature interval (900~780 K), the curves of atomic potential of the system rapidly decreased, indicating that structural transition (solidification) occurred in this temperature range. Compared to the three curves of the transition process, it can be seen that the transition slope, with respect to the ICO clusters, was most significant, indicating that the solidification process was the fastest. The freezing point, both of ICO and of MDEC, was near 840 K, while the freezing point of TOCT was lower at about 800 K. In the lower temperature range, the icosahedra curve was lower than those of the other two, between which there was almost no difference. We also extracted the average atomic potential energy corresponding to the three typical configurations of ICO, MDEC and TOCT at 0 K, which were equal to −3.212 eV, −3.203 eV and −3.202 eV, respectively. The energy barrier between MDEC and TOCT was only 0.001 eV. However, the barrier between ICO and the latter two was about 0.01 eV. This result also indicated that the icosahedral structure was more stable than the other two types.
In order to investigate the dependence of the freezing point on the cooling rate, we also present the temperature-potential energy curves of icosahedrons formed at three different cooling rates, as shown in Figure 2b. It can be seen that the freezing point was almost unchanged, except that the curves of 𝛾4 and 𝛾6 were lower in the low temperature region. From this, it can be inferred that slowing down the cooling rate contributes to a lower potential and a more stable configuration.
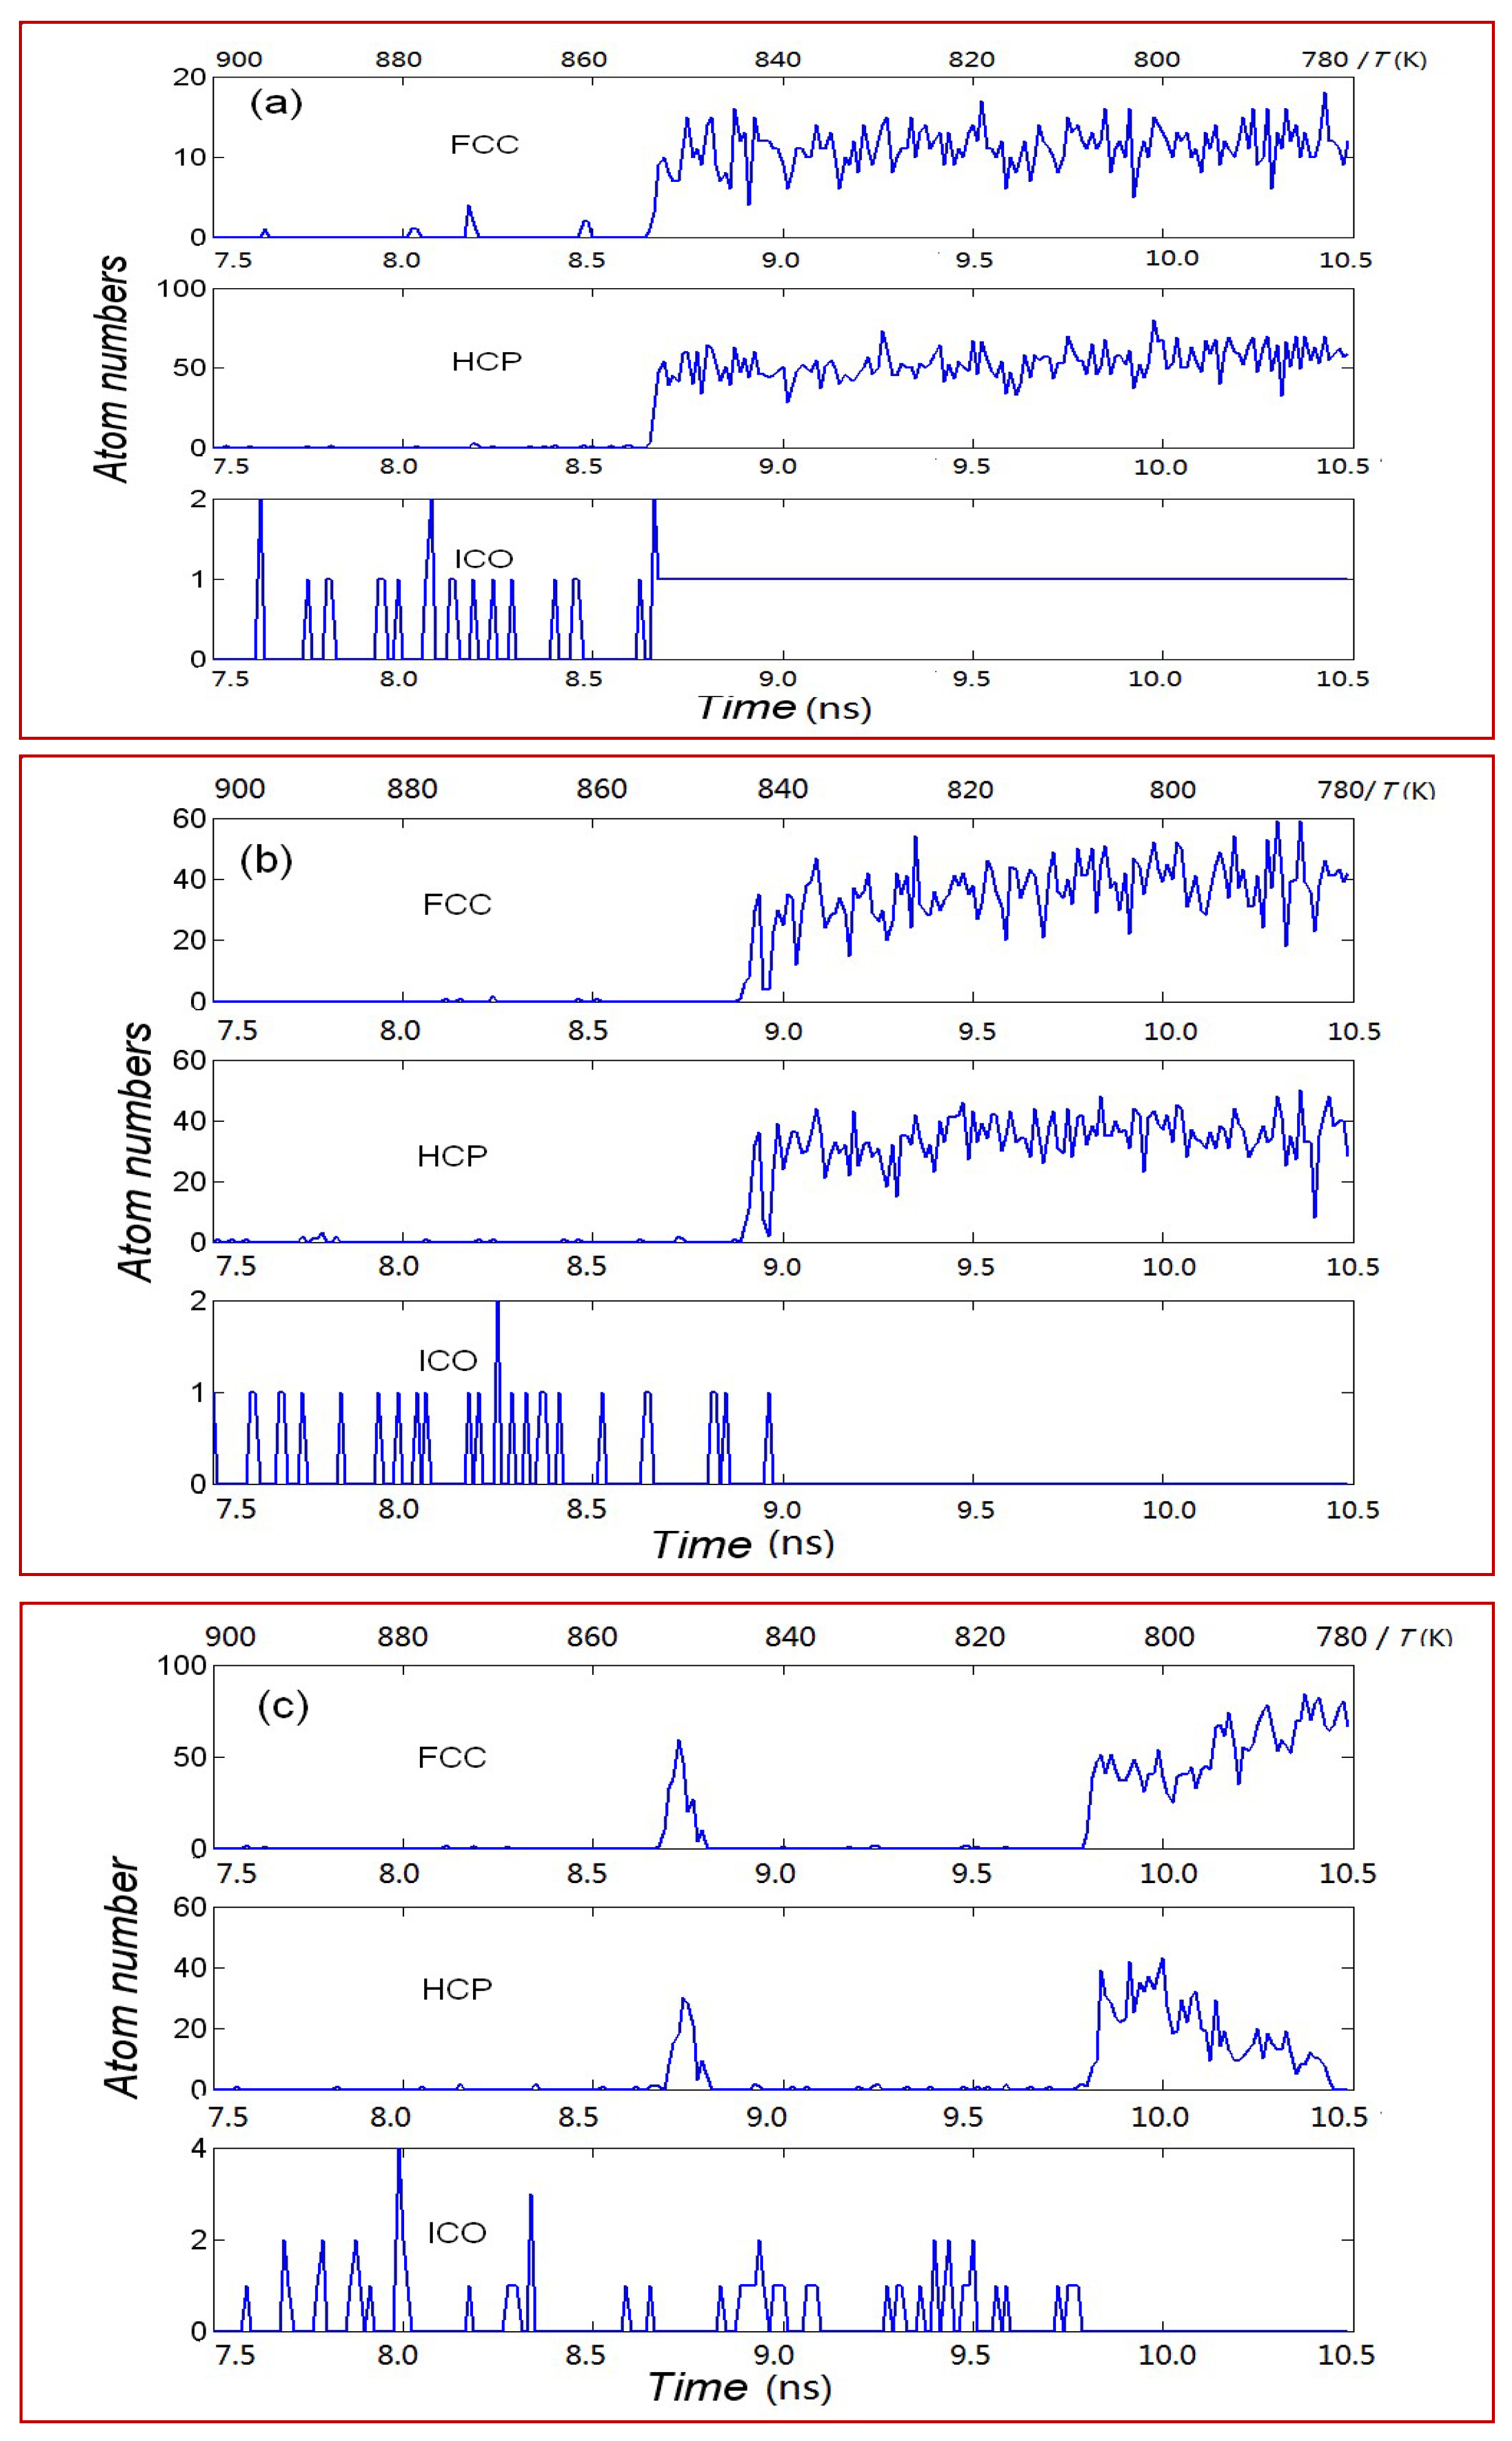
CNA is a means of getting information regarding an atomic local structure in a cluster by analyzing the bonding relationship between an atom and its neighbors. The results of the CNA for three typical competitive structures (ICO, MDEC and TOCT), during the transition process (900–780 K) when the cooling rate is γ 2 = 4.0 × 10 4 K/fs, are shown in Figure 3. The final structures, corresponding to Figure 3a–c, are ICO, MDEC and TOCT, respectively. Each image from top to bottom is the time evolution of the number of atoms corresponding to the three different local environments of the FCC, HCP and ICO, respectively.
For ICO, the transformation point occurs at 8.6 ns and the corresponding temperature is in the vicinity of 840 K, as shown in Figure 3a. Its salient feature is manifested as the presence of a hereditary icosahedra symmetry atom, located in the center of the cluster. We traced the coordinates of the center atom and found that the atom was always near the geometric center of the cluster from the moment of phase change. Its coordinate position was almost unchanged, like a star of a fixed disk, and other atoms surrounding the center, with an FCC or HCP local structure, oscillated and gradually increased. For 0 K configuration, there are 20 FCC local symmetry atoms and 90 HCP local environment atoms (here, only core atoms that had 12 or more neighbors with a well-defined local structure by CNA were counted).
The time evolutions of the number of atoms with different local environments corresponding to MDEC are shown in Figure 3b. The structural transition point occurred at 8.9 ns and the corresponding temperature was near 840 K. At the structural transition point, the number of atoms, both in the FCC and in the HCP local environment, increased abruptly, while one or two atoms with icosahedra symmetry emerged occasionally before disappearing.
As shown in Figure 3c, the structural transition point occurs at 9.8 ns and the corresponding temperature is near 800 K for a TOCT structure. Similar to MDEC, the number of atoms, both in an FCC and in an HCP local structure, also increases abruptly at the transition point. However, the number of atoms with FCC oscillation later increases, while the number of atoms with an HCP local structure is gradually reduced. Meanwhile, one or two atoms with icosahedra symmetry emerged occasionally before also disappearing. It is noteworthy that the number of atoms with the FCC and HCP local structures also peaked during the 8.6~8.8 ns time interval before phase change, but soon disappeared and eventually failed to nucleate.
Based on the results of comprehensive CNA, we find that there are no significant differences in the internal environment of the liquid before the phase change occurred for the three typical structures of the final state. Different structures are obtained under the same simulation conditions due to the randomness of nucleation and the small energy gap between different configurations.
Radial distribution function (RDF) refers to the probability of the distribution of other particles in the space surrounding a particle. It is often used to study the orderliness of liquids and amorphous systems. It can also be used to analyze the solidification and melting behavior of the system by comparing the RDF curves of the equilibrium system at different temperatures in the process of heating or cooling, and to determine the freezing point and the melting point. The RDF can be expressed as [41]:
g ( r ) = 1 N ( N 1 ) i = 1 N 1 j 1 N δ ( r r i j )
where N represents the number of atoms in the spherical shell from r to r + Δ around the ith atom. rij is the distance between atomic i and atom j. δ is a symbol of Dirac.
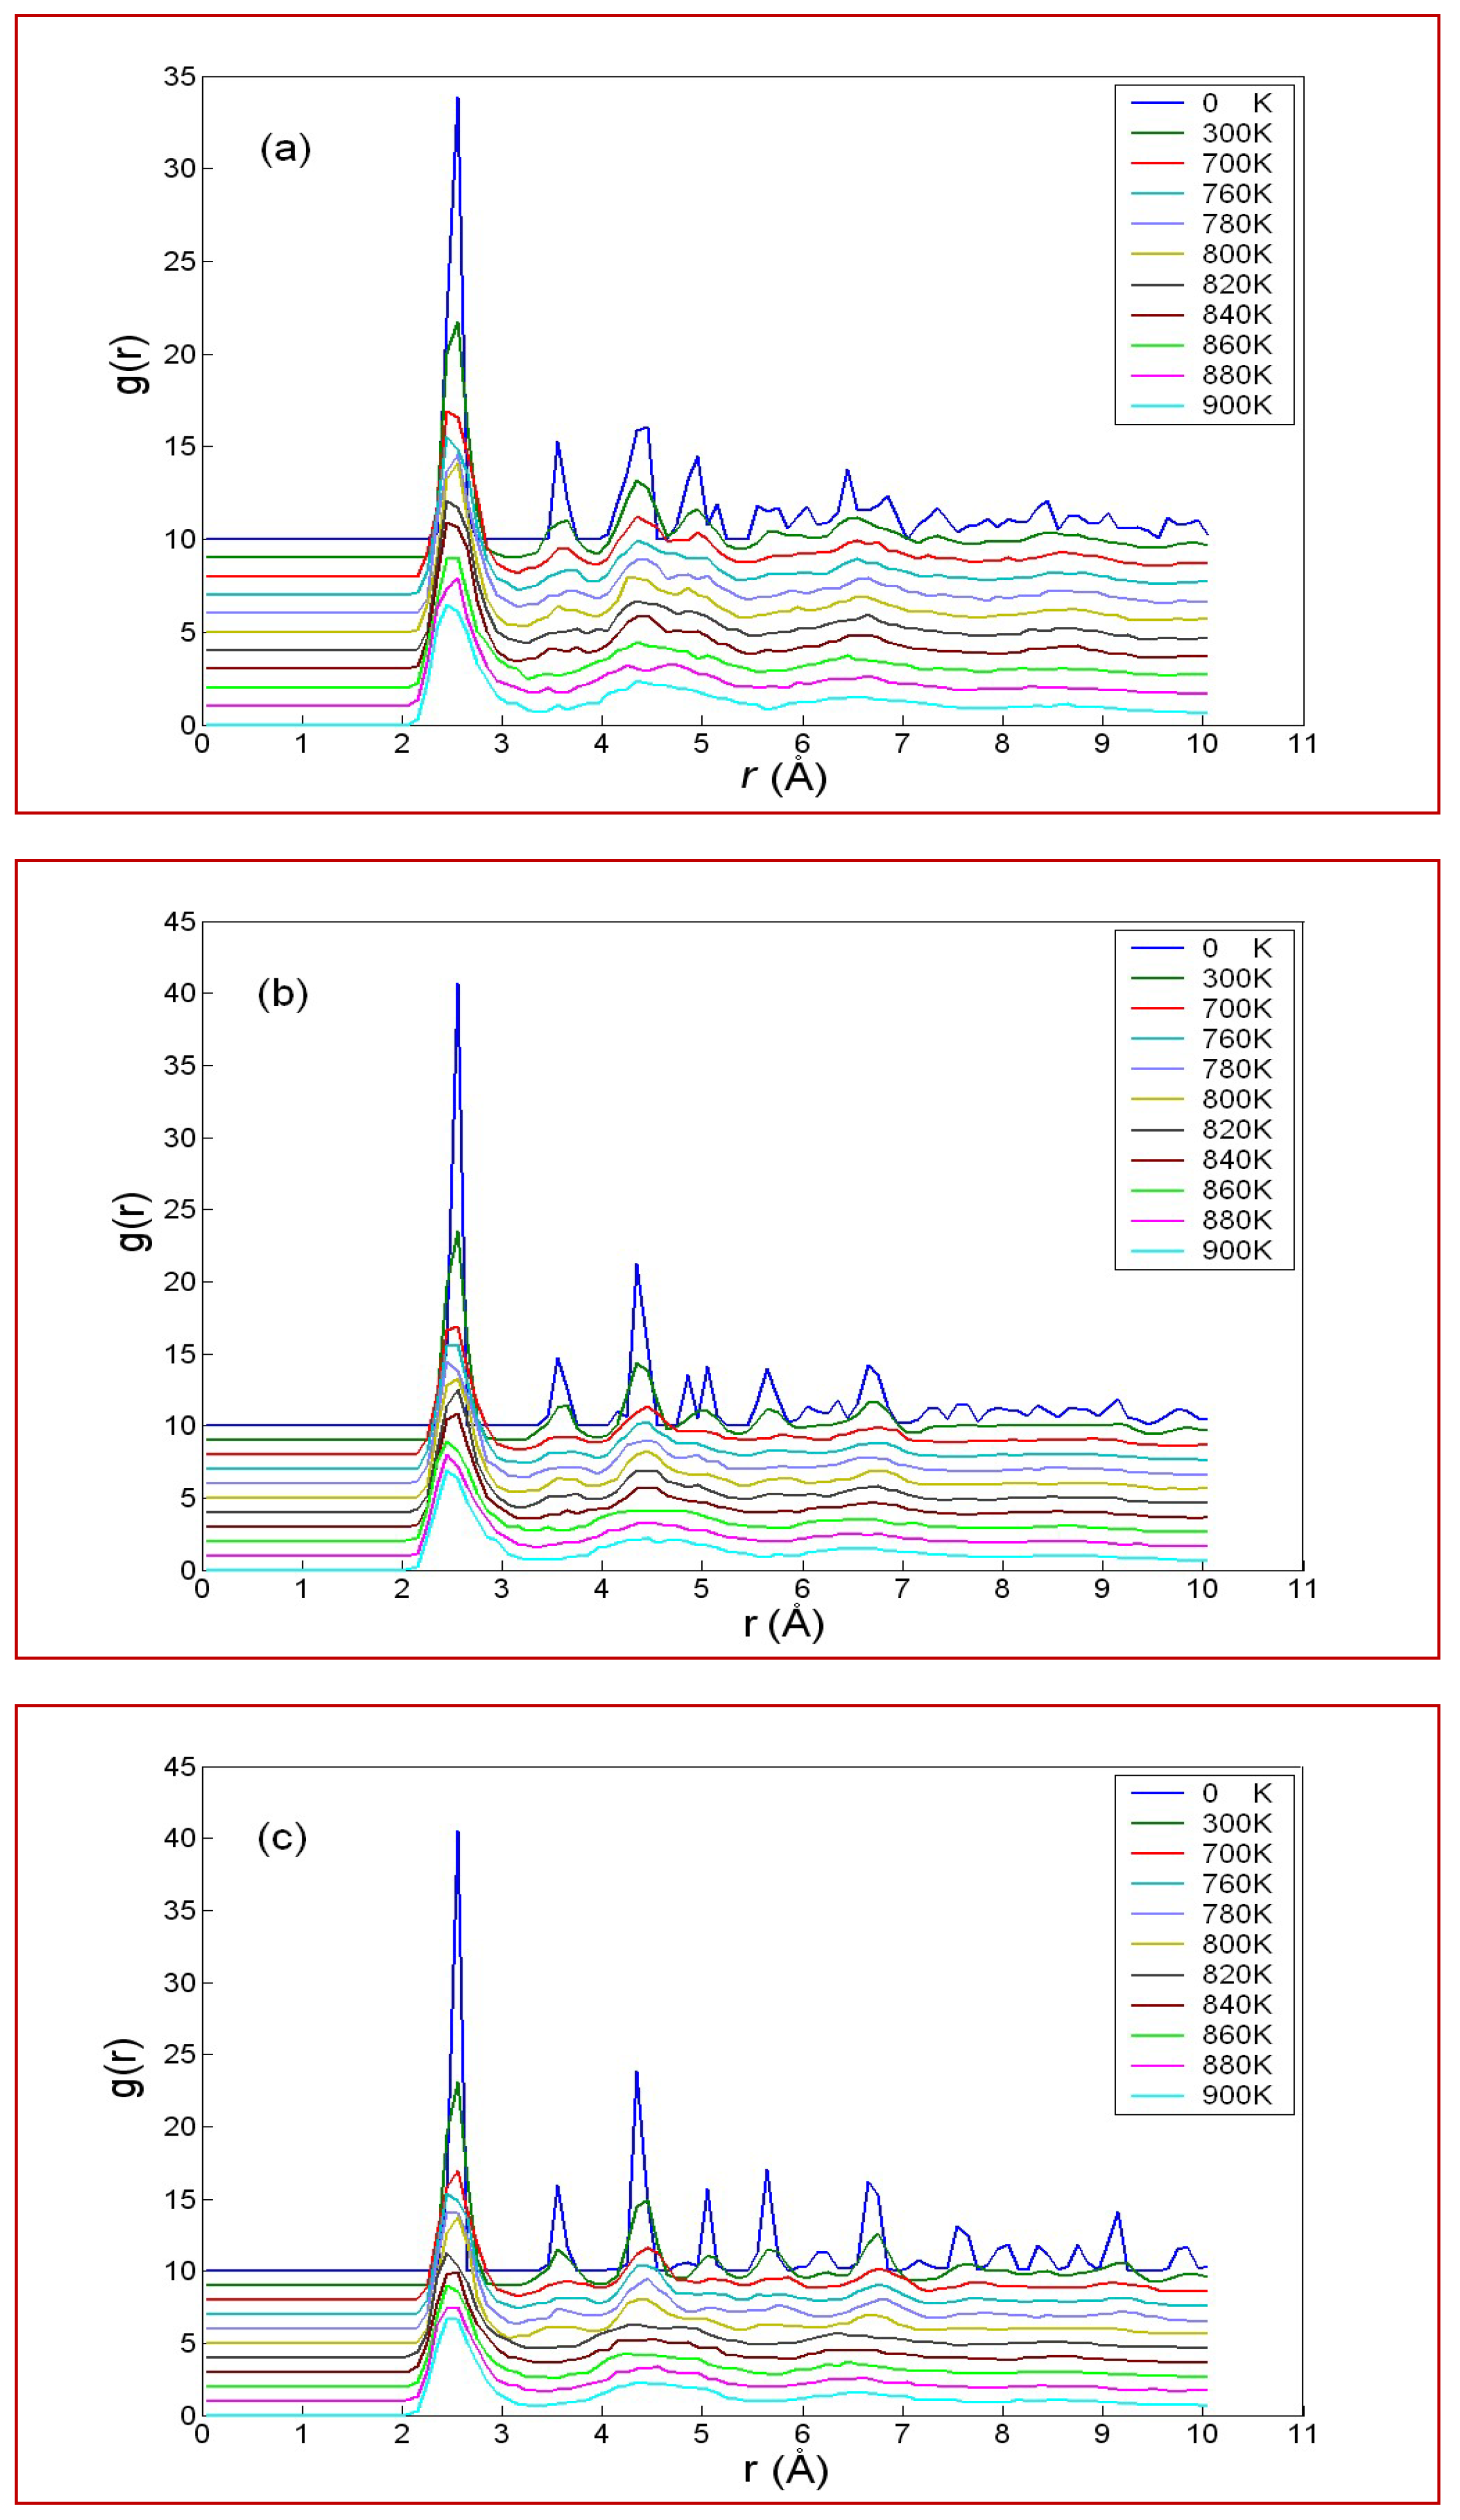
The temperature dependence of RDF during the cooling process for three different typical structures, corresponding to ICO, MDEC and TOCT, are shown in Figure 4. It can be seen that, when the temperature is higher (in Figure 4a,b, the temperature is higher than 840 K, while in Figure 4c, it is above 800 K), all of the RDF curves have only long-range peaks, indicating that the system is in a liquid state. For the curves relating to ICO and TOCT, when temperature drops to 840 K a shoulder between the first and second neighbors begins to appear. Meanwhile, the second nearest neighbor begins to split, indicating that the system is beginning to undergo a phase change from disorder to order. It can also be inferred that the freezing point is in the vicinity of 840 K, both for ICO and MDEC. Similarly, for TOCT, it is in the vicinity of 800 K. As for the freezing point, the results of both the RDF and the CNA are self-consistent.

3.3. Geometric Evolution of Icosahedra

The root-mean-square deviation (RMSD) is the measure of the average distance between the position of tagged atoms in the t-time configuration and the position in the target configuration. It can be expressed as follows [42]:
R M S D = 1 N i = 1 N v i 2
where vi represents the distance between the position of the ith atom in the t-time configuration and the position in the final state configuration, and N is number of the tagged atoms.
The icosahedra cluster has a centro-symmetric and shell-core structure in geometrical configuration. In order to further understand the time evolution of the icosahedra cluster in the geometrical configuration, we present the time evolution of RMSD for the atoms distributed on different spherical shells with different local environments, which can be used to measure the motion of tagged atoms. To this end, we first calculate the distance Ri of the surrounding atom from the center atom for an icosahedra structure obtained at 0 K, which is defined as the target configuration. Then, according to Ri, the other 308 atoms, except for the center atom, are distributed in 10 spherical shells with different radii Ri. The distances, number of atoms and local structures of the atoms located in each shell for the target configuration are listed in Table 2.
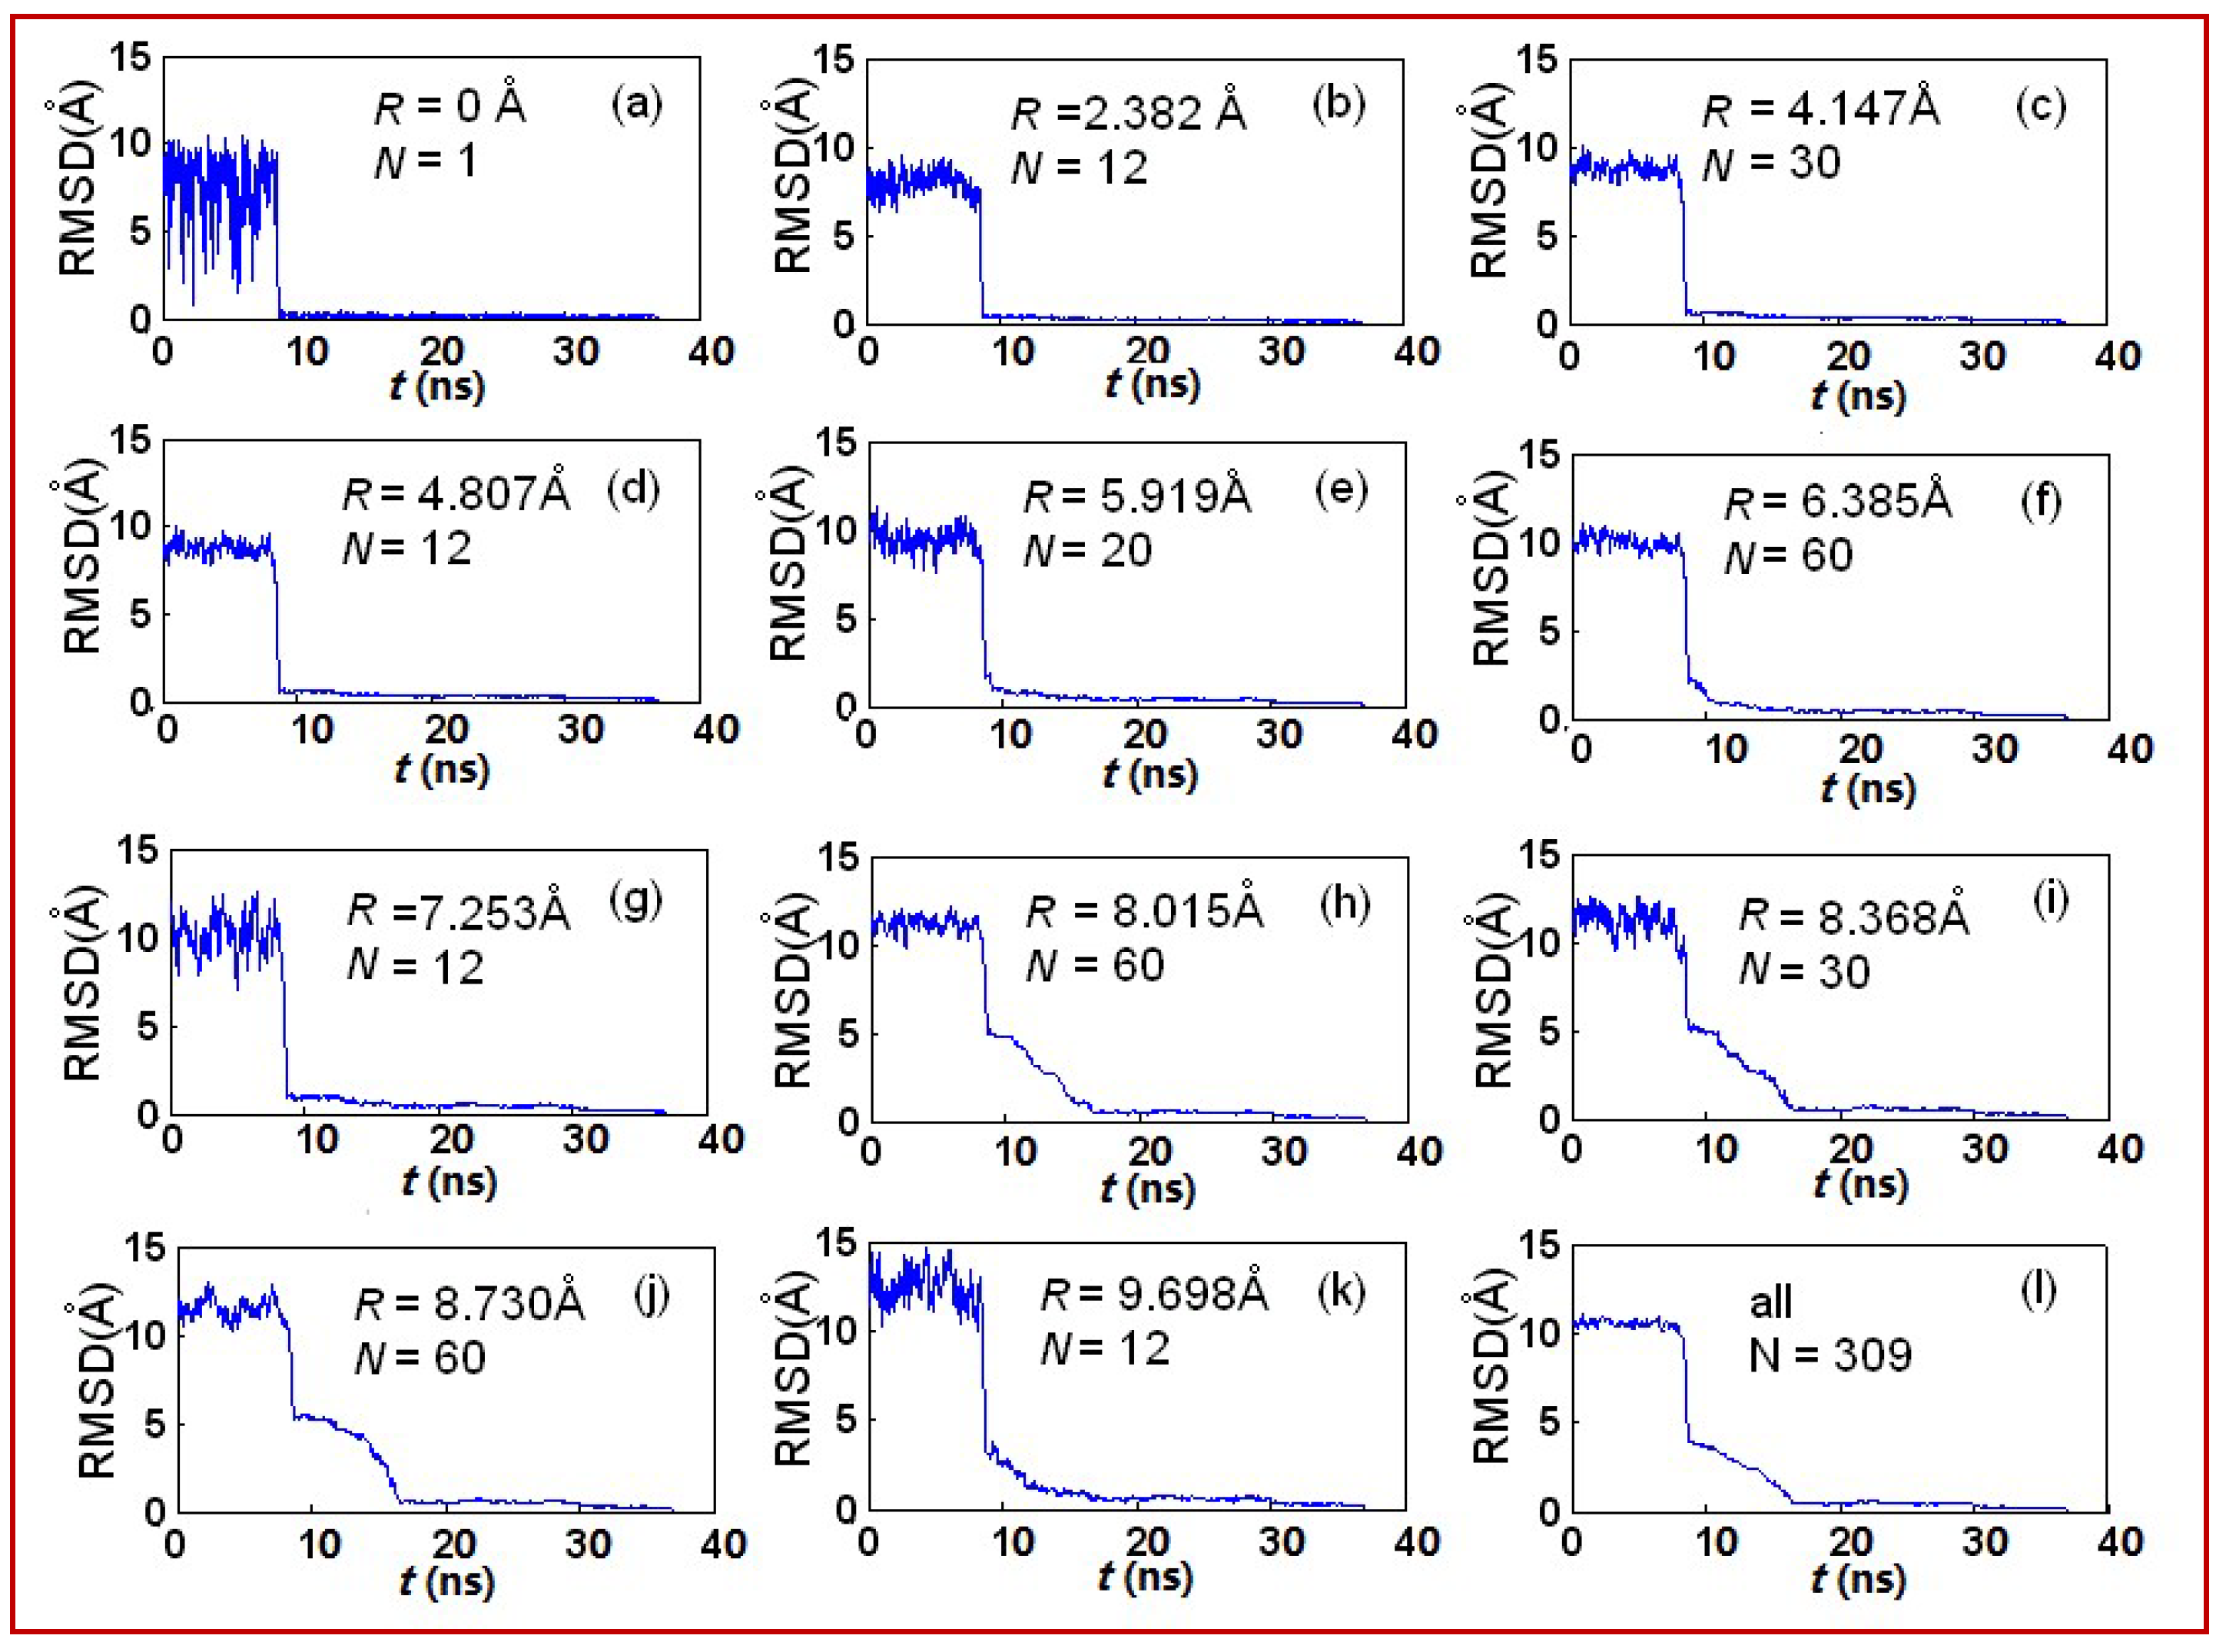
We present the time evolution of the RMSD for the atoms on different shells of icosahedra in Figure 5a–k. For comparison, we also give the RMSD curve for all atoms, as shown in Figure 5l. As can be seen in Figure 5a, which shows the time evolution of the RMSD of the central atom, the center atom vibrates violently before the phase transition occurs. At the moment of phase change, it suddenly jumps to the position of the geometric center corresponding to the 0 K configurations, and the transition is so fast that the curve’s steep is almost vertical. Next, the RMSD value quickly jumps to 0 Å and continues to the final state, which means that the central atom has been keeping a fixed position from the moment of phase change to the final state. The time evolution curves of the RMSD for different shells are shown separately in Figure 5b–k. It is easy to find that, from the inner to the outer layer, the RMSD curves’ steepness gradually slows down in the transition period and then approaches the corresponding position of the 0 K configurations, which also indicates that the time for the inner atoms to reach the equilibrium position is quicker than the outer atoms during the cooling process. It should be noted that the curves shown in Figure 5d,g,k become slightly steeper than that of their adjacent inner layer in the transition, and the atoms on these shells simply lie on the lines between the central and the vertex atoms and have 5-fold symmetrical local structures, like the skeleton of an umbrella. This indicates that the atoms located on the twelve skeletons of ICO arrive at the equilibrium position earlier than their adjacent inner shell atoms.
From Figure 5a–k, we can simply depict the geometrical evolution of ICO, where the central atom is first fixed and the other atoms are rapidly moved to the vicinity of the equilibrium position of each shell. The inner layer atoms reached the equilibrium position faster than the outer; however, those atoms on the icosahedra skeleton reached it slightly earlier than their adjacent inner layer.

3.4. Discussion

It is not surprising that the perfect ICO structure can maintain a dominant distribution in the three competitive structures of Cu309 isomers throughout the survey range for the cooling rate. For the size dependence of the structure, Baletto et al. [23] has given a very concise calculation formula and an estimation method by comparing the residual energy of three typical structures with different sizes and giving the size distribution maps of the remaining energy calculated by EAM potentials (as shown in Figure 5 of Baletto et al [23]). It has been found that Cu clusters present a broad-size window (N < 1000) in which ICO are the best structures with the lowest residual energy compared to decahedrons and FCC structures. At N = 309, the residual energy of an icosahedral structure is significantly lower than that of decahedral and FCC structures. However, there is a small energy difference between the decahedral and FCC structures. Focusing on Figure 2a, the potential energy curve of ICO is significantly lower than the curves of the MDEC and TOCT. However, the potential energy gap between the MDEC and TOCT is very small. There is agreement between the potential energy shown in this work and the residual energy calculated in [23]. Focusing on Table 1 in this work, for the entire 60 final configurations simulated, the output of the three typical structures is as follows. ICO is 43, MDEC is 8 and TOCT is 9. Obviously, the output of ICO has significant advantages, while the outputs of MDEC and TOCT are almost equal. Obviously, the configuration with the lowest potential energy has the highest probability, and the two configurations with little difference in potential energy have almost the same occurrence probability.
In the identification of the isomeric structure, we used the 0 K configurations in order to accurately obtain the atomic coordinates of the final configuration of CNA and RMSD calculations. One question may be raised. Do the 0 K configurations represent the 300 K configuration? In other words, is there any structural transition during the cooling process to 0 K? We tracked and visualized the dynamic maps of the 60 configurations and found no structural transformation after crystallization. However, this transformation has been discovered in the study of alloy nanocrystals under ultra-low temperature environments. [43].
Another possible argument arises from the effect of the cooling rate on the structure and freezing point. Some previous results showed that the structure and freezing point of metal clusters have a significant dependence on the cooling rate [27,39]. For example, the reporting from Shibuta et al. [39] on the relationship between the cooling rate and cluster structure, as well as the solidification point, found that the single-crystalline, polycrystalline then glassy structure of Mo6750 nanoparticles are obtained as the cooling rate is increased. The solidification point decreases as the cooling rate increases and then drops rapidly at a cooling rate of 1012 K/s. Our work shows that this is merely due to a dependence on the distribution of isomers. As the cooling rate slows down, this dependence is weakened. This is because the ultra-slow cooling approaching the equilibrium state will eventually lead to a purified population of the minimum energy structure. If random nucleation of isomers during non-equilibrium condensation is considered, these results [27,39] may be consistent with the results presented in this work.

4. Conclusions

Molecular dynamics simulations have been performed on sets of molten clusters of Cu309 to detect their possible structural isomers at low temperatures by controlling the cooling rate. Several different final structures, including perfect ICO, imperfect MDEC and imperfect TOCT, have been obtained, even at the same cooling rate. In all Cu309 isomers, the icosahedra is undoubtedly the most competitive. However, other configurations, such as MDEC and TOCT (including single crystal, twin and polycrystalline), even though they account for a few, are also generated spontaneously. As the cooling rate slows, the output of the icosahedra structure clusters increases. Results also reveal a route to obtaining and purifying the lowest energy configuration for clusters by controlling the cooling rate. The dynamic process of the geometrical evolution of ICO is also given by tracing back the time root-mean-square deviation of the atoms located in a different shell with a different local structure.

Author Contributions

Mingli Tian conceived the idea. Pengfei Ji performed the numerical simulations. Yi Zhao and Mingli Wan analyzed the data. Mingli Tian and Jinna He wrote the manuscript. All authors discussed the results and contributed to the manuscript.

Acknowledgments

This work is supported by the National Natural Science Foundation of China (Grant No. 11575090 and 11704208), the Key Research Project of Henan higher education institutions (Grant Nos. 15A140031 and 18A140006) and the high-level Initial Funding of Pingdingshan University (Grant No. PXY-BSQD-2017002).

Conflicts of Interest

The authors declare no conflicts of interest.

References

  1. Weber, A.P.; Davoodi, P.; Seipenbusch, M.; Kasper, G. Catalytic behaviour of nickel nanoparticles: Gasborne vs. supported state. J. Nanopart. Res. 2006, 8, 445–453. [Google Scholar] [CrossRef]
  2. Prieto, G.; Zečević, J.; Friedrich, H.; de Jong, K.P.; de Jongh, P.E. Towards stable catalysts by controlling collective properties of supported metal nanoparticles. Nat. Mater. 2013, 12, 34–39. [Google Scholar] [CrossRef] [PubMed]
  3. Fissan, H.; Kennedy, M.K.; Krinke, T.J.; Kruis, F.E. Nanoparticles from the gas phase as building blocks for electrical devices. J. Nanopart. Res. 2003, 5, 299–310. [Google Scholar] [CrossRef]
  4. Lee, T.; Liu, J.; Chen, N.P.; Andres, R.P.; Janes, D.B.; Reifenberge, R. Electronic properties of metallic nanoclusters on semiconductor surfaces: Implications for nanoelectronic device applications. J. Nanopart. Res. 2000, 2, 345–362. [Google Scholar] [CrossRef]
  5. Shibuta, Y.; Suzuki, T. Melting and nucleation of iron nanoparticles: A molecular dynamics study. Chem. Phys. Lett. 2007, 445, 265–270. [Google Scholar] [CrossRef]
  6. Castelletto, S.; Boretti, A. Noble metal nanoparticles in thin film solar cells. Nanosci. Nanotechnol. Lett. 2013, 5, 36–40. [Google Scholar] [CrossRef]
  7. Joo, S.H.; Choi, S.J.; Oh, I.; Kwak, J.; Liu, Z.; Terasaki, O.; Ryoo, R. Ordered Carbon Nanopipes with Tunable Diameter Exhibiting Extraordinary High Dispersion of Pt Nanoparticles. Nature (London) 2001, 412, 169–172. [Google Scholar] [CrossRef] [PubMed]
  8. Gittins, D.I.; Bethell, D.; Schiffrin, D.J.; Nichols, R.J. A nanometre-scale electronic switch consisting of a metal cluster and redox-addressable groups. Nature (London) 2000, 408, 67–69. [Google Scholar]
  9. Gusev, A.I. Nanomaterialy, Nanostruktury, Nanotekhnologii (Nanomaterials, Nanostructures, Nanotechnologies); Fizmatlit: Moscow, Russia, 2007. [Google Scholar]
  10. Andreeva, L.V.; Koshkin, A.V.; Lebedev-Stepanov, P.V. Crystallization of solutes from droplets. Tech. Phys. 2007, 52, 164–172. [Google Scholar] [CrossRef]
  11. Huang, C.J.; Chiu, P.H.; Wang, Y.H.; Chen, W.R.; Meen, T.H.; Yang, C.F. Preparation and Characterization of Gold Nanodumbbels. Nanotecnology 2006, 17, 5355–5362. [Google Scholar] [CrossRef]
  12. Sergeev, B.M.; Kiryukhin, M.V.; Bakhov, F.N.; Sergeev, V.G. Photochemical Synthesis of Silver Nanoparticles in Water Solutions of Polycarbon Acids. Matrix Effect on Size and Form of Particles. Vestn. Mosk. Univ. Ser. 2: Khim. 2001, 42, 308–314. [Google Scholar]
  13. Kauffeldt, E.; Kauffeldt, T. Thermodynamic-controlled gas phase process for the synthesis of nickel nanoparticles of adjustable size and morphology. J. Nanopart. Res. 2006, 8, 477–488. [Google Scholar] [CrossRef]
  14. Chushak, Y.G.; Bartell, L.S. Melting and Freezing of Gold Nanoclusters. J. Phys. Chem. B 2001, 105, 11605. [Google Scholar] [CrossRef]
  15. Yang, Q.W.; Zhu, R.Z. Freezing of Cu nanoclusters studied by molecular dynamics simulation. Acta Phys. Sin. 2005, 54, 4245–4250. [Google Scholar]
  16. Song, H.J.; Li, X.H. Molecular Dynamics Studies on the Kinetics of Phase Changes of Nanoparticles: Properties, Structures, and Crystal Nucleation of Copper Nanoparticle Cu453. Chin. J. Chem. 2006, 24, 273–278. [Google Scholar] [CrossRef]
  17. Zhang, C.L.; Li, C.P.; Bai, J.; Li, H.Y. A Cu Nanoparticle Embedded in Electrospundoped Carbon Nanofibers as Efficient Catalysts for Ullmann O-Arylation of Aryl Halides with arious Phenols. Catal. Lett. 2015, 145, 1764–1770. [Google Scholar] [CrossRef]
  18. Liu, C.Y.; Huang, J.T.; Lai, C.H. Influence of embedding Cu nano-particles into a Cu/SiO2/Pt structure on its resistive switching. Nanoscale Res. Lett. 2013, 8, 156. [Google Scholar] [CrossRef] [PubMed]
  19. Huang, M.; Zhang, Y.; Du, C.; Peng, S.; Shi, D. Plasmon Peak Sensitivity Investigation of Individual Cu and Cu@Cu2O Core–Shell Nanoparticle Sensors. Plasmonics 2016, 11, 1197–1200. [Google Scholar] [CrossRef]
  20. Korenchenkoa, A.E.; Vorontsova, A.G.; Gelchinskiib, B.R. Statistical Analysis of Formation and Relaxation of Atomic Clusters Based on Data of Molecular-Dynamic Modeling of Gas-Phase Nucleation of Metallic Nanoparticles. High Temp. 2016, 54, 229–234. [Google Scholar] [CrossRef]
  21. Chen, K.Y.; Liu, H.B.; Li, X.P. Molecular dynamics simulation of local structure of aluminum and copper in supercooled liquid and solid state by using EAM. J. Phys.-Condens. Matter 1995, 7, 2379–2394. [Google Scholar]
  22. Doye, J.P.K.; Wales, D.J. Magic numbers and growth sequences of small face-centred-cubic and decahedral clusters. Chem. Phys. Lett. 1995, 247, 339–347. [Google Scholar] [CrossRef]
  23. Baletto, F.; Ferrando, R.; Fortunelli, R.; Montalenti, F.; Mottet, C. Crossover among structural motifs in transition and noble-metal clusters. J. Chem. Phys. 2002, 116, 3856–3863. [Google Scholar] [CrossRef]
  24. Wei, C.M.; Cheng, C.; Chang, C.M. A structural path for the icosahedra fcc–structural transition in clusters. J. Mol. Liquids 2017, 230, 271–279. [Google Scholar]
  25. Kimizuka, H.; Kaburaki, H.; Shimizu, F.; Li, J. Crack-tip dislocation nanostructures in dynamical fracture of fcc metals: A molecular dynamics study. J. Comput. Aided Mater. Des. 2003, 10, 143–154. [Google Scholar] [CrossRef]
  26. Wu, Z.X.; Zhang, Y.W.; Jhon, M.H.; Srolovitz, D.J. Nanostructure and surface effects on yield in Cu nanowires. Acta Mater. 2013, 61, 1831–1842. [Google Scholar] [CrossRef]
  27. Yuan, Y.Q.; Zeng, X.G.; Chen, H.Y. Molecular dynamics simulation on microstructure evolution during during solidification of copper nanoparticles. J. Korean Phys. Soc. 2013, 62, 1645–1651. [Google Scholar] [CrossRef]
  28. Plimpton, S. Fast Parallel Algorithms for Short-Range Molecular Dynamics. J. Comput. Phys. 1995, 117, 1–19. [Google Scholar] [CrossRef]
  29. Mishin, Y.; Mehl, M.J.; Papaconstantopoulos, D.A.; Voter, A.F.; Kress, J.D. Structural Stability and Lattice Defects in Copper: Ab Initio, Tight-Binding, and Embedded-Atom Calculations. Phys. Rev. B 2001, 63, 224106. [Google Scholar] [CrossRef]
  30. Marchenko, A.; Zhang, H. Effects of location of twin boundaries and grain size on plastic deformation of nanocrystalline copper. Metall. Mater. Trans. A 2012, 43, 3547–3555. [Google Scholar] [CrossRef]
  31. Wu, Z.X.; Zhang, Y.M.; Jhon, M.H.; Gao, H.J.; Srolovitz, D.J. Nanowire Failure:Long = Brittle and Short = Ductile. Nano Lett. 2012, 12, 910–914. [Google Scholar] [CrossRef] [PubMed]
  32. Marinica, M.C.; Barreteau, C.; Spanjaard, D.; Desjonqueres, M.C. Diffusion rates of Cu adatoms on Cu (111) in the presence of an adisland nucleated at FCC or HCP sites. Phys. Rev. B 2004, 72, 115402. [Google Scholar] [CrossRef]
  33. Lei, H. Melting of free copper clusters. Condens. Matter 2001, 13, 3023–3030. [Google Scholar] [CrossRef]
  34. Valkealahti, S.; Manninen, M. Melting of copper clusters. Comput. Mater. Sci. 1993, 1, 123–134. [Google Scholar] [CrossRef]
  35. Hou, M. Solid–liquid and liquid–solid transitions in metal nanoparticles. Phys. Chem. Chem. Phys. 2017, 19, 5994–6005. [Google Scholar] [CrossRef] [PubMed]
  36. Faken, D.; Jonsson, H. Systematic analysis of local atomic structure combined with 3D computer graphics. Comput. Mater. Sci. 1994, 2, 279–286. [Google Scholar] [CrossRef]
  37. Tsuzuki, H.; Branicio, P.S.; Rino, J.P. Structural characterization of deformed crystals by analysis of common atomic neighborhood. Comput. Phys. Commun. 2007, 177, 518–523. [Google Scholar] [CrossRef]
  38. Kelchner, C.L.; Plimpton, S.J.; Hamilton, J.C. Dislocation nucleation and defect structure during surface indentation. Phys. Rev. B 1998, 58, 11085. [Google Scholar] [CrossRef]
  39. Shibuta, Y.; Suzuki, T. A molecular dynamics study of cooling rate during solidification of metal nanoparticles. Chem. Phys. Lett. 2011, 502, 82–86. [Google Scholar] [CrossRef]
  40. Gafner, S.L.; Redel, L.V.; Gafner, Y.Y. Molecular_Dynamics Simulation of the Heat Capacity for Nickel and Copper Clusters: Shape and Size Effects. J. Exp. Theor. Phys. 2012, 114, 428–439. [Google Scholar] [CrossRef]
  41. Zhang, L.; Xu, S.N.; Zhang, C.B.; Qi, Y. Molecular dynamics investigations of structural changes accompanying with freezing a molten Cu135 cluster on cooling. Comput. Mater. Sci. 2009, 47, 162–167. [Google Scholar] [CrossRef]
  42. Zhang, L.; Fan, Q.N. Effect of quenching temperature and size on atom movement and local structural change for small copper clusters containing 51–54 atoms during quenching processes. Indian J. Phys. 2016, 90, 9–20. [Google Scholar] [CrossRef]
  43. Glezer, A.M.; Blinova, E.N.; Pozdnyakov, V.A.; Shelyakov, A.V. Martensite transformation in nanoparticles and nanomaterials. J. Nanopart. Res. 2003, 5, 551–560. [Google Scholar] [CrossRef]
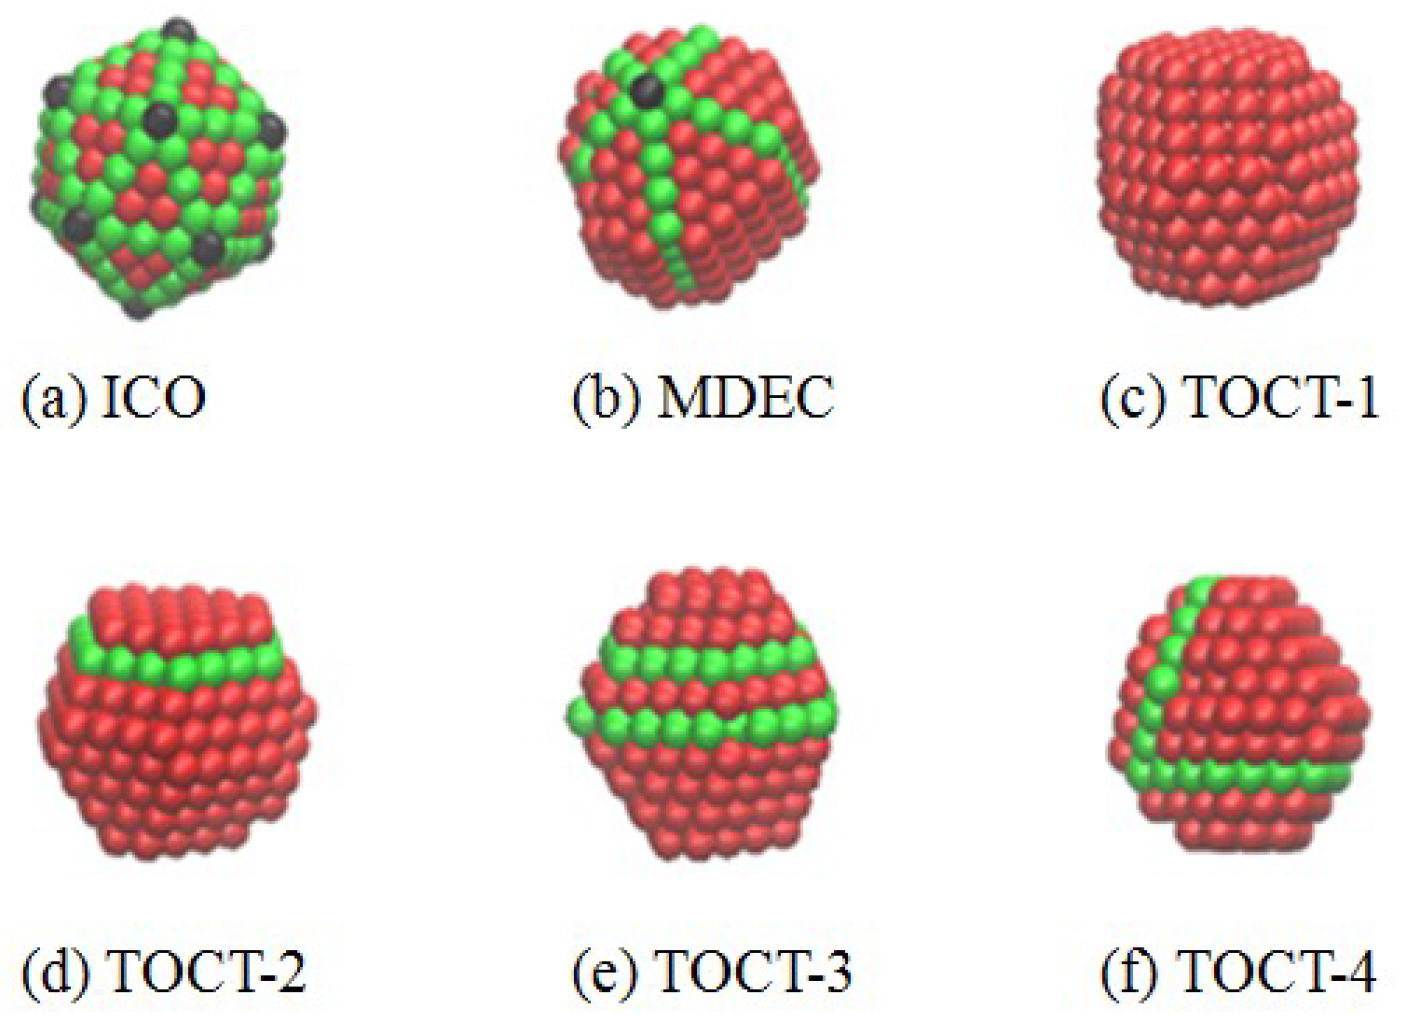
Figure 1. Typical structures at 0 K: Red spheres represent Cu atoms with a face-centered cubic (FCC) local structure, green spheres are atoms in a hexagonal close packed (HCP) environment, and black atoms indicate sites with a 5-fold symmetry. (a) Icosahedra (ICO); (b) Mark’ decahedra (MDEC); (c) Truncated octahedra (TOCT) with one crystal orientation; (d) Truncated octahedra (TOCT) with two crystal orientations; (e) and (f) Truncated octahedra (TOCT) with three crystal orientations.
Crystals 08 00231 g001
Figure 2. The dependence of the average potential energy of each atom on temperature during cooling. (a) Three typical competitive structures of icosaheda (ICO), Mark’ decahedra (MDEC) and truncated octahedra (TOCT) obtained at the same cooling rate of 𝛾2; (b) Perfect icosahedra (ICO ) obtained at different cooling rates of 𝛾2, 𝛾4 and 𝛾6.
Crystals 08 00231 g002
Figure 3. Time evolution of the number of atoms in different local structures from the results of CNA for three typical isomers: (a) ICO; (b) MDEC and (c) TOCT.
Crystals 08 00231 g003
Figure 4. Temperature dependence of radial distribution function during cooling process for three typical isomers: (a) ICO; (b) MDEC and (c) TOCT.
Crystals 08 00231 g004
Figure 5. (ak) Time evolution of the root-mean-square deviation for atoms located on different shells. (l) Time evolution of the root-mean-square deviation for all atoms of Cu309.
Crystals 08 00231 g005
Table 1. Distributions of structural isomers of Cu-309 nanoclusters with different cooling rates.
γ 1 γ 2 γ 3 γ 4 γ 5 γ 6
ICO6568810
MDEC223010
TOCT231210
Table 2. Radius, number of atoms and local structure of the atoms on each shell for icosahedra at 0 K.
Ri02.3824.1474.8075.9196.3857.2538.0158.3688.7309.698
N112301220601260306012
Local structureICO5-foldHCP5-foldFCCHCP5-foldFCCFCCHCP5-fold