Abstract
In this work, a series of quaternary AlxInyGa1−x−yN thin films have been successfully achieved using metal organic chemical vapor deposition (MOCVD) method with adjustable trimethylaluminum (TMA) flows. Surface morphology and optical properties of AlxInyGa1−x−yN films have been evaluated. The indium segregation effect on the enhancement of UV luminescence emission in AlxInyGa1-x-yN films with increasing TMA flows was investigated. Our results shed some lights on future optical materials design and LED/LD applications.
1. Introduction
In the past decades, GaN-based ternary alloys have made significant progress in blue, green, and ultraviolet (UV) light emitting diodes (LEDs) and laser diodes (LDs) [1,2,3]. Despite the great progress that has been made, the commercial InGaN/GaN blue LEDs still suffered from some fundamental problems related to the basic material properties. Even though InGaN-based blue LEDs are less sensitive to crystalline quality because of the carrier localization effect induced by alloy composition fluctuation [4], the piezoelectric polarization effect induced by the strain between barrier and well has been considered as one of the reasons of efficiency droop effect [5,6]. Meanwhile, AlGaN-based UV LEDs combined with RGB phosphors have also been proposed to avoid the color rendering problems in white LED made by blue LED with YAG phosphors. However, because of low doping efficiency and poor crystal quality, highly efficient AlGaN-based UV LEDs are still hard to achieve.
In order to solve these problems in ternary InGaN- and AlGaN-based devices, several researchers have recently grown quaternary AlInGaN films [7,8]. Quaternary AlInGaN films are considered to have the potential to overcome the above shortcomings of ternary alloys, since AlInGaN films can be grown by independently controlling the lattice constant and the band gap by adjusting the composition [9]. Therefore, AlInGaN attracts much attention as a candidate material for high efficiency LEDs or LDs. The growth of AlInGaN has been proven to be extremely challenging, attributed to the large difference in the growth condition between InN, GaN, and AlN [10,11].
Recently, Yu et al. [12] reported the optical and electrical properties of AlInGaN with various trimethylindium (TMIn) molar rates. Fu et al. [13] reported the effect of trimethylgallium (TMGa) flow rate on the optoelectrical characteristics of AlInGaN. However, there are few reports available about AlInGaN structure and optical properties with varied trimethylaluminum (TMA) flow rate. Because of the large lattice mismatch between the InN and AlN, there is a great increasing trend in compositional disorders with increasing Al/In content, and their influence on the optical properties of AlxInyGa1−x−yN quaternary alloys arise as a result [14,15]. It is important to know the influence of Al content on the properties of AlInGaN quaternary alloys when Al atoms are added in the film layer to adjust the band gap of the quaternary.
In this manuscript, we reported AlInGaN/GaN heterostructure grown by MOCVD with varying TMA flow rate. Structural and optical properties versus TMA flow rate in AlInGaN were systematically investigated. The purpose of this article is to experimentally study the influence of TMA flow rate on the AlInGaN quaternary, which will be highly useful for optimizing growth of AlInGaN- and AlInGaN- based device application.
2. Results
Figure 1a shows (0004) ω-2θ scans of AlInGaN/GaN samples 1 to 4. The diffraction peaks at 0 arcsec originated from the GaN buffer layers. For all the samples, the diffraction peaks from the quaternary AlInGaN thin films shifted to the right side with increasing TMA flow rate. This was ascribed to the increase of the lattice constant due to the increase in Al incorporation. For sample 1, the AlInGaN and GaN peaks were overlapped, which means that the lattices match along the c-axes [15]. For sample 4, without any Al incorporation, the diffraction peak originated from InGaN.
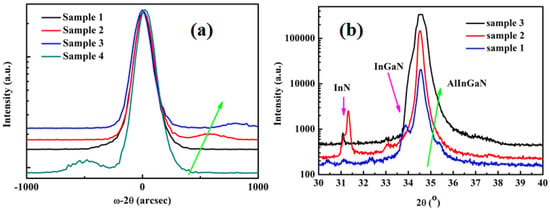
Figure 1.
XRD spectra of AlxInyGa1−x−yN/GaN layers with different trimethylaluminum (TMA) flow rate: (a) (0004) ω-2θ scan; (b) 2θ scan.
Figure 1b shows 2θ scans of AlInGaN/GaN samples. The peaks located at 34.5° originated from the GaN buffer layers. The shoulder peaks at the right side of GaN peaks originated from the AlInGaN layers. For samples 1, 2, and 3, the peaks located at 33.8° on the left side of the GaN peaks belong to InGaN, which mean compositional fluctuations were formed in samples. It is worth noting that in increasing the TMA flow rate from 1.15 to 1.9 μmol/min, another peak located at 31.1° appeared in samples 2 and 3, corresponding to InN. The appearance of InN diffraction peaks in samples 2 and 3 indicate that phase separation appears in the AlInGaN films with incrasing Al content.
To further investigate the crystal quality of AlInGaN epilayer, the full width at half maximum (FWHM) of XRD (0004) ω-2θ scans of AlInGaN epilayers versus TMA flow were also measured (listed in Table 1). The FWHM of (0004) ω-2θ scan of AlInGaN epilayers were between 195 to 252 arcsec, corresponding with samples 1–4. When the TMA flow rate was low, the lattice constant of AlInGaN epilayers was closer to that of GaN, and meanwhile the composition of AlInGaN epilayers became homogeneous because of strain-free growth; both of these were expected to narrow X-ray peaks. From Table 2, the FWHM of AlInGaN diffraction peaks broadened as the Al content increased. Inhomogeneous strain, finite grain size, dislocations, and composition fluctuation are all responsible for broadening the diffraction peaks. The FWHM broadening mechanism in our experiments is under study.

Table 1.
Growth condition of samples. TEGa: triethylgallium; TMIn: trimethylindium.

Table 2.
Composition, (0004) full width at half maximum (FWHM) and V-defect density of samples. XPS: X-ray photoelectron spectroscopy.
The composition of the AlInGaN quaternary epilayers were measured by X-ray photoelectron spectroscopy (XPS) (Table 2). The Al content increased from 15% to 21.6% as the TMA flow rate increased from 1.15 μmol/min to 1.90 μmol/min. Notably, In content decreased from 4.2% to 3.4% as the TMA flow rate increased from 1.15 μmol/min to 1.90 μmol/min, even though the TMIn flow rate was kept constant during the growth. The covalent tetrahedral radii of Al, Ga, and In atoms are different in mixed group III nitrides. As a result, the Al–N, Ga–N, and In–N bonds can compensate each other. Therefore, the higher Al–N content led to the lower In–N content [15].
Figure 2 shows 5 × 5 μm2 atomic force microscopy (AFM) images of the samples. Root-mean-square (RMS) roughness for samples 1–4 is 0.7 nm, 0.9 nm, 1.1 nm, and 0.944 nm, respectively. The AFM results of these samples show atomic steps and some V-shaped pits in the surface of sample. The density of the V-shaped pits slightly increased from 2.2 × 10⁷/cm2 to 3.4 × 10⁷/cm2 as the TMA flow increased from 1.15 μmol/min to 1.90 μmol/min.

Figure 2.
Atomic force microscopy (AFM) images of AlInGaN epilayers with different TMA flow rate; the scan area is 5 × 5 μm2.
Figure 3 shows the images of V-shaped pits of AlInGaN films investigated by SEM with different TMA flow rates. It is clearly seen that all samples showed a smooth surface without boundaries in the film, but there existed V-shaped pits with six-wall sides along () on the surface of the AlInGaN samples. In the previous report about InGaN, V-shaped pits were usually considered to be related to indium segregation on the {} plane [16,17].
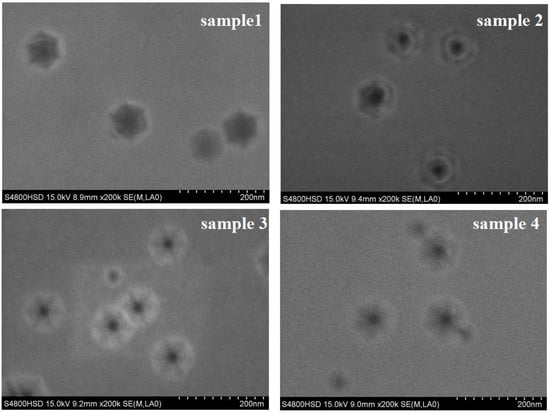
Figure 3.
SEM images of AlInGaN epilayers grown with different TMA flow rate.
Figure 4 shows the room temperature Raman spectra of AlxInyGa1−x−yN quaternary grown with different TMA flow rates. Two vibration modes at around 565 cm−1 and 730 cm−1 were attributed to be from the vibration of the GaN E2 mode and A1 (LO) mode, respectively. For samples 2 and 3 with increased TMA flow rate, an additional vibration mode emerged at 458 cm−1. This mode was attributed to the A1 (TO) mode of hexagonal InN. This result indicated that with increasing TMA flow rate the trend of phase separation in AlInGaN films get stronger, resulting in the emergence of nearly pure InN regions.
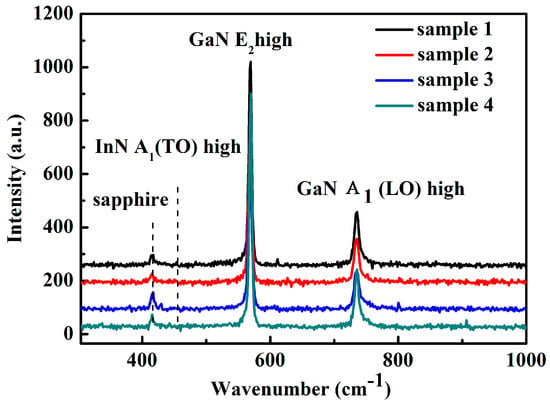
Figure 4.
Raman spectra of the AlxInyGa1−x−yN quaternary alloy samples at room temperature.
To investigate the effect of TMA flow rate on the optical properties of quaternary AlInGaN films, photoluminescence (PL) characteristics of the samples are shown in Figure 5. In all spectra, two emission bands were observed, and the peaks at 3.49 eV originated from GaN buffer layers. The other emission peaks located on the right side of the GaN peaks were from the near band emission of the AlxInyGa1-x-yN epitaxial layer. For samples 1–3, the AlInGaN peaks at the high energy side blue-shifted from 3.49 eV to 3.63 eV. This was mainly because the band gap energy of AlInGaN increased, caused by the TMA flow rate increasing.

Figure 5.
Photoluminescence spectra of the AlInGaN samples at fixed excitation. (a) Room temperature; (b) at 10 K; and (c) normalized photoluminescence spectra for AlInGaN samples at a temperature of 10 K.
In Figure 5c, the normalized photoluminescence spectra for AlInGaN samples with different TMA flow rate at a temperature of 10 K are shown. The emission peak located at 3.49 eV is from the GaN buffer layer. The dominated emission band at the UV region is ascribed to the near band emission of AlxInyGa1−x−yN epitaxial layers. In addition, a blue shift from 3.59 to 3.69 eV can also be observed, which is consistent with the situation of room temperature.
Compared with room temperature PL spectra in Figure 5a, the AlInGaN near band emission intensity of all samples was significantly enhanced at 10 K. Remarkably, at low temperature, samples 2 and 3 with a higher Al content showed higher emission intensity than that of sample 1. This situation is unlike the traditional AlGaN alloys. For AlGaN ternary alloys, the near band emission usually gets weaker as the Al content increases [18]. In III-N based materials, the misfit dislocation normally plays the role of nonradiative recombination centers [19], the higher Al content causes larger lattice mismatch between the GaN buffer and AlGaN, leading to a higher number of defects which results in weaker emission intensity [20]. The enhancement of the emission intensity in AlInGaN alloys with increasing Al content can be attributed to the effect of In segregation, which was already reported in InGaN alloy [21,22,23]. It is generally accepted that the carriers can be localized in the potential wells formed by In segregation, which enhances the overlap of neighboring electrons and holes wave function, and large wave function overlap results in high recombination probability, and thereby enhances the emission. In a word, the capture of excitons by localizing radiative centers outruns the trapping by nonradiative recombination centers.
To be more specific, the activation energies ΔE of three samples was estimated from Arrhenius plots of the temperature-dependent PL emission intensity (Figure 6) data:
where I0 a is phenomenological parameter determined by the kinetics of electron and holes, C is a fitting constant, k is the Boltzmann constant, and IPL is the temperature-dependent PL intensity of samples (Figure 6). ΔE is the mean activation energy required for releasing the localized carriers into extended states, where they have a probability of recombining non-radiatively [24]. The higher value of the activation energy ΔE is associated with a higher non-randomness within the alloy, indicating a stronger localization degree. Then, Equation (1) can be simplified into Equation (2). The theoretical fitting to experimental data is shown in Figure 7a–c; the red solid circles are the experimental data of Ln(IPL) varied with 1/T (obtained from Figure 6), the green hollow circles are the least-squares fit of experimental data with Equation (2). The parameter ΔE shown in Figure 7 is 26, 40, and 29 meV for samples 1, 2 and 3, respectively. Among the three samples, sample 2 (17.5% Al content) has the maximum ΔE value (thus the largest carrier localization degree), which is why sample 2 exhibits the highest UV emission compared with samples 1 (15% Al content) and 2 (21.6% Al content).
IPL = I0/[1 + Cexp(ΔE/KT)]
Ln(IPL) = ΔE/KT
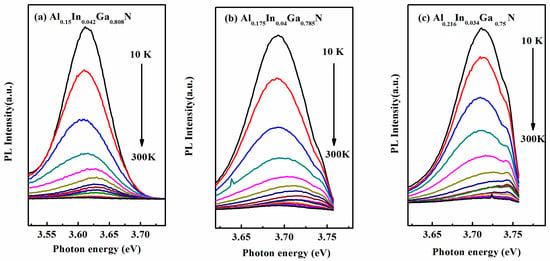
Figure 6.
Temperature-dependent photoluminescence (PL) spectra of (a) sample 1; (b) sample 2; and (c) sample 3, at fixed excitation intensity.
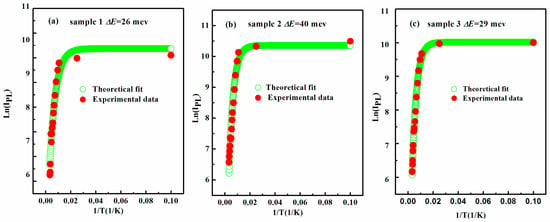
Figure 7.
PL intensity for the samples with various Al content as a function of inverse temperature. Corresponding Arrhenius plots are shown by green open circle. (a) sample 1; (b) sample 2; and (c) sample 3.
These results confirm the deduction about the localization of carrier in AlInGaN increasing with Al content at In mole fraction of about 4%. Therefore, it is reasonable to conclude that the increasing Al composition led to the increasing the In segregation effect, which led to enhancement of carrier localization. The enhancement of carrier localization was responsible for the enhanced UV emission in the AlInGaN thin film.
3. Materials and Methods
Quaternary AlInGaN epitaxy were grown on c-plane sapphire substrate by a low pressure metal organic chemical vapor deposition (MOCVD) system. (Thomas Swan 19 × 20″ MOCVD, Aixtron, Aachen, Germany). Trimethylaluminum (TMA), trimethylindium (TMIn), triethylgallium (TEGa), and ammonia (NH3) were used as precursors. The flow rate of TMIn and TEGa were maintained at 3.98 μmol/min, and 14.1 μmol/min, respectively. V/III was 8000. The 150 nm AlInGaN layers were grown on the GaN template layer at 850 °C using N2 as carrier gas. In our experiments, the growth rate was chosen at 3 nm/min. The flow rate of TMA was changed with 1.15 μmol/min, 1.56 μmol/min, and 1.9 μmol/min, corresponding to samples 1, 2, and 3, respectively.
Double-crystal X-ray diffraction (XRD; Bede D1 (Bede D1, Durham, UK)) was used to investigate the crystal quality of AlInGaN/GaN samples. The element compositions and chemical bonds were analyzed by using an X-ray photoelectron spectroscopy (XPS, Thermo Scientific K-Alpha, Thermo Fisher Scientific, Waltham, MA, USA), performed using a PHI 5700 ESCA spectrometer employing an Al K (1486.6 eV) X-ray source operated at 12.5 kV and 250 W. A 1000 eV Ar+ ion beam was used for sputter etching of the films. The sputtering rate was about 4 nm/min. Scanning electron microscopy (SEM, PHILIPS XL-3, SEMTech Solutions, North Billerica, MA, USA ) and Atomic Force Microscopy (AFM, Veeco 3100, Veeco Instruments Inc., Plainview, NY, USA) were employed to investigate the surface morphology of samples. Raman measurements were carried out at room temperature to verify the existence of phase separation in the quaternary layers by using a He–Ne laser at 632.8 nm. Temperature-dependent photoluminescence spectra were measured to investigate the carrier localization using an iHR320 spectrometer with a He–Cd laser at 325 nm as the exciting source.
4. Conclusions
AlInGaN thin films were prepared by MOCVD technique with different TMA flow rate. The effect of TMA flow rate on the morphology and optical properties of AlInGaN films was systematically investigated. In spite of the larger lattice mismatch and higher defect density, the enhancement of UV emission in AlxInyGa1−x−yN films was obtained in a higher Al content sample (sample 2 x = 17.5%). The enhancement of UV emission was considerably attributed to the In-segregation effect, which prevented their capture by the nonradiative recombination centers. Our research may open an opportunity for AlInGaN-based high-efficiency UV LED/LD applications.
Acknowledgments
National Natural Science Foundation of China (No. 51502061).
Author Contributions
Shujie Jiao and Gang Liu conceived and designed the experiments; Dongbo Wang, Lingping Kong, Tong Liu, and Teren Liu performed the experiments; Chuanyang Luan and Zhenghao Li analyzed the data; Dongbo Wang wrote the paper.
Conflicts of Interest
The authors declare no conflict of interest.
References
- Wierer, J.J.; Krames, M.R.; Epler, J.E.; Gardner, N.F.; Graford, M.G.; Wendt, J.R.; Simmons, J.A.; Sigalas, M.M. InGaN/GaN quantum-well heterostructure light-emitting diodes employing photonic crystal structures. Appl. Phys. Lett. 2004, 84, 3885–3887. [Google Scholar] [CrossRef]
- Nishida, T.; Saito, H.; Kobayashi, N. Efficient and high-power AlGaN-based ultraviolet light-emitting diode grown on bulk GaN. Appl. Phys. Lett. 2001, 79, 711–712. [Google Scholar] [CrossRef]
- Nakamura, S.; Mukai, T.; Senoh, M. Candela-Class high-brightness InGaN/AlGaN Double-heterostructure Blue-light-emitting diodes. Appl. Phys. Lett. 1994, 64, 1687–1689. [Google Scholar] [CrossRef]
- Taniyasu, Y.; Kasu, M.; Makimoto, T. An aluminium nitride light-emitting diode with a wavelength of 210 nanometres. Nature 2006, 441, 325–328. [Google Scholar] [CrossRef] [PubMed]
- Kim, M.H.; Schubert, M.F.; Dai, Q.; Kim, J.K.; Schubert, E.F.; Piprek, J.; Park, Y. Origin of efficiency droop in GaN-based light-emitting diodes. Appl. Phys. Lett. 2007, 91, 183507. [Google Scholar] [CrossRef]
- Narukawa, Y.; Niki, I.; Izune, K.; Yamada, M.; Murazaki, Y.; Mukai, T. Phosphor-conversion white light emitting diode using InGaN near-ultraviolet chip. Jpn. J. Appl. Phys. Part 2 Lett. 2002, 41, L371–L373. [Google Scholar] [CrossRef]
- Zhang, J.C.; Zhu, Y.H.; Egawa, T.; Sumiya, S.; Miyoshi, M.; Tanaka, M. Influence of pulse width on electroluminescence and junction temperature of AlInGaN deep ultraviolet light-emitting diodes. Appl. Phys. Lett. 2008, 92, 191917. [Google Scholar] [CrossRef]
- Marques, M.; Teles, L.K.; Scolfaro, L.M.R.; Ferreira, L.G.; Leite, J.R. Microscopic description of the phase separation process in AlxGayIn1-x-yN quaternary alloys. Phys. Rev. B 2004, 70, 073202. [Google Scholar] [CrossRef]
- Liu, J.P.; Zhang, M.; Wu, M.; Li, D.B.; Zhang, J.C.; Jin, R.Q.; Zhu, J.J.; Chen, J.; Wang, J.F.; Wang, Y.T.; et al. Structural and optical properties of quaternary AlInGaN epilayers grown by MOCVD with various TMGa flows. J. Cryst. Growth 2004, 260, 388–393. [Google Scholar] [CrossRef]
- Aumer, M.E.; Leboeuf, S.F.; Mclntosh, F.G.; Bedair, S.M. High optical quality AlInGaN by metalorganic chemical vapor deposition. Appl. Phys. Lett. 1999, 75, 821–823. [Google Scholar] [CrossRef]
- Liu, J.P.; Jin, R.Q.; Zhang, J.C.; Wang, J.F.; Wu, M.; Zhu, J.J.; Zhao, D.G.; Wang, Y.T.; Yang, H. Indium mole fraction effect on the structural and optical properties of quaternary AlInGaN epilayers. J. Phys. D Appl. Phys. 2004, 37, 2060–2063. [Google Scholar] [CrossRef]
- Yu, S.F.; Chang, S.J.; Lin, R.M.; Liu, Y.C.; Chang, S.P.; Chiou, Y.Z. Growth of quaternary AlInGaN with various TMI molar rates. J. Cryst. Growth 2010, 312, 1920–1924. [Google Scholar] [CrossRef]
- Fu, K.Y.; Jiang, R.H.; Lu, Y.H.; Chen, B.C.; Xuan, R.; Fang, Y.H.; Lin, C.F.; Su, Y.K.; Chen, J.F. The effect of trimethylgallium flows in the AlInGaN barrier on optoelectronic characteristics of near ultraviolet light-emitting diodes grown by atmospheric pressure metalorganic vapor phase epitaxy. Appl. Phys. Lett. 2011, 98, 1211151. [Google Scholar] [CrossRef]
- Cao, X.A.; Yang, Y. On the origin of efficiency roll-off in InGaN-based light-emitting diodes. Appl. Phys. Lett. 2010, 96, 151109. [Google Scholar] [CrossRef]
- Meng, F.Y.; Rao, M.; Newman, N.; Mahajan, S. Stacking faults in quaternary InxAlyGa1−x−yN layers. Acta Mater. 2008, 56, 5552–5559. [Google Scholar] [CrossRef]
- Shang, J.Z.; Zhang, B.P.; Mao, M.H.; Cai, L.E.; Zhang, J.Y.; Fang, Z.L.; Liu, B.L.; Yu, J.Z.; Wang, Q.M.; Kusakabe, K.; et al. Growth behavior of AlInGaN films. J. Cryst. Growth 2009, 311, 474–477. [Google Scholar] [CrossRef]
- Liu, J.P.; Wang, Y.T.; Yang, H.; Jiang, D.S.; Jahn, U.; Ploog, K.H. Investigations on V-defects in quaternary AlInGaN. Appl. Phys. Lett. 2004, 84, 5449–5451. [Google Scholar] [CrossRef]
- Kim, H.S.; Mair, R.A.; Li, J.; Lin, J.Y.; Jiang, H.X. Time-resolved photoluminescence studies of AlxGa1−xN alloys. Appl. Phys. Lett. 2000, 76, 1252–1254. [Google Scholar] [CrossRef]
- Kong, L.; Liu, G.; Gong, J.; Hu, Q.; Schaller, R.D.; Dera, P.; Zhang, D.; Liu, Z.; Yang, W.; Zhu, K.; et al. Simultaneous band-gap narrowing and carrier-lifetime prolongation of organic–inorganic trihalide perovskites. Proc. Natl. Acad. Sci. USA 2016, 113, 8910–8915. [Google Scholar] [CrossRef] [PubMed]
- Henry, T.A.; Armstrong, A.; Allerman, A.A.; Crowford, M. The influence of Al composition on point defect incorporation in AlGaN. Appl. Phys. Lett. 2012, 100, 043509. [Google Scholar] [CrossRef]
- Narukawa, Y.; Kawakami, Y.; Funato, M.; Fujita, S.; Fujita, S.; Nakamura, S. Role of self-formed InGaN quantum dots for exciton localization in the purple laser diode emitting at 420 nm. Appl. Phys. Lett. 1997, 70, 981–983. [Google Scholar] [CrossRef]
- Chichibu, S.F.; Uedono, A.; Onuma, T.; Haskell, B.; Chakraborty, A.; Koyama, T.; Fini, P.T.; Keller, S.; Denbaars, S.P.; Speck, J.S.; et al. Origin of defect-insensitive emission probability in In-containing (Al,In,Ga)N alloy semiconductors. Nat. Mater. 2006, 5, 810–816. [Google Scholar] [CrossRef] [PubMed]
- Nakamura, S. The Roles of Structural Imperfections in InGaN-Based Blue Light-Emitting Diodes and Laser Diodes. Science 1998, 281, 856–961. [Google Scholar] [CrossRef]
- Powell, R.E.L.; Novikov, S.V.; Luckert, F.; Edwards, P.R.; Akimov, A.V.; Foxon, C.T.; Martin, R.W.; Kent, A.J. Carrier localization and related photoluminescence in cubic AlGaN epilayers. J. Appl. Phys. 2011, 110, 063517. [Google Scholar] [CrossRef]
© 2017 by the authors. Licensee MDPI, Basel, Switzerland. This article is an open access article distributed under the terms and conditions of the Creative Commons Attribution (CC BY) license ( http://creativecommons.org/licenses/by/4.0/).