Abstract
This paper reviews charge ordering in the organic conductors, β″-(BEDT-TTF)(TCNQ), θ-(BEDT-TTF)2X, and α-(BEDT-TTF)2X. Here, BEDT-TTF and TCNQ represent bis(ethylenedithio)tetrathiafulvalene and 7,7,8,8-tetracyanoquinodimethane, respectively. These compounds, all of which have a quarter-filled band, were evaluated using infrared and Raman spectroscopy in addition to optical conductivity measurements. It was found that β″-(BEDT-TTF)(TCNQ) changes continuously from a uniform metal to a charge-ordered metal with increasing temperature. Although charge disproportionation was clearly observed, long-range charge order is not realized. Among six θ-type salts, four compounds with a narrow band show the metal-insulator transition. However, they maintain a large amplitude of charge order (Δρ~0.6) in both metallic and insulating phases. In the X = CsZn(SCN)4 salt with intermediate bandwidth, the amplitude of charge order is very small (Δρ < 0.07) over the whole temperature range. However, fluctuation of charge order is indicated in the Raman spectrum and optical conductivity. No indication of the fluctuation of charge order is found in the wide band X = I3 salt. In α-(BEDT-TTF)2I3 the amplitude of charge order changes discontinuously from small amplitude at high temperature to large amplitude (Δρmax~0.6) at low temperature. The long-range charge-ordered state shows ferroelectric polarization with fast optical response. The fluctuation of multiple stripes occurs in the high-temperature metallic phase. Among α-(BEDT-TTF)2MHg(SCN)4 (X = NH4, K, Rb, Tl), the fluctuation of charge order is indicated only in the X = NH4 salt. α′-(BEDT-TTF)2IBr2 shows successive phase transitions to the ferroelectric state keeping a large amplitude of charge order (Δρmax~0.8) over the whole temperature range. It was found that the amplitude and fluctuation of charge order in these compounds is enhanced as the kinetic energy (bandwidth) decreases.
1. Introduction
Vibrational spectroscopy is a powerful tool to detect the valence of molecules in organic charge-transfer salts. Among the normal modes of molecular vibrations, several vibrational modes change their eigenfrequencies depending on the valence of the molecule in question. These vibrational modes are called charge-sensitive modes. For example, the C=C stretching mode is utilized as a probe for detecting the valence. As the chemical bond is usually much stronger than intermolecular interactions, the vibrational frequency and symmetry of a free molecule is approximately preserved in the solid state except in the case where a strong vibronic interaction occurs between a vibrational mode and a low-energy electronic state (electron molecular vibration coupling). A vibrational mode that strongly interacts with the electronic state is called structure-sensitive mode. Knowledge of the normal mode of a free molecule is essential, because a deviation from this mode in the solid state tells us which interaction is occurring. In this sense, reliable assignments of vibrational bands in the solid state are the most critical and indispensable. The charge-sensitive mode was applied for the first time to the distribution of charges in the unit cell of Cs2TCNQ3, where TCNQ represents 7,7,8,8-tetracyanoquinodimethane, wherein the infrared-active external ring C=C stretching modes (ν4) of TCNQ0 and TCNQ− were separately observed [1]. A detailed normal mode analysis of TCNQ0 and TCNQ− was reported by Bozio et al. [2]. Matsuzaki et al., extended the application to the TCNQ salt with fractional charge [3]. Subsequently, vibrational spectroscopy was applied to mixed-valence compounds of TCNQ [4], where one of the CN stretching modes of TCNQ was utilized as the probe.
The existence of Wigner-type charge order (CO) in organic conductors had been argued based on the finding of 4kF modulation in quasi-one-dimensional tetrathiafulvalene-7,7,8,8-tetracyanoquinodimethane (TTF-TCNQ) [5,6,7,8] because the wavelength of the 4kF modulation corresponds to the distance between localized electrons (holes) which are arranged with equal distance. However, the 4kF modulation found in TTF-TCNQ was related to the 4kF Peierls instability with on-site Coulomb repulsion. Since the amplitude of the charge density wave (CDW) is small, the charge-sensitive mode shows almost no linewidth broadening. The long-range CO of the Wigner-type was reported for quasi-one-dimensional (DI-DCNQI)2Ag, where DI-DCNQI corresponds to 2,5-diiodo-dicyanoquinodiimine, by Hiraki and Kanoda using 13C-NMR [9]. They showed that the amplitude of CO (Δρ = 0.5) is much larger than that of an incommensurate CDW. At about the same time, Seo theoretically predicted the CO ground state for (TMTTF)2X (X = Br, SCN), where TMTTF corresponds to tetramethyltetrathiafulvalene, and (DI-DCNQI)2Ag using mean-field theory [10]. Later, Chow reported a similar charge order for (TMTTF)2X (X = PF6, AsF6) using 13C-NMR [11]. In the case of a two-dimensional organic compound, Moldenhauer et al., reported that localization of charge occurs in one of the stacks of α-(BEDT-TTF)2I3 (BEDT-TTF corresponds to bis(ethylenedithio) tetrathiafulvalene) [12]. After the theoretical prediction of the CO ground state for α-(BEDT-TTF)2I3 by Kino and Fukuyama [13], CO in two-dimensional organic compounds was suggested in α-(BEDT-TTF)2I3 [14], and more clearly shown in θ-(BEDT-TTF)2RbZn(SCN)4 [15]. Stimulated by the experimental findings of CO, theoretical studies were conducted on the role of intersite Coulomb interaction in CO [16,17,18], lattice distortion accompanied by CO [19,20,21], the relationship between CO fluctuation and superconductivity (SC) [22], and quantum criticality at the edge of CO [23]. Subsequently, several experimental and theoretical studies have been conducted [24,25,26,27]. Some of these will be introduced from Section 3 on, in relation to the experimental results. Charge ordering continues to attract experimental and theoretical interest and attention. Some compounds in the CO state are regarded as unconventional ferroelectrics [28]. However, the ferroelectric properties have not been well investigated so far due to experimental difficulties. SC paring mediated by CO fluctuation was proposed by Merino and McKenzie [22]. Spectroscopic studies which may support the theoretical prediction for the SC mechanism have been reported [29,30,31,32,33,34]. It was also predicted that spin fluctuation mediates the SC pairing in a CO system [35]. Recently, it was pointed out that interaction with anions plays an essential role in the CO phase transition [36,37]. These subjects will be further investigated in future.
Along with NMR and x-ray diffraction, vibrational spectroscopy is a powerful tool to investigate the CO state, since the amplitude of CO is large. Raman spectroscopy was first applied to the charge ordering phase transition of θ-(BDT-TTP)2Cu(NCS)2, for which the spectral features drastically changed [38,39]. Although the charge-sensitive mode is expected to show a simple splitting in a CO state, the Raman spectrum showed complicated splitting due to the additional splitting of the structure-sensitive mode. The fluctuation of charge order was obviously detected in the metallic phase. These characteristics were for the most part commonly observed in the compounds discussed here. In this paper, the author reviews infrared, Raman, and optical conductivity measurements of BEDT-TTF salts, which, apart from β″-(BEDT-TTF)(TCNQ), have a herringbone arrangement. This latter compound is included in this paper, because its unique behavior is necessary for understanding the metallic phase of θ- and α-type BEDT-TTF salts.
The paper is organized as follows. Section 2 briefly describes the relation between the site charge and band structure, fluctuation of charge order and time correlation function, charge- and structure-sensitive modes of BEDT-TTF, electron-molecular vibration coupling, and the line shape when the site charge fluctuates. Section 3 describes charge disproportionation in β″-(BEDT-TTF) (TCNQ), wherein a continuous change of the electronic state is discussed combined with optical conductivity. Section 4 describes the charge-ordering phase transition θ-type BEDT-TTF salts; first, how the charge- and structure-sensitive modes split in the CO state; second, the metallic state with large CO amplitude is discussed; third, the metallic state with small CO amplitude is discussed. Section 5 introduces a spectroscopic investigation of α-type BEDT-TTF. Here, the splitting of charge- and structure-sensitive modes in CO phase and ferroelectric properties are described first. Next, the splitting of the charge-sensitive mode and fluctuation of CO in the metallic phase are discussed. Third, the non-uniform site charge distribution in the metallic phase under ambient pressure and hydrostatic pressure is compared with band calculations. Fourth, the optical conductivity is reviewed along with the collective CO excitation Finally, the successive ferroelectric transition of α′-(BEDT-TTF)2IBr2 is briefly described. The final section 6 presents the kinetic energy, which is associated with the bandwidth, of these compounds, and summarizes their electronic states correlated with kinetic energy.
2. Detection and Analysis of Charge Order
2.1. Site Charge and Fluctuation
In solid organic charge-transfer salts, valence electrons are delocalized depending upon the magnitude of the overlap integral. Therefore, the valence of the molecule becomes a non-integer value, when the number of valence electrons does not equal the number of molecules. The fractional valence or fractional charge at the jth site (site charge) in the unit cell, ρj, is given by the following equation:

where  is the Bloch function of the mth band, nM is the number of molecules in a unit cell, nj is the number operator at the jth site, and f(ε) is the Fermi distribution function for a hole. The site charge is the integrated valence electron at each site below a Fermi level. Therefore, the site-charge distribution is sometimes non-uniform even in a metal, if the site in a unit cell is crystallographically non-equivalent. If the amplitude of charge order Δρ is small, a small portion of the valence electrons near the Fermi level contribute to the charge disproportionation, while in the case of large Δρ, most valence electrons participate in the charge disproportionation as the band structure entirely changes
is the Bloch function of the mth band, nM is the number of molecules in a unit cell, nj is the number operator at the jth site, and f(ε) is the Fermi distribution function for a hole. The site charge is the integrated valence electron at each site below a Fermi level. Therefore, the site-charge distribution is sometimes non-uniform even in a metal, if the site in a unit cell is crystallographically non-equivalent. If the amplitude of charge order Δρ is small, a small portion of the valence electrons near the Fermi level contribute to the charge disproportionation, while in the case of large Δρ, most valence electrons participate in the charge disproportionation as the band structure entirely changes When the site charge dynamically fluctuates as ρ(t), the correlation time τ is defined by the following equation,

where Δρ(t′) = ρ(t′) − < ρ(t′) ≥ ρ(t′) − 1/2 in the case of quarter filling, <Δρ(t′)Δρ(t′ + t)> is the time correlation function of ρ, and Δ2 =< Δρ(t′)Δρ(t′)> is the amplitude (variance) of fluctuation. As explained in the preceding paragraph, only the valence electrons near the Fermi level fluctuate, when the fluctuation amplitude is small. The charge fluctuation in a quarter-filled-band system was theoretically discussed in refs. [40,41] using the charge correlation function C(q,ω). If the system has CO instability, the charge correlation function has a strong peak at q0 and ω0~0. The wave vector q0 specifies a charge-order pattern such as checkerboard or stripe. The peak frequency ω0 is the energy of the excited state which contributes to produce a CO wave in a uniform metal, and it may be related to the amplitude of CO fluctuation. The peak height and width are respectively associated with correlation length and correlation time. The time correlation function of the specified q0 is the Fourier transform of C(q0,ω).
2.2. Charge-Sensitive Mode of BEDT-TTF
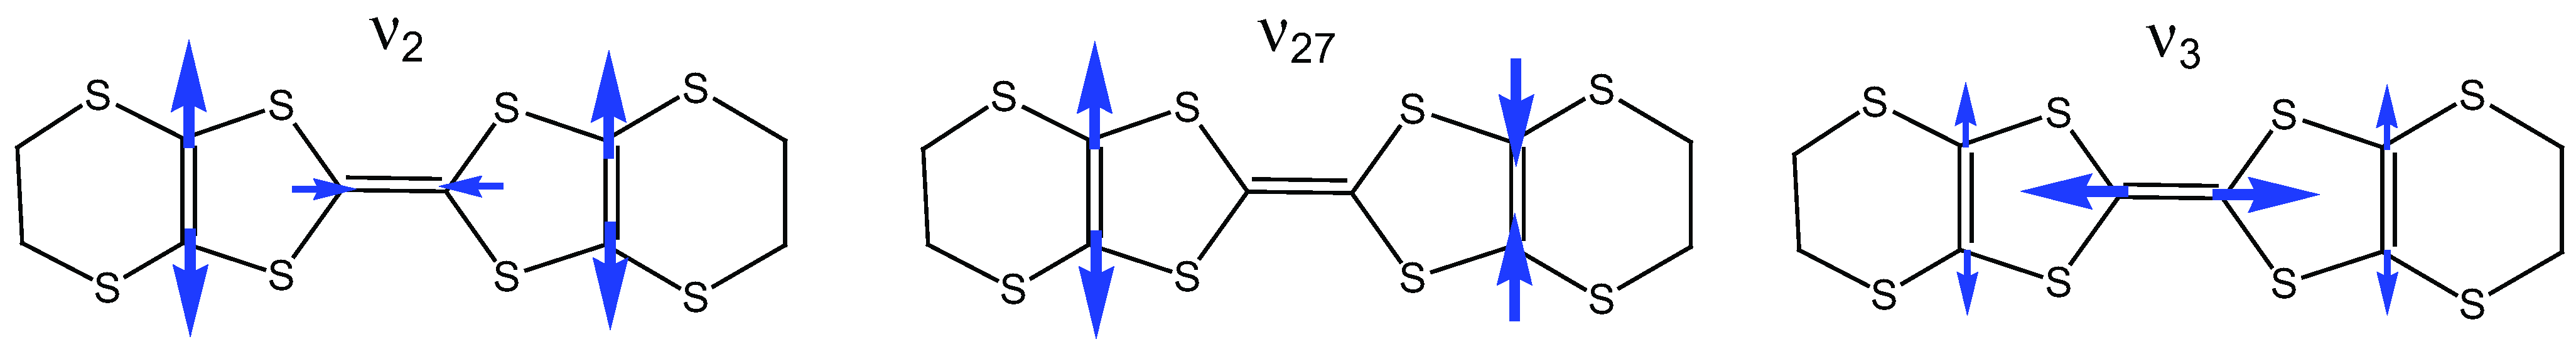
A normal mode analysis of BEDT-TTF0 and BEDT-TTF1+ was reported by Kozlov et al. [42,43]. The normal modes most sensitive to the charge (valence) of the BEDT-TTF molecule are the in-phase (ν2, Raman active) and out-of-phase (ν27 infrared active) stretching modes of the ring C=C bonds, and the stretching mode of the C=C bond bridging two five member rings (ν3, Raman active). Kozlov et al., analyzed the normal mode assuming the D2h symmetry, and their mode numbering is different from the subsequent numbering using more exact D2 symmetry [44]. In this paper, Kozlov’s numbering shown in Figure 1 will be used to avoid complication. In the solid state, site symmetry is usually lower than D2h or D2. However, the crystal field in organic conductors is much weaker than the covalent energy within a molecule. Therefore, the symmetry of the free molecule is approximately preserved in a crystal.

Figure 1.
C=C stretching modes of BEDT-TTF. The ν2 and ν27 modes are charge-sensitive, while the ν3 mode depends upon the network of transfer integrals, and thus it is structure-sensitive.
Figure 1.
C=C stretching modes of BEDT-TTF. The ν2 and ν27 modes are charge-sensitive, while the ν3 mode depends upon the network of transfer integrals, and thus it is structure-sensitive.
An attempt to examine the linear relationship between the frequency and fractional charge of BEDT-TTF was made by Wang et al., for the Raman-active ν2 and ν3 modes [45]. However, the frequency data were scattered about the linear relationship. In addition, they did not consider the effect of electron-molecular vibration interaction, which will be discussed in the next subsection. The linear relationship for the infrared-active ν27 was first utilized by Moldenhauer et al., for estimating the iconicity of BEDT-TTF [12]. However, this relationship is given based on the incorrect assignment of BEDT-TTF+ [46]. Subsequently, the relationship was not examined for long time, because this mode is usually hidden in a huge electronic absorption band when it is measured on the conducting plane or powdered samples. Recently, Yamamoto et al., have examined the assignment of Kozlov et al., and they reassigned ν2, ν3, and ν27 of BEDT-TTF+ with the aid of 13C and deuterium substituted compounds [46]. First they examined ν27 employing the polarization perpendicular to the conducting layer on the side face of single crystals. They found that the frequency of BEDT-TTF0 deviated from the linear relation, because it has a non-planar structure. They calculated the frequency of ν2 and ν27 assuming D2 symmetry employing a DFT method, and found that the frequency of the flat structure BEDT-TTF0 satisfies the linear relationship. They presented an empirical relationship for the infrared active ν27 mode, ν27(ρ) = 1398 + 140(1 − ρ). Next they examined the Raman-active ν2 and ν3 modes. The ν3 mode is more strongly perturbed by the electron-molecular vibration (EMV) interaction than the effect of charge. As we will explain in the next section, the highest-frequency ν3 mode does not shift, even if the charge disproportionation occurs, whereas the ν2 mode at charge-rich site (ν2R) shifts toward lower frequency. Consequently, the line ν2R(ρ) crosses the line ν3(ρ), at ρ~0.9 (see Figure 2). As the result of the interaction between ν2R and ν3, the frequency of ν2R deviates from the linear relationship. They presented the linear relationship for the infrared-active ν2 as ν2(ρ) = 1447 + 120(1 − ρ), which is available only in the range of 0 < ρ < 0.8. The ρ dependence of the frequency is ascribed to the ρ dependent force constant F(ρ). That is, the linear relationship requires (dF/dρ)ρ=0 = (dF/dρ)ρ=1 [47]. However, the frequency of BEDT-TTF0.5+ deviates significantly from the linear relationship toward the low-frequency side, which means that |(dF/dρ)ρ=0| > |(dF/dρ)ρ=1| (See Figure 7 of ref. [46]). Other nonlinear relationship at ρ~0.5 will be discussed in Section 5.3.1.
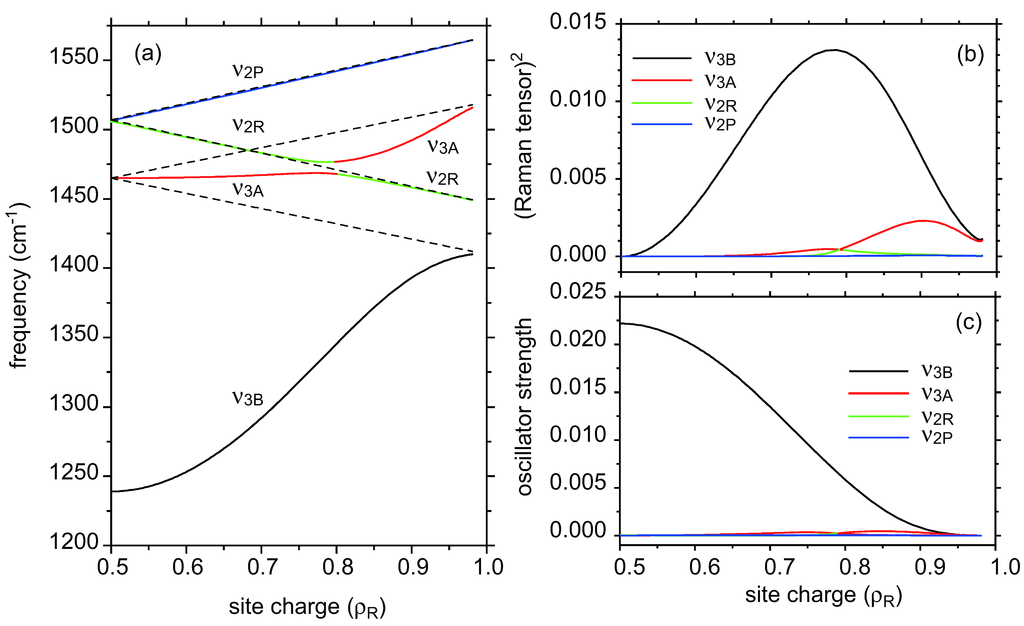
Figure 2.
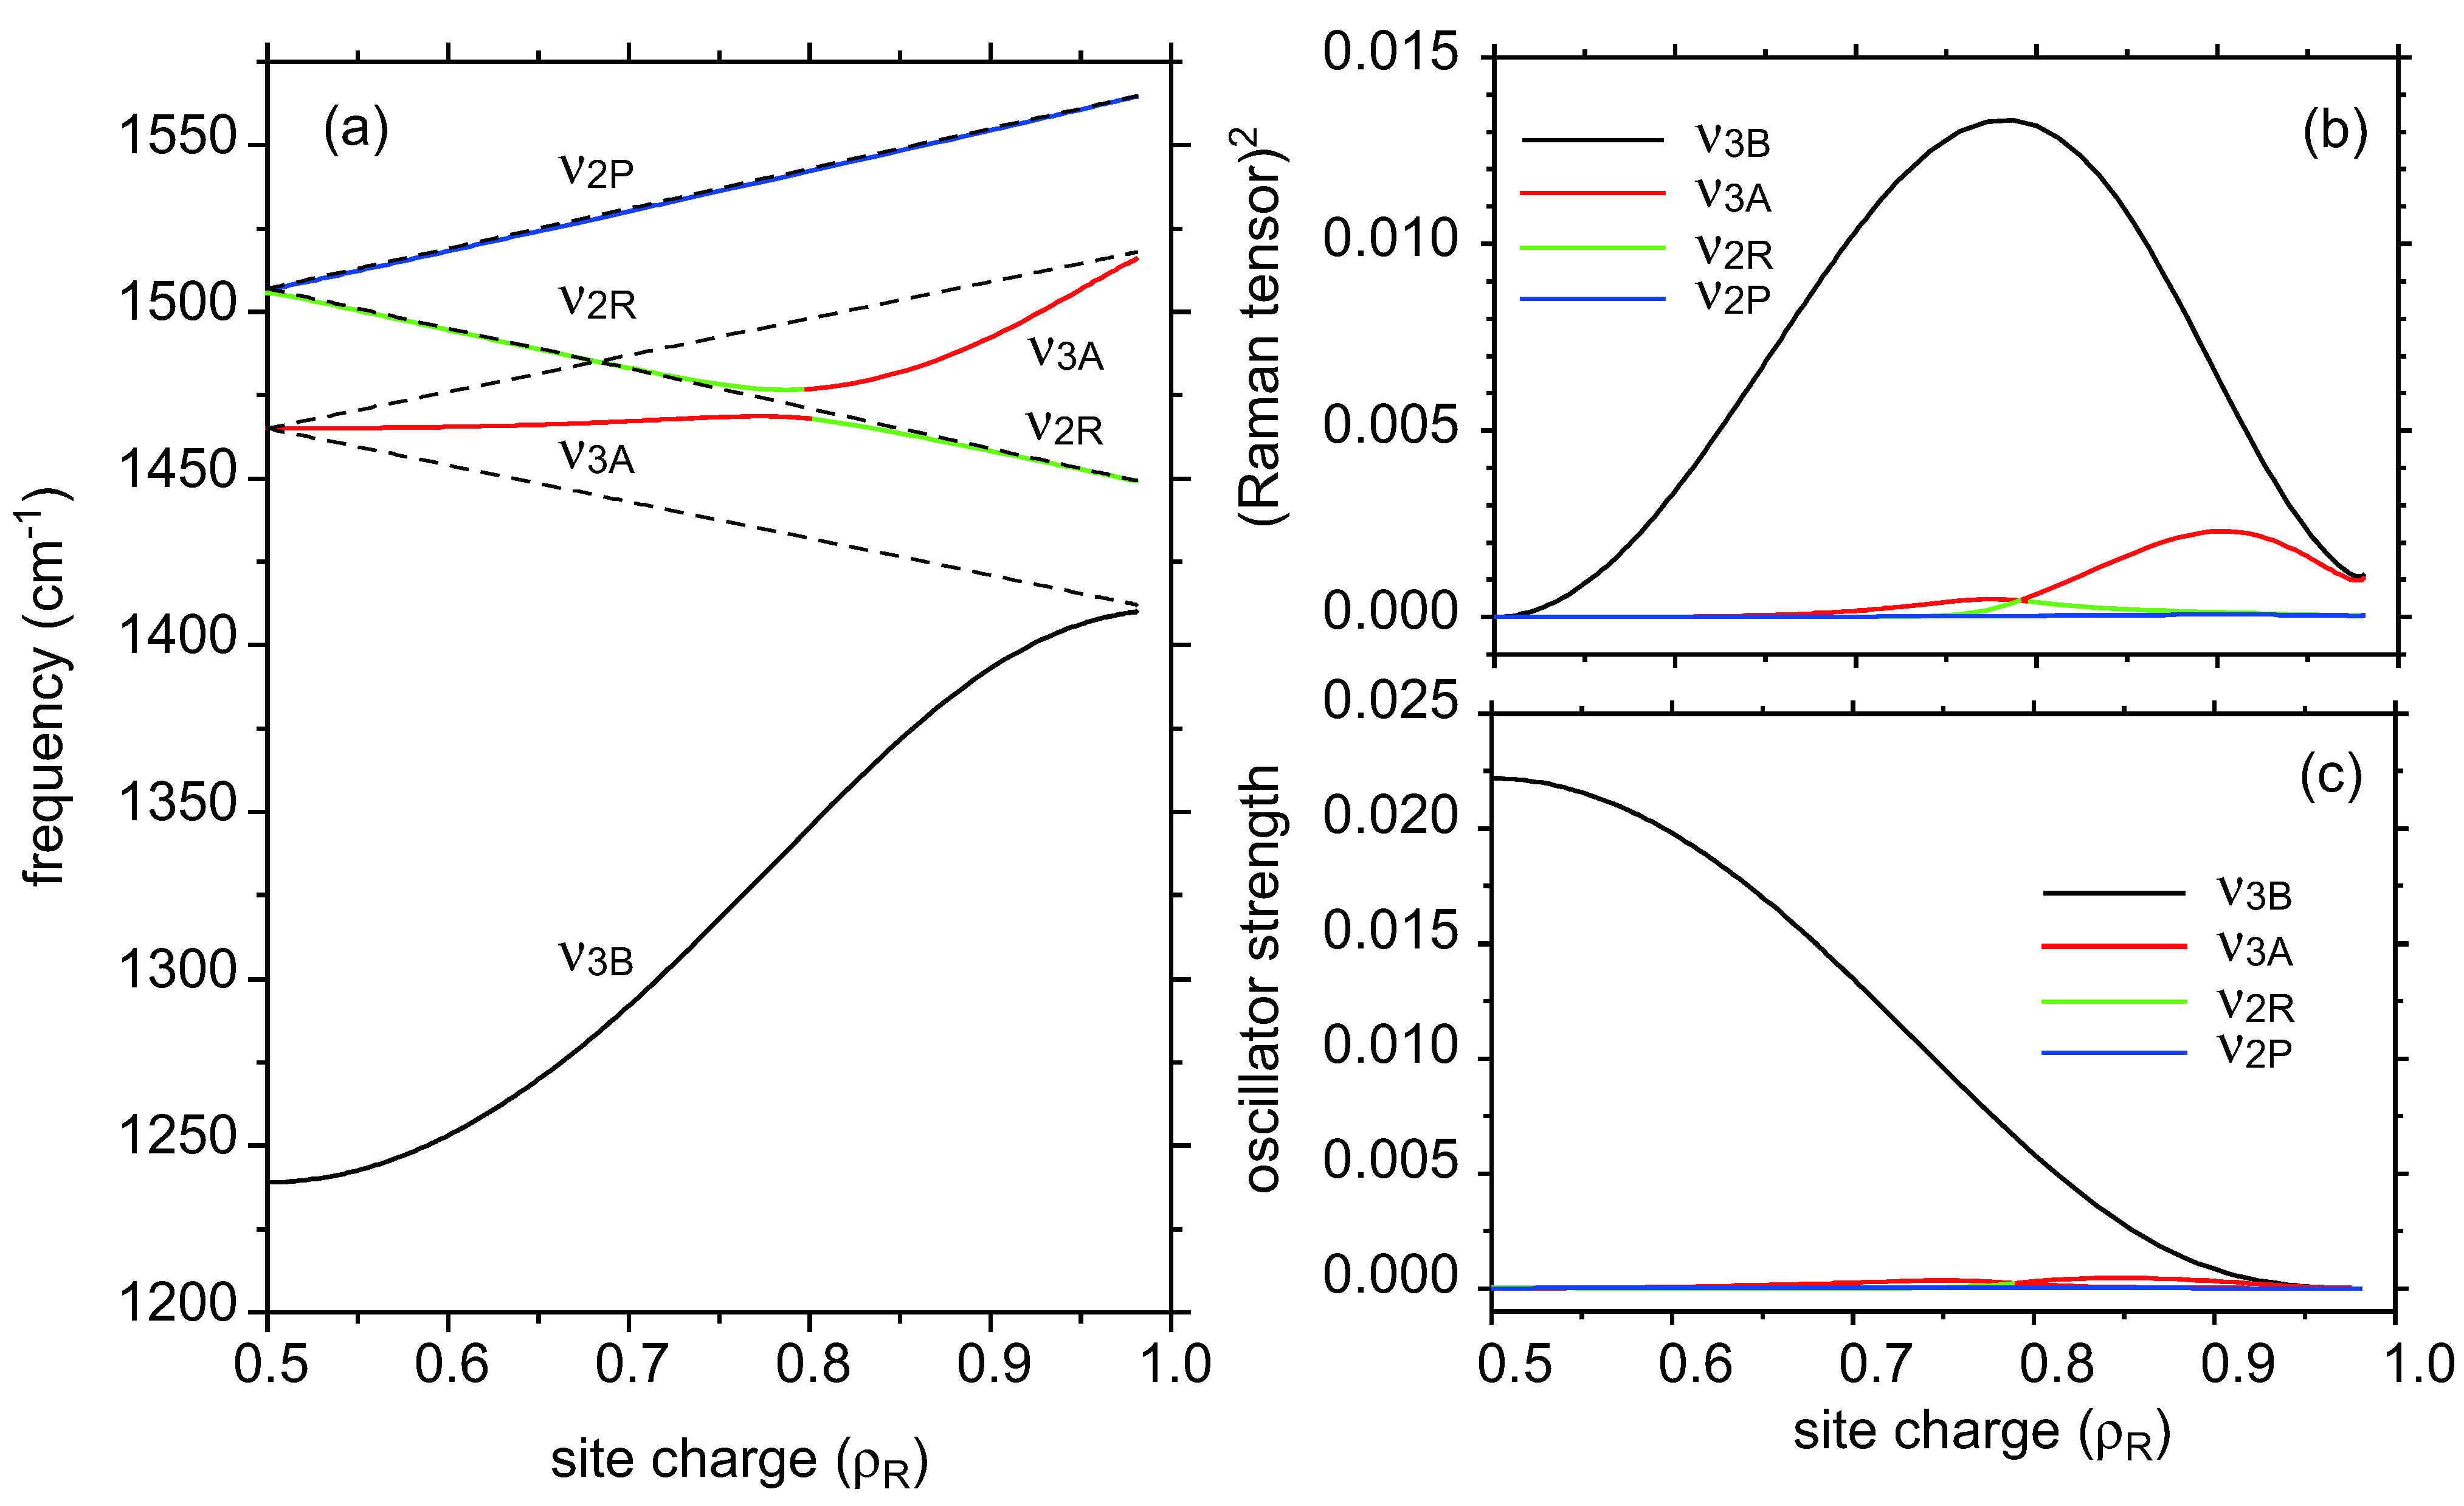
(a) Frequency of the vibronic modes plotted against the site charge of charge-rich site (ρP + ρR = 1). The transfer integral is t = 0.2 eV, EMV coupling constants for ν2 and ν3 are g2 = 0.02 eV and g3 = 0.1 eV, respectively. The dashed line shows the site-charge dependence when g2 = g3 = 0, assuming a linear relationship against site charge ρ. The frequencies at ρ = 0 and 1 are ν2(0) = 1567 cm−1, ν2(1) = 1447 cm−1, ν3(0) = 1520 cm−1, and ν3(1) = 1410 cm−1; (b) Contribution of the intermolecular excitation to the Raman tensor of the vibronic modes, which are plotted against the site charge of the charge-rich site; (c) Oscillator strength of the vibronic modes plotted against the site charge of the charge-rich site.
Figure 2.
(a) Frequency of the vibronic modes plotted against the site charge of charge-rich site (ρP + ρR = 1). The transfer integral is t = 0.2 eV, EMV coupling constants for ν2 and ν3 are g2 = 0.02 eV and g3 = 0.1 eV, respectively. The dashed line shows the site-charge dependence when g2 = g3 = 0, assuming a linear relationship against site charge ρ. The frequencies at ρ = 0 and 1 are ν2(0) = 1567 cm−1, ν2(1) = 1447 cm−1, ν3(0) = 1520 cm−1, and ν3(1) = 1410 cm−1; (b) Contribution of the intermolecular excitation to the Raman tensor of the vibronic modes, which are plotted against the site charge of the charge-rich site; (c) Oscillator strength of the vibronic modes plotted against the site charge of the charge-rich site.
2.3. Electron-Molecular Vibration (EMV) Coupling in BEDT-TTF
The EMV interaction was first studied to interpret the strong infrared signal in the reflectivity polarized along the stacking axis in K-TCNQ [48]. Rice et al., reported a symmetric dimer model and presented a comprehensive explanation for the EMV interaction [49]. According to the dimer model, the ag mode of each molecule splits into in-phase and out-of-phase modes depending upon the magnitude of the coupling constant and transfer integral. The EMV interaction works only for the out-of-phase mode, and the coupling constant is estimated from the frequency difference between the Raman-active in-phase mode and the infrared-active out-of-phase mode. The EMV effect on the Raman-active mode was first pointed out by Girlando et al., in TTF-CA [50].
Based on the formulation by Painelli and Girlando [51], Yamamoto and Yakushi extended this idea to a disproportionate (asymmetric) dimer with average charge ρ = 0.5, in which each site has a non-equivalent charge like (BEDT-TTF)ρ+(BEDT-TTF)(1-ρ)+ [52]. Figure 2 shows the numerical calculation of the frequency and intensity of vibronic modes plotted as a function of the site charge of the charge-rich site (ρ > 0.5). In this calculation, the transfer integral between two molecules is taken as t = 0.2 eV, and the coupling constants of ν2 and ν3 mode are taken as g2 = 0.02 eV and g3 = 0.1 eV. ν2P and ν2R, denote the ν2 mode of the charge-poor and charge-rich site (molecule), respectively, and ν3A, and ν3B denote the ν3 mode for the in-phase and out-of-phase oscillation, respectively. The coupling constant in BEDT-TTF is estimated in refs. [43,53]. The coupling constants of ν2 and ν3 were respectively estimated to be g2 = 0.043 and g3 = 0.071 eV from an analysis of the infrared spectrum of the isolated dimer (BEDT-TTF)22+ [53]. The parameters estimated from the infrared spectra were very scattered (g2 ~ 0.007–0.039 eV and g3 = 0.007–0.081 eV) depending upon the compounds [54]. A more recent estimation gives g3 = 0.076 eV from the analysis of the infrared spectrum of κ-(BEDT-TTF)2Cu[N(CN)2]-Br0.85Cl0.15 [55]. Using the same data, Girlando interpreted this as g2 = 0.075 eV [56]. The estimation of the coupling constants of ν2 and ν3 from the infrared spectrum seems to be unfixed still now. The coupling constants used for the model calculation (Figure 2) are qualitatively consistent with ref. [55] and with the interpretation of the Raman spectra of various compounds appearing in this paper.
As shown in Figure 2a, the weakly coupled modes, ν2P and ν2R, approximately conform to a linear relationship. However, the strongly coupled modes, ν3A and ν3B, deviate remarkably from the linear relation, although the frequency of ν3 of the free molecule follows a linear relationship as shown by the dashed lines in Figure 2a [56]. The ν3A and ν3B modes are respectively the in-phase and out-of-phase vibrations at ρ = 0.5. The noteworthy point here is that the ν3A mode that is Raman-active keeps the frequency corresponding to ρ = 0.5 in the range of 0.2 < ρ < 0.8. This is because the in-phase vibrations at two sites are not perturbed by the EMV interaction [49]. Actually, the frequencies of ν3 of the 2:1 salts are nearly equal to those of the 3:2 salts in the work by Wang et al. [45] although they claim a linear relationship for ν3 in their paper. Near ρ~0.8, mixing between ν2R and ν3A occurs, and the assignment becomes meaningless. This situation is sometimes seen in the charge-ordered state (See Section 4.1, Section 5.1, and Section 5.3.3). This result means that Raman spectroscopy cannot determine the fractional charge when the molecular vibrations strongly interact with each other through the EMV mechanism. Fortunately, in the case of BEDT-TTF, the ν2 mode is available to determine the fractional charge, because the EMV coupling is weak enough. However, this mode is available only in the range of 0 < ρ < 0.8. In this sense, the infrared-active mode, for example, ν27 of BEDT-TTF is the best probe to determine the site charge in a charge-ordered system. From the viewpoint of experimental technique, it is extremely difficult to observe ν27 in the conducting plane, because the phonon mode is screened by the strong electronic absorption band. Usually the crystal face parallel to a conducting plane is most developed. Therefore, the best way to detect ν27 is to measure the reflectivity on the thin side face of the crystal with the polarization perpendicular to the conducting plane.
In the infrared spectrum, we can observe only the out-of-phase mode ν3B, which shows a large downshift due to the large EMV coupling constant, as shown in Figure 2c. As the out-of-phase mode dynamically modulates the orbital energy of the highest occupied molecular orbital (HOMO) of BEDT-TTF in the dimer, it transfers charge back and forth inducing an oscillating dipole along the direction connecting the centers of the molecules [49]. Accordingly, the out-of-phase ν3 mode is usually found very strongly in the optical conductivity of the conducting plane (See Section 4 and Section 5). The downshift of this mode is sensitive to the transfer integrals between BEDT-TTF molecules (see ref. [54] for example). Yamamoto et al., discussed the relation between the downshift of ν3B and transfer integrals comparing the ν3 modes among several θ-type of BEDT-TTF salts. [57] Utilizing this property, the symmetry can be determined, for example, by the presence of a glide plane (See Section 4.1) and breaking of inversion symmetry (See Section 5.1). The Raman intensity of the same vibronic mode ν3B is calculated to be strong in the disproportionate dimer (See Figure 2b). In this model, only the intermolecular excitation is considered for the calculation of the Raman tensor in the off-resonance condition. Actually, intramolecular excitations contribute more to the Raman tensor, and the resonance effect is sometimes quite large in the charge-transfer salts of BEDT-TTF. This calculation shows the additional contribution of the intermolecular excitation to the Raman tensor. As shown in Figure 2b, the contribution of this intermolecular excitation is largest in the vibronic ν3 mode that has a large EMV coupling constant. Actually, the vibronic ν3 mode is frequently found in the Raman spectrum of charge-ordered system (See Section 4 and Section 5).
2.4. The Line Shape of Charge-Sensitive Mode
The frequency of the charge-sensitive mode strongly depends upon the site charge, for example, Δω/Δρ ≈ 140 cm−1/e or Δω/Δρ ≈ −140 cm−1/h for the ν27 mode. Let us consider a system in which the unit cell involves two sites (molecules) and one hole. If every site is equivalent, then every site has a uniform site charge (hole) ρ = 0.5. When the system undergoes a charge-ordering transition, the site charge is disproportioned into ρR and ρP. Therefore, the charge-sensitive mode splits into two vibrational bands from a single band. If the site charge fluctuates around ρ = 1/2, the frequency also fluctuates around ν(ρ), and the linewidth is broadened depending on the fluctuation rate. This relation is illustrated in Figure 3.

Figure 3.
Linear relationship between the site charge and frequency of ν27 [46]. The schematic sketch of the spectrum shows that the charge-sensitive mode of uniform site charge (green) is split into two (blue) by charge disproportionation, and the linewidth is broadened by the fluctuation of the site charge.
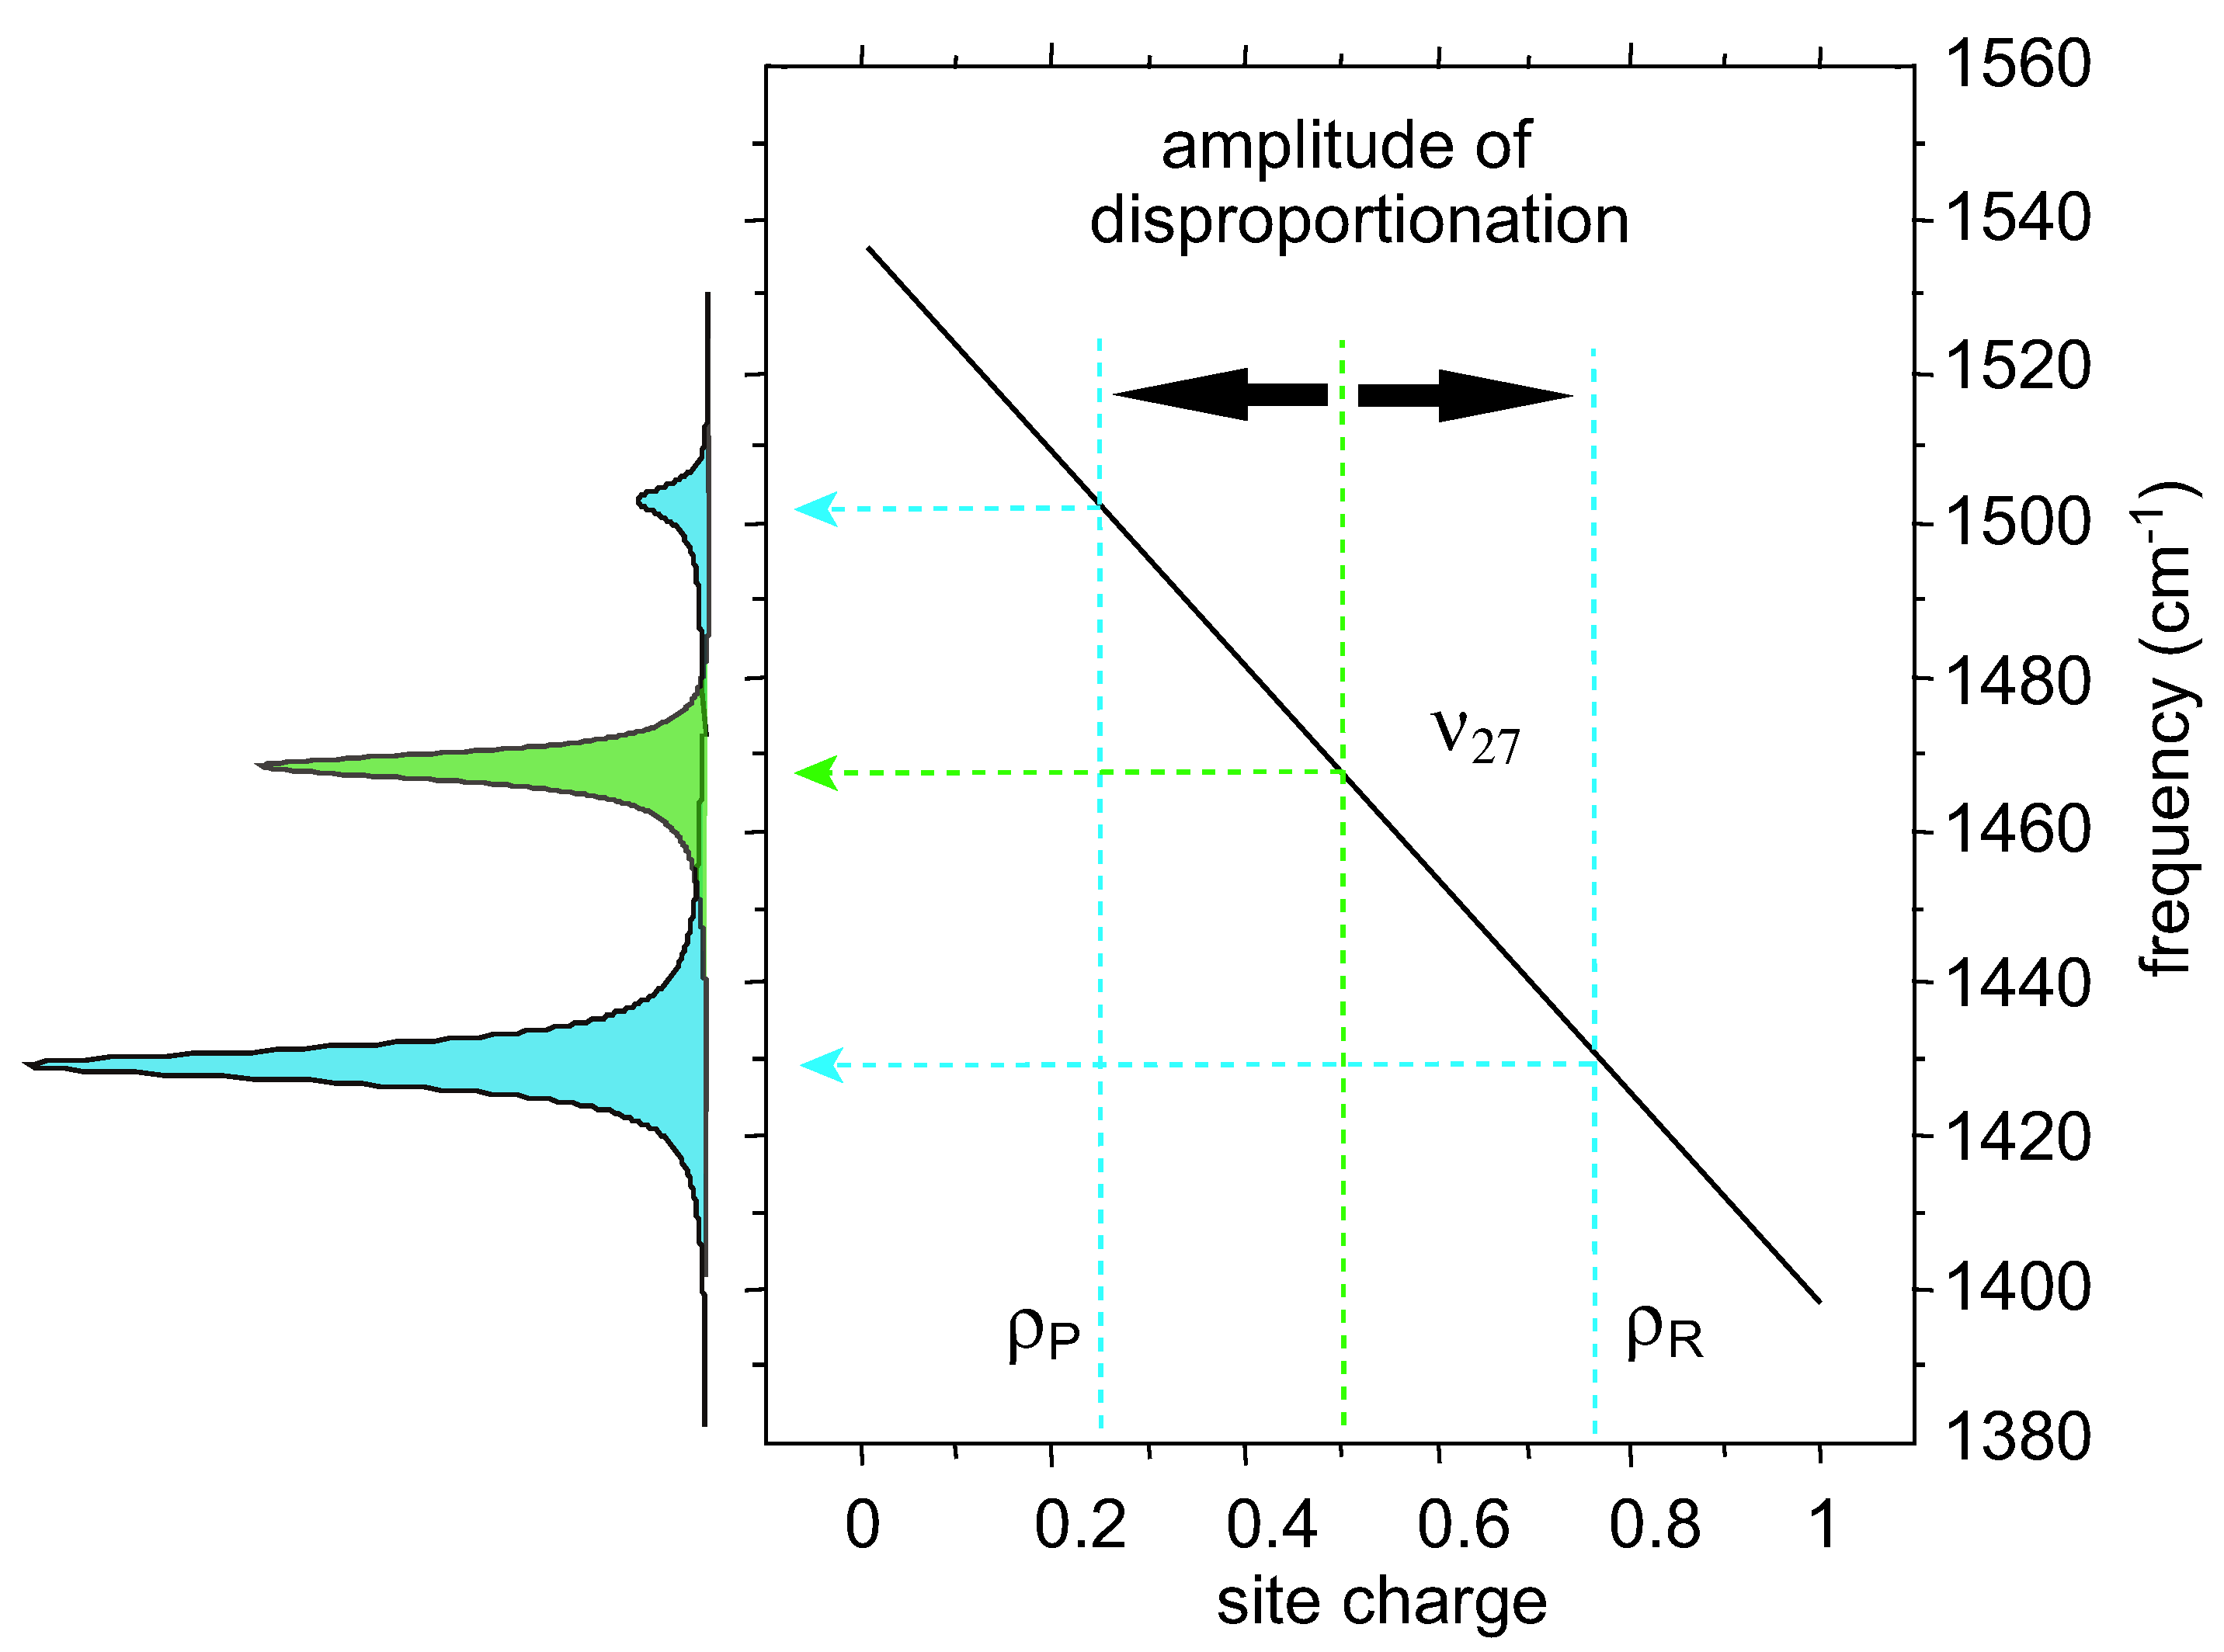
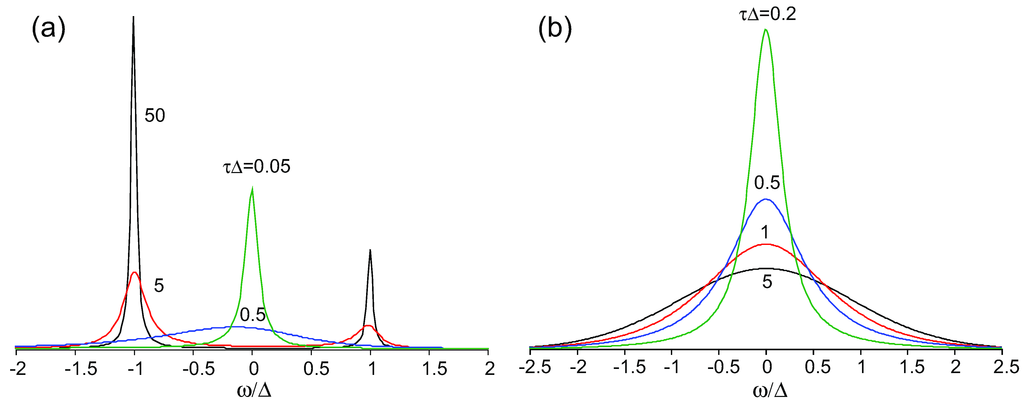
Figure 4.
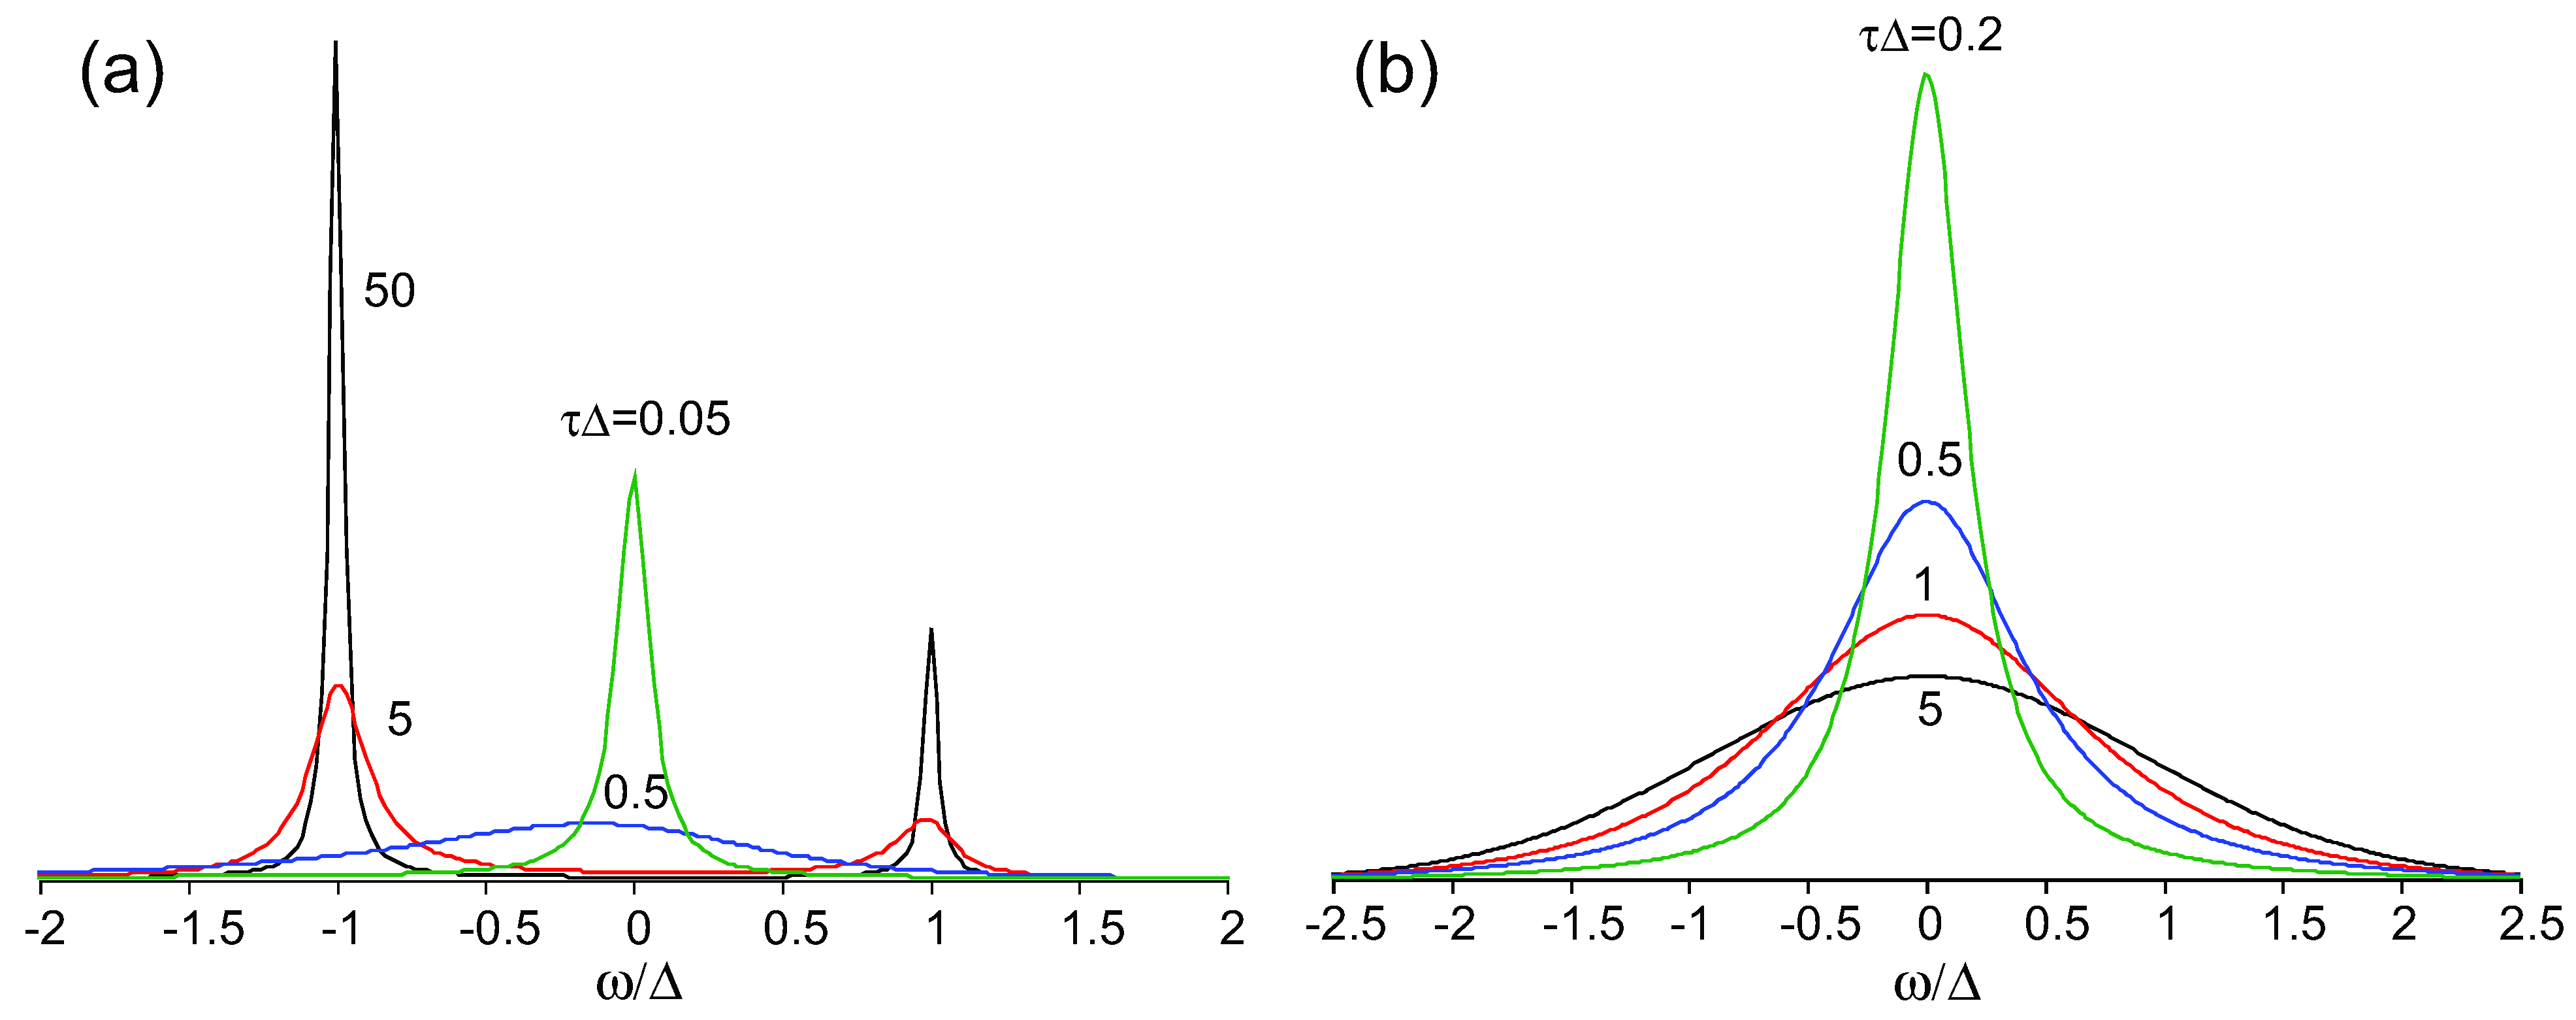
(a) Two-states-jump model calculated by Equation (3) with ω1/2 = 0, Г/Δ = 0.04, aR = 10, and aP = 0.3; (b) Gaussian model calculated using Equation (4). τ and Δ are the correlation time and amplitude of fluctuation, respectively.
Figure 4.
(a) Two-states-jump model calculated by Equation (3) with ω1/2 = 0, Г/Δ = 0.04, aR = 10, and aP = 0.3; (b) Gaussian model calculated using Equation (4). τ and Δ are the correlation time and amplitude of fluctuation, respectively.
The fluctuation of the site charge is characterized by its amplitude (or variance  ) and correlation time
  , where Δρ = ρ(t) − 1/2 is the time-dependent site-charge variation from the average site charge 1/2. This charge fluctuation modulates the frequencies of ν27 and ν2 with an amplitude Δf and correlation time τ. When the site charge fluctuates stochastically between two values such as ρR and ρP and thus the frequency fluctuates between ωR and ωP with a transition rate γ, then the line shape of the charge-sensitive mode is described by the following equation [58].
) and correlation time , where Δρ = ρ(t) − 1/2 is the time-dependent site-charge variation from the average site charge 1/2. This charge fluctuation modulates the frequencies of ν27 and ν2 with an amplitude Δf and correlation time τ. When the site charge fluctuates stochastically between two values such as ρR and ρP and thus the frequency fluctuates between ωR and ωP with a transition rate γ, then the line shape of the charge-sensitive mode is described by the following equation [58].
here ω1/2 is the frequency for ρ = 1/2, Δ = (ωP − ωR)/2, Г is the natural width in the solid state, and aR and aP are parameters proportional to the transition dipole moment or Raman tensor of the charge-sensitive mode at charge-rich and charge-poor sites, respectively. In this case, the correlation time is equal to the staying time at a site which is given by τ = 1/γ. When τΔ << 1 or τΔ >> 1, the lineshape approaches a Lorentzian.
When the site charge fluctuates stochastically as a Gaussian process, the correlation function has an exponential decay as,  , where Δc is the amplitude of the fluctuation and γ is the decay rate. In this case, the modulation of the site charge is transformed to a modulation of the frequency of the charge-sensitive mode, and the line shape of the charge-sensitive mode is given by the following equation [59,60],
, where Δc is the amplitude of the fluctuation and γ is the decay rate. In this case, the modulation of the site charge is transformed to a modulation of the frequency of the charge-sensitive mode, and the line shape of the charge-sensitive mode is given by the following equation [59,60], 
where Δ is the amplitude (variance) of the modulation frequency of the charge-sensitive mode. In this case the correlation time is equal to the inverse of the decay rate, τ = 1/γ. When τΔ >> 1 and τΔ << 1, the lineshape approaches a Gaussian and a Lorentzian, respectively. Figure 4 shows the spectral line shape of these two cases plotted as a function of ωΔ for various τΔ with ω1/2 = 0. In both cases, the line shape is determined by the parameter τΔ. When both τ and Δ vary with temperature, it is difficult to determine them from an analysis of the line shape.
3. β″-(BEDT-TTF)(TCNQ)
3.1. Crystal Structure and Superlattice
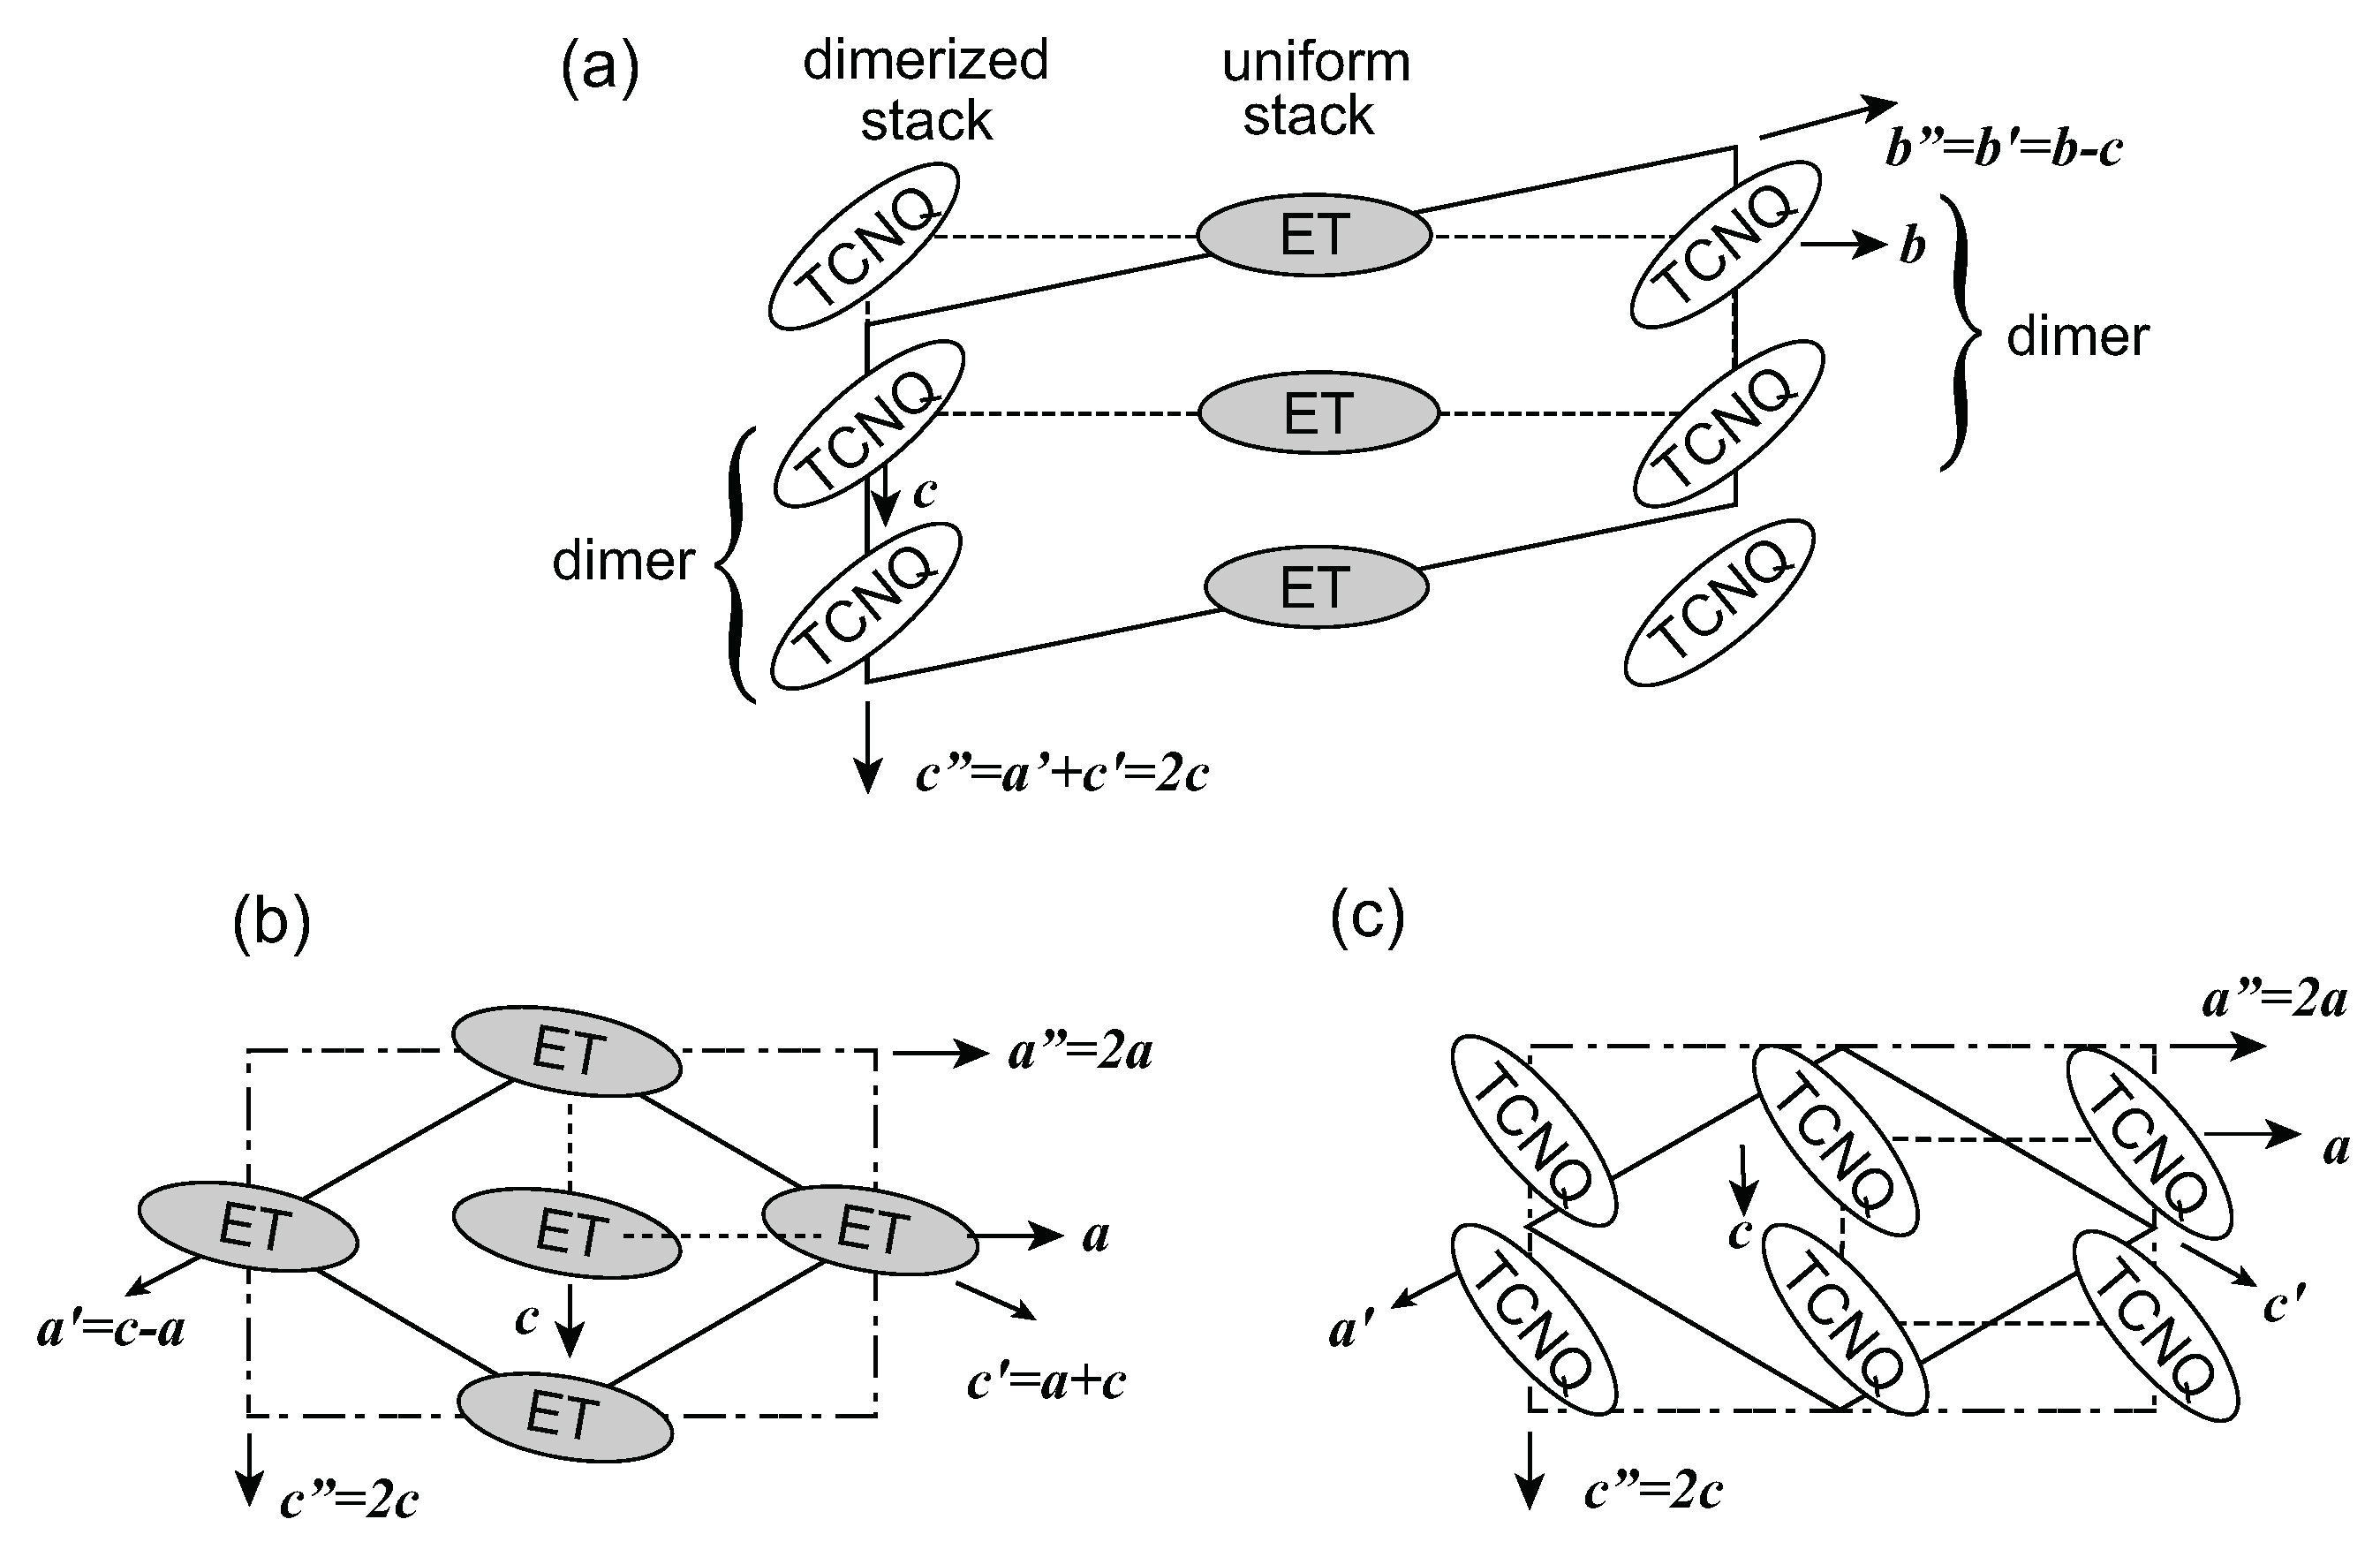
β″-(BEDT-TTF)(TCNQ) has a segregated stack structure, in which BEDT-TTF and TCNQ are regularly stacked along the c axis. The degree of the charge transfer of (BEDT-TTF)+ρ(TCNQ)−ρ is estimated to be ρ = 0.5 from the frequency shift of ν21, ν34, and ν4 of TCNQ [61]. Therefore, this compound is regarded as a quarter-filled system. BEDT-TTF has the largest transfer integral along the side-by-side direction (a axis) and TCNQ has the largest transfer integral along the stacking direction [62]. The hopping interaction between BEDT-TTF and TCNQ along the b axis is negligibly small. These theoretical predictions are qualitatively supported by the anisotropic optical conductivity [61]. Very weak superlattice spots are reported in ref. [61]. The observation of vibronic bands of TCNQ only in the E||c optical conductivity suggests that TCNQ is dimerized whereas BEDT-TTF is not. Based on these spectroscopic results and assuming the space group  , the proposed model of this superstructure is shown in Figure 5. TCNQ is connected by a center of symmetry (4kF modulation) and BEDT-TTF is located on the center of symmetry. Therefore, the two TCNQs in the unit cell are crystallographically equivalent, whereas the two BEDT-TTFs are non-equivalent. These superlattice spots disappear at around 170 K. However, the vibronic bands of TCNQ still remain after the superlattice spots vanish. This result implies that the short-range ordered 4kF modulation remains in the TCNQ stack or another superlattice forms. According to the X-ray diffraction study by Nogami, a new superlattice spot for 2a × 2c was found below 170 K. [63]. In any case, the valence electron in the TCNQ stack is localized within the dimer, and the valence electron in the pseudo-one-dimensional BEDT-TTF band is responsible for the charge carriers.
, the proposed model of this superstructure is shown in Figure 5. TCNQ is connected by a center of symmetry (4kF modulation) and BEDT-TTF is located on the center of symmetry. Therefore, the two TCNQs in the unit cell are crystallographically equivalent, whereas the two BEDT-TTFs are non-equivalent. These superlattice spots disappear at around 170 K. However, the vibronic bands of TCNQ still remain after the superlattice spots vanish. This result implies that the short-range ordered 4kF modulation remains in the TCNQ stack or another superlattice forms. According to the X-ray diffraction study by Nogami, a new superlattice spot for 2a × 2c was found below 170 K. [63]. In any case, the valence electron in the TCNQ stack is localized within the dimer, and the valence electron in the pseudo-one-dimensional BEDT-TTF band is responsible for the charge carriers.β″-(BEDT-TTF)(TCNQ) is metal-like down to 1.8 K with three anomalies at ~170 K, ~80 K, and ~20 K [62,64]. The magneto-resistance below 20 K was extensively studied by Yasuzuka et al. They found five distinct small Fermi surfaces through the Shubnikov-de-Haas oscillations [65,66,67]. A quasi-one-dimensional periodic orbit resonance was found through the magneto-optical measurement [68,69]. The magneto-resistance and magneto-optical experiments demonstrate the existence of the Fermi surface below 20 K, which implies that the ground state is a Fermi liquid metal. On the other hand, charge disproportionation with an amplitude of Δρ~0.6 was reported at room temperature based on the observation of the splitting of charge-sensitive ν27 mode of BEDT-TTF [70]. Such a large amplitude at high-temperature indicates a localized nature, so suggesting a phase change between the high- and low-temperature regions.

Figure 5.
Arrangement of molecules in β″-(BEDT-TTF)(TCNQ). Average lattice (dotted line; crystal axes are a, b, and c), superlattice above 170 K (solid line; crystal axes are a′, b′, and c′), and superlattice 2a × 2c below 170 K (dash dot line; crystal axes are a″, b″, and c″). Arrangement in (a) BEDT-TTF (ET) and TCNQ; (b) BEDT-TTF; and (c) TCNQ.
3.2. Crossover from Uniform Metal to Charge-Ordered Metal
Uruichi et al., have discussed the infrared, Raman, and optical conductivity of β″-(BEDT-TTF) (TCNQ) [61]. Figure 6 shows the infrared-active ν27 mode and Raman active ν2 mode of BEDT-TTF along with the electrical resistivity. Both charge-sensitive modes, ν27 and ν2, appear as a single band at ρ~0.5 below 100 K. Upon increasing the temperature, they split into high-frequency and low-frequency modes. This splitting is comparable with ν27 and ν2 in the CO state of θ-(BEDT-TTF)2RbZn [71,72]. This splitting clearly shows the charge disproportionation from uniform site charge with Δρ~0 to two different site charges with an amplitude of Δρ~0.6. Above 150 K, these two sites appear to correspond to the two non-equivalent sites in the superlattice (center and corner sites in Figure 5b). However, the intensity of the superlattice reflection is extremely weak compared with Bragg reflections. This observation means that the two independent sites are approximately equivalent. Therefore, this charge disproportionation seems not to be long-range ordered, and probably the short-range ordered site charges are dynamically fluctuating. The correlation time was estimated to be τ > ~ 0.3 ps at room temperature assuming a two-states-jump model [61]. This will be further discussed below along with the optical conductivity. On the other hand, the charge-sensitive modes ν21, ν34, and ν4 of TCNQ show no change. This observation is consistent with the speculation that the valence electrons of TCNQ are localized within the TCNQ dimer over the whole temperature range.
Figure 7 shows the optical conductivity polarized along the a axis, which is the direction of the maximum transfer integral between BEDT-TTF. The temperature dependence is peculiar in that the spectral weight shifts to the low-frequency region on decreasing temperature. At the same time the resistivity also decreases. This characteristic spectral change seems to be interpreted by the theoretical model of Merino et al. [40]. They computed the optical conductivity for a quarter-filled square lattice with various V/t values under the condition of U/t = 20, where U, V, ant t are the on-site Coulomb energy, intersite Coulomb energy, and intersite hopping energy, respectively. When V/t exceeds the critical value (V/t)c, a CO state is more stable than a metallic state. According to their theory, the density of states in a metallic phase (V/t < (V/t)c) is triply peaked at around the Fermi energy (See the inset of Figure 7). From a low energy, these peaks correspond to the incoherent band associated with the lower Hubbard band, quasiparticle band, and upper incoherent band. When V/t increases, the quasiparticle peak in the density of states decreases, and finally vanishes in the CO state (V/t > (V/t)c). Consequently the optical conductivity consists of three terms, σ(ω) = σD(ω) + σIQ(ω) + σII(ω), where σD(ω) is the Drude term that peaks at ω = 0 which corresponds to the excitation within the quasiparticle band, σIQ(ω) is the optical transition between the incoherent bands and the quasiparticle band, and σII(ω) is the optical transition between the incoherent bands (transition between the neighbor sites in real space description) [73]. In the CO state, the gap is open, so that σD(ω) and σIQ(ω) vanish. When V/t decreases, the CO state is melted, and σD(ω) and σIQ(ω) gain the intensity and σII(ω) loses the intensity. At the same time, the peaks of σIQ(ω) and σII(ω) shift toward lower energy. The observation of σD(ω) is a sign of the coherent quasiparticle band and the intensity decrease and the low-energy shift of σIQ(ω) and σII(ω) corresponds to growth of the coherent band of the quasiparticle. This trend of σIQ(ω) and σII(ω) is seen in Figure 8b with decreasing temperature. The Drude term σD(ω) appearing below 600 cm−1 has not been measured in this compound. Probably σD(ω) will quickly grows below 20 K, as the dc conductivity increases remarkably below 20 K as shown in Figure 7.
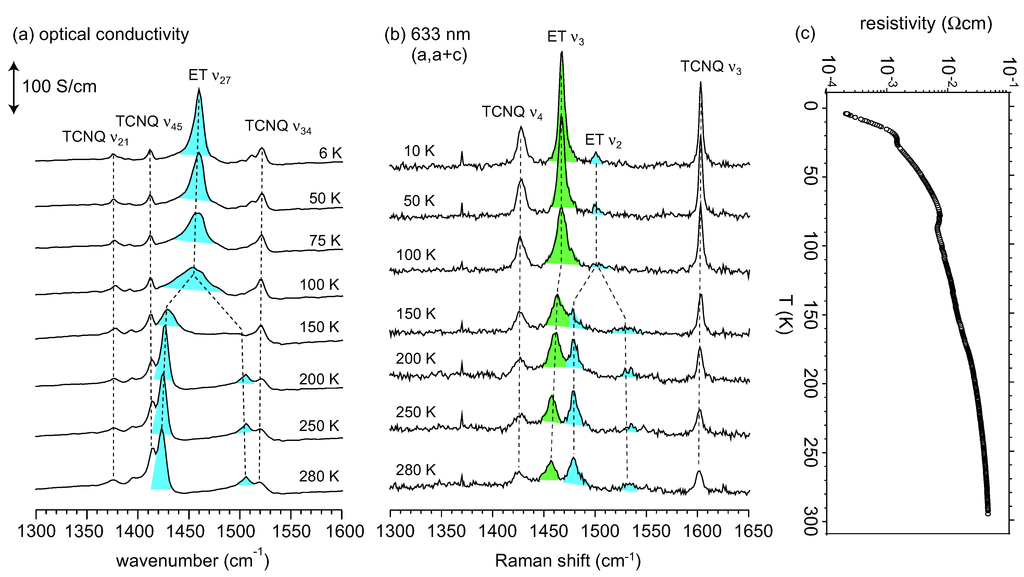
Figure 6.
Temperature dependences of the (a) ν27 mode (blue); (b) ν2 (blue) and ν3 (green) modes; and (c) electrical resistivity of BEDT-TTF in β″-(BEDT-TTF)(TCNQ). Note that the charge-sensitive modes merge into a single band on decreasing the temperature. This figure is modified from Figures 3,4,7 in ref. [61].
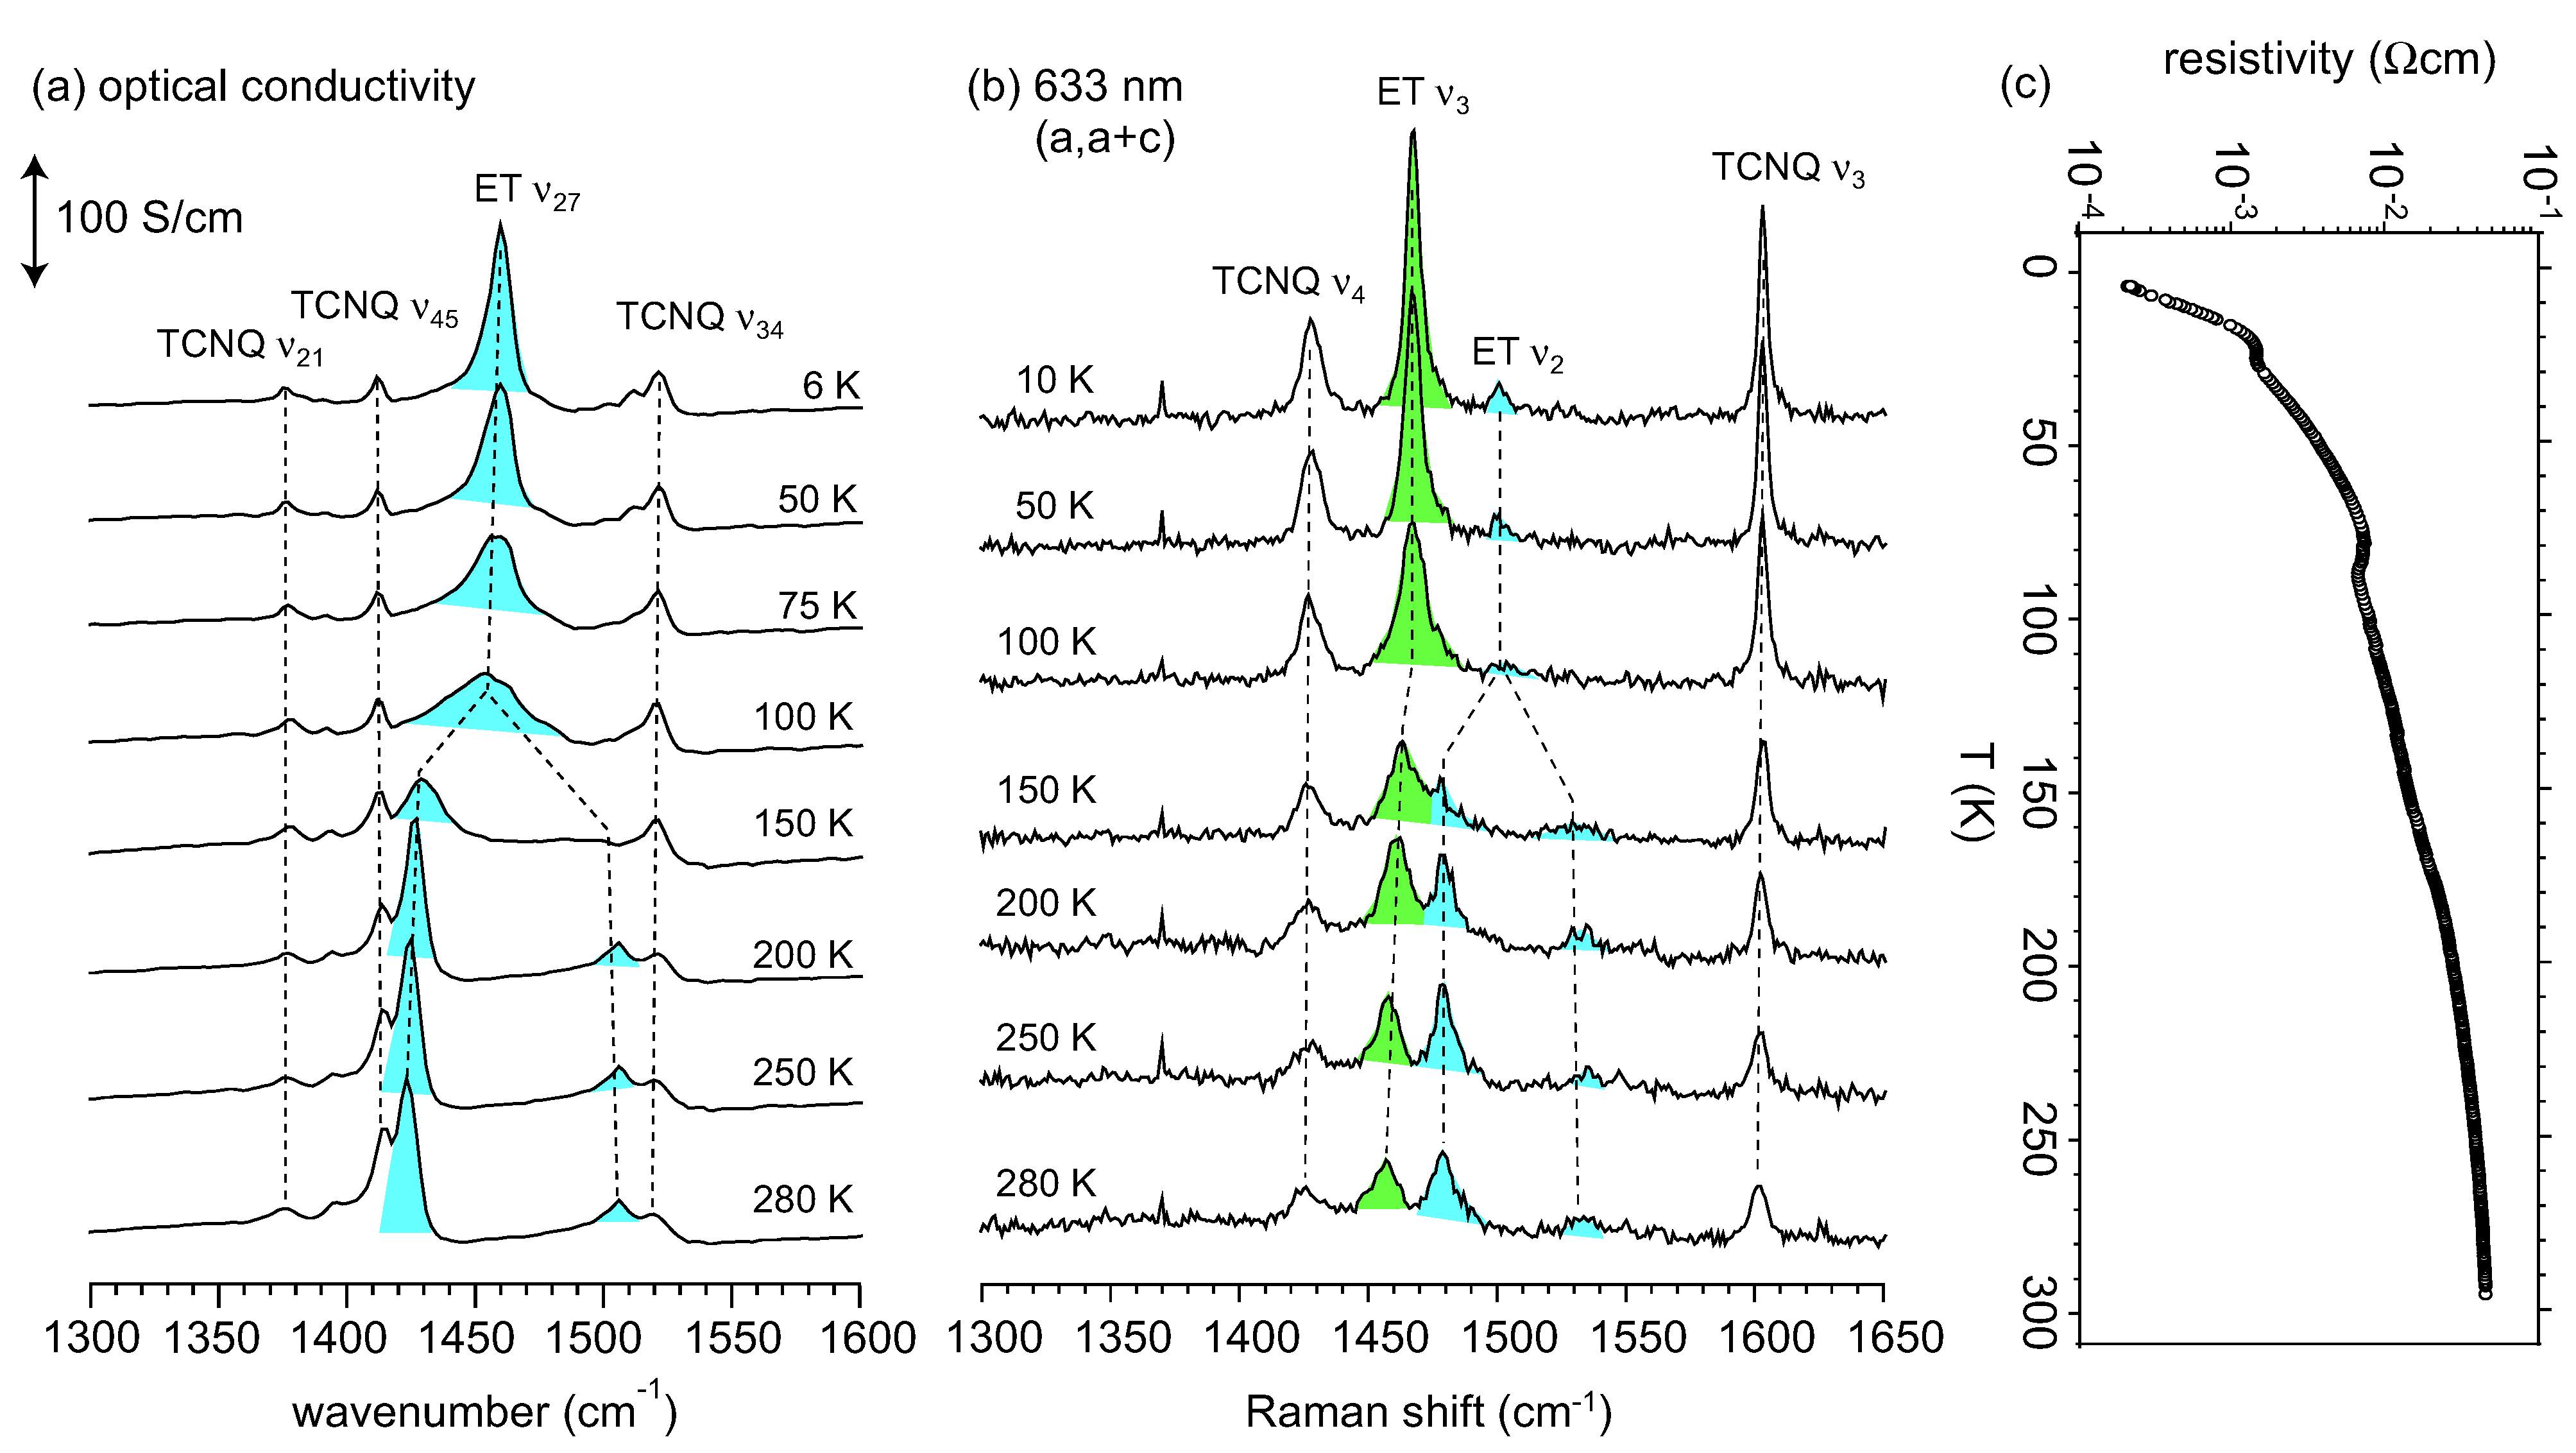
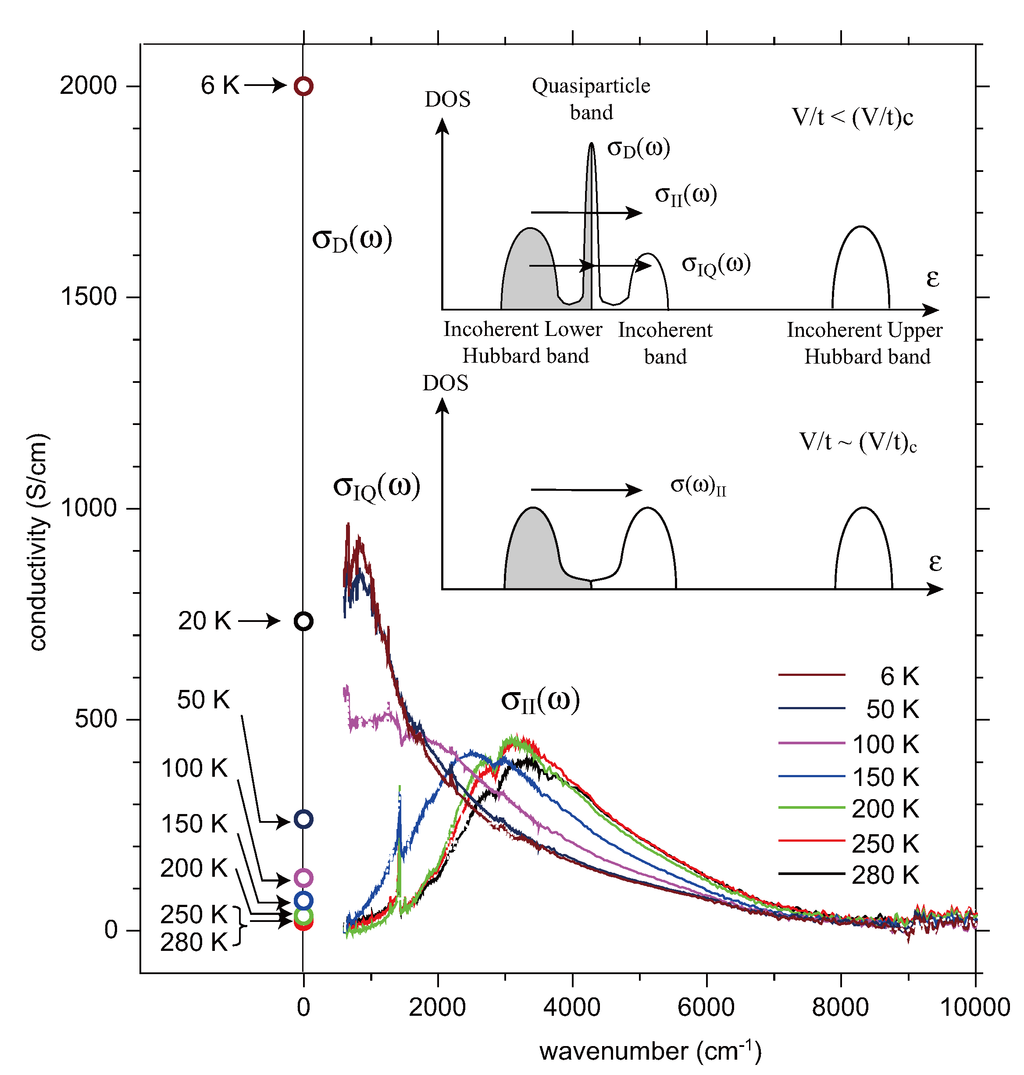
Figure 7.
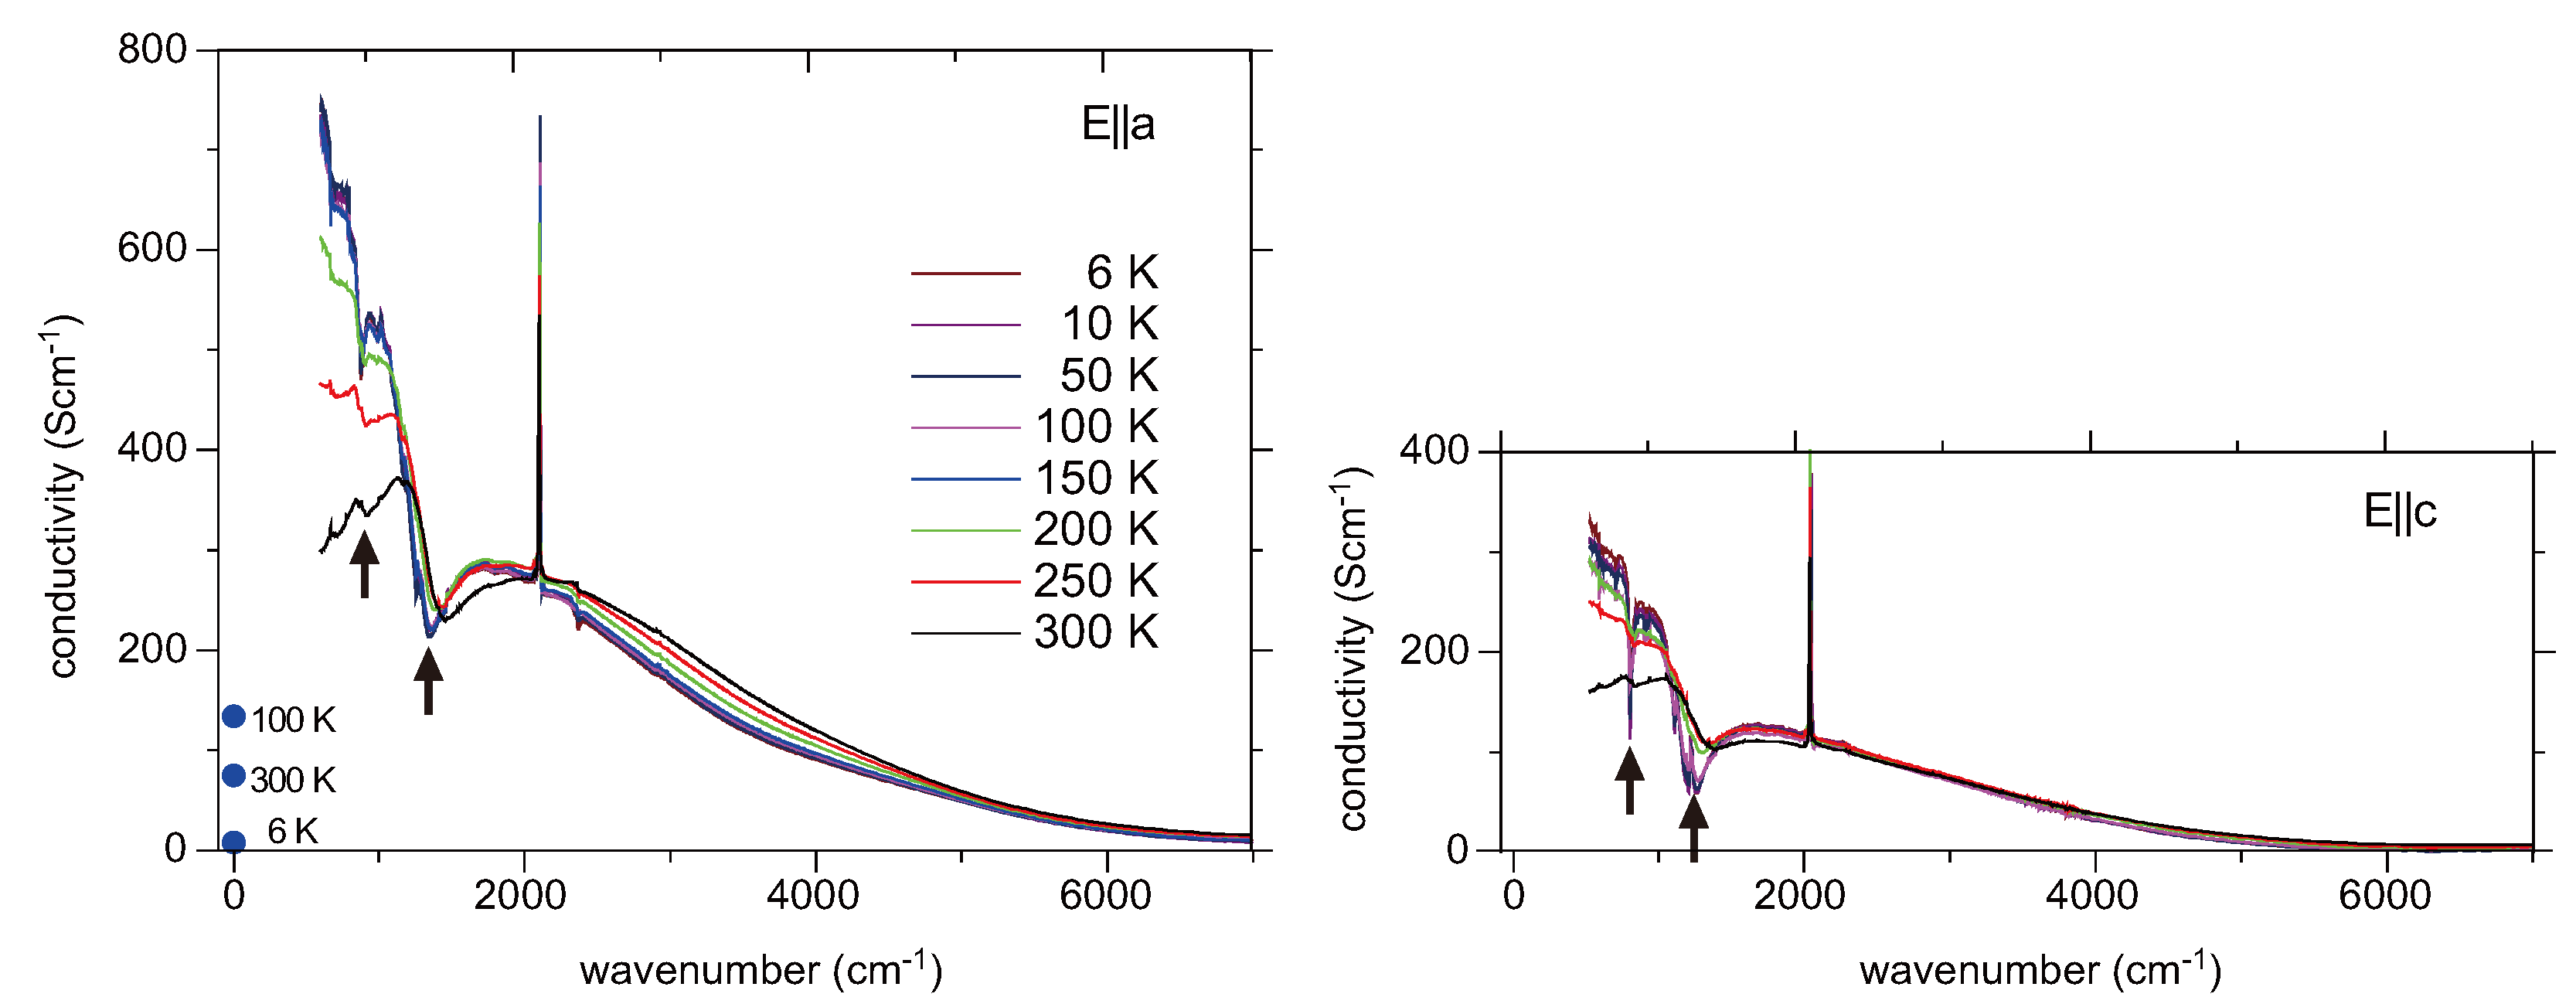
Temperature dependence of the E||a optical conductivity of β″-(BEDT-TTF)(TCNQ). Circles at zero wavenumber denote the dc conductivity at several temperatures. The inset shows the schematic figure of density of states in the quarter-filled band system. See the text for the meaning of the electronic transitions, σD(ω), σIQ(ω), and σII(ω).
Figure 7.
Temperature dependence of the E||a optical conductivity of β″-(BEDT-TTF)(TCNQ). Circles at zero wavenumber denote the dc conductivity at several temperatures. The inset shows the schematic figure of density of states in the quarter-filled band system. See the text for the meaning of the electronic transitions, σD(ω), σIQ(ω), and σII(ω).
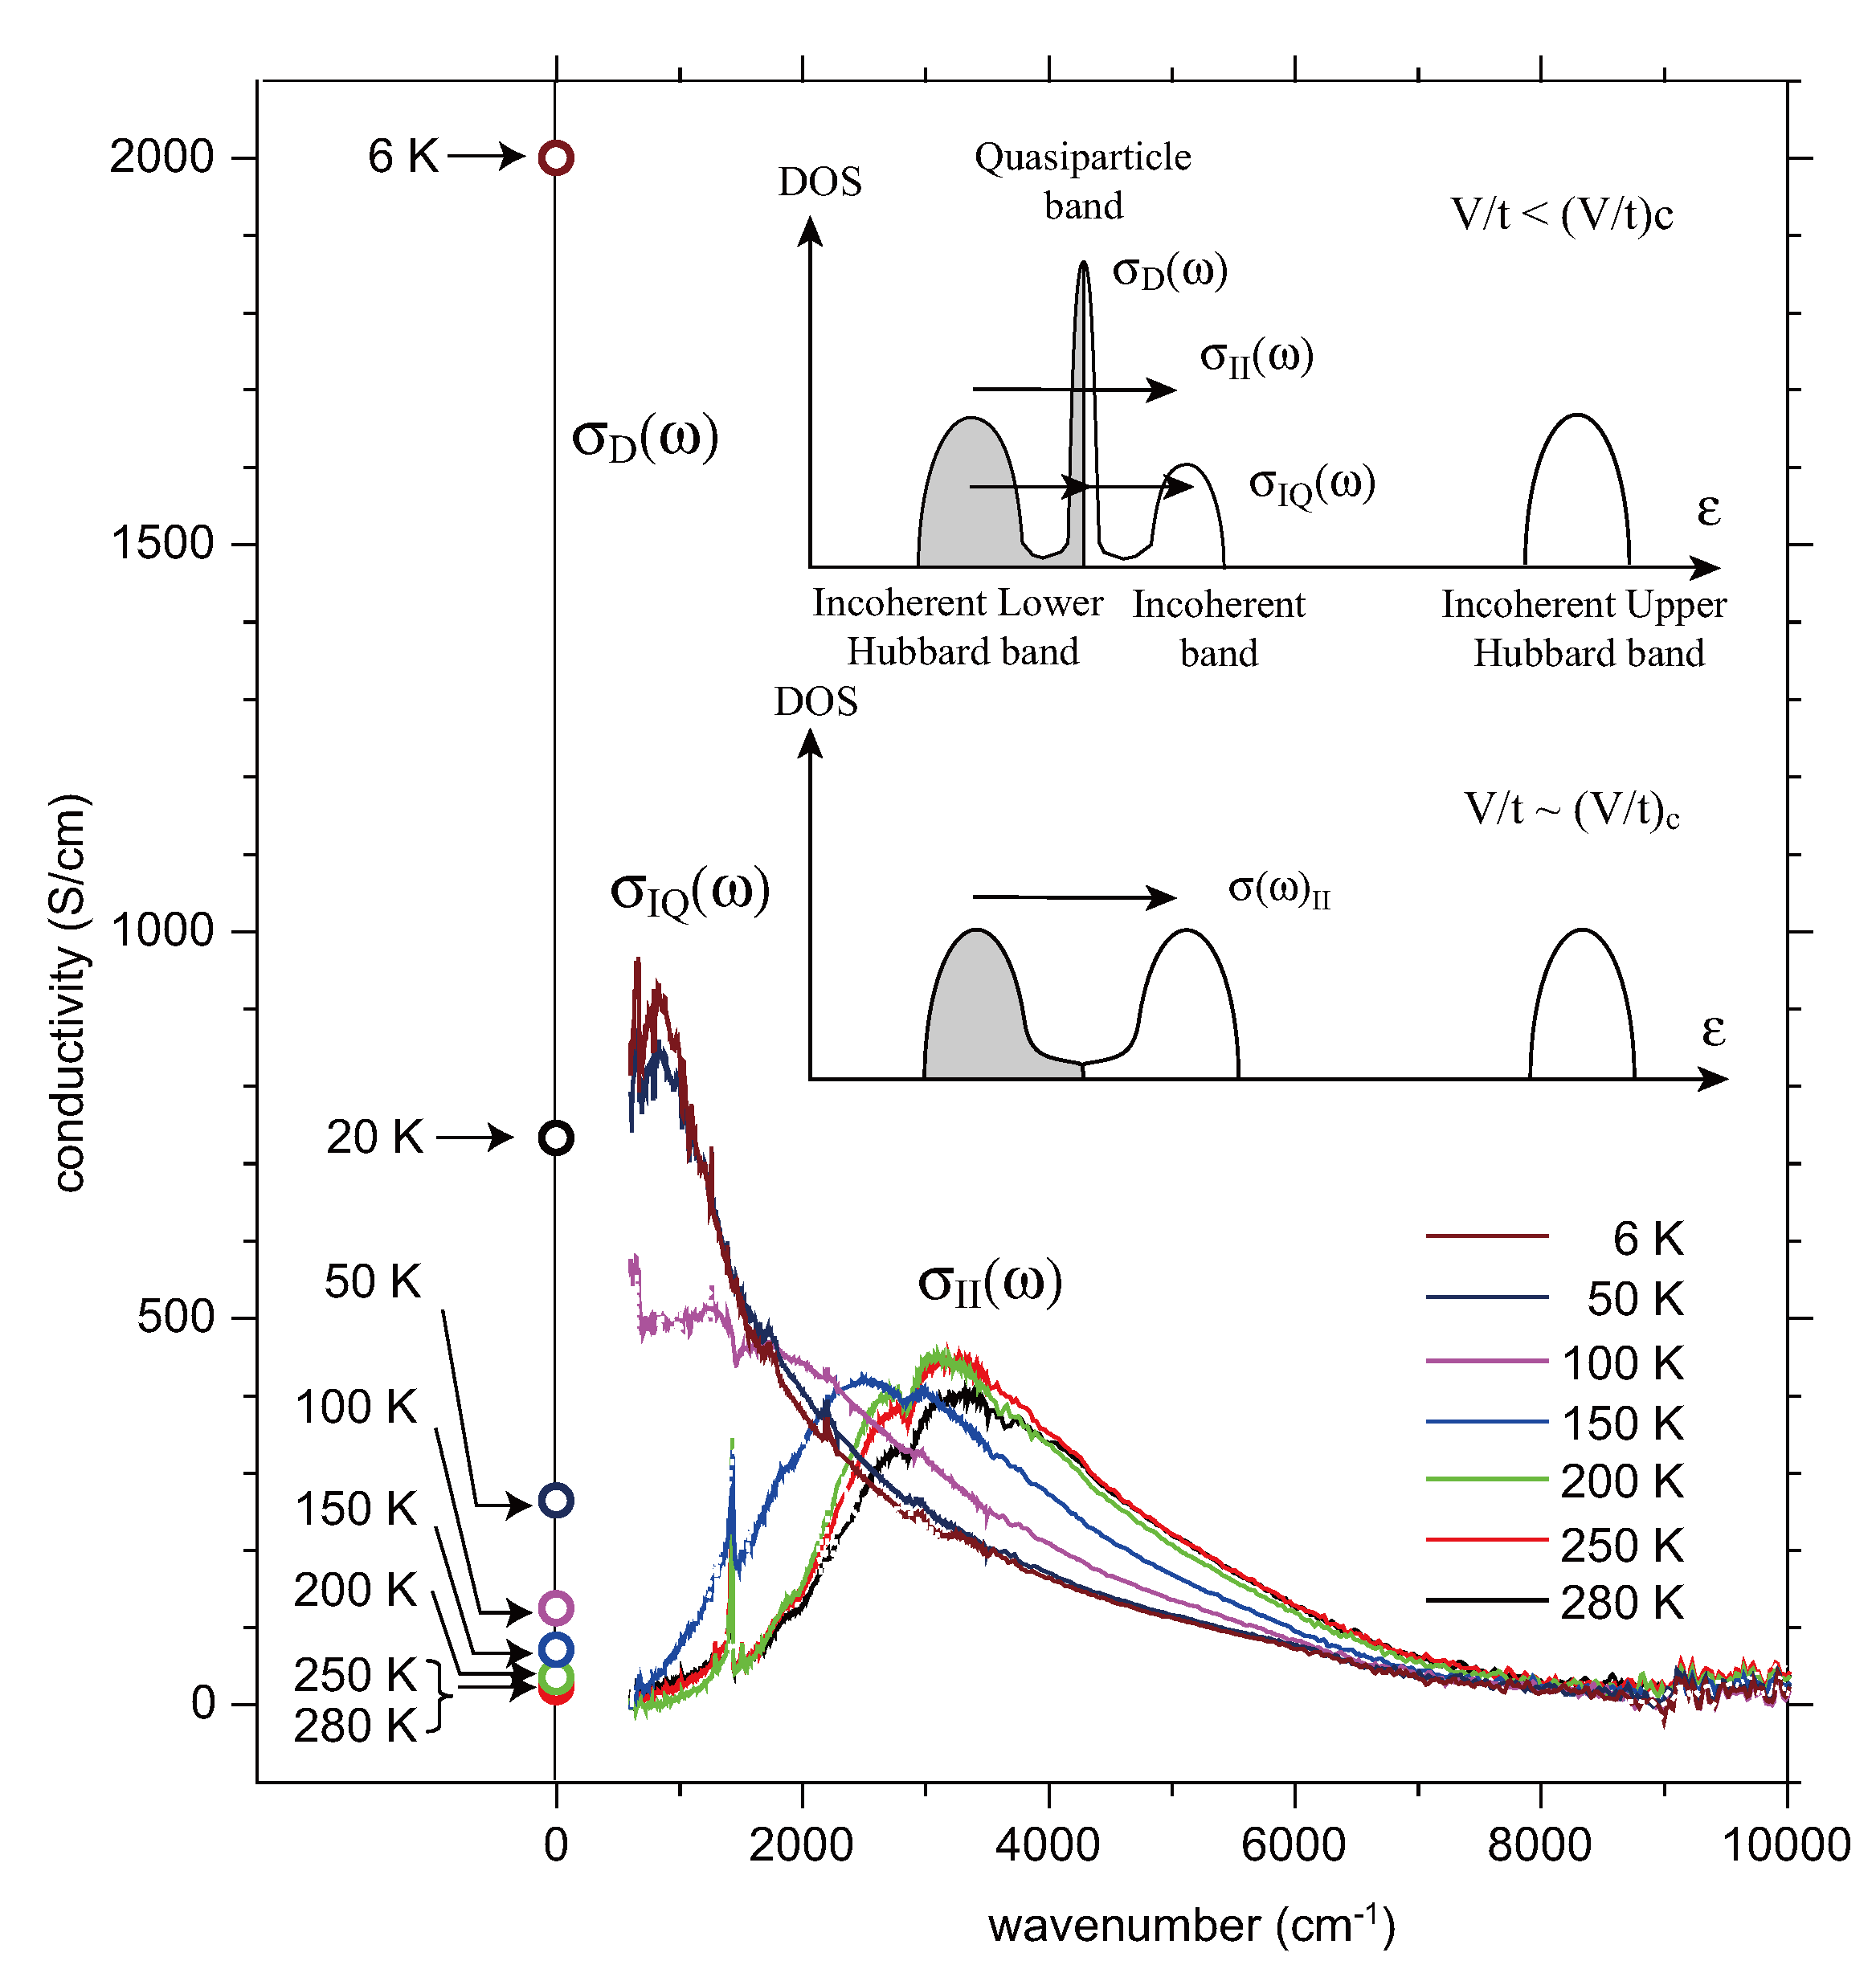

Figure 8.
Temperature dependences of the following quantities of β″-(BEDT-TTF)(TCNQ). (a) electrical resistivity; (b) peak frequency of electronic transition; (c) partial effective hole number; (d) peak frequency of ν27, where squares and triangles are the data of independent experiment; and (e) product of correlation time and splitting width of ν27. Lines are included as guide to the eye. The inset of Figure 8a shows that the resistivity below 20 K follows the relation for a Fermi liquid, ρ = ρ0 + AT2. Figure 8a,b are taken from Figure 7 of ref. [61].
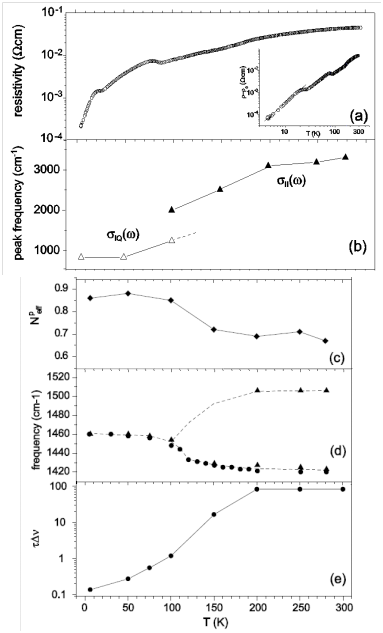
According to the charge correlation function C(q, ω) near CO calculated by Merino et al., the excitation energy ω approaches zero and the correlation length diverges [40,41], when the parameters V/t approach the critical value for long-range CO. Accordingly, the amplitude of CO fluctuation Δρ increases and the correlation time τ is expected to diverge. This trend is seen in Figure 8e on increasing the temperature, where the product τΔν is estimated from the two-states-jump model as explained in Section 2.4. Therefore, together with the optical conductivity, β″-(BEDT-TTF)(TCNQ) approaches the long-range CO state with increasing temperature. Above 200 K the increase in the product τΔν levels off, and the optical conductivity appears to have a gap. If this compound attains a long range order above 200 K, the charge-rich and charge-poor molecules are fixed at crystallographically independent sites. In spite of the large amplitude of CO, the two independent sites are approximately equivalent, as described in the first paragraph of this section. This result suggests that short-range charge order fluctuates, and it is not long-range ordered above 200 K. The absence of long-range order as well as the sizable dc conductivity with dρ/dT > 0 in this temperature range, as shown in Figure 8a, suggests the existence of a finite density of states at the Fermi level as schematically drawn in the inset in Figure 7. The apparent optical gap is regarded as a pseudogap. Therefore the high-temperature state is considered to be a charge-ordered metal [74].The amplitude Δρ~0.6 and correlation time τ > ~ 0.3 ps may characterize the charge-ordered metal of this compound. The optical conductivity below 600 cm−1 is necessary to clarify the finite density of state near the Fermi level.
In contrast, at low temperatures, the CO fluctuation is significantly suppressed, as τΔν is decreased by three orders of magnitude. Merino predicted a transition between a uniform metal and a charge-ordered metal [74]. As shown in Figure 8d, the spectral variation of ν27 looks to be continuous at around 100 K. Therefore, this compound shows a crossover from a charge-ordered metal to a uniform metal upon lowering the temperature. Comparing with the theoretical model, it turns out that decreasing temperature corresponds to a decrease of V/t. Although the lattice contraction increases both V and t, the latter is more sensitive to an intermolecular distance. Therefore, lattice contraction is responsible for this crossover behavior. Actually, the increase in t is indicated by an increase in the partial effective number, which is defined by the following equation,

where m and e are the electron mass and electron charge respectively, N is the hole density of BEDT-TTF, ωc1 = 600 cm−1 and ωc2 = 9000 cm−1 are the cut-off frequencies, and σ(ω) are the cut-off frequencies, Npeff increases by about 30% from 280 K to 6 K as shown in Figure 8c, though the spectral weight below 600 cm−1 is not taken into account. The role of lattice contraction on the electronic state is also supported by high pressure experiment. When a hydrostatic pressure is applied to this compound at room temperature, the Raman spectrum shows a similar variation as a decrease in the temperature. The split ν2 modes merge at about 2 kbar [61], that is, the charge-ordered metal changes into a uniform metal due to lattice contraction. Possibly, a quasiparticle band is formed below 20 K because of the high conductivity and Fermi liquid behavior of transport properties [65,66,67,68,69]. To confirm this, the Drude response should be examined in the optical conductivity below 600 cm−1. Finally, the structural change in the superlattice at ~170 K and anomalies in resistivity at ~80 K and ~20 K seem to have no influence on the optical conductivity and the line shape of the charge-sensitive mode. More extensive investigation is necessary for the understanding of this compound.
4. θ-(BEDT-TTF)2X
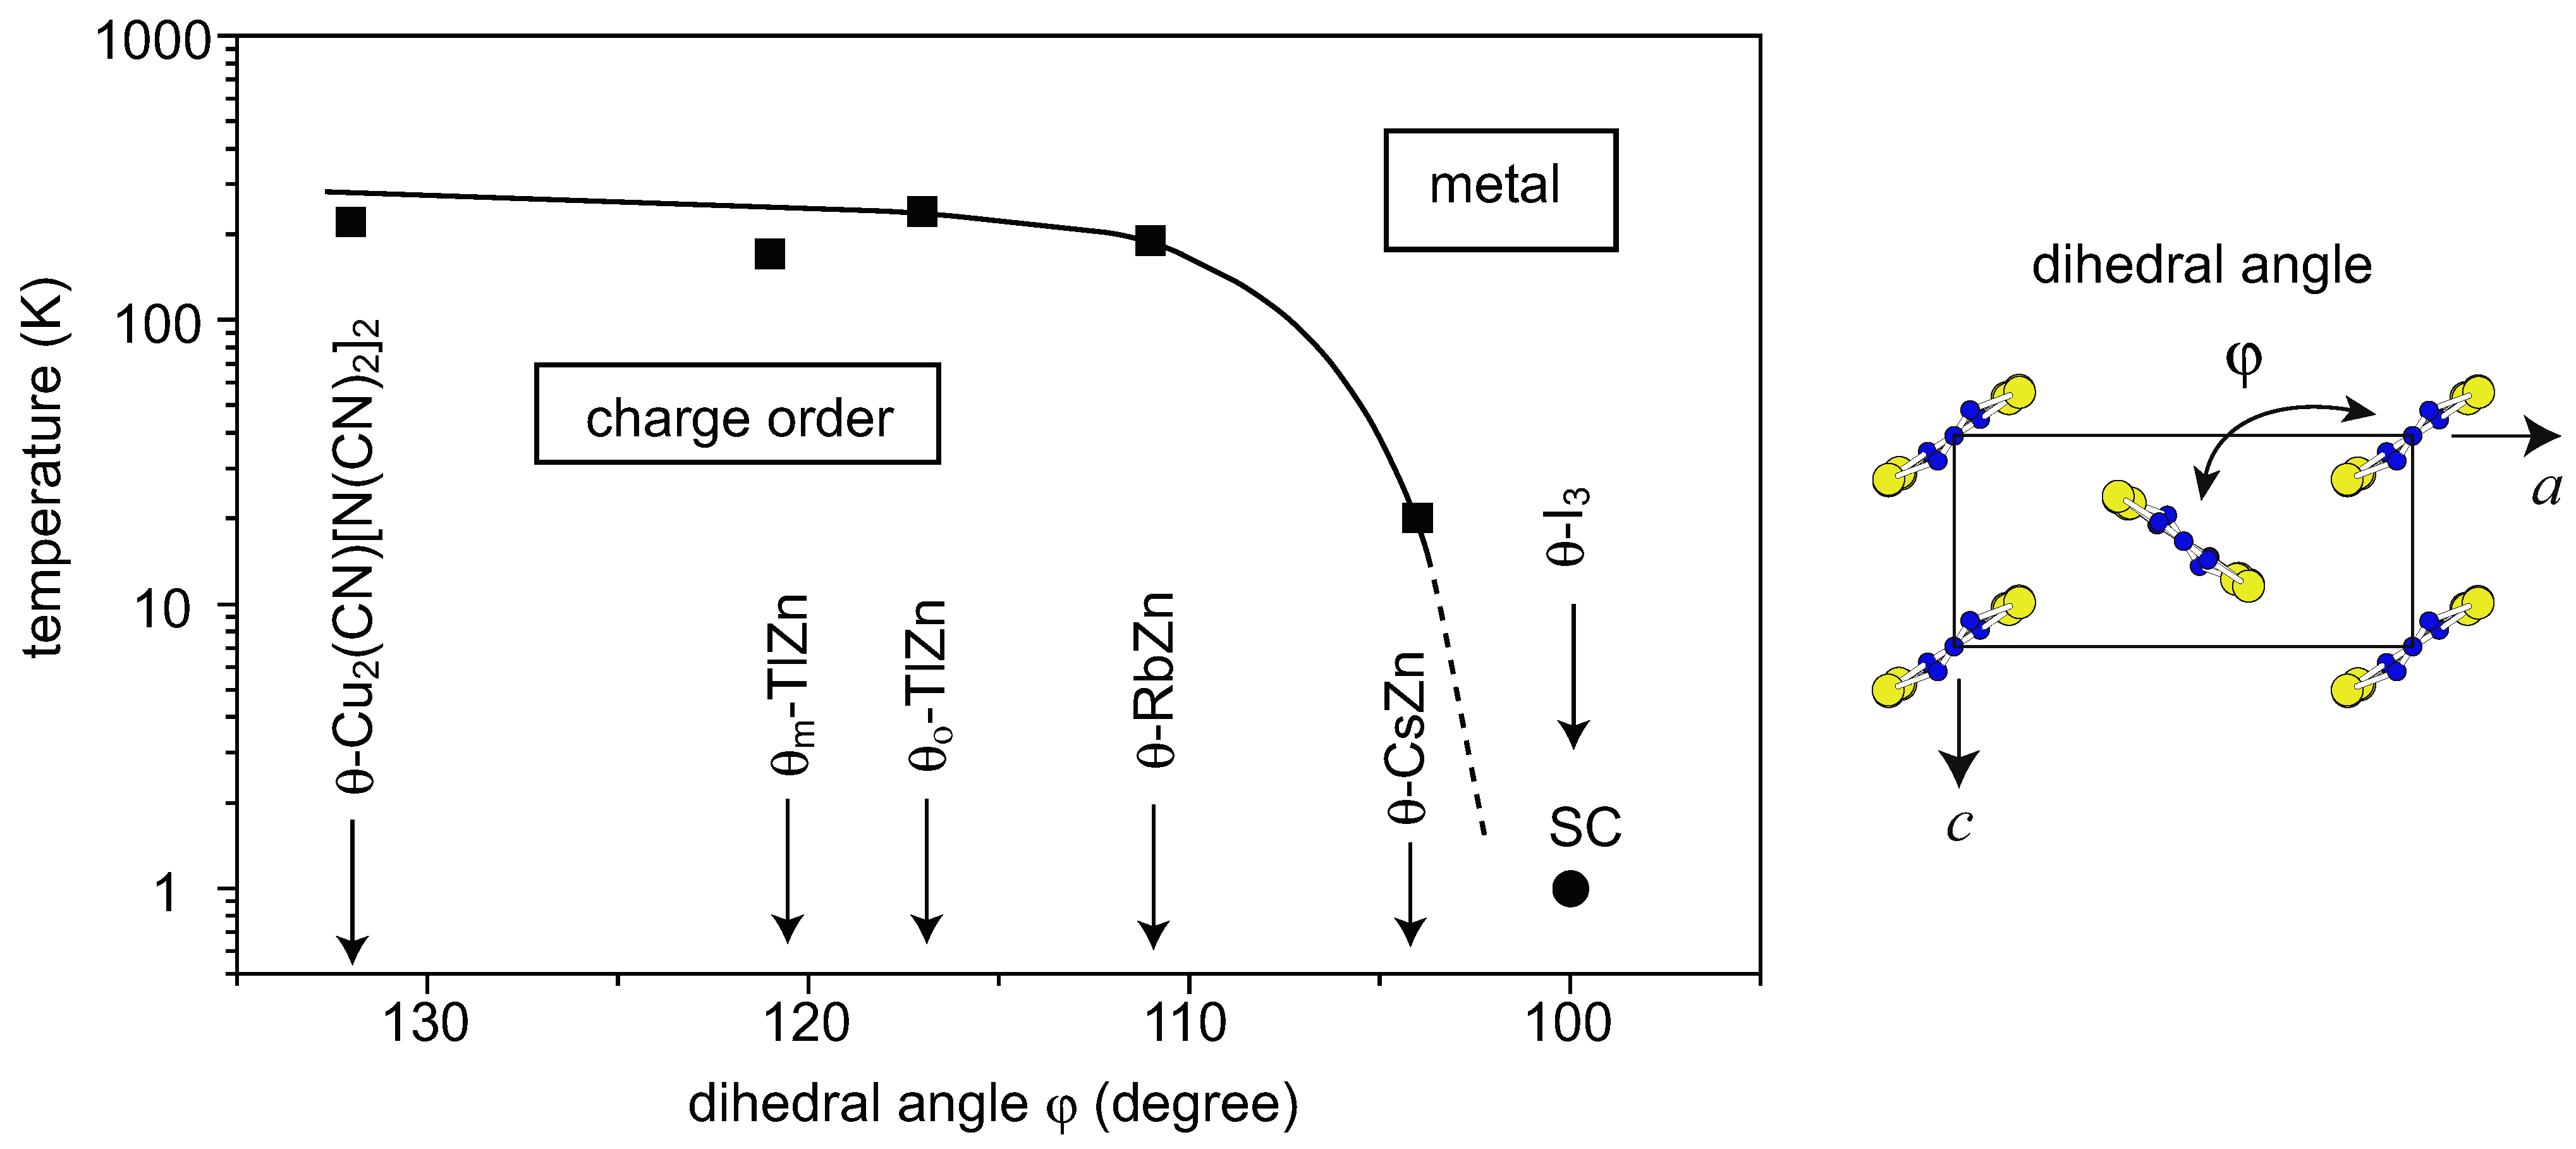
The θ-type BEDT-TTF salts, θ-(BEDT-TTF)2X, have a herringbone arrangement of BEDT-TTF, forming a two-dimensional quarter-filled system. This family includes metallic compounds and several compounds which undergo a charge-ordering (CO) phase transition. The electronic phase diagram of this family has been composed employing the dihedral angle φ between the adjacent BEDT-TTF molecules (See Figure 9), which is related to the bandwidth [74]. The dihedral angle was subsequently linked to tc/tp to explain the phase diagram, where tc and tp are the transfer integrals along the c (stacking) direction and a ± c (diagonal) directions forming a triangular lattice [75,76,77,78]. Watanabe discussed this phase diagram using tc/tp as follows [78]. As the dihedral angle φ decreases, the bandwidth increases [79], and the ground state is stabilized in the order of a stripe CO, frustrating CO between the stripe and the threefold lattice, and uniform metal. Accordingly, the temperature range of the highly conductive phase expands to the low-temperature region, as φ is decreased. In the small φ region, X = I3 (φ = 100°) [80] and X=CsZn(SCN)4 (φ = 104°) [81] salts, the high-temperature phase is metallic, with dρ/dT > 0, whereas it is non-metallic, with dρ/dT < 0 above the CO transition temperature in the large φ region. The activation energy increases with increasing φ as follows: 0.02 eV for X = RbZn(SCN)4 (φ = 111°) [81], 0.08 eV for orthorhombic TlZn(SCN)4 (φ = 117°) [81], 0.11 eV for monoclinic TlZn(SCN)4 (φ = 121°) [81], and 0.17–0.19 eV for Cu2(CN)[N(CN)2]2 (φ = 132°) [82]. Hereafter, θ-(BEDT-TTF)2MM′(SCN)4 and θ-(BEDT-TTF)2X are abbreviated as θ-MM′ and θ-X, respectively.
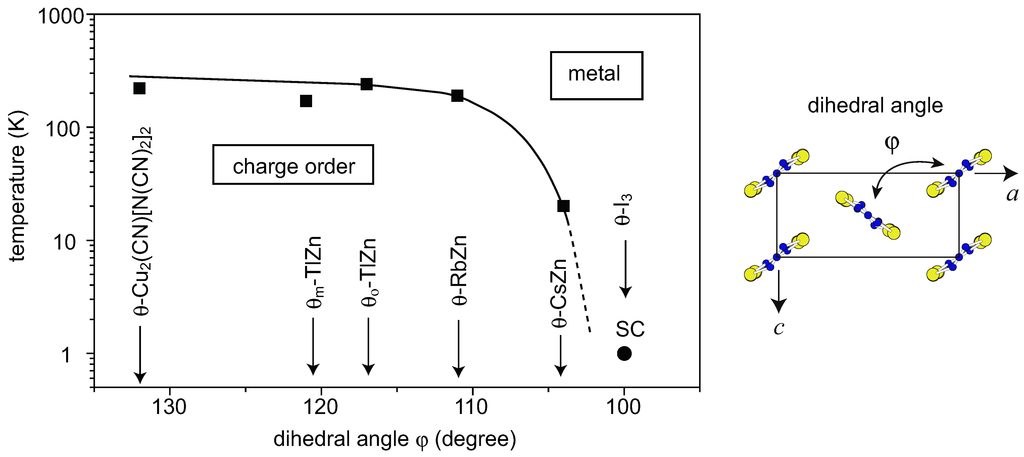
Figure 9.
Phase diagram of θ-(BEDT-TTF)2X [79]. The squares and the circle represent the charge-ordering phase transition and the superconducting phase transition, respectively.
Figure 9.
Phase diagram of θ-(BEDT-TTF)2X [79]. The squares and the circle represent the charge-ordering phase transition and the superconducting phase transition, respectively.
4.1. Charge-Ordered Phase of X = RbZn(SCN)4, TlZn(SCN)4, Cu2(CN)[N(CN)2]2
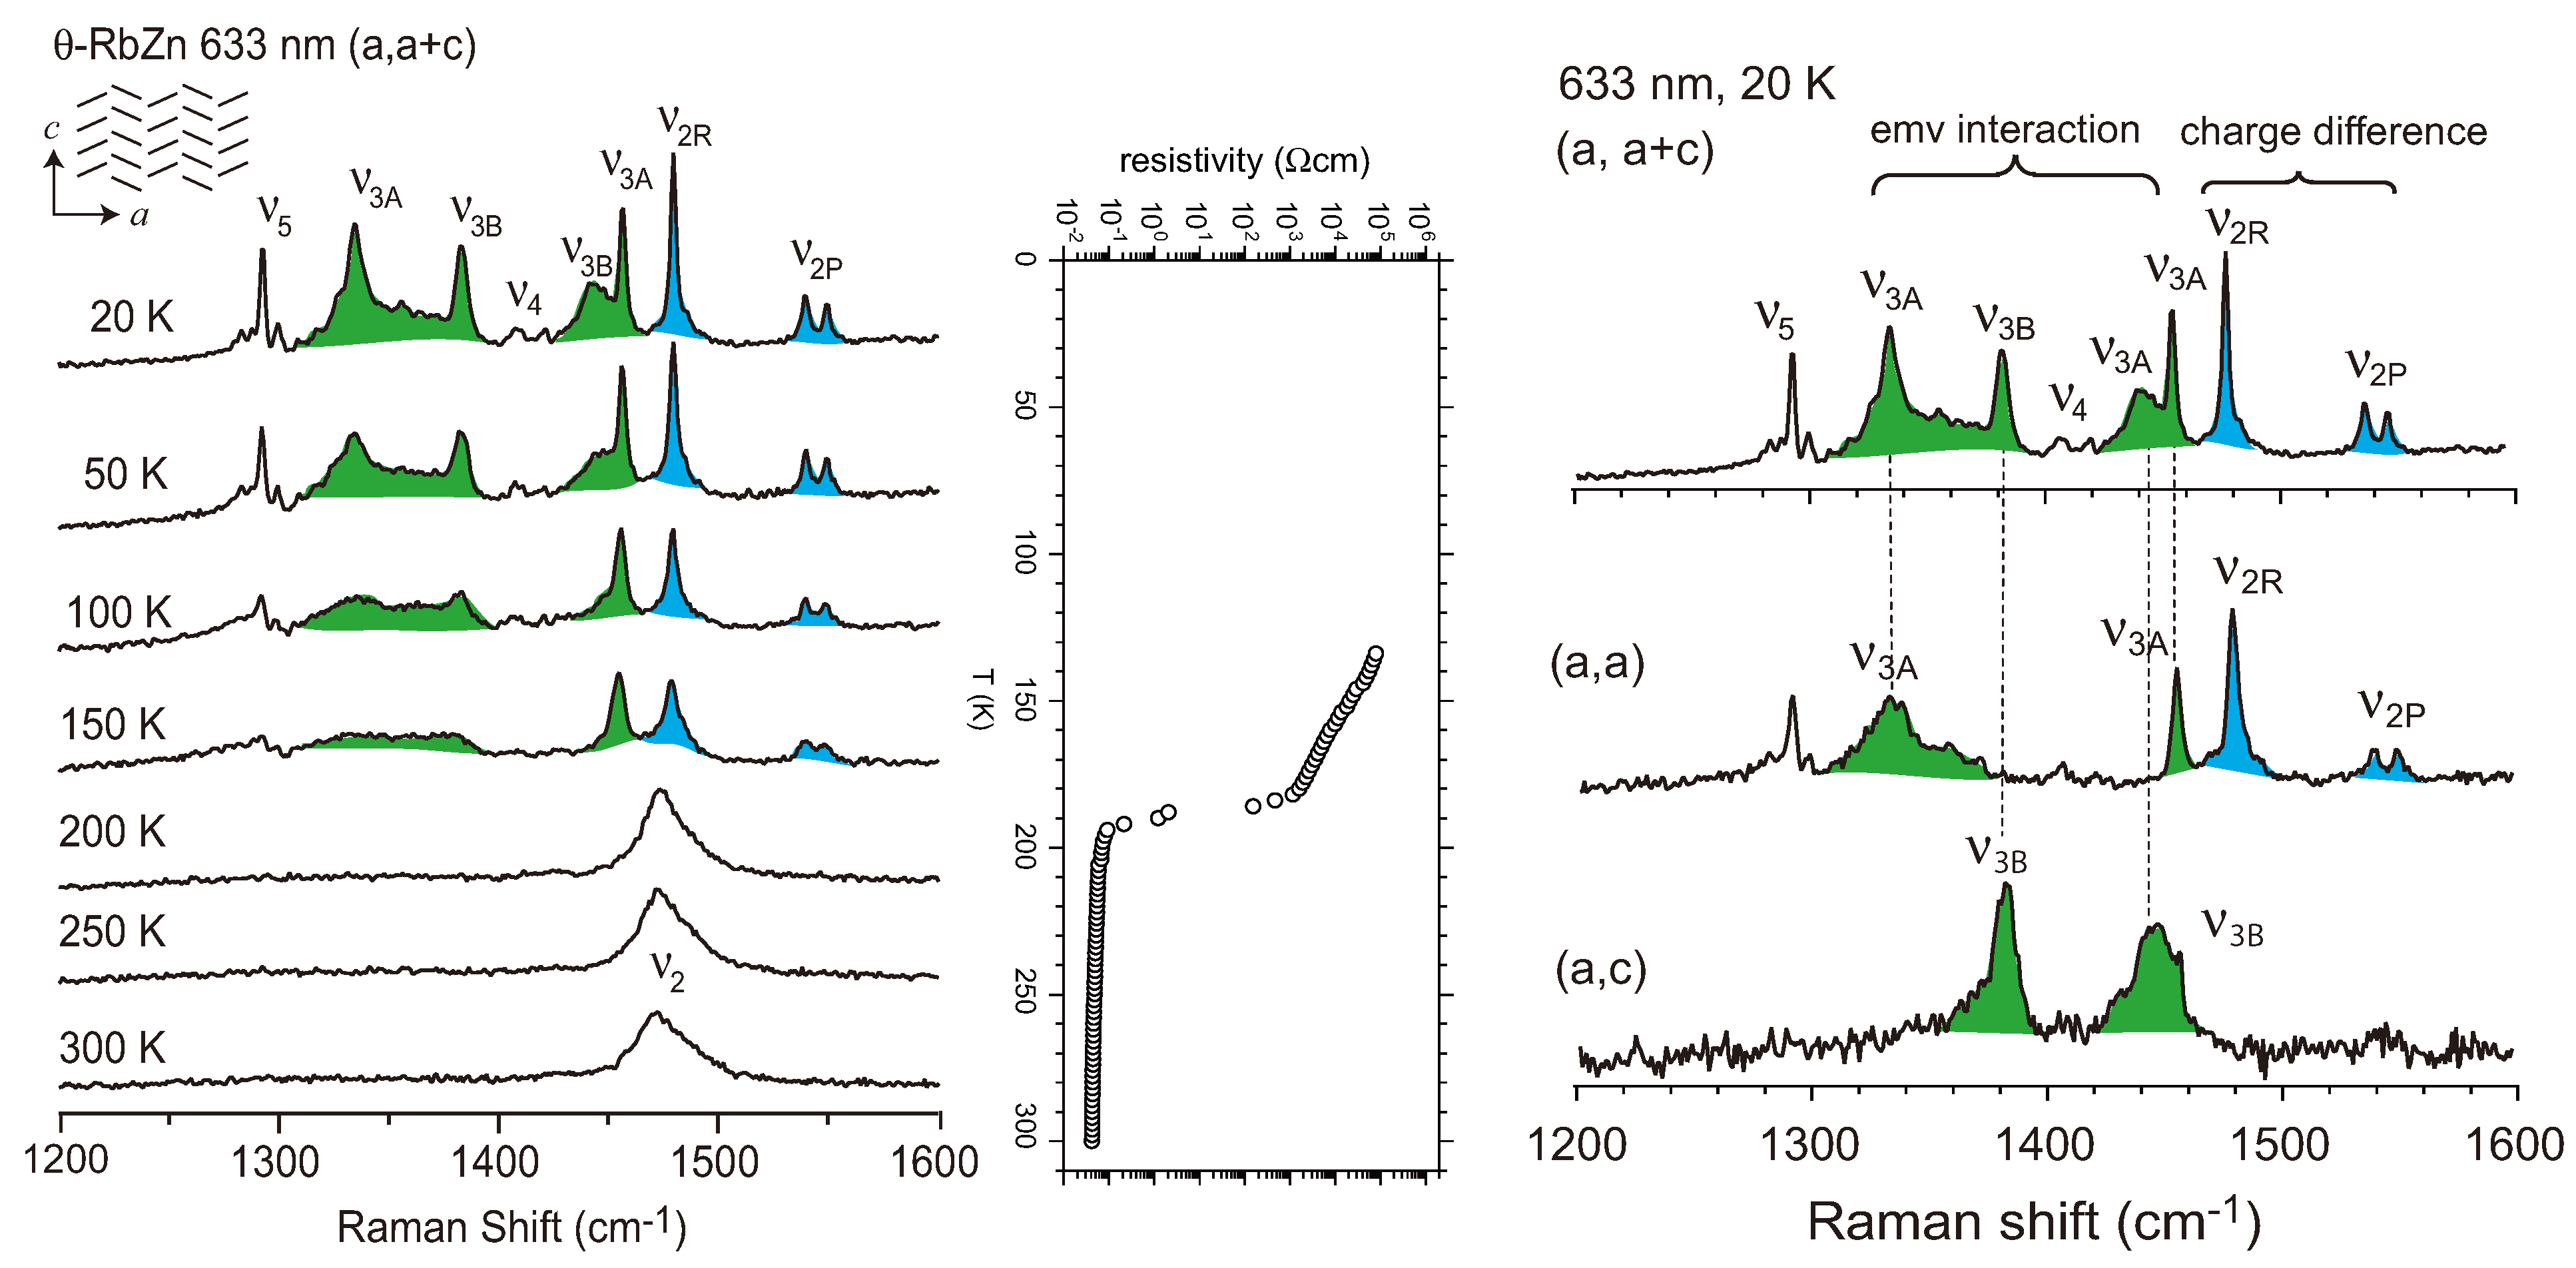
θ-RbZn undergoes the CO phase transition accompanying a structural change, and this compound has been very extensively studied. As shown in the left panel of Figure 10, Raman-active ν2 and ν3 modes show remarkable change in the CO transition. Yamamoto et al., analyzed the spectra comparing them with the spectra for the 13C-substituted compound, in which the carbon atoms in the central bridge C=C bond are substituted by 13C [72]. Since the ν2 mode is mainly the C=C stretching vibration in the five-member rings and the ν3 mode is mainly the C=C stretching vibration of the central bridge C=C bond, (See Figure 1) the isotope shift of the latter mode is expected to be significantly larger than the former. Utilizing this property, they assigned all the observed bands as shown in Figure 10. Actually, the isotope shifts of ν3A, ν3B, ν3B, and ν3A, are much larger than those of ν2P and ν2R, while ν4, and ν5 show no isotope shift [72]. It becomes clear from this assignment that the ν2 mode splits into two and the ν3 mode split into four [83]. As we explained in Section 2.3, the ν2 mode splits owing to the charge difference and the ν3 mode splits owing to the EMV mechanism. From the splitting of ν2, the site-charge difference or amplitude of CO is estimated to be Δρ~0.6. This large amplitude is approximately consistent with the site-charge ratio ρP:ρR = 1:6 estimated from 13C-NMR experiment [15]. From the splitting of ν3, it is concluded that the single conducting layer in the unit cell contains four molecules. This means that the unit cell is doubled below the CO phase transition.
As shown in the right panel of Figure 10, the four ν3 modes are classified into two groups by the polarization of the incident and scattered light. The two ν3A modes and two ν3B modes, respectively, have the character of species A and B in the C2 symmetry. This means that the four molecules in a conducting layer are classified into two groups, and in each group, two equivalent molecules are connected by a screw axis. These groups correspond to charge-rich and charge-poor molecules. Therefore, the charge-rich (charge-poor) molecules are arranged to form a horizontal stripe. This conclusion is consistent with the space group P212121 which was determined by the low-temperature x-ray diffraction measurements [84]. The factor group of P212121 is D2, which is reduced to C2 for a single conducting layer [85]. The horizontal stripe in the θ-RbZn salt is claimed by Tajima et al., through the analysis of the mid-infrared band in the optical conductivity [86]. Based on the mode of the horizontal stripe, Suzuki et al. [85] and Yamamoto et al. [57] conducted a numerical calculation of the splitting of ν2 and ν3. According to their analysis, the four vibronic modes are expressed by the following symmetry coordinates,

where QP1 and QP2 (QR1 and QR2) are the normal coordinates of charge-poor (charge-rich) site. The different character between ν2 and ν3 is ascribed to the difference in EMV coupling constants, which are small for ν2 and large for ν3 compared to transfer integrals. When the normal coordinate has ag symmetry in a free molecule, QA1 and QA2 have A symmetry and QB1 and QB2 have B symmetry. In the case of ν2 mode, a ≈ 1 and b ≈ 1, since the coupling constant is small, in other words, the interaction between charge-rich and charge-poor site is small. Therefore, both ν2P (νA1, νB1) and ν2R (νA2, νB2) are doubly degenerate. On the other hand, the four ν3 modes, ν3A (νA1, νA2) and ν3B (νB1, νB2) are split through the strong EMV interaction.
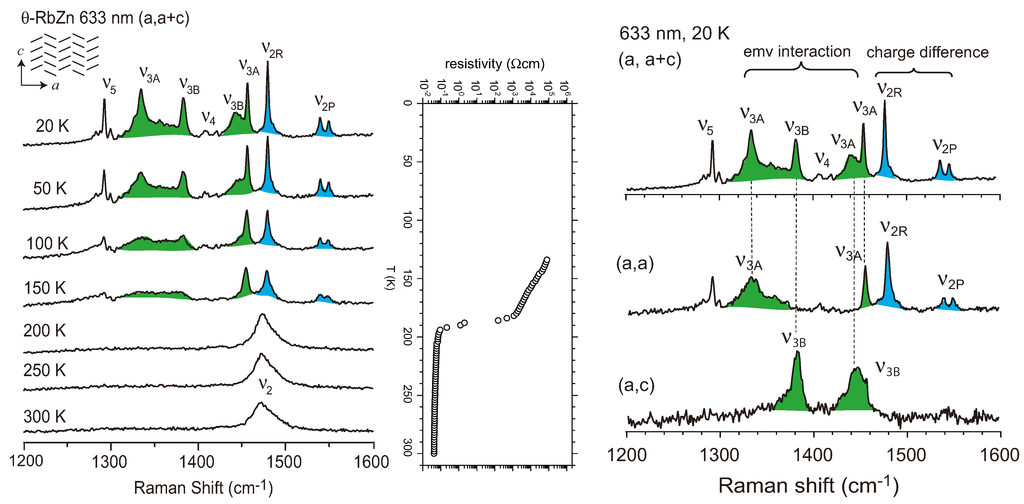
Figure 10.
(left panel) Temperature dependence of the Raman spectrum and the electrical resistivity of θ-(BEDT-TTF)2RbZn(SCN)4. The ν2 and ν3 modes are shown by blue and green colors. The inset shows the herringbone arrangement of BEDT-TTF with respect to the crystallographic axes; (right panel) Polarized Raman spectrum of θ-RbZn measured at 20 K. The four ν3 modes (green) in the top panel are classified into two groups by polarization. The Raman spectra are modified from Figures 14,15 of ref. [24].
Similar analyses were conducted for θo-TlZn [85], θm-TlZn [85], and θ-Cu2(CN)[N(CN)2]2 [57] salts. Since θo-TlZn and θ-Cu2(CN)[N(CN)2]2 are isostructural to θ-RbZn, the Raman spectra below TCO are exactly the same as that of θ-RbZn as shown in Figure 11. However, θm-TlZn belongs to monoclinic system with space group C2. Reflecting this structural difference, the Raman spectrum and electrical resistivity shown in Figure 12 are different from those of the orthorhombic salts [85]. The spectrum at 60 K is interpreted assuming pseudo inversion symmetry in the following way. The ν2 mode is split into the charge-rich and charge-poor sites, and two in-phase modes are observed among four ν3 modes. Based on this interpretation a diagonal stripe is claimed to be the CO pattern [85]. A diagonal stripe is theoretically predicted to be almost degenerate with a horizontal stripe. It is theoretically considered that the lattice distortion below TCO stabilizes the horizontal stripe in θ-RbZn [87]. If θm-TlZn takes a diagonal stripe, the low-temperature structure is expected to be distorted differently from θ-RbZn.

Figure 11.
Temperature dependence of the Raman spectrum of θo-(BEDT-TTF)2TlZn(SCN)4 along with the electrical resistivity. The inset shows the herringbone arrangement of BEDT-TTF with respect to the crystallographic axes. The spectral change is almost exactly the same as that of θ-(BEDT-TTF)2RbZn(SCN)4. The Raman spectrum is modified from Figure 4 of ref. [85].
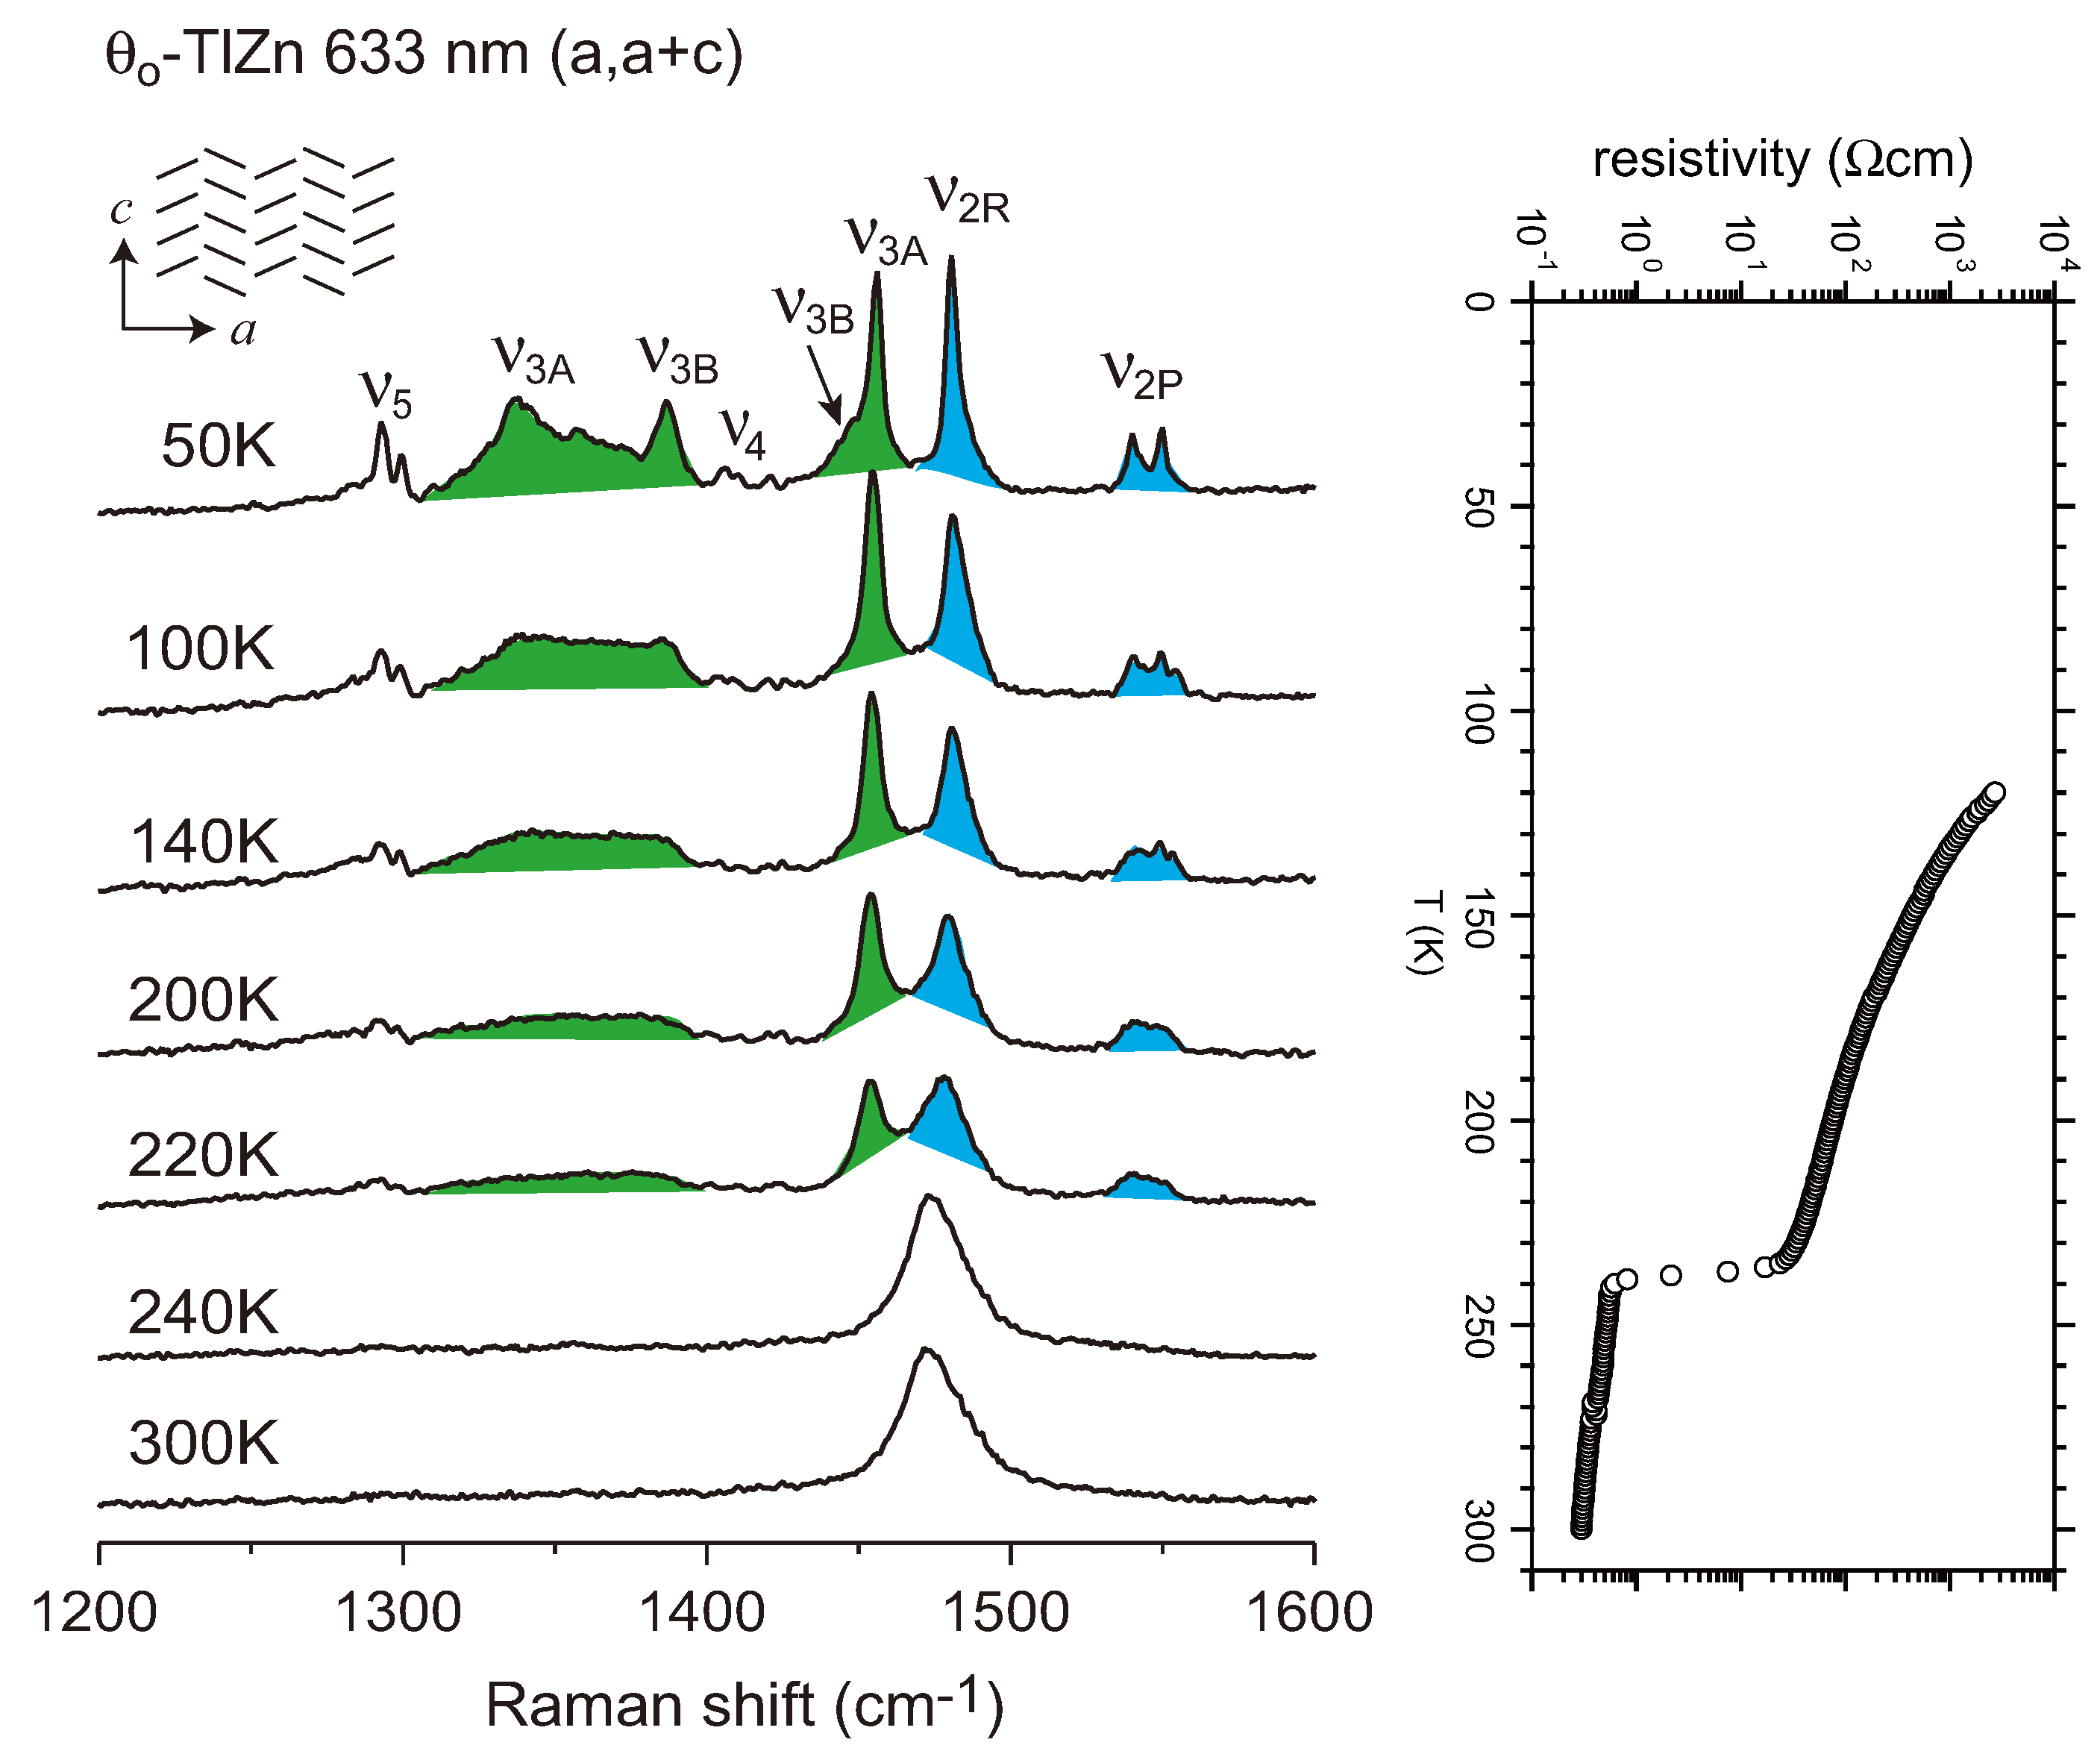
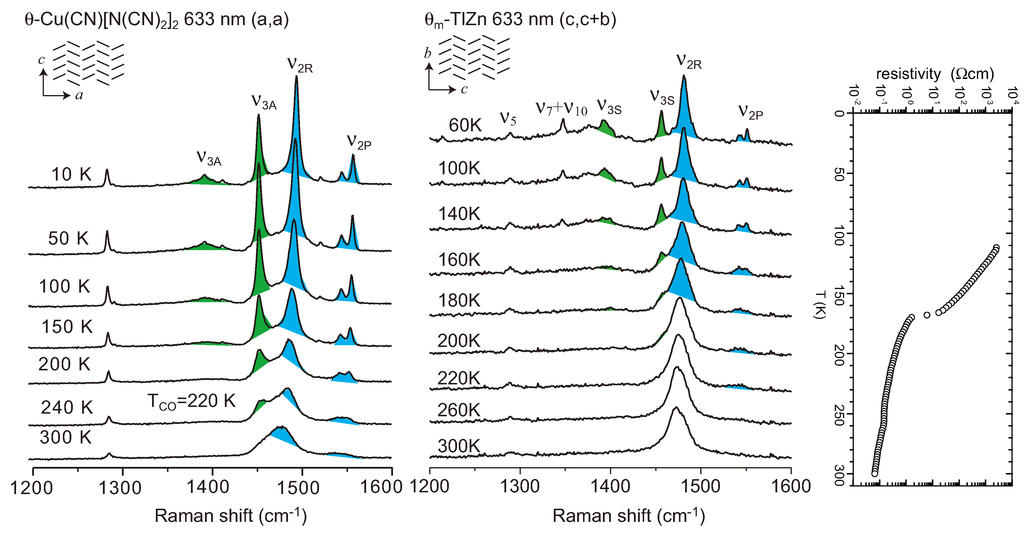
Figure 12.
Temperature dependence of the Raman spectrum of θ-(BEDT-TTF)2Cu(CN)[N(CN)2]2 (left) and θm-(BEDT-TTF)2TlZn(SCN)4 (middle) along with the electrical resistivity. The inset shows the herringbone arrangement of BEDT-TTF with respect to the crystallographic axes. The spectral change and resistivity are rather continuous. The left spectrum is modified from Figure 5 of ref. [57]. The right spectrum is modified from Figure 7 of ref. [85].

4.2. Metallic Phase of X = RbZn(SCN)4, TlZn(SCN)4, Cu2CN[N(CN)2]2
The high-temperature phase of θ-RbZ is regarded as an unconventional metal. There is a finite density of states at the Fermi level, though the temperature derivative of resistivity is negative. This unusual behavior in the high-temperature phase of θ-RbZn was reported in 13C-NMR experiment. The linewidth shows a broadening as the temperature approaches TCO [15]. Chiba analyzed this behavior, and reported the following results [88]. Above TCO, fluctuation of CO arises in space (the fractional charge is distributed from +0.3 to +0.7) and in time (extremely slow on the time scale of 13C-NMR). This short-range ordered CO is related to the x-ray diffuse scattering at q1 ≈ (1/4, k, 1/3), which corresponds to the short-range ordered 4a × 3c superlattice (short-range ordered threefold CO) [84]. When the sample is rapidly cooled, the phase transition is suppressed [89]. This rapid-cooling state is regarded as a frozen state of the metal, and it is in a glassy state [90]. In this frozen state, another diffuse scattering at q2 = (0, k, 1/2) is found in addition to weak q1 [91]. The diffuse scattering at q2 corresponds to the short-range ordered 2c superlattice (short-range ordered stripe CO). As this metastable state relaxes, the volume fraction of the 2c superlattice decreases, whereas the 4a × 3c superlattice becomes dominant [92]. This result means that threefold CO and stripe CO are competing in the glassy state.
The Raman spectrum shows a single broad band above TCO as shown in Figure 10. This broad band is assigned to the ν2 mode based on the isotope shift of the 13C-substituted compound [93]. If the high-temperature phase is a metal, the ν2 mode should be observed between the ν2P and ν2R bands. However, the broad ν2 band above TCO is located at the ν2R band, and thus ν2R is regarded as being hidden in the background. This result as well as the 13C-NMR data is direct evidence for the fluctuation of charge order in the metallic phase. The large splitting, Δν2 = ν2P − ν2R, means a large amplitude (Δρ~0.6) of fluctuation. If the correlation time is very long on the time scale of vibrational spectroscopy as claimed by NMR [88], the line shape is regarded as the case of τΔν2 > 1 (See Figure 4a, Δ = Δν2/2), that is, motional narrowing does not work. Therefore, Raman spectroscopy yields a snap shot of the slow fluctuation, and thus the broad linewidth reflects spatially inhomogeneous charge distribution. Accordingly, the line shape of the ν2 mode in the rapid-cooling state is almost exactly the same as that of the high-temperature spectrum [24,94]. The strong inhomogeneity probably comes from the short-range ordered 3a × 4c superlattice, which involves 48 sites in the unit cell. On the other hand, in the case of 13C-NMR, the line broadening due to the spatial inhomogenity is wiped out at higher temperature due to the motional narrowing, because the time scale of 13C-NMR is slower than that for vibrational spectroscopy. The line broadening comes back at low temperature due to the slower dynamics.
The optical conductivity of θ-RbZn has been reported by Wang et al., down to 50 cm−1 [95]. As shown in Figure 13f,g, the optical conductivity above 200 K consists of a broad peak at around 2000 cm−1 with no Drude response. Theoretically, the 3a × 4c superlattice is metallic with Fermi surfaces [76]. Nishimoto et al., calculated the optical conductivity of threefold lattice. They show that the Drude weight is significantly suppressed, and the spectral weight shifts to high-frequency excitation (See Figure 13a–e) [96]. The resultant small Drude response may be overdamped in the short-range ordered 3a × 4c superlattice, which results in the pseudogap like optical conductivity. The optical conductivity in the metallic phase exhibits strong vibronic band of ν3 at ~1300 cm−1 [72,95]. As the vibronic band is forbidden in the structure of the metallic phase, this vibronic band is activated due to the local lattice distortion by the fluctuation of threefold and stripe CO. In other words, the appearance of the vibronic band in θ-type BEDT-TTF salts indicates the fluctuation of CO in the metallic phase.
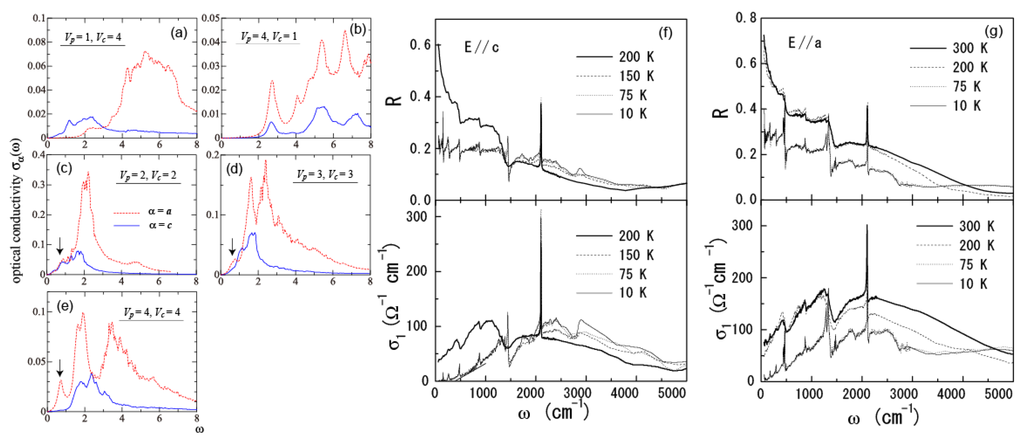
Figure 13.
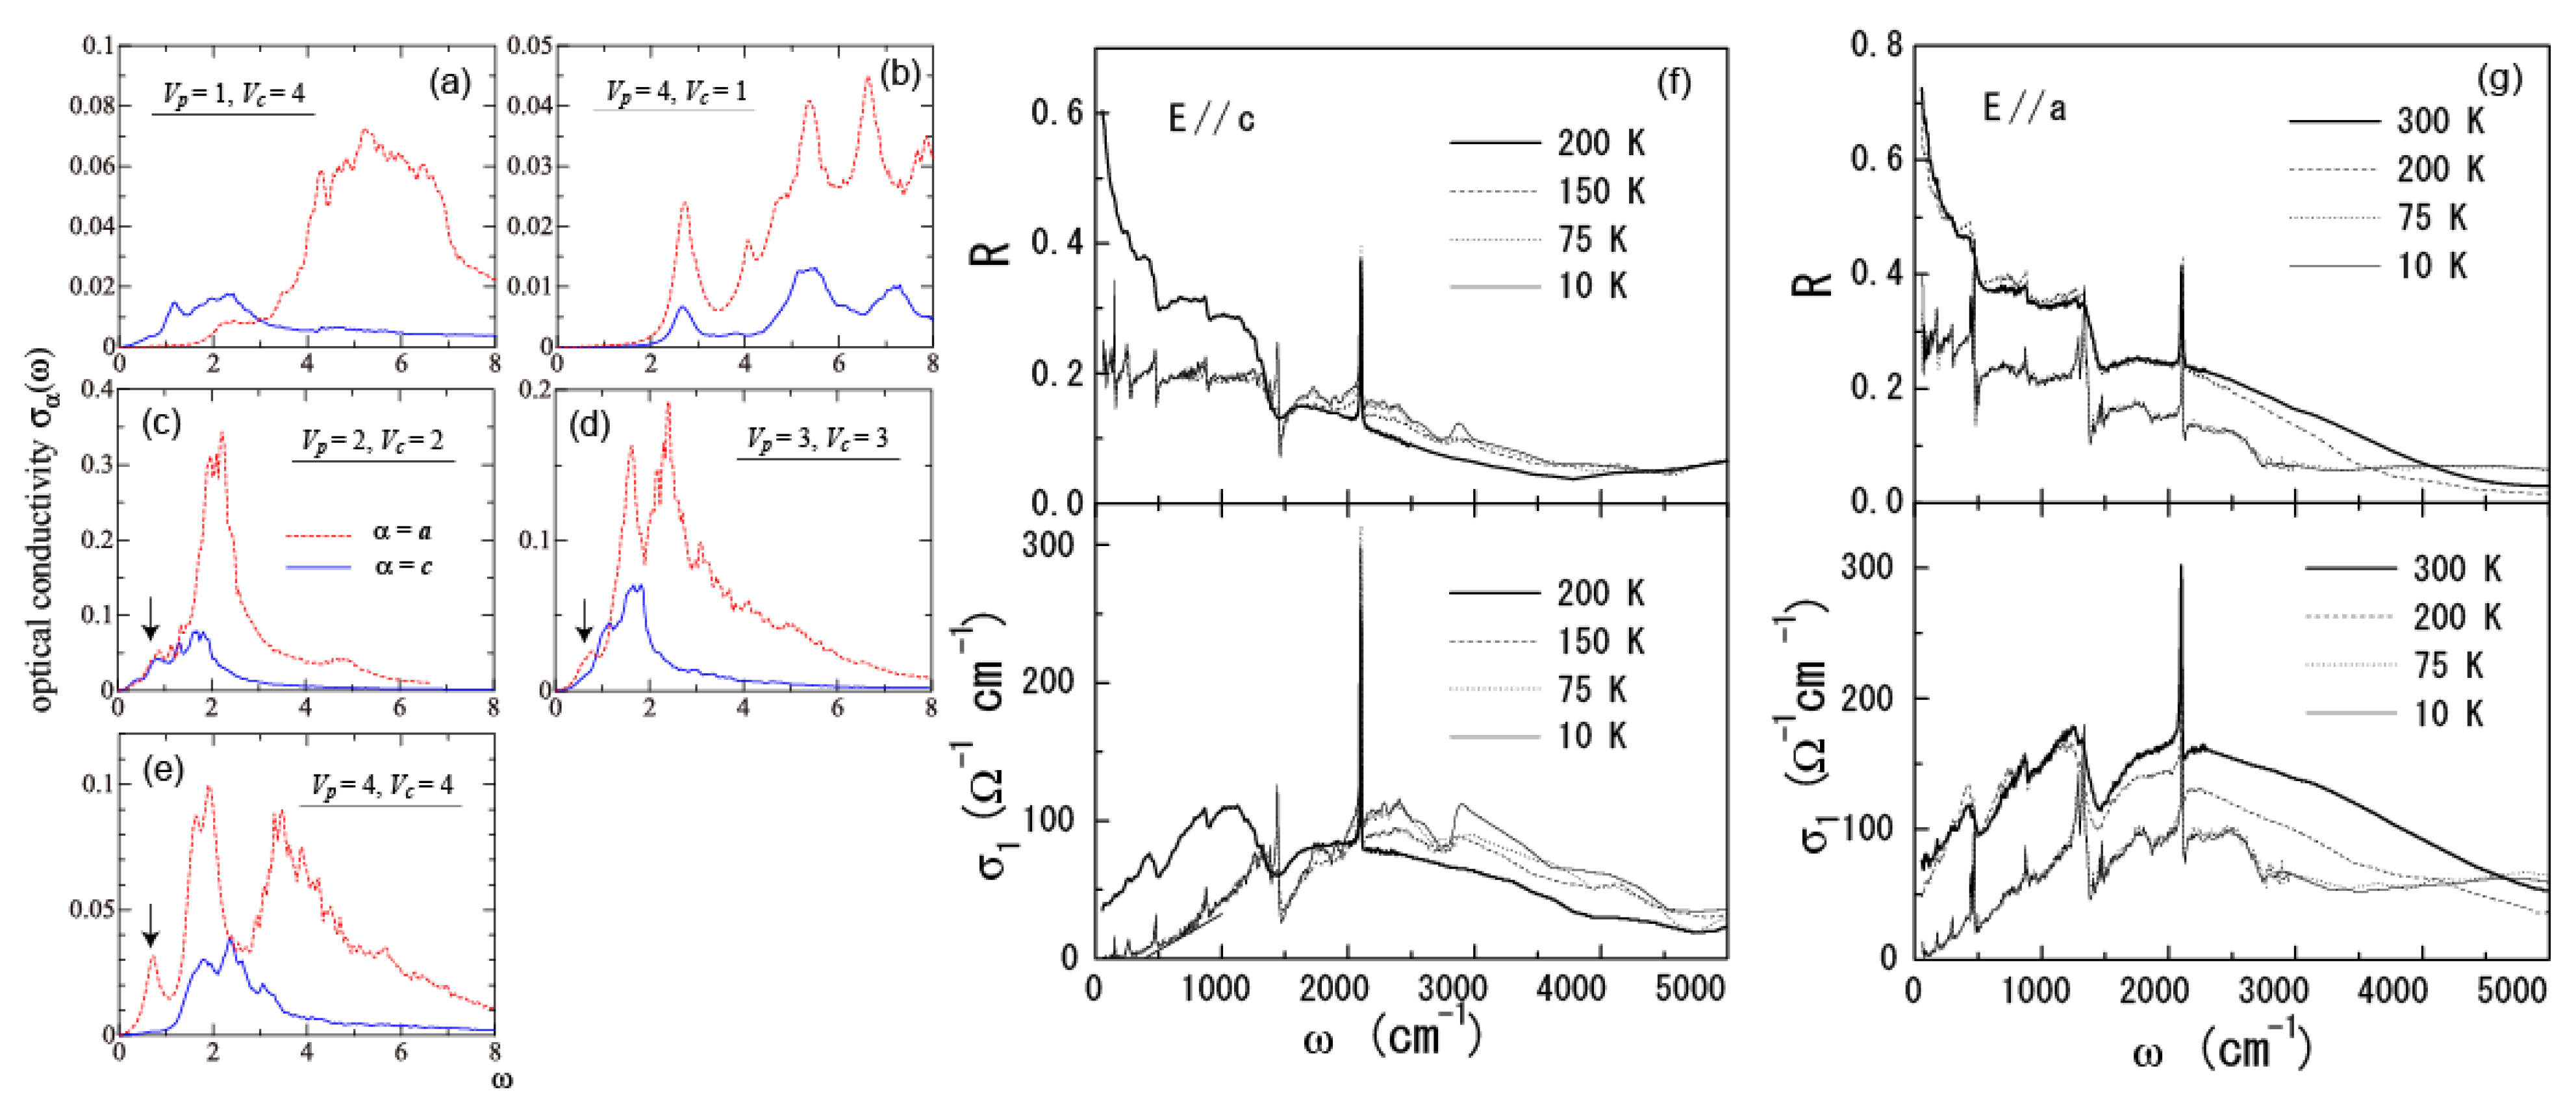
Reflectivity and optical conductivity of θ-(BEDT-TTF)2RbZn(SCN)4. and theoretical calculation of the optical conductivity of a triangular lattice. The arrows in (c), (d), and (e) denote the Drude peaks, which appear at finite energy because the open-end boundary condition is applied for a finite size cluster of La = 8 and Lc = 6 [96]. Figure 13a–e are taken from ref. [96], and Figure 13f,g are taken from ref. [95].
Figure 13.
Reflectivity and optical conductivity of θ-(BEDT-TTF)2RbZn(SCN)4. and theoretical calculation of the optical conductivity of a triangular lattice. The arrows in (c), (d), and (e) denote the Drude peaks, which appear at finite energy because the open-end boundary condition is applied for a finite size cluster of La = 8 and Lc = 6 [96]. Figure 13a–e are taken from ref. [96], and Figure 13f,g are taken from ref. [95].
Other compounds with φ > 111° also show similar τΔν2 » 1 spectra with a broad linewidth as shown in Figure 14b,c [97]. As the dihedral angle increases, the ν2P mode, the counterpart of ν2R, appears more clearly. In addition, ν3 mode in the low-frequency region of the broad ν2R is more enhanced above TCO (See Figure 14b). In particular, in θ-Cu2(CN)[N(CN)2]2, another broad ν3 mode is found at ~1390 cm−1 (not shown) above TCO, when a 780 nm excitation laser is used [57]. The observation of the precursor band ν3 means that short-range ordered horizontal and diagonal stripes grow more extensively toward TCO. Actually, x-ray diffuse scattering is observed at q2 = 1/2c* above TCO = 220 K in θ-Cu2(CN)[N(CN)2]2 [57]. Although no diffuse scattering has been found in θm-TlZn, the vibronic band of ν3 is clearly found in the optical conductivity as shown in Figure 15a. Differently from θ-RbZn, the fluctuation of the threefold lattice is absent, whereas the short-range 2c superlattice is dominant. Watanabe explained this trend theoretically as the result of tc/tp [78], which decreases from positive value (~0.5) to a negative value (−0.5) according to the increase in the dihedral angle in the phase diagram of the θ-type BEDT-TTF salts [98,99]. In these two compounds, the frustration with threefold CO seems to be reduced more than in θ-RbZn and θo-TlZn. This may be related to the continuous transformation of the Raman and optical conductivity spectra and the resistivity of θm-TlZn and θ-Cu2(CN)[N(CN)2]2 in contrast to θ-RbZn and θo-TlZn (See Figure 12, Figure 15).
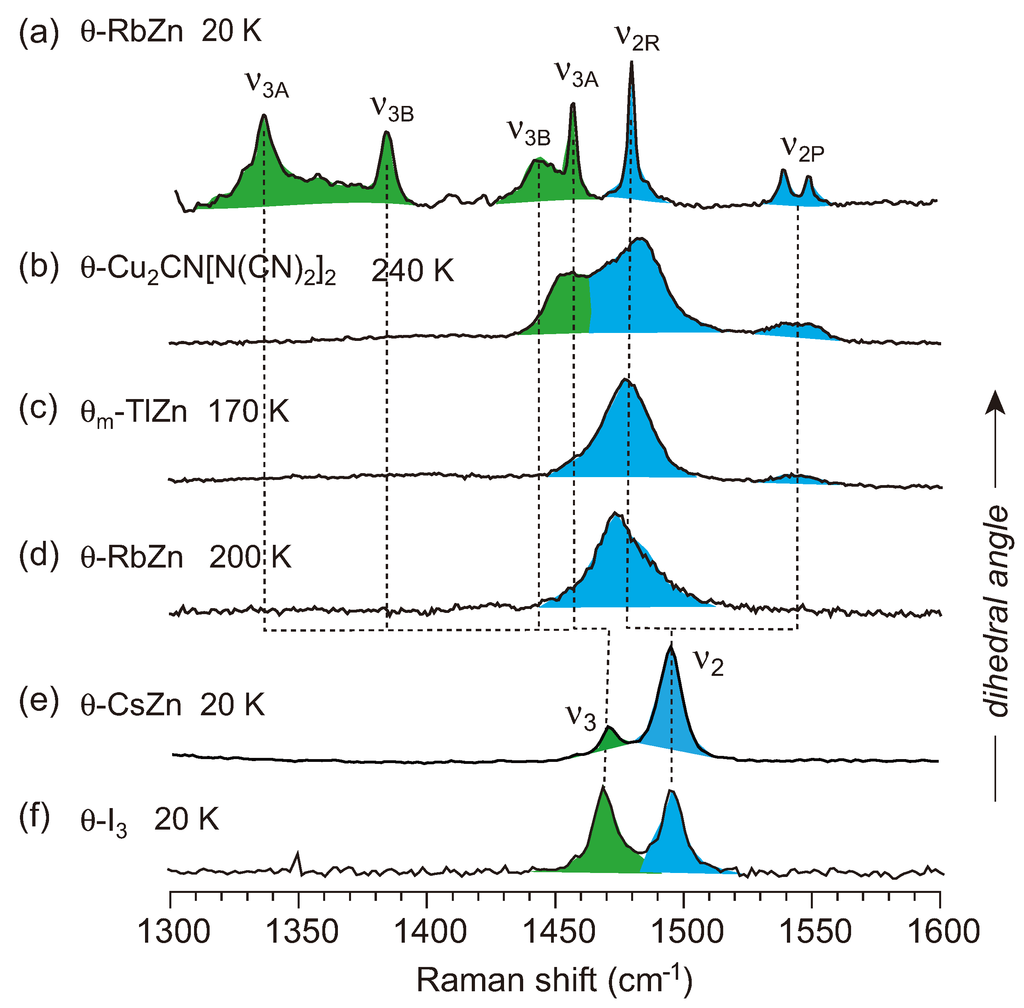
Figure 14.
Comparison of the Raman spectra of (a) the CO state of θ-(BEDT-TTF)2RbZn(SCN)4; (b) high-temperature phase of θ-(BEDT-TTF)2Cu2CN[N(CN)2]2; and the metallic phase of (c) θm-(BEDT-TTF)2TlZn(SCN)4; (d) θ-(BEDT-TTF)2RbZn(SCN)4; (e) θ-(BEDT-TTF)2CsZn(SCN)4; and (f) θ-(BEDT-TTF)2I3. Note that the ν2 mode is split in (a), (b), (c), and (d), while ν2 is merged in (e) and (f). The assignments in θ-(BEDT-TTF)2MZn(SCN)4 (M = Rb, Cs) in the metallic phase are conducted with the aid of 13C-substituted compounds [94].

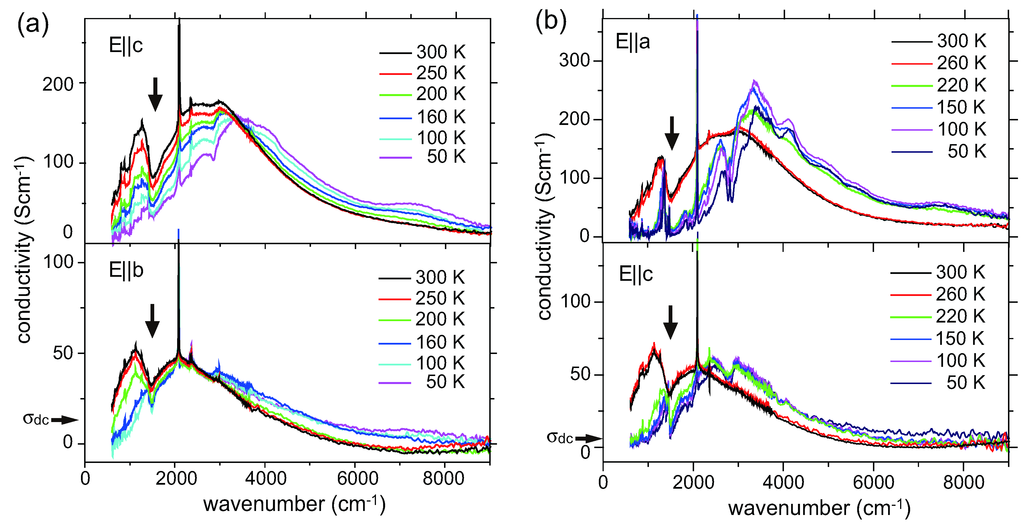
Figure 15.
Optical conductivity of (a) θm-(BEDT-TTF)2TlZn(SCN)4 and (b) θo-(BEDT-TTF)2TlZn(SCN)4. Note that the spectral variation is discontinuous in θo-(BEDT-TTF)2TlZn(SCN)4, whereas it is continuous in θm-(BEDT-TTF)2TlZn(SCN)4. The arrow denotes the vibronic band of ν3.
Figure 15.
Optical conductivity of (a) θm-(BEDT-TTF)2TlZn(SCN)4 and (b) θo-(BEDT-TTF)2TlZn(SCN)4. Note that the spectral variation is discontinuous in θo-(BEDT-TTF)2TlZn(SCN)4, whereas it is continuous in θm-(BEDT-TTF)2TlZn(SCN)4. The arrow denotes the vibronic band of ν3.

4.3. θ-(BEDT-TTF)2X (X = CsZn(SCN)4, I3)
The θ-CsZn salt is located at the boundary between the metallic θ-I3 salt and the large φ salts that undergo CO transition. The x-ray diffuse rods are found at q1 = (2/3, k, 1/3) and q2 = (0, k, 1/2) below 120 K [100,101]. This finding implies that a short-range ordered 3a × 3c superlattice (fluctuation of threefold CO) coexists with the 2c superlattice (fluctuation of stripe CO). The 2c lattice is regarded as the fluctuation of the horizontal stripe which is found in θ-RbZn below TCO. On lowering the temperature, the intensity of q2 increases as the resistivity increases from about 140 K. Although the correlation length of the 2c lattice grows up on lowering the temperature, it does not attain a long-range order. Interestingly, an external current suppresses the q2 domain at 12 K keeping the q1 domain intact [100]. This finding is related to the nonlinear conduction [102] and the thyristor effect [103]. The 13C-NMR study argued the following points. (1) Remarkable charge disproportionation with extremely slow fluctuations is observed in the temperature range of 294 K–140 K; (2) The short-range CO with the amplitude of Δρ~0.4–0.6 becomes almost static in the region of 140 K–50 K; (3) The amplitude of the CO fluctuation becomes very much reduced below 30 K [104]. The dielectric permittivity study proposes a glass-like state at low-temperature which consists of conglomerate domains of short-range ordered threefold and stripe CO [105]. Several theoretical studies have been conducted to explain the coexistent and/or frustrating CO fluctuation using a triangular lattice model [76,78,96,106]. The stripes and non-stripe threefold CO are competing near an isotropic triangular lattice (Vc~Vp), forming a charge-ordered metal [78,96]. The origin of the threefold CO is the nesting of the Fermi surface, while the origin of the stripe CO is the off-site Coulomb interaction [106], or both instabilities come from the Fermi surface nesting [76]. In all cases, there is a wide metallic region due to the frustration between the stripe and threefold CO fluctuation near the isotropic triangular lattice.
Figure 16 shows the Raman spectra of θ-CsZn and θ-I3 along with the electrical resistivity of θ-CsZn [94]. θ-(ET)2I3 is metallic down to low temperature and undergoes a superconducting transition at 3.6 K [107,108]. In both compounds, ν2 appears as a single peak near the frequency of ρ = 0.5 [46] over the whole temperature range. Different from θ-I3, a very broad vibronic mode is observed at 1200–1300 cm−1 in θ-CsZn as shown in Figure 16. The Raman cross section of this vibronic mode is enhanced when charge disproportionation is enlarged as shown in Figure 2b (Section 2). This observation suggests that the correlation length of the CO fluctuation grows upon decreasing the temperature, since the intensity of the vibronic band increases. From the polarization dependence, ν3A and ν3B are respectively classified into A and B species in the factor group C2 [94]. This result means that the short-range CO domain has a screw axis symmetry. Therefore, the 2c superlattice with the horizontal stripe seems to contribute to this vibronic mode [109]. This observation is consistent with x-ray diffuse scattering that shows the evolution of the short-range ordered 2c superlattice. Although threefold CO fluctuation is observed in both θ-CsZn and θ-RbZn, the features of ν2 of θ-CsZn are very different from that of θ-RbZn. The ν2 mode of θ-CsZn appears as a slightly broad single band at the frequency of ρ~0.5, whereas the ν2 mode of θ-RbZn appears as a much broader band at the frequency of the charge-rich site. The infrared-active mode ν27 also appears in the same way as ν2 [94]. This result means that the product of the correlation time and splitting width is smaller than unity, τΔν2 < 1, in θ-CsZn (See Figure 4a, Δ = Δν2/2), whereas τΔν2 > 1 in θ-RbZn as described in Section 4.2. Therefore, the correlation time and/or CO amplitude of θ-CsZn is much smaller than that of θ-RbZn. If the fluctuation is almost static on the time scale of vibrational spectroscopy as suggested by NMR [104], Δν2 is dominated by spatial inhomogeneity. The linewidth is about 10 cm−1 below 100 K. If we assume a static Gaussian distribution for the site charge, the amplitude is roughly estimated as Δρ < 0.08. This small amplitude is inconsistent with the argument of 13C-NMR [104]. However, the small amplitude is consistent with the much weaker intensity (diffuse/Bragg ~ 10−5) of the diffuse scattering in θ-CsZn [100] compared with that (diffuse/Bragg ~ 10−3) in θ-RbZn [91]. The small amplitude seems to be attributed mainly to the strong frustration between the threefold and stripe fluctuation. Seo demonstrated that in such a case, both peaks in the charge correlation function C(q,ω) corresponding to stripe and threefold fluctuation have higher excitation energy compared to the non-frustrate system [41]. This result implies that the amplitude of CO cannot grow when they are competing.
The optical conductivity of θ-CsZn is shown in Figure 17 [94]. Compared with the optical conductivity of θ-RbZn [95], the spectral weight of θ-CsZn is located in the low-frequency region, which is similar to the optical conductivity of β″-(ET)(TCNQ) shown in Figure 8. Since the conductivity should approach the dc conductivity shown in Figure 17, the peak which corresponds to σIQ is expected below 600 cm−1, and the Drude response is likely to be missing. This speculation is consistent with the optical conductivity reported by Wang [110], wherein a strong peak accompanied by several vibronic bands appears below 600 cm−1 without Drude response. The V/t dependence of the optical conductivity similar to β″-(ET)(TCNQ) has been theoretically calculated for a triangular lattice [96]. The dips at 1300 cm−1 and 877 cm−1 are the vibronic modes respectively corresponding to ν3 and ν7, which arise from the EMV interaction. These vibronic modes are forbidden in the average structure of θ-CsZn. The appearance of these vibronic modes also strongly indicates structural fluctuations, which probably corresponds to the 3a × 3c and 2c short-range superlattices.
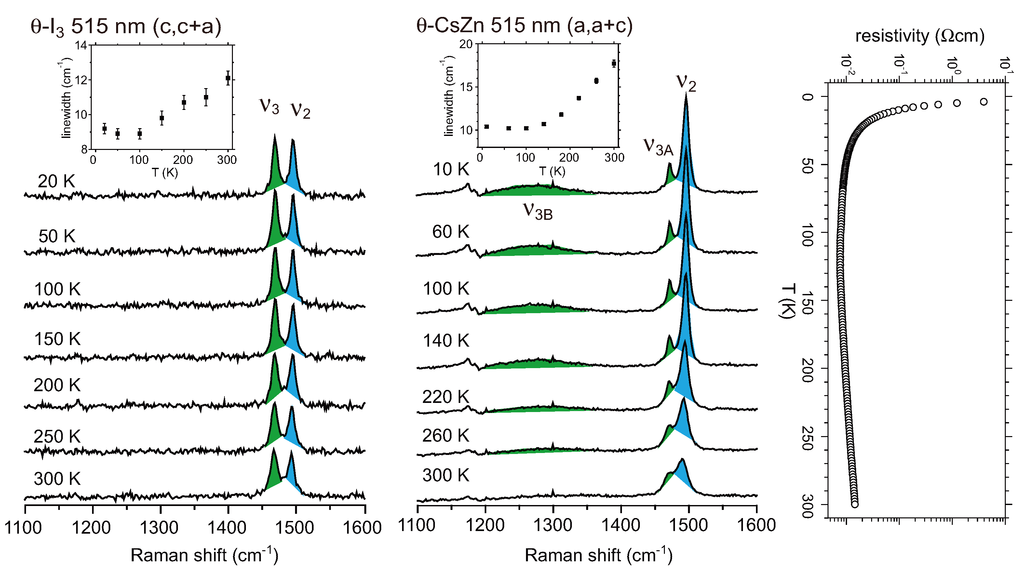
Figure 16.
Temperature dependence of the Raman spectra of θ-(BEDT-TTF)2I3 and θ-(BEDT-TTF)2CsZn(SCN)4 along with the electrical resistivity of θ-(BEDT-TTF)2CsZn(SCN)4. The inset shows the temperature dependence of the linewidth of the ν2 mode. The Raman spectra of θ-(BEDT-TTF)2I3 and θ-(BEDT-TTF)2CsZn(SCN)4 are modified from Figure 2c of ref. [111] and Figure 3 of ref. [94], respectively.

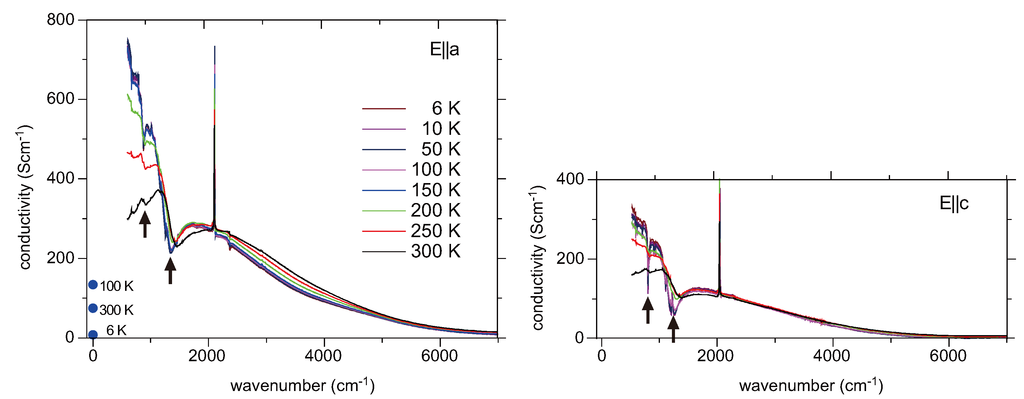
Figure 17.
Optical conductivity of θ-(BEDT-TTF)2CsZn(SCN)4. Blue colored circles in the bottom panel show the dc conductivity values. The arrows show the vibronic modes appearing as dips. The color of the E||c spectrum denotes the same temperature as that of the E||a spectrum.
Figure 17.
Optical conductivity of θ-(BEDT-TTF)2CsZn(SCN)4. Blue colored circles in the bottom panel show the dc conductivity values. The arrows show the vibronic modes appearing as dips. The color of the E||c spectrum denotes the same temperature as that of the E||a spectrum.
The dihedral angle of θ-I3 is the largest among the θ-type BEDT-TTF salts, and the fluctuation of CO is suppressed in θ-I3 [78]. If we estimate the amplitude in the same way as for θ-CsZn, the amplitude is estimated as Δρ < 0.07. Actually the ν2 mode appears as a single band and the vibronic band is not found in the Raman spectrum of θ-I3 as shown in the left panel of Figure 16. Takenaka et al., reported the optical conductivity in the frequency range of 80–48000 cm−1 [112]. As the bandwidth is widest among the θ-type BEDT-TTF salts, the spectral weight of the optical conductivity in θ-I3 is located in the frequency region lower than that of θ-CsZn. As is the case of β″-(BEDT-TTF)(TCNQ), the collapse of the coherent quasiparticle state accompanying the high-frequency shift of the spectral weight is observed upon increasing the temperature. The sublattice of BEDT-TTF in θ-I3 is described by the orthorhombic cell which is the same as the average unit cell of θ-CsZn [113]. However, a weak vibronic mode is found at ~1410 cm−1 as a dip [112,114]. This vibronic band might suggest structural fluctuation perhaps associated with charge order.
5. α-(BEDT-TTF)2I3 and Related Compounds
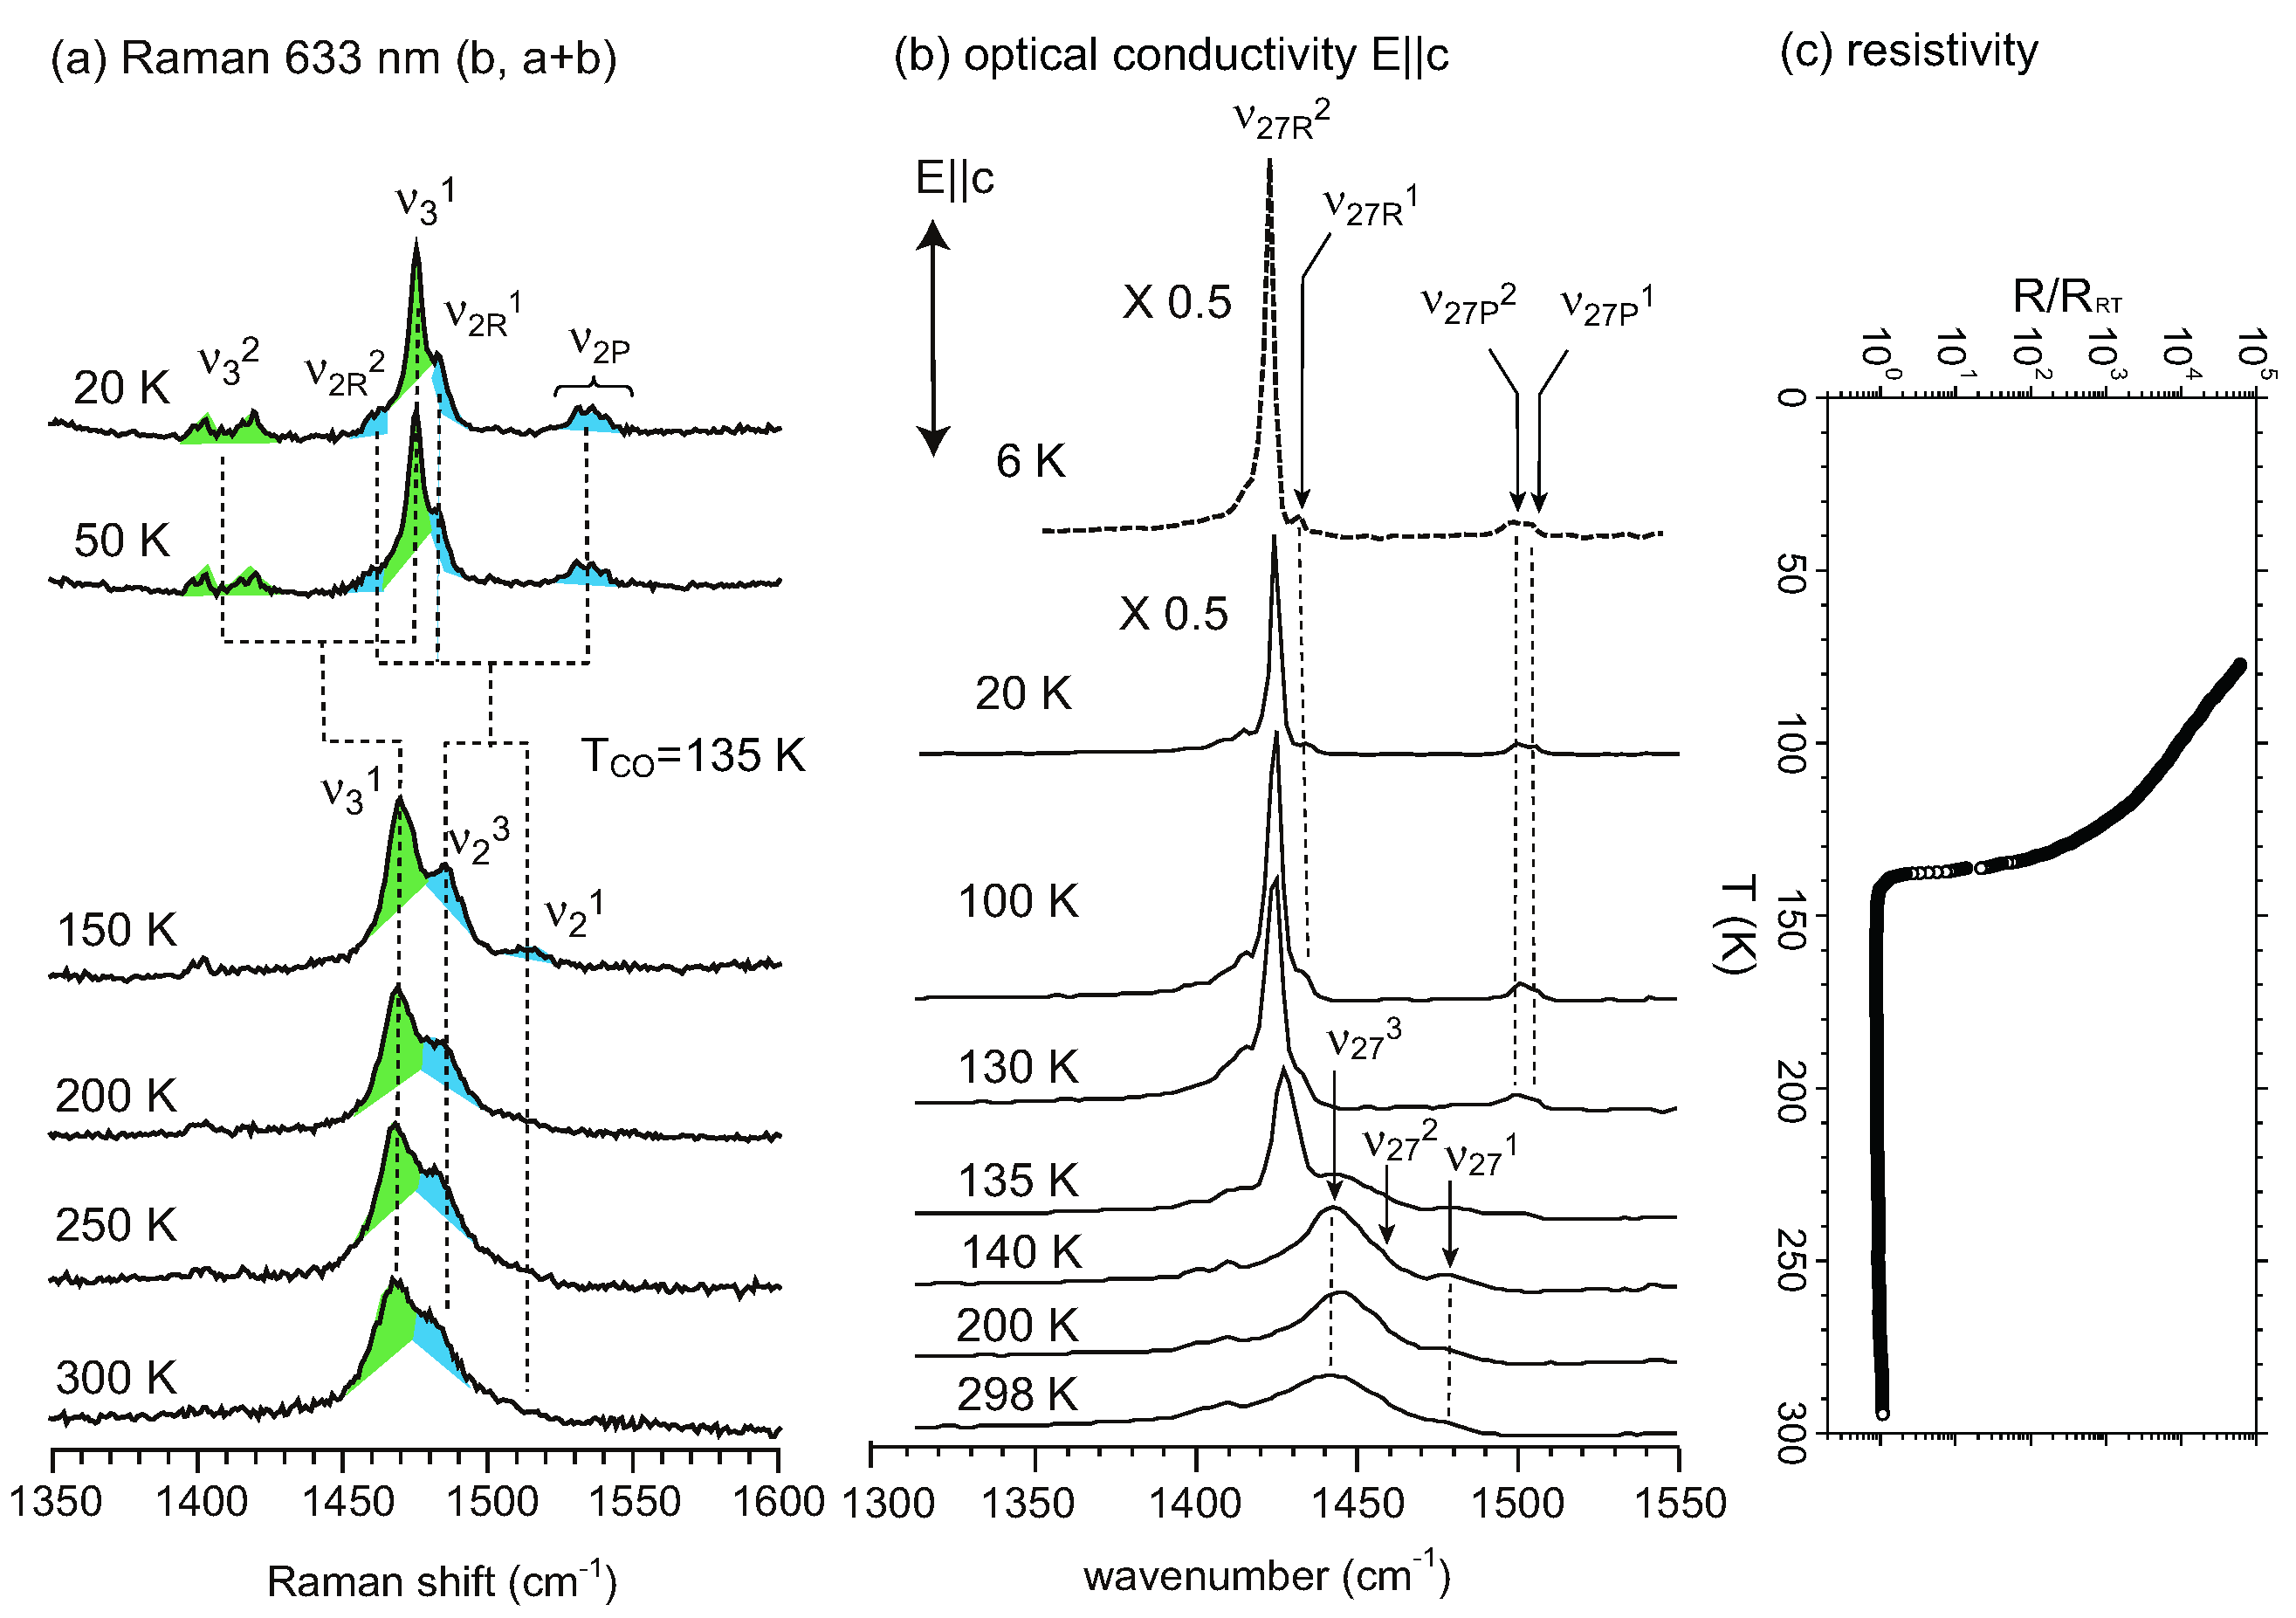
Among the various known organic conductors [115,116,117,118], α-(BEDT-TTF)2I3 (abbreviated as α-I3) shows rich electronic properties such as charge ordering [119], superconductivity [120], zero-gap state (ZGS) [121,122], photo-induced phase transition [123], and nonlinear optical response [124].The crystal structure of α-I3 consists of alternating layers of the anion and donor [125]. The donor layer has a herringbone arrangement of BEDT-TTF molecules. The unit cell accommodates two holes, which are distributed in four BEDT-TTFs named A, A′, B, and C. At room temperature, A and A′ are connected by inversion symmetry, and B and C are located on the inversion center. α-I3 exhibits a first-order metal-insulator (MI) phase transition at TMI = 135 K [125]. Kino and Fukuyama examined the effect of on-site Coulomb interaction within the Hartree-Fock approximation, and they predicted that a charge localization with a vertical stripe is the cause of the MI transition [13,126]. Before the theoretical prediction, Moldenhauer et al., reported that the localization of electrons occurs at the B and C sites whereas the electrons at the A and A′ sites are delocalized below TMI [12]. The 13C-NMR study suggested the existence of two differently charged molecules below TMI [119,127]. Seo introduced intersite Coulomb interaction V, and he proposed that the localized charge would form a horizontal stripe [16]. These two models can be distinguished by the symmetry consideration, since the vertical stripe is compatible with the space group , whereas the horizontal stripe requires P1. Raman spectroscopy was used to examine the selection rule of the charge-sensitive mode and the symmetry reduction from to P1 below TMI was claimed [111]. An x-ray diffraction study supported P1, and showed a horizontal stripe structure [128]. Decisive evidence for the breaking of inversion symmetry was given by the experiment of second harmonic generation (SHG) [124]. Recently, Alemany et al., pointed out that the hydrogen bond between the ethylene groups of BEDT-TTF and I3− plays an essential role in the CO transition of α-I3 [129].
, whereas the horizontal stripe requires P1. Raman spectroscopy was used to examine the selection rule of the charge-sensitive mode and the symmetry reduction from to P1 below TMI was claimed [111]. An x-ray diffraction study supported P1, and showed a horizontal stripe structure [128]. Decisive evidence for the breaking of inversion symmetry was given by the experiment of second harmonic generation (SHG) [124]. Recently, Alemany et al., pointed out that the hydrogen bond between the ethylene groups of BEDT-TTF and I3− plays an essential role in the CO transition of α-I3 [129].In the MI transition of α-I3, Raman [111] and infrared [130] spectra showed drastic changes as seen in Figure 18. The assignment of these bands along with vibronic bands was conducted with the aid of 13C and deuterium substituted compounds. The CO and metallic phases will be discussed respectively in Section 5.1 and Section 5.2 along with the detailed assignment. Unlike θ-type BEDT-TTF salts, it has been reported for α-I3 that the site-charge distribution is non-uniform in the metallic phase [13,111,128], although the average hole number per site is 0.5 in the case of uniform distribution. The non-uniform site charge distribution of metallic α-I3 will be discussed along with the isostructural metallic α-(BEDT-TTF)2NH4(SCN)4 in Section 5.3. One of the most attractive properties of α-I3 is the ferroelectric properties in the CO state. In this context, another herringbone type compound α′-IBr2 will discussed in Section 5.4.

Figure 18.
(a) Temperature dependence of the Raman spectrum of α-(BEDT-TTF)2I3. The ν2 and ν3 modes are shown as blue and green, respectively. A drastic spectral change is observed below 120 K. The difference in the transition temperature comes from the laser heating effect; (b) Temperature dependence of the infrared spectrum of α-(BEDT-TTF)2I3, which was obtained by the Kramer-Kronig transformation of the reflectivity polarized along the c-axis (perpendicular to the conducting plane). The 6 K spectrum drawn by the dashed line is the optical conductivity of the deuterium substituted compound, α-(d8-BEDT-TTF)2I3; (c) Electrical resistivity normalized by room temperature value. The optical conductivity is taken from Figure 1 of ref. [130].
5.1. Charge-Ordered Phase of α-(BEDT-TTF)2I3
Figure 19 shows infrared and Raman spectra of α-I3, α-(d8-BEDT-TTF)2I3, and α-(13C-BEDT-TTF)2I3, all in the CO state. In this spectral region, BEDT-TTF has three C=C stretching modes, ν2, ν3, and ν27 which are shown in Figure 1, and bending modes of ethylene groups. The assignment of the Raman-active modes is the same as in ref. [111], except for the Raman bands at 1476 cm−1 and 1462 cm−1, which were assigned to ν31 and ν2R2, respectively. These are interchanged in Table 1, as the isotope shift of ν2 and ν3 became closer to each other within each mode. Strictly speaking, however, this kind of assignment makes no sense, as these two modes are strongly mixed with each other. The vibronic modes in the conducting plane are assigned with the aid of isotope shift and comparison with the Raman spectrum. The very broad band, wherein the peak was different between the E||a and E||b spectra, was assigned to ν34, since the frequency of the vibronic mode depended upon the electronic excitation spectrum. The vibrational ν27 mode is observable in the optical conductivity spectrum polarized along the c-axis. Some bending modes of ethylene group are overlapped in the region of the ν27R modes (See Table 1 and Figure 19a). Therefore, the spectrum of α-(d8-BEDT-TTF)2I3 is necessary for the assignment of ν27R. The large dip at ~2690 cm−1 appearing in the high-frequency region of the optical conductivity (not shown) is interpreted by Yamamoto as the Fano anti-resonance due to the vibronic overtone of ν3 [131]. Recently, Yamamoto et al., have discussed the relationship between the vibronic overtone and optical nonlinearity and ferroelectricity [132].
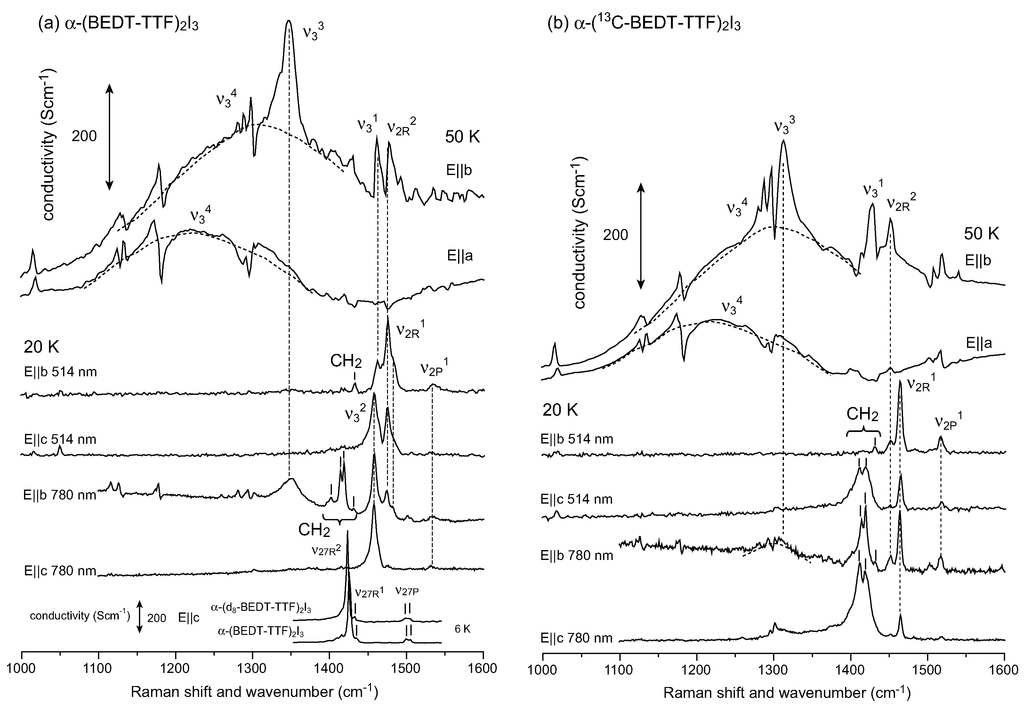
Figure 19.
(a) Optical conductivity polarized along the b and a directions, Raman spectra of α-(BEDT-TTF)2I3, and optical conductivity polarized along the c direction; (b) Optical conductivity polarized along the b and a directions and Raman spectra of α-(13C-BEDT-TTF)2I3.
Figure 19.
(a) Optical conductivity polarized along the b and a directions, Raman spectra of α-(BEDT-TTF)2I3, and optical conductivity polarized along the c direction; (b) Optical conductivity polarized along the b and a directions and Raman spectra of α-(13C-BEDT-TTF)2I3.


Table 1.
Assignment of the infrared and Raman modes of α-(BEDT-TTF)2I3. The Δν values show the isotope shift, Δνj = νj12− νj13.
| Raman (20 K) | Infrared (50 K) | |||||
|---|---|---|---|---|---|---|
| α-I3 | α-(13C)2I3 | Δν | α-I3 | α-(13C)2I3 | Δν | |
| dip (2ν33) | - | - | - | 2688 | 2628 | 60 |
| ν2P1 | 1536 | 1517 | 19 | (1518?) | - | |
| ν2P2 | - | - | - | - | (1508?) | - |
| ν2R1 | 1483 | 1465 | 18 | - | - | - |
| ν2R2 | 1476 | 1452 | 24 | 1477 | 1454 | 23 |
| ν31 | 1462 | - | - | 1462 | 1431 | 31 |
| ν32 | 1458 | - | - | - | - | - |
| ν33 | 1349 | 1315 | 34 | 1346 | 1315 | 31 |
| ν34 | - | - | - | ~1300 (E|| b) ~1230 (E||a) | ~1300(E|| b) ~1230(E||a) | - |
 | 1431 | - | - | - | - | |
| CH2- | 1420 | - | - | - | - | |
| Bending | 1414 | - | - | - | - | |
| 1402 | - | - | - | - | ||
| ν27P1 | - | - | - | 1506 (E||c) | 1505 (E||c) | - |
| ν27P2 | - | - | - | 1501 (E||c) | 1500 (E||c) | - |
| ν27R1 | - | - | - | 1435 (E||c) | 1432 (E||c) | - |
| ν27R2 | - | - | - | 1425 (E||c) | 1423 (E||c) | - |
If the unit cell has inversion symmetry, Raman-active band cannot be observed in an infrared spectrum and vice versa. As shown in Table 1, ν2R2, ν31, and ν33 are found in both the Raman and infrared spectra, which violate the mutual exclusion rule. As describe above, comparison of the Raman spectrum with the infrared spectrum is a good method to judge the breaking of inversion symmetry. Based on the assignment, it becomes clear that the ν2 and ν27 modes are split into two groups, ν2P and (ν2R1, ν2R2) in the Raman spectrum and (ν27P1, ν27P2) and (ν27R1, ν27R2) in the infrared spectrum as shown in Figure 18. Applying the linear relationship [46] to the ν27 mode (50 K), the site charge distribution is estimated as (0.8, 0.7, 0.3, 0.2) [130], which are approximately equal to the values (0.85, 0.80, 0.20, 0.15) estimated by Ivek et al. [133]. The CO amplitude (Δρmax = 0.6) is comparable to that of θ-RbZn. Kakiuchi et al., examined the breakdown of Friedel’s law by anomalous scattering effect, and they concluded a symmetry reduction from to P1 [128]. Using the space group P1, they determined the molecular geometry of each site, and provided consistent result for the site charge distribution as ρA = 0.82(9), ρB = 0.73(9), ρA’ = 0.29(9), ρC = 0.26(9) at 20 K. Recently, Alemany et al., reported the site charges as ρA = 0.638, ρB = 0.577, ρA′ = 0.438, ρC = 0.359 using a numerical atomic orbital density functional theory (DFT) approach [129]. This CO amplitude ρmax = 0.28 is significantly smaller than the experimentally estimated value of ρmax = 0.56–0.70. The site charge distribution has been estimated from the 13C-NMR shift, which consists of Knight shift and chemical shift [15,134]. The chemical shift reflects the local charges, whereas the Knight shift is proportional to the local spin susceptibility which reflects the density of states at the Fermi level [135]. Therefore, the chemical shift should be analyzed to estimate the site charges. Kawai and Kawamoto conducted a 13C-NMR study using a single side 13C-enriched molecule [135]. To avoid the effect of the Knight shift and ring current within the molecule, they applied a magnetic field nearly parallel to the long axis of the molecule in the non-magnetic state (at 60 K). They determined the chemical shift tensor of the four sites, and estimated the site charge to be ρR~0.74 and ρP~0.19. If we simply apply the relation between the chemical shift and site charge which they present, site charge distribution is estimated as ρA = 0.74, ρB = 0.76, ρA’ = 0.18, and ρC = 0.20. All of these results studied by vibrational spectroscopy, x-ray diffraction, and 13C-NMR approximately consistent with each other.
to P1 [128]. Using the space group P1, they determined the molecular geometry of each site, and provided consistent result for the site charge distribution as ρA = 0.82(9), ρB = 0.73(9), ρA’ = 0.29(9), ρC = 0.26(9) at 20 K. Recently, Alemany et al., reported the site charges as ρA = 0.638, ρB = 0.577, ρA′ = 0.438, ρC = 0.359 using a numerical atomic orbital density functional theory (DFT) approach [129]. This CO amplitude ρmax = 0.28 is significantly smaller than the experimentally estimated value of ρmax = 0.56–0.70. The site charge distribution has been estimated from the 13C-NMR shift, which consists of Knight shift and chemical shift [15,134]. The chemical shift reflects the local charges, whereas the Knight shift is proportional to the local spin susceptibility which reflects the density of states at the Fermi level [135]. Therefore, the chemical shift should be analyzed to estimate the site charges. Kawai and Kawamoto conducted a 13C-NMR study using a single side 13C-enriched molecule [135]. To avoid the effect of the Knight shift and ring current within the molecule, they applied a magnetic field nearly parallel to the long axis of the molecule in the non-magnetic state (at 60 K). They determined the chemical shift tensor of the four sites, and estimated the site charge to be ρR~0.74 and ρP~0.19. If we simply apply the relation between the chemical shift and site charge which they present, site charge distribution is estimated as ρA = 0.74, ρB = 0.76, ρA’ = 0.18, and ρC = 0.20. All of these results studied by vibrational spectroscopy, x-ray diffraction, and 13C-NMR approximately consistent with each other.Yamamoto et al., found strong second harmonic generation (SHG) in the CO state, using 4 ps pulse laser with a wavelength of 1.4 µm as the fundamental light [124,136]. The evolution of the second harmonic light just below TCO is direct evidence for the breakdown of the inversion symmetry. They determined the nonlinear electric susceptibility χ(2)ij(2ω; ω, ω), where i and j denote the polarization of the second harmonic light and fundamental light, respectively. The relative values against BBO (β-barium borate), which is a representative crystal for nonlinear optics, are 21, 8.5, 44, 31 for the polarization aa, ab, ba, and bb. Such a strong susceptibility value suggests that the generated electric dipole in a unit cell is coherently extended over a macroscopic domain, that is, a ferroelectric domain. As in conventional ferroelectrics, the crystal is expected to form a multiple domain structure. Ferroelectric domains with opposite polarization are observed utilizing the experimental technique of SHG interferometry [137]. The domain size is found to be more than 0.2 mm × 0.2 mm, which is almost a single domain. Although polarization reversal by an external electric field has not been realized due to high conductivity and low breakdown field, this compound in the CO state is classified as an unconventional ferroelectrics called electronic ferroelectrics [138]. In conventional ferroelectrics, ionic polarization coming from displacement or ordering of ions plays a role in creating a polar domain. On the other hand, in electronic ferroelectrics, ions are replaced by electrons, and electronic polarization by charge order causes a polar domain. To show that the polar domain mainly originated from electrons, Yamamoto demonstrated fast photoresponse where the second harmonics diminish by 50% within 100 fs and recovers within several tenths of a picosecond after the irradiation of a 100 fs laser. This fast photoresponse was studied by Iwai et al., as a photoinduced insulator-to-metal phase transition. Using mid-infrared pump-probe spectroscopy, they observed the transient reflectivity change in the mid-infrared region [123,139]. The decay process depends on the intensity of the light pulse. In the case of weak excitation, one photon produces a microscopic metallic domain consisting of about 100 molecules, which decays quickly. In the case of strong excitation, on the other hand, the microscopic domains aggregate with each other forming a quasi-macroscopic metallic domain, which decays slowly. The recovery of the second harmonics corresponds to this slow decay. Recently, Kawakami et al., uncovered the early dynamic process of the photoinduced phase transition using a 12 fs laser [140].
5.2. Metallic Phase of α-(BEDT-TTF)2I3 and Isostructural Metallic Compounds
5.2.1. Assignment in Metallic Phase
We have shown that charge order is the origin of the splitting of the ν2 and ν27 modes. If a metallic compound involves crystallographically non-equivalent sites in the unit cell, the charge-sensitive modes split reflecting the non-equivalent sites. This splitting is also described by Equation (1). Figure 20 shows the Raman spectra of metallic α-I3, α-(BEDT-TTF)2NH4Hg(SCN)4, (abbreviated as α-NH4Hg) and θ-I3. The first two compounds are isostructural with each other, while the latter one takes herringbone arrangement with higher symmetry. α-NH4Hg is metallic down to low temperature, and shows superconductivity at 1 K [141]. Similar to α-I3, the unit cell of α-NH4Hg involves four ET molecules (see Figure 1 of ref. [142] for the definition of A, A′, B, and C). As described in the last section, the unit of the α-type compound involves three Raman-active modes and one infrared-active mode for ν2 and ν3. In the case of α-I3, one ν2 mode is missing, whereas all of the three appear to be present in 13C-substitued compound as shown in Figure 20a,a′,b,b′. From the isotope shift, the three bands in Figure 20a can be safely assigned to ν21, ν22, and ν33. In the case of α-NH4Hg, three ν2 and two ν3 modes are found and they are assigned based on the isotope shift shown in Figure 20c,c′.The remaining Raman-active ν3 mode is missing from this Raman spectrum. Similar splitting of ν27 is described in ref. [130]. The crystal of θ-I3 belongs to the monoclinic system with space group of P21/c, and the unit cell contains four BEDT-TTFs. However, the arrangement of BEDT-TTF can be approximately described by the orthorhombic system with space group Pnma with the unit cell accommodating two crystallographically equivalent BEDT-TTFs [113,143]. Due to the high symmetry of the unit cell, ν2 and ν3 appear as a single band at ρ~0.5 as shown in Figure 20d. The frequencies of the ν2 and ν3 modes of these compounds are shown in Table 2.
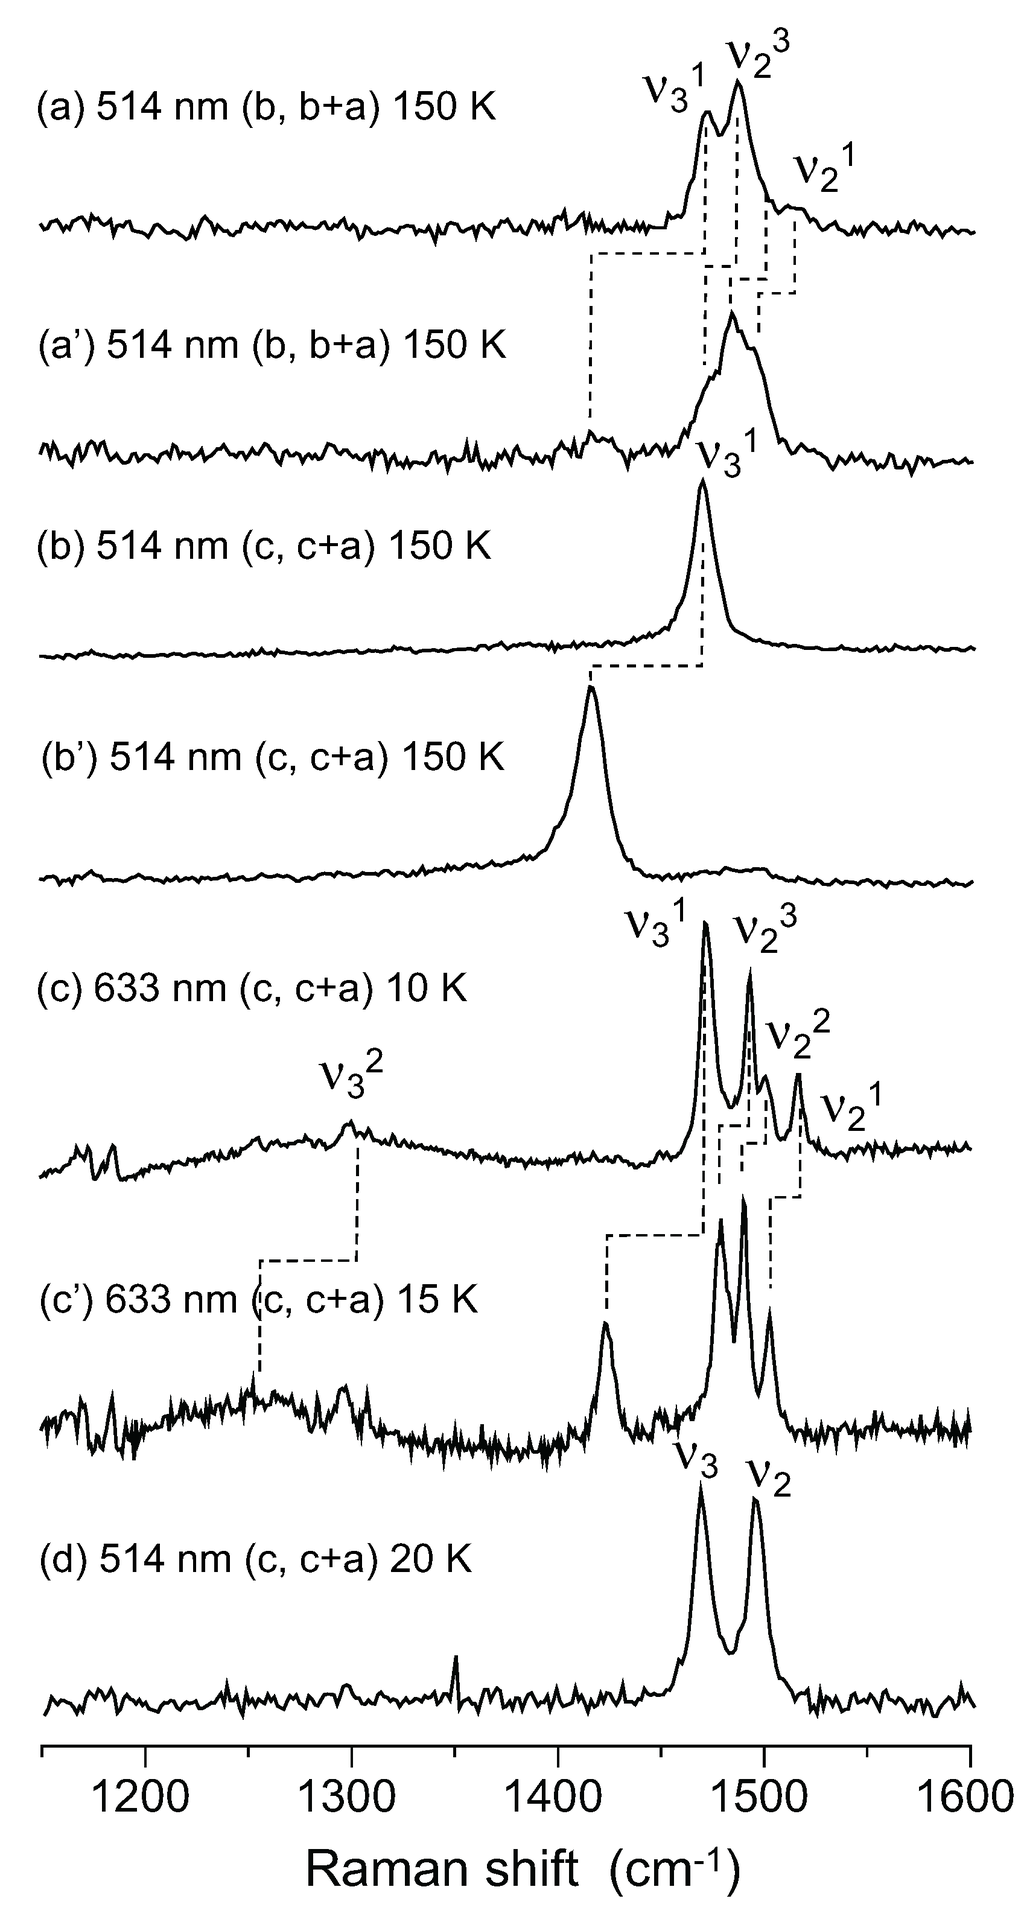
Figure 20.
Raman spectra of α-(BEDT-TTF)2I3 and α-(BEDT-TTF)2NH4Hg(SCN)4, and the 13C-substitued compound, in which two carbon atoms of the central C=C bond of BEDT-TTF are substituted by 13C. (a) and (b) α-(BEDT-TTF)2I3; (a′) and (b′) α-(13C-BEDT-TTF)2I3; (c) α-(BEDT-TTF)2NH4Hg(SCN)4; (c′) α-(13C-BEDT-TTF)2NH4Hg-(SCN)4, and (d) θ-(BEDT-TTF)2I3.
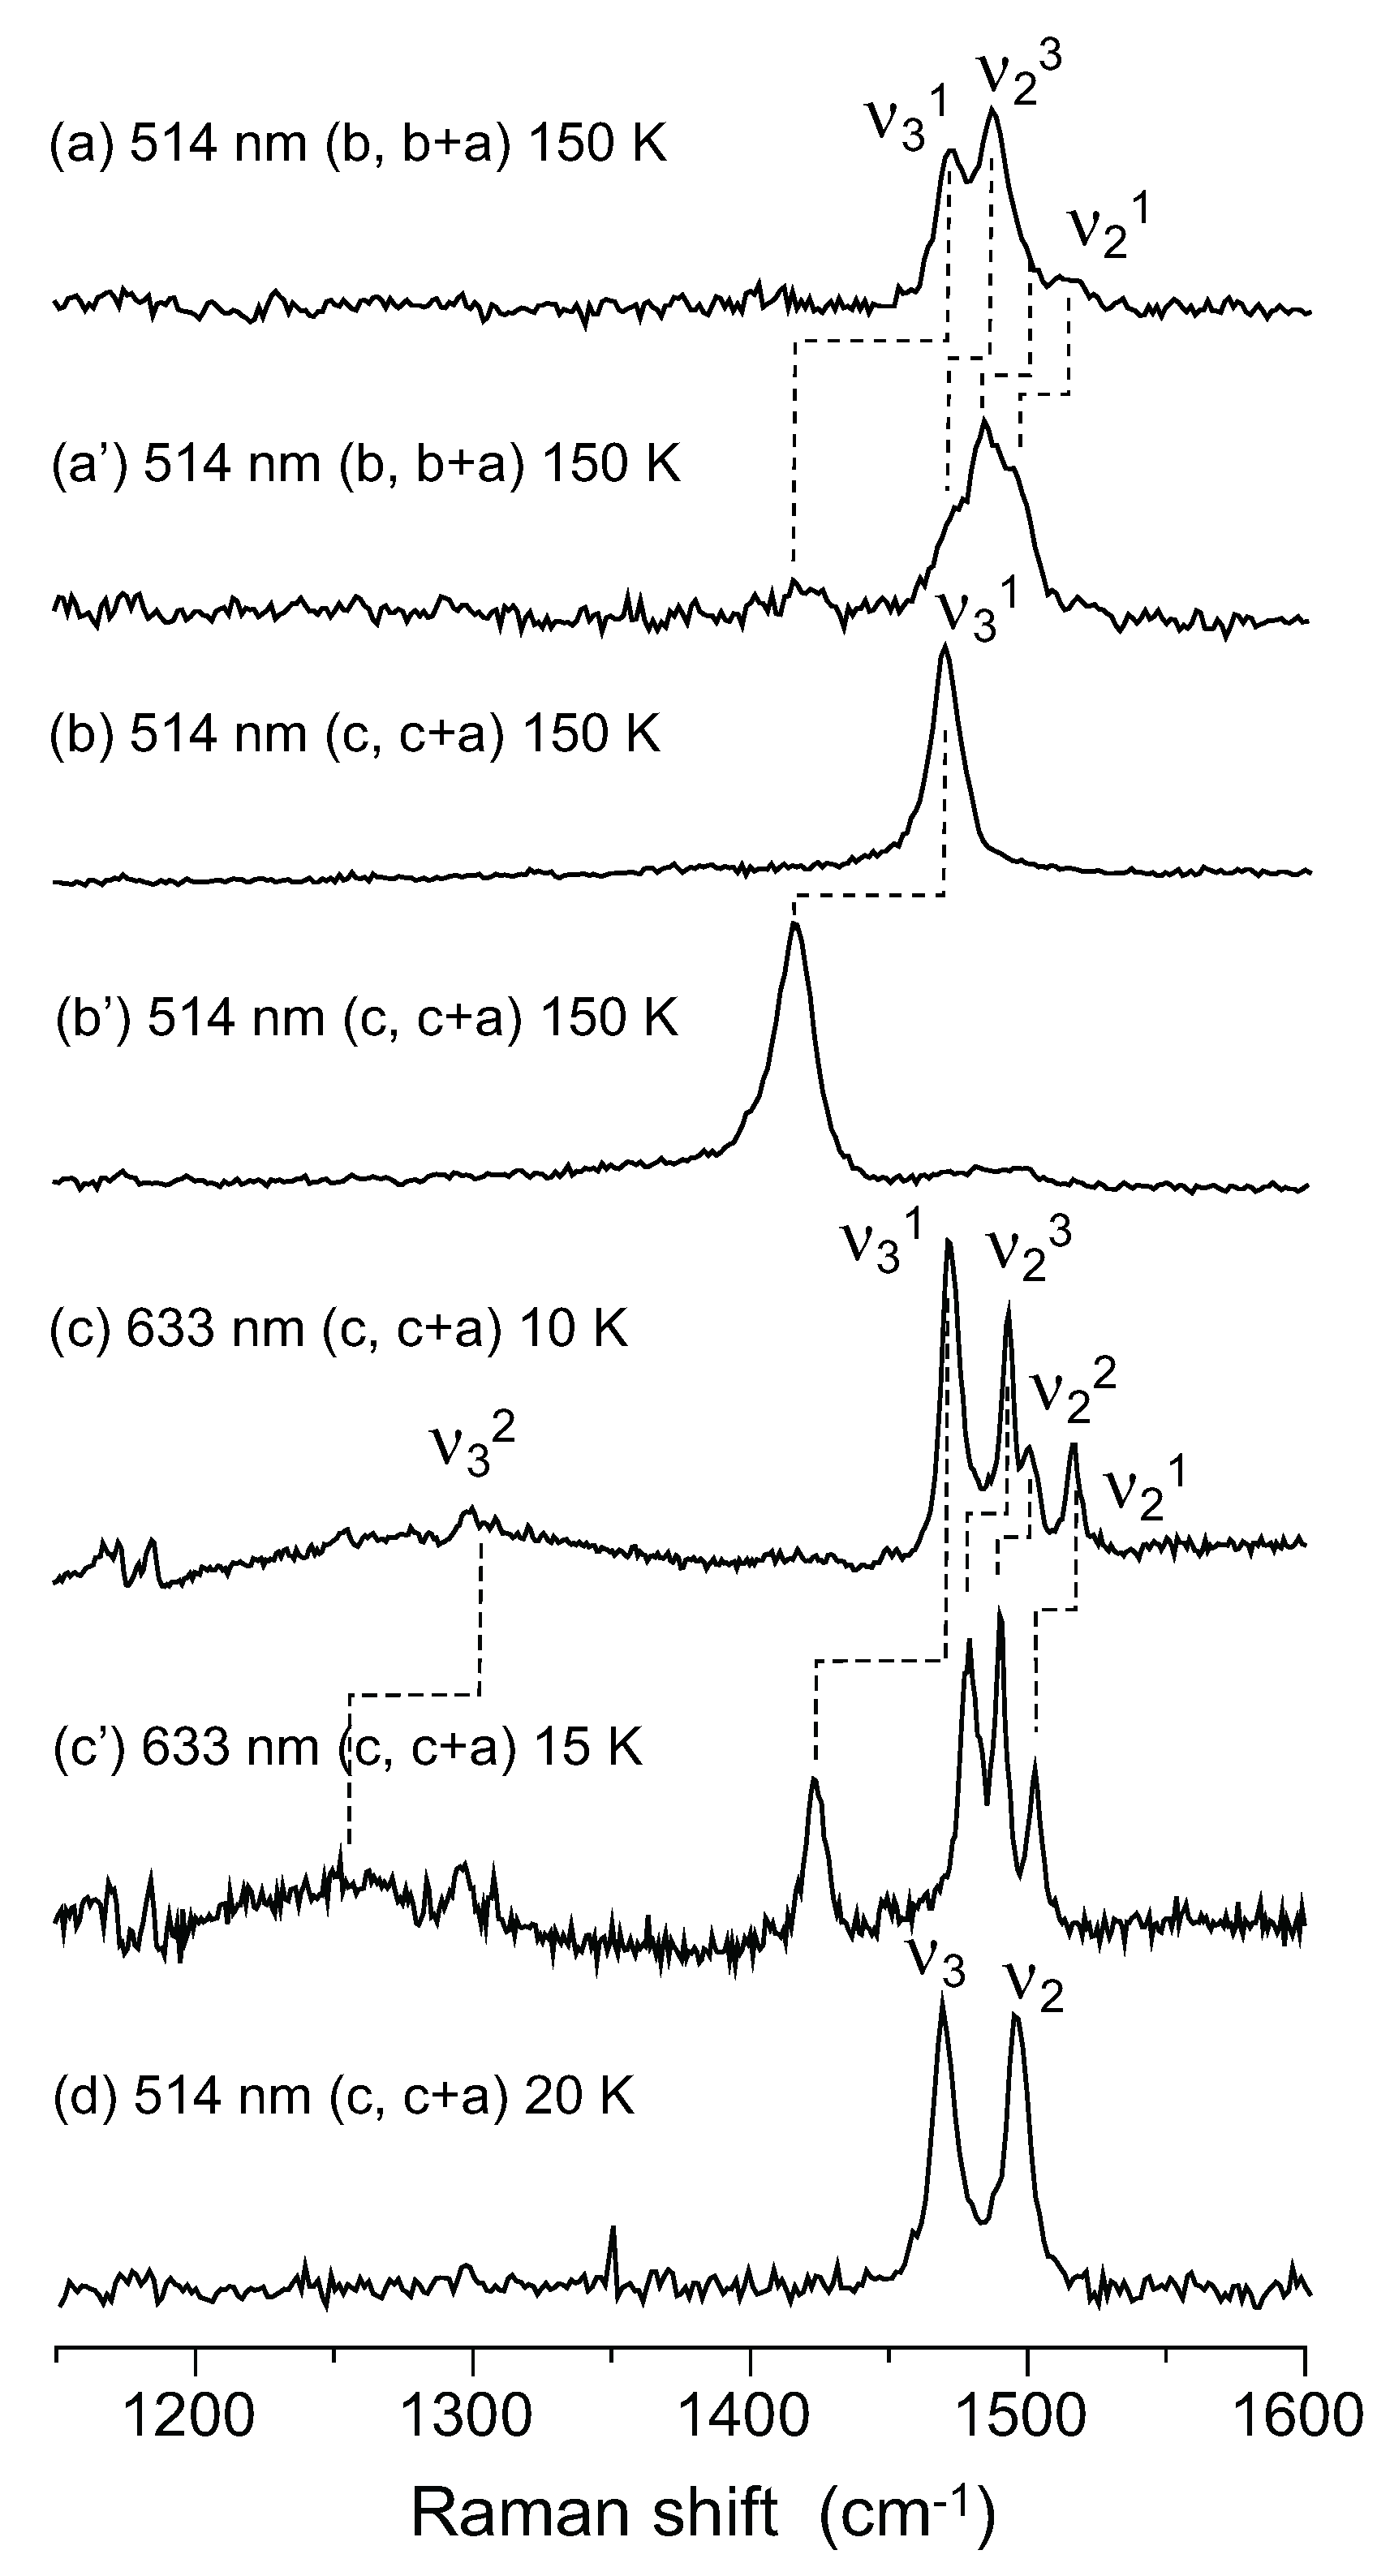
Table 2.
Assignment of the Raman modes of α-(BEDT-TTF)2I3, α-(BEDT-TTF)2NH4Hg(SCN)4, and θ-(BEDT-TTF)2I3.
| α-(12C-ET)2I3 | α-(13C-ET)2I3 | α-(12C-ET)2 NH4Hg(SCN)4 | α-(13C-ET)2 NH4Hg(SCN)4 | θ-(ET)2I3 | |||
|---|---|---|---|---|---|---|---|
| Raman (150 K) | Raman (150 K) | Isotope shift ν12-ν13 | Raman (10 K) | Raman (15 K) | Isotopeshift ν12-ν13 | Raman (20 K) | |
| ν21 | 1516 | 1496 | ~20 | 1515 | 1503 | 13 | |
| ν22 | - | ~1484 | - | 1500 | 1490 | 10 | 1496 |
| ν23 | 1487 | 1470 | 17 | 1492 | 1479 | 14 | |
| ν31 | 1471 | ~1415 | ~56 | 1471 | 1423 | 48 | |
| ν32 | - | - | - | ~1300 | ~1250 | ~50 | 1469 |
5.2.2. Fluctuation of Charge Order in Metallic Phase
Although ν2 and ν27 of α-I3 and α-NH4Hg are split into three with similar split widths, the linewidth of each mode is very different. Yue et al., showed that the linewidth of metallic α-I3 is about two to three times as large as that of α-NH4Hg [130]. As shown in Figure 21a, the linewidth of ν27 of α-I3 is much broader than the charge-insensitive mode such as the CH2 bending mode. As the frequencies of ν27 and ν2 strongly depend upon the site charge (140 cm−1/e for ν27 and 120 cm−1/e for ν2) [46], such a broad linewidth should be associated with fluctuation of the site charge. Assuming that the site charge fluctuates stochastically as a Gaussian process, Yue et al., analyzed the line shape of the somewhat isolated ν21 mode, and obtained a width of Δν ~ 9−17 cm−1, which corresponds to the CO amplitude of Δρ ≈ 0.08−0.14. Comparing with the theoretical curve, they estimated the parameter to be τΔν ~ 0.7–10 and the correlation time for the fluctuation to be τ−1 ~ 1−25 cm−1. This fluctuation rate is much faster than that of θ-RbZn, but it is sufficiently slow for the electron dynamics. This slow fluctuation rate suggests collective motion of site charge. In contrast to the θ-type BEDT-TTF salts, x-ray diffuse scattering has not been reported. Tanaka and Yonemitsu calculated the finite temperature free energy for the horizontal, vertical, and diagonal stripes, and threefold CO of α-I3 within the framework of the mean-field approximation, using realistic parameters and taking electron-lattice coupling into account [87]. At low temperatures, these CO states and the paramagnetic metallic state are distributed within a narrow energy range. Therefore, the free energy in the metallic phase above TMI is approximately multiply degenerate. Yue et al., speculated that the metallic state of α-I3 above TMI involves short-range correlation of these multiple stripes to increase entropy. This situation at finite temperature resembles the case of θ-CsZn in which stripe and threefold CO are competing. The slow fluctuation of the site charge is regarded as dynamical fluctuation of various types of CO domains. Such CO fluctuation modulates the charge density at each site and broadens the linewidth of the charge-sensitive mode, when the fluctuation rate is sufficiently slow.
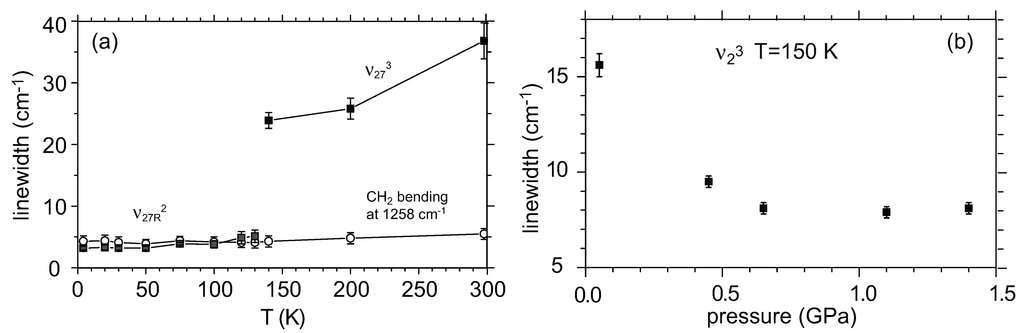
Figure 21.
The linewidth of ν27 and ν23 of α-(BEDT-TTF)2I3. (a) Temperature dependence of the linewidth of infrared-active ν27, which becomes very broad in the metallic phase; (b) Pressure dependence of the linewidth of Raman active ν23, which decreases on increasing pressure. These figures are modified from parts of Figures 2,4 of ref. [130].

As shown in Figure 21b, the linewidth of ν23 of α-I3 decreases by almost half at 0.65 GPa and it becomes comparable to the linewidth of ν23 of α-NH4Hg at 100 K. It is known that the application of hydrostatic pressure suppresses the long-range CO state [144]. This result implies that the paramagnetic metal is stabilized more than other stripe COs, and thus the energy difference between them is enlarged under hydrostatic pressure. Therefore, the fluctuation of stripe COs is suppressed under hydrostatic pressure, and the amplitude and correlation length may be reduced, leading to a higher fluctuation rate. This fast modulation narrows the linewidth of the charge-sensitive mode in addition to the small amplitude under hydrostatic pressure. The same speculation is applicable to stable metal α-NH4Hg. The narrow linewidth of the charge-sensitive mode of α-NH4Hg is consistent with this speculation.
The existence of CO fluctuation in α-NH4Hg is indicated by the vibronic band ν32 in the Raman spectrum (See Figure 20c,c′) as in the case of θ-CsZn. On the other hand, the vibronic band is not found in the Raman spectrum of the isostructural α-KHg, α-RbHg and α-TlHg salts. This results suggests that the fluctuation in α-NH4Hg is largest in the group of α-MHg (M = NH4, K, Rb, Tl). Hiejima et al., observed the infrared-active ν27 modes on the side face of the crystal with the polarization perpendicular to the conducting plane [145]. In addition to the three ν27 modes, they found a weak new band growing below 200 K in α-MHg (M = K, Rb, Tl). They interpreted this band as the forbidden mode among the four ν27 modes, which means breaking of inversion symmetry. They speculated that fluctuation of stripe CO locally breaks the inversion symmetry as in α-I3. If this is the case, the CO fluctuation in α-NH4Hg is negligibly small, since the weak band is not found in α-NH4Hg.
To reconcile these contradictory arguments, the charge density wave (CDW) should be reconsidered. Foury-Leylekian reported an incommensurate CDW for α-MHg (M = K, Rb) using x-ray diffraction [146]. The satellite reflections are already detected at high temperature (250–300 K). Recently, they pointed out the anion sublattice instability leading to deformation of the SCN tetrahedral coordination of Hg2+ and SCN tetragonal antiprismatic coordination of K+ in α-KHg [147]. They claimed that the Fermi-surface-nesting instability of the BEDT-TTF layer is coupled with the instability of the anion sublattice. This sublattice instability is common in K, Rb, and Tl. As this deformation breaks inversion symmetry, the deformation of the anion sublattice brings about the non-centrosymmetric displacement of BEDT-TTF. This mechanism seems to be more reasonable to account for the breaking of the selection rule of ν27. Since this CDW is incommensurate, the ν27 modes will become broad and unresolved, if the amplitude of CDW is large enough Δρ > 0.05 [148]. Actually, the ν27 modes of α-NH4Hg are more resolved than those of α-MHg (M = K, Rb, Tl) [145]. As the ν27 modes of the latter compounds are barely resolved, the CDW amplitude is considered to be Δρ < 0.05. The above discussion leads to the conclusion that the fluctuation of CO is indicated only in α-NH4Hg which shows superconductivity.
5.3. Non-Uniform Site-Charge Distribution in Metallic Phase
Non-uniform site charges in α-I3 have been reported using Raman spectroscopy [111] and 13C-NMR [134] experiments. Wojciechowski et al., interpreted them simply by non-uniform (anisotropic) network of transfer integrals in the unit cell using Equation (1) [111]. Yamamoto et al., conducted a systematic study of β″-type BEDT-TTF salts [149]. They qualitatively interpreted the site-charge distribution from non-uniform (anisotropic) intersite Coulomb interaction especially along the stacking direction. Band calculation that takes Coulomb interaction into account will incorporate the effect of both anisotropic networks on some level. Moroto et al., claimed that the non-uniform site charges are a precursor of charge order [134]. Bangura et al., attributed the splitting of ν2 in metallic β″-(BEDT-TTF)4[(H3O)Ga(C2O4)]·C6H5NO2 to the signature of charge order [150]. Recently, Kaiser et al., reported the splitting of ν27 in metallic β″-(BEDT-TTF)2SF5CH2CF2SO3, and they interpreted the growth of splitting as a fluctuation of CO [31]. All of these compounds involve non-equivalent sites in the unit cell: three sites in α-I3 and two sites in the latter two compounds. Therefore, the splitting of the charge-sensitive mode in a metallic state is not always caused by charge order. The splitting of the charge-sensitive mode in the metallic phase should be carefully interpreted, considering the splitting width, line broadening, indication of symmetry breaking, etc. In this section, site-charges in metallic phase are more precisely discussed to compare the band calculation.
5.3.1. Relation between Frequency and Site Charge Near ρ = 0.5
The relationship between the frequency of ν2 and the valence of the molecule, ρ, was examined by Yamamoto [46]. They assumed a linear relationship in the range of 0 ≤ ρ ≤ 0.8 [151]. The ρ dependence of the frequency of ν2 mode is ascribed to the ρ dependent force constant F(ρ). That is, the linear relationship requires (dF/dρ)ρ=0 = (dF/dρ)ρ=1 [152]. However, the frequency of BEDT-TTF0.5+ significantly deviates from the linear relationship toward the low-frequency side, which implies the relation |(dF/dρ)ρ=0| > |(dF/dρ)ρ=1|. To estimate the site charge more reliably at ρ~0.5, the empirical equation,  (ρ~0.5) is proposed, using ν2(0) = 1570 cm−1 for the calculated frequency of the flat neutral BEDT-TTF molecule, [46] ν2(0.5) = 1494 cm−1, 1494 cm−1, 1495 cm−1 respectively for β′-(BEDT-TTF)2ICl2, κ-(BEDT-TTF)2Cu2(CN)3, and κ-(BEDT-TTF)2Cu[N(CN)2]Cl at room temperature, and ν2(1) = 1447 cm−1 for (BEDT-TTF)ClO4 and (BEDT-TTF)AuBr2Cl2 at room temperature [153]. All of the compounds with ρ = 0.5 shows a frequency upshift by ~6 cm−1 on cooling from room temperature to 10 K due to hardening of the crystal lattice. The frequency shift due to lattice expansion is described by the equation,
  , where γ is the optical Gruneisen parameter and β(T) is the coefficient of volume thermal expansion. Therefore, this temperature dependence is given by the following equation,
  , if β(T) is approximated by the equation, β(T) = β0 + β1T [154]. The examples of for the ν2 modes of κ-Cu[N(CN)2]Cl and β′-ICl2 are shown in Figure 22. Although the function form of β(T) is too crude to express actual one, the frequency shift is well reproduced. If we assume that ν2(0) and ν2(1) also show the same temperature dependence, the quadratic expression can be corrected as
(ρ~0.5) is proposed, using ν2(0) = 1570 cm−1 for the calculated frequency of the flat neutral BEDT-TTF molecule, [46] ν2(0.5) = 1494 cm−1, 1494 cm−1, 1495 cm−1 respectively for β′-(BEDT-TTF)2ICl2, κ-(BEDT-TTF)2Cu2(CN)3, and κ-(BEDT-TTF)2Cu[N(CN)2]Cl at room temperature, and ν2(1) = 1447 cm−1 for (BEDT-TTF)ClO4 and (BEDT-TTF)AuBr2Cl2 at room temperature [153]. All of the compounds with ρ = 0.5 shows a frequency upshift by ~6 cm−1 on cooling from room temperature to 10 K due to hardening of the crystal lattice. The frequency shift due to lattice expansion is described by the equation, , where γ is the optical Gruneisen parameter and β(T) is the coefficient of volume thermal expansion. Therefore, this temperature dependence is given by the following equation, , if β(T) is approximated by the equation, β(T) = β0 + β1T [154]. The examples of for the ν2 modes of κ-Cu[N(CN)2]Cl and β′-ICl2 are shown in Figure 22. Although the function form of β(T) is too crude to express actual one, the frequency shift is well reproduced. If we assume that ν2(0) and ν2(1) also show the same temperature dependence, the quadratic expression can be corrected as
for T < 300 K. However, the temperature dependence of molecular vibration varies depending on the compound. For example, the ν2 mode of θ-I3 shifts less than 3 cm−1 at 10 K. Therefore the estimated site charge has an ambiguity of about ±0.03.

Figure 22.
Temperature dependence of the frequency of ν2 of κ-(BEDT-TTF)2-Cu[N(CN)2]Cl and β′-(BEDT-TTF)2ICl2. The red line is the best fit equation, ω = Aexp(−BT−CT2/2), where A = ω0, B = γβ0, and C = γβ1.
Figure 22.
Temperature dependence of the frequency of ν2 of κ-(BEDT-TTF)2-Cu[N(CN)2]Cl and β′-(BEDT-TTF)2ICl2. The red line is the best fit equation, ω = Aexp(−BT−CT2/2), where A = ω0, B = γβ0, and C = γβ1.
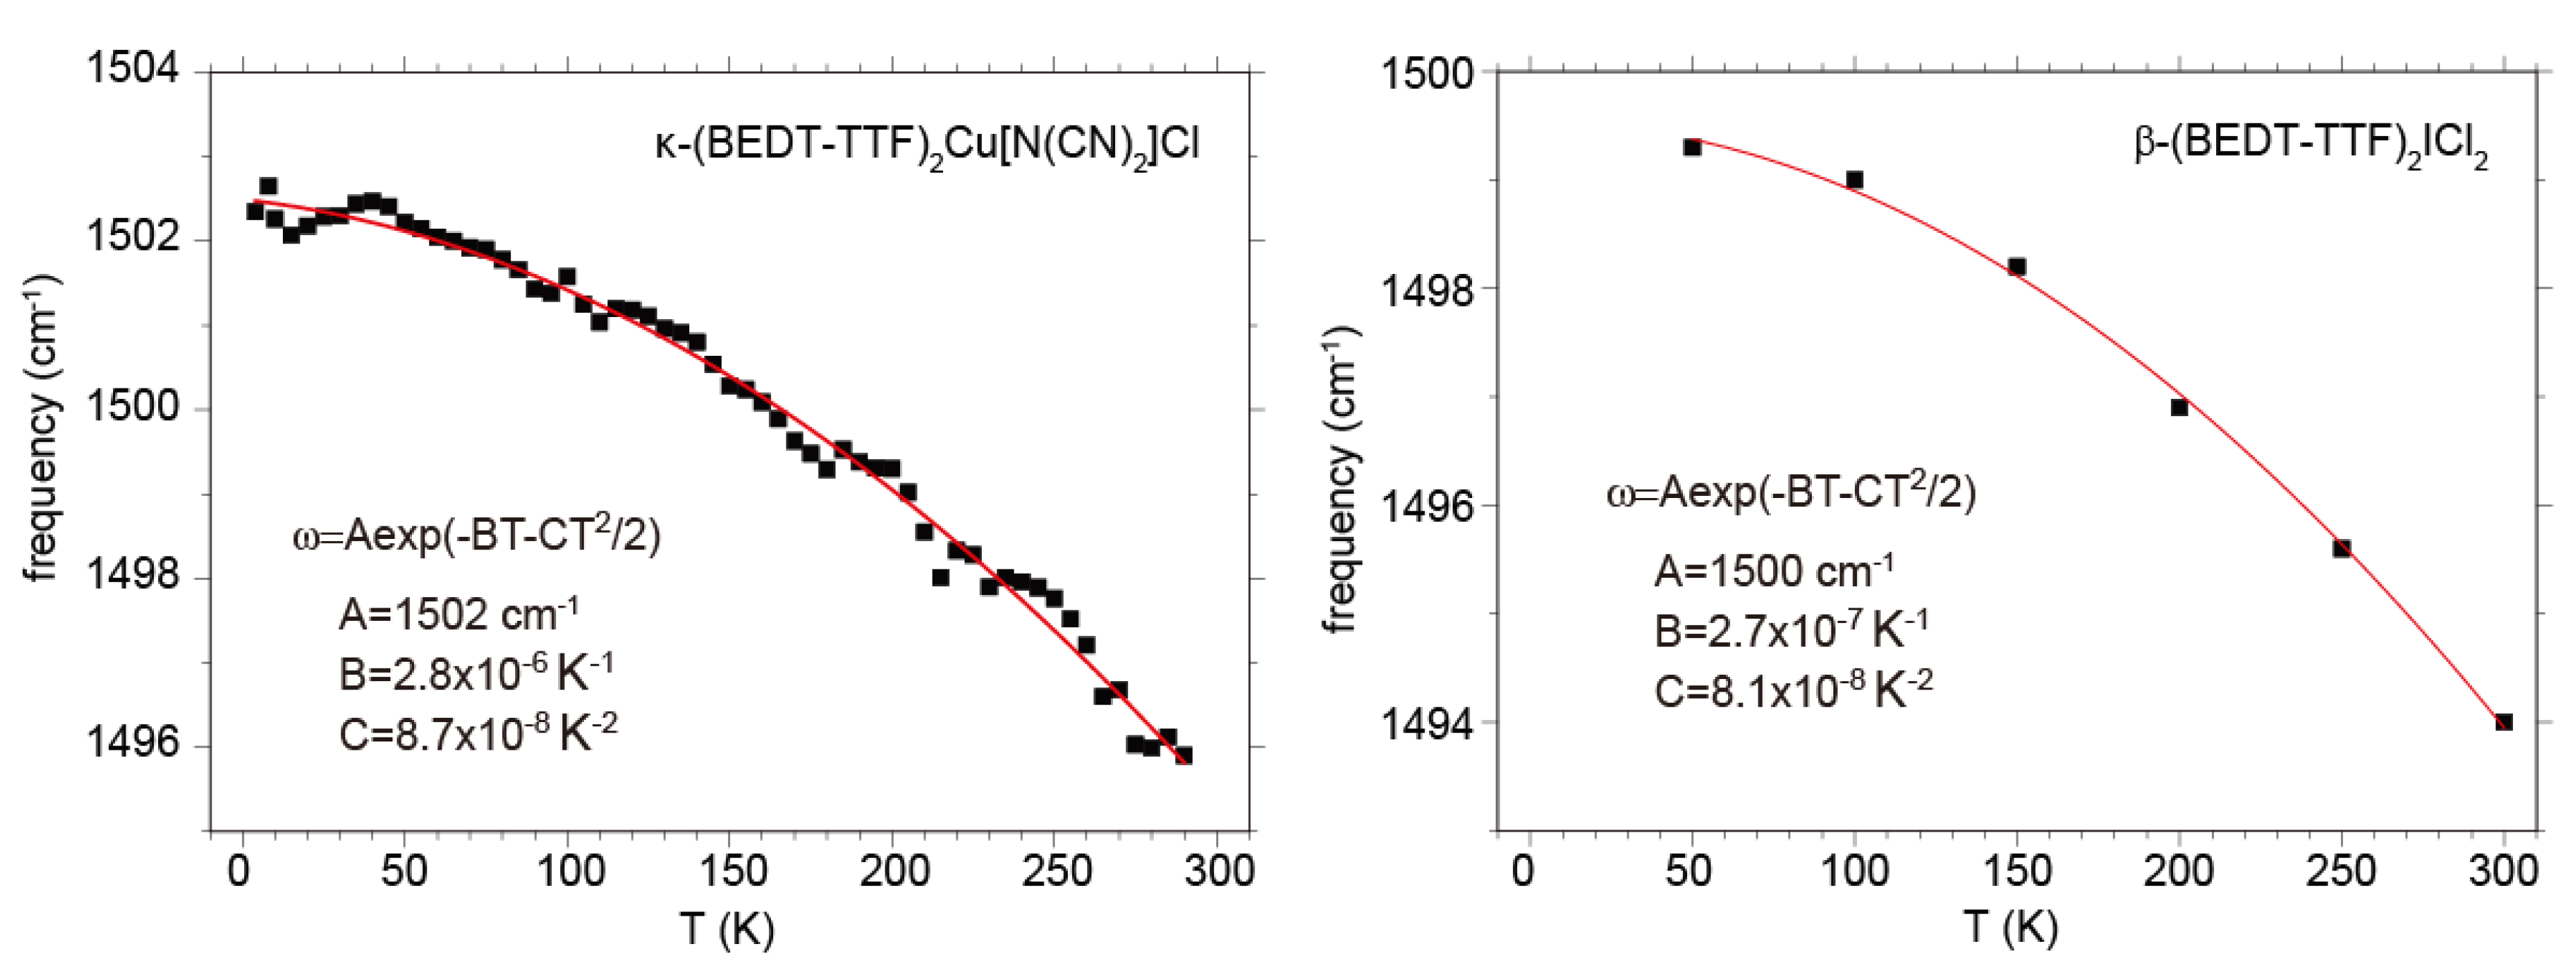
5.3.2. Site Charge Distribution in Metallic Phase at Ambient Pressure
The second column of Table 3 shows the site charge of α-I3 in the metallic phase estimated from the frequency of ν2 using Equation (7). According to an x-ray diffraction study, the site charge follows the order, ρB > ρA = ρA′ > ρC, in the metallic state [128]. ρA = ρA′ shown in parentheses in Table 3 is calculated assuming this order. This assumption is consistent with the assignment that ν22 is missing in α-I3 (See Figure 20a,a′). These hole numbers are compared with the corresponding values estimated from the infrared-active ν27 mode [130], assuming a linear relationship [155].The site charge was calculated by Wojciechowski et al., neglecting Coulomb interaction [111]. Katayama et al., examined the effect of the anion potential, and they showed that anion potential has a small influence on the site charge [156]. Kobayashi et al., calculated the temperature dependence of the site hole number within the mean-field approximation for extended Hubbard model [157]. Ishibashi et al., made Mulliken charge analyses in their ab initio calculation of the band structure of α-I3 [158]. Recently, the site hole numbers were reported by Alemany using the DFT approach considering only the valence electrons [129]. In Table 3, their results are compared with the experimental results. The mean-field calculation overestimates the site-charge difference between the sites B and C. The simplified Coulomb energy parameters may be one of the reasons for the overestimation. In the ab initio and DFT calculations, this site-charge difference is more suppressed, and the agreement with experimental values is good taking the experimental errors into account.
Table 3.
Site hole numbers of metallic α-(BEDT-TTF)2I3. MF denotes mean-field calculation, and DFT denotes density functional theory.
| Raman (150 K) | Infrared [130] (140 K) | X-ray [128] (150 K) | MF [157] (150 K) | ab initio [158] | DFT [129] | ||
|---|---|---|---|---|---|---|---|
| (298 K) | (8 K) | (RT) | |||||
| ρA = ρA′ | (0.52(3)) | ~0.6 | 0.59(3) | 0.52 | 0.53 | 0.54 | 0.521 |
| ρB | 0.60(3) | 0.68 | 0.67(2) | 0.71 | 0.55 | 0.57 | 0.546 |
| ρC | 0.37(3) | 0.44 | 0.42(2) | 0.25 | 0.40 | 0.37 | 0.382 |
In the same way, the site charges of metallic α-NH4Hg at 10 K are estimated to be 0.57(3), 0.50(3), and 0.39(3) using the frequencies of ν2 shown in Table 2. Although the corresponding site cannot be decided by vibrational spectroscopy, Hiejima et al., assigned the three infrared-active ν27 modes with the aid of 13C-NMR, and they interpreted the site A to be most charge-poor [145]. Apart from the result of 13C-NMR, the following argument also supports the above interpretation. In Section 5.2.2. we discussed the breaking of inversion symmetry in α-MHg (M = K, Rb, Tl), based on the growth of the forbidden mode. The forbidden mode is the out-of-phase mode between ν27A and ν27A′ which are coupled through dipole-dipole interaction [145]. As the dipole is induced parallel to the long axis of molecule, the frequency of the out-of-phase mode is lower than that of the in-phase mode. The out-of-phase mode grows at a slightly lower frequency of the highest frequency mode among the three ν27 modes, in-phase mode, ν27B and ν27C. This means that the highest frequency mode is the in-phase mode of ν27A, that is, the A site is the most charge-poor. As the other sites cannot be decided, the assignment of ρB and ρC in Table 4 is interchangeable. These hole numbers are compared with the corresponding values estimated from the infrared-active ν27 mode [130], assuming a linear relationship [155]. Table 4 shows the site-charge distribution of α-NH4Hg calculated by the mean-field approximation with the transfer integrals given by Mori et al. [142] and Coulomb interaction parameters, U = 0.4, Vc = 0.17, Vp = 0.05 eV [157]. Foury-Leylekian et al., calculated the band structure of isostructural α-KHg at 104 K using a numerical atomic orbital DFT approach, and presented the site charges [147]. Their values are shown in Table 4 along with the hole numbers of isostructural compounds, α-MHg (M = K, Rb, Rl). The mean-field calculation underestimates the non-uniformity among site charges, while the first-principles calculation enhances the non-uniformity and approaches the experimental values. However, the most charge-poor site is the B site in both theoretical calculations. This result is different from the interpretation of the experimental result of the ν27 mode (See Figure 1 of ref. [145]).
Table 4.
Site hole numbers of α-(BEDT-TTF)2MHg(SCN)4 (M = NH4, K, Rb, Tl). MF denotes mean-field calculation.
| α-NH4Hg | α-KHg | α-RbHg | α-TlHg | ||||
|---|---|---|---|---|---|---|---|
| Raman (10 K) | Infrared [130] (150 K) | MF (10 K) | Raman (10 K) | ab initio [147] (104 K) | Raman (10 K) | Raman (10 K) | |
| ρA = ρA’ | 0.39(3) | 0.40 | 0.51 | 0.42(3) | 0.520 | 0.42(3) | 0.42(3) |
| ρB |  |  | 0.47 |  | 0.424 | | |
| ρC | 0.50 | 0.527 | |||||
From the symmetry of the unit cell of θ-I3, every site is approximately equivalent. Therefore, the site charge should be ρ = 0.5. Applying the empirical Equation (7), the site charge is calculated as ρ = 0.51(3) at 298 K (1493 cm−1) and ρ = 0.54(3) (1496 cm−1) at 20 K. The deviation from 0.5 at 20 K comes from the temperature dependence of the ν2 mode that is different from that for κ-type ET salts which are used to obtain the first term of Equation (7).
5.3.3. Site-Charge Distribution under Hydrostatic Pressure
Tamura et al., showed that metallic θ-I3 undergoes a first order phase transition showing a resistivity jump at around 0.5 GPa [159]. Tajima et al., further investigated the transport properties under hydrostatic pressure [160]. They found that the electrical resistance under 1 GPa behaves similar to that of α-I3 at the same pressure. In addition, the Hall coefficient showed the same temperature dependence as that of α-I3 at the same pressure. These two transport properties suggest a zero-gap state (ZGS) in θ-I3 as well as in α-I3 [120,121]. Recently, Miyagawa et al., investigated θ-I3 under hydrostatic pressure using 13C-NMR [161]. The behavior of the spin shift and spin-lattice relaxation rate is also consistent with ZGS. They suggested a structural transformation to the α-type structure at 0.5 GPa. Figure 23a shows the pressure dependence of the Raman spectrum of ν2 and ν3 measured at 50 K. The Raman spectrum shows a frequency upshift under hydrostatic pressure. However, no distinct change was observed, and the spectrum is different from that of α-I3 under hydrostatic pressure (See Figure 23a). This result suggests that high symmetry of the unit cell of θ-I3 is preserved at least approximately up to 3.1 GPa. If this compound is in a ZGS above 0.5 GPa, there should be a contact point at the Fermi level. However, it is concluded from Figure 23a that the band structure of θ-I3 at 0.5 GPa is quite different from that of α-I3. The conservation of the pseudo-symmetry provides a restriction when we speculate the crystal and band structure under hydrostatic pressure.
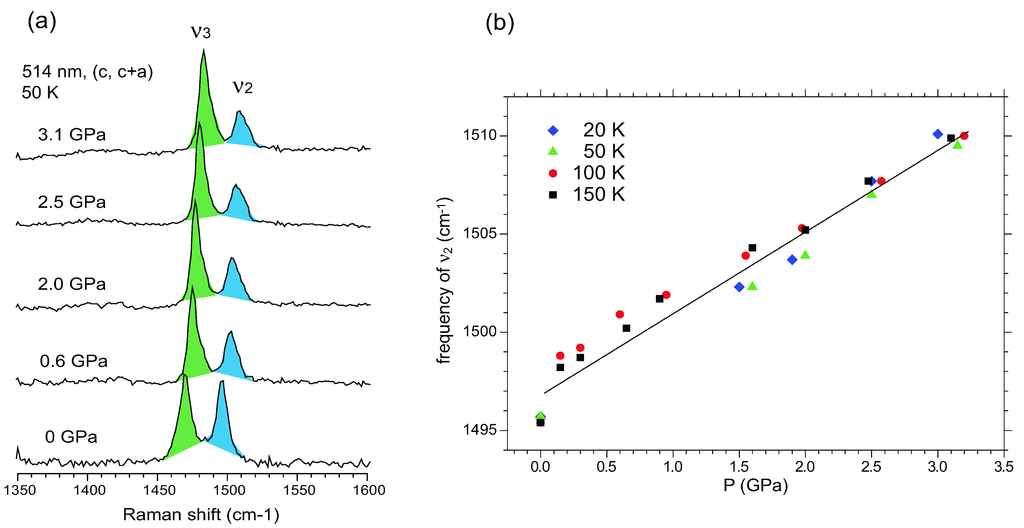
Figure 23.
(a) Pressure dependence of the Raman spectrum of θ-(BEDT-TTF)2I3 measured at 50 K; (b) Pressure dependence of the frequency of ν2 in θ-(BEDT-TTF)2I3.
Figure 23.
(a) Pressure dependence of the Raman spectrum of θ-(BEDT-TTF)2I3 measured at 50 K; (b) Pressure dependence of the frequency of ν2 in θ-(BEDT-TTF)2I3.
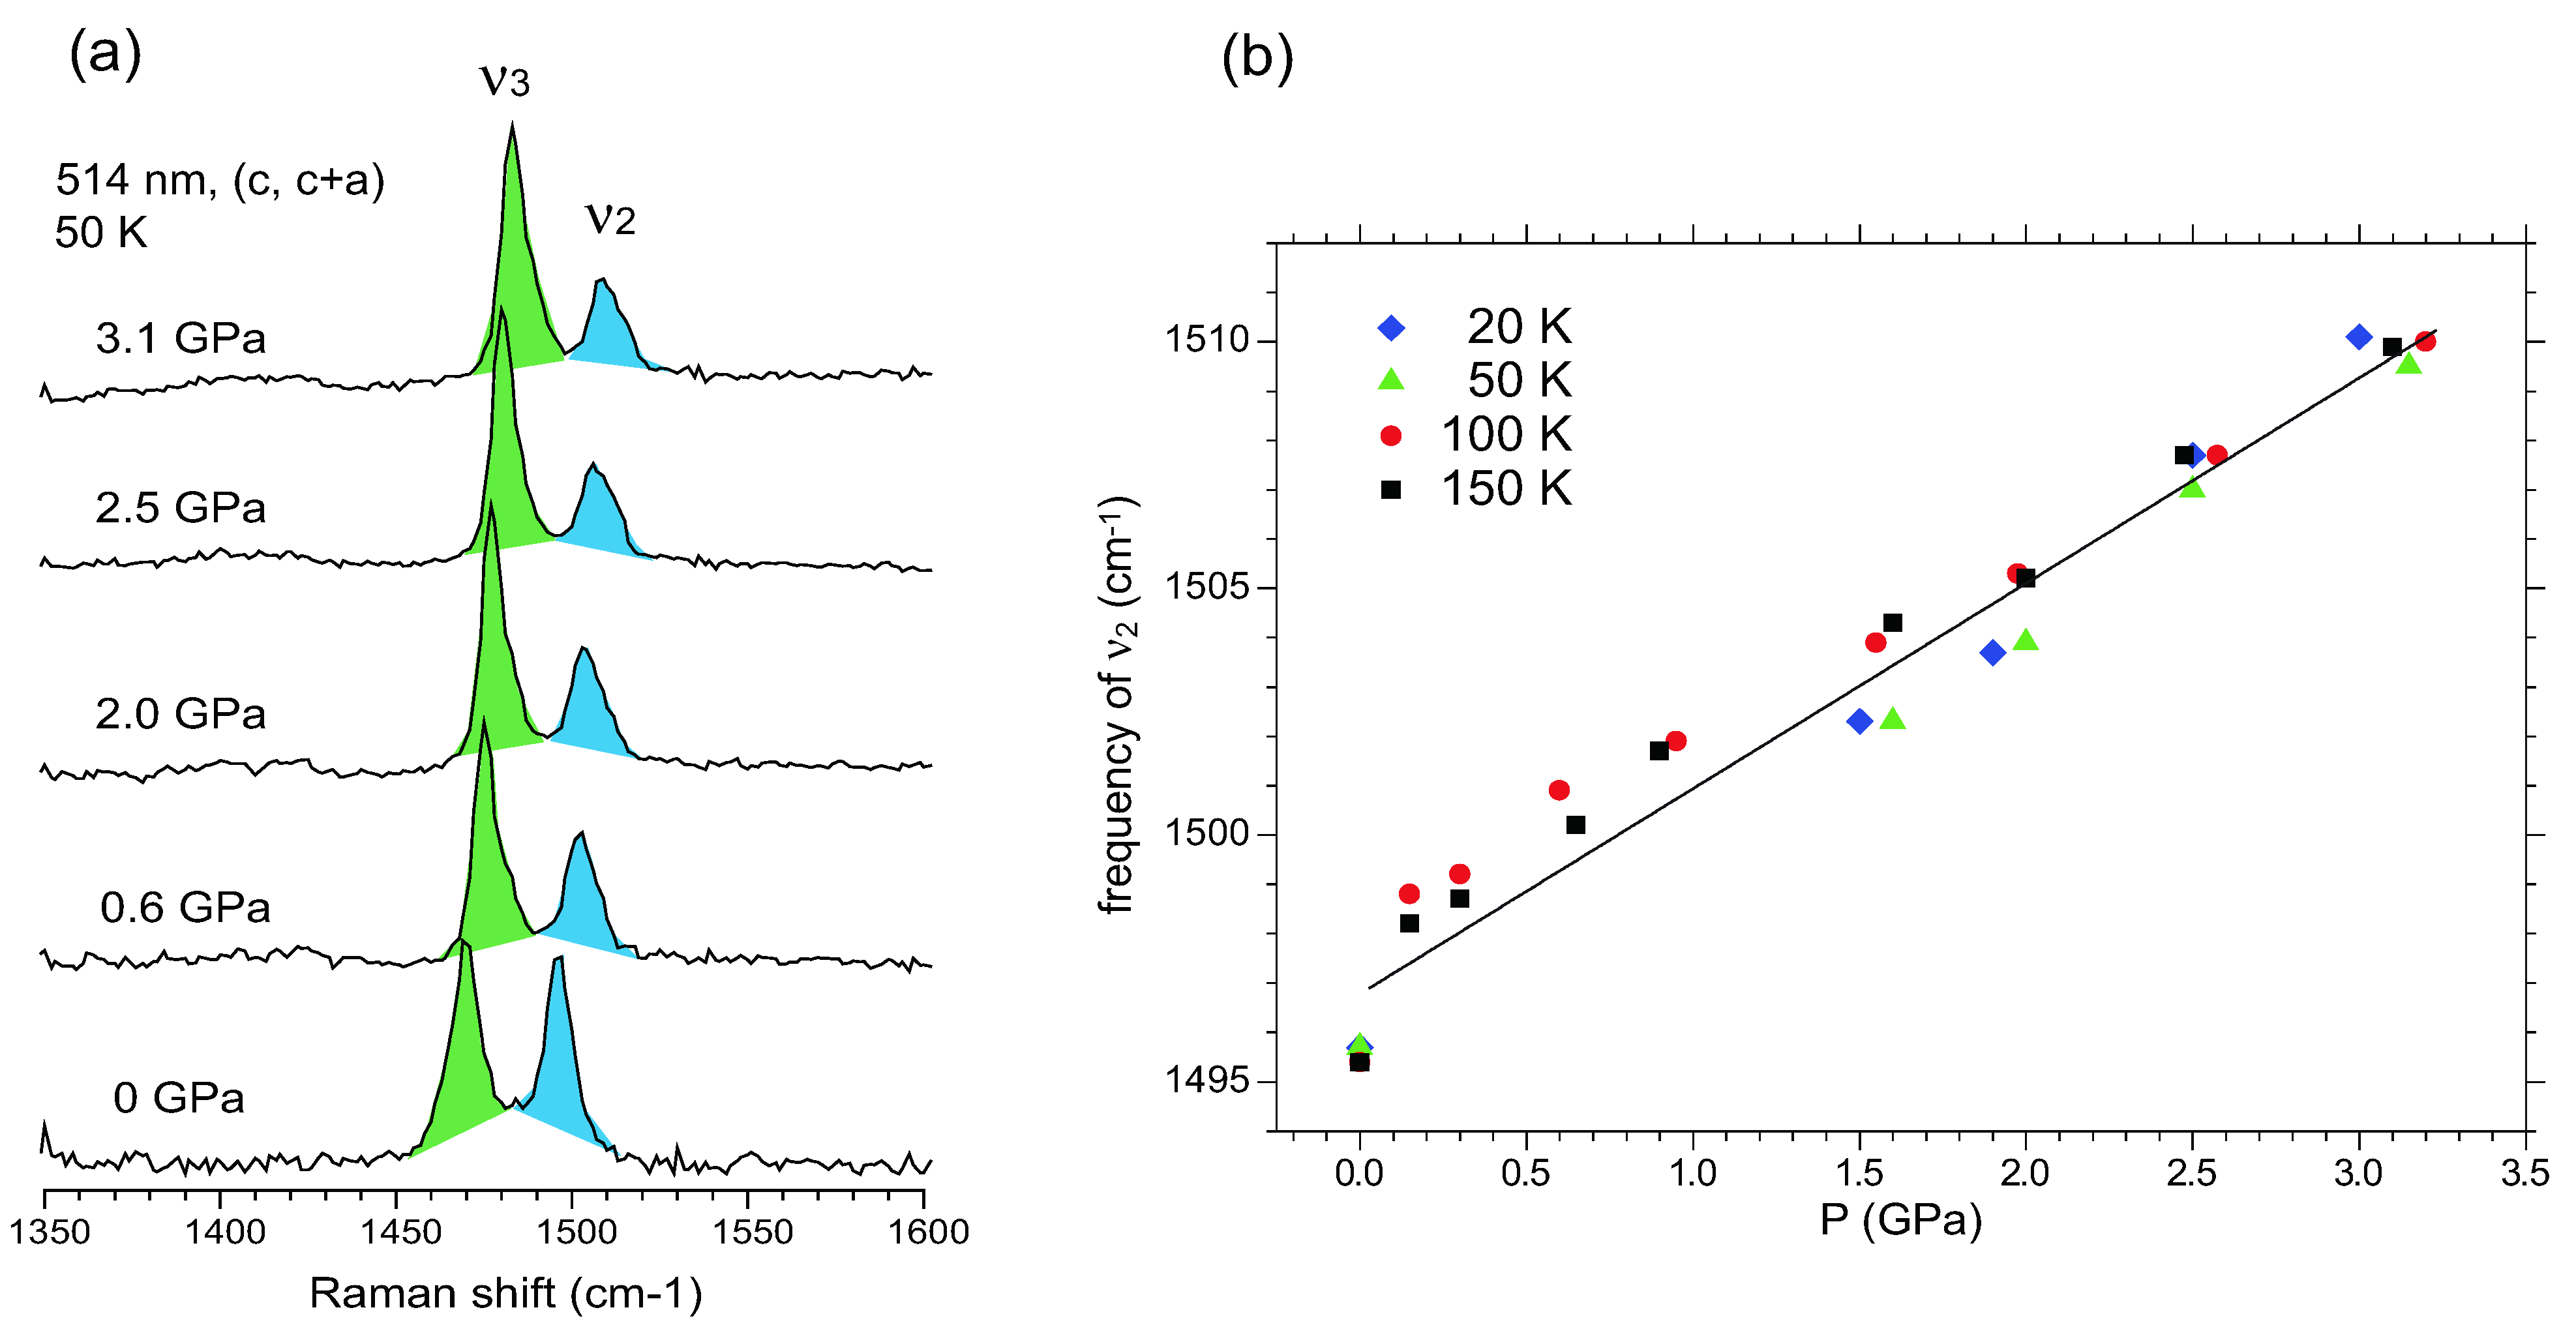
When hydrostatic pressure is applied, the molecular vibration shows a frequency upshift (ω + Δω) due to hardening of the lattice. In addition to the lattice phonon mode, the frequency shift against pressure is described by Δω/ΔP = ωγκ, where γ and κ are the Gruneisen constant and compressibility, respectively. Therefore, the pressure dependent frequency is given by the equation, ω(P) = ω(1 + γκP). It is found that γκ is approximately temperature independent within an error of 10% in the temperature range from 20 K to 150 K as shown in Figure 23b. Since the hydrostatic pressure induces no structural change in this compound, the parameter was estimated to be γκ ≈ 3 × 10⁻³ GPa−1 from Figure 23b.
Figure 24 shows the pressure dependence of the Raman spectrum of α-I3 at 150 K, 100 K, and 20 K. At 150 K, the compound is metallic at ambient pressure. On increasing pressure, the Raman spectrum does not show a drastic change. At 100 K and 20 K, the compound is in a CO phase at ambient pressure. In this case, remarkable spectral changes are found to occur between 0.1 GPa and 0.45 GPa at 100 K and between 1.2 GP and 1.5 GPa at 20 K. These spectral changes correspond to the phase transition from the CO phase to the metallic phase, which is consistent with the suppression of the MI transition by hydrostatic pressure. In the metallic phase, the ν21 and ν22 modes do not show a parallel shift, rather they tend to merge on increasing the pressure. This trend is much more remarkable in the CO phase as shown in Figure 24c. Hydrostatic pressure not only hardens the lattice but also modulates the transfer integrals non-uniformly, which changes the site-charge distribution. After eliminating the lattice hardening effect assuming γκ ≈ 3 × 10⁻³ GPa−1 for α-I3, the site charge is estimated using Equation (7). The results are shown in the bottom panel of each figure. In a CO phase, the amplitude of charge order decreases on increasing pressure [162]. This trend is probably associated with the increase of transfer integrals under hydrostatic pressure.
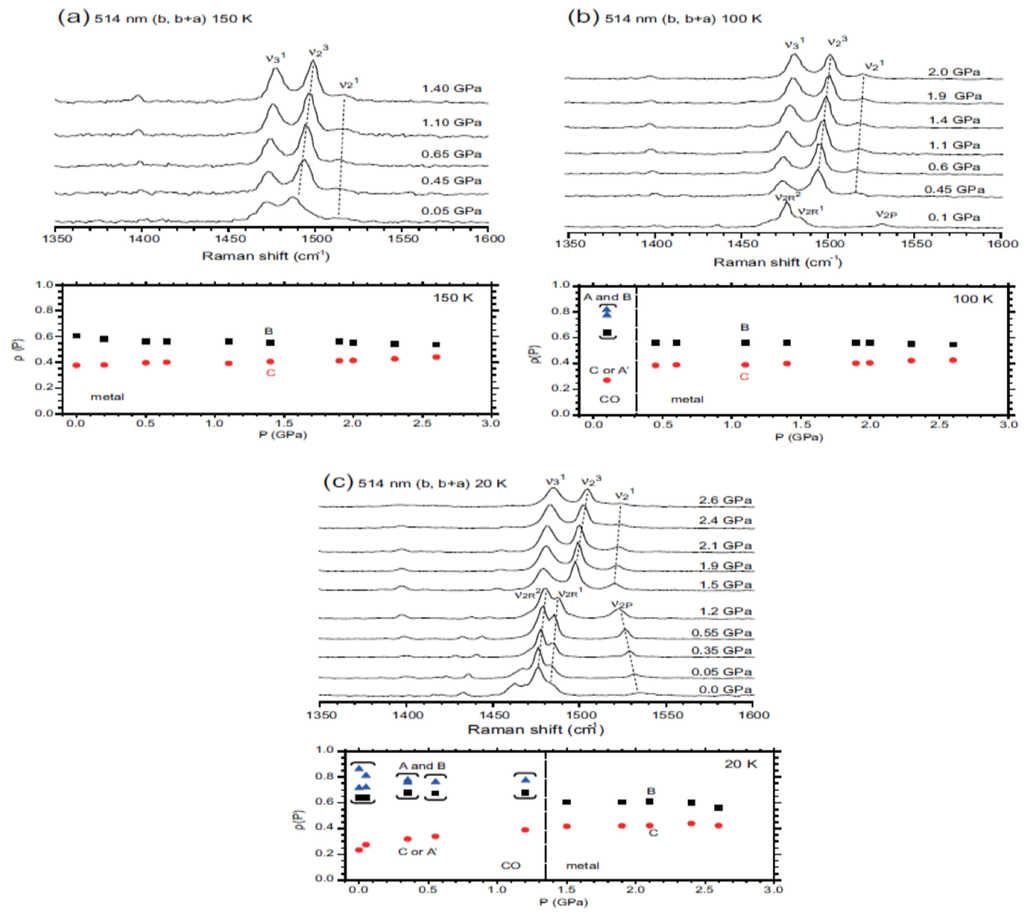
Figure 24.
Pressure dependence of the Raman spectra and site charges of α-(BEDT-TTF)2I3 analyzed at (a) 150 K; (b) 100 K; and (c) 20 K. Ambiguity of the hole numbers at charge-rich site is very large, because ν2R is mixed with ν3 in the CO state. The symbols, ▲ and ■, in parentheses show the nominal site charge calculated by Equation (7). Figure 24 is modified from Figure 5 of ref. [111].
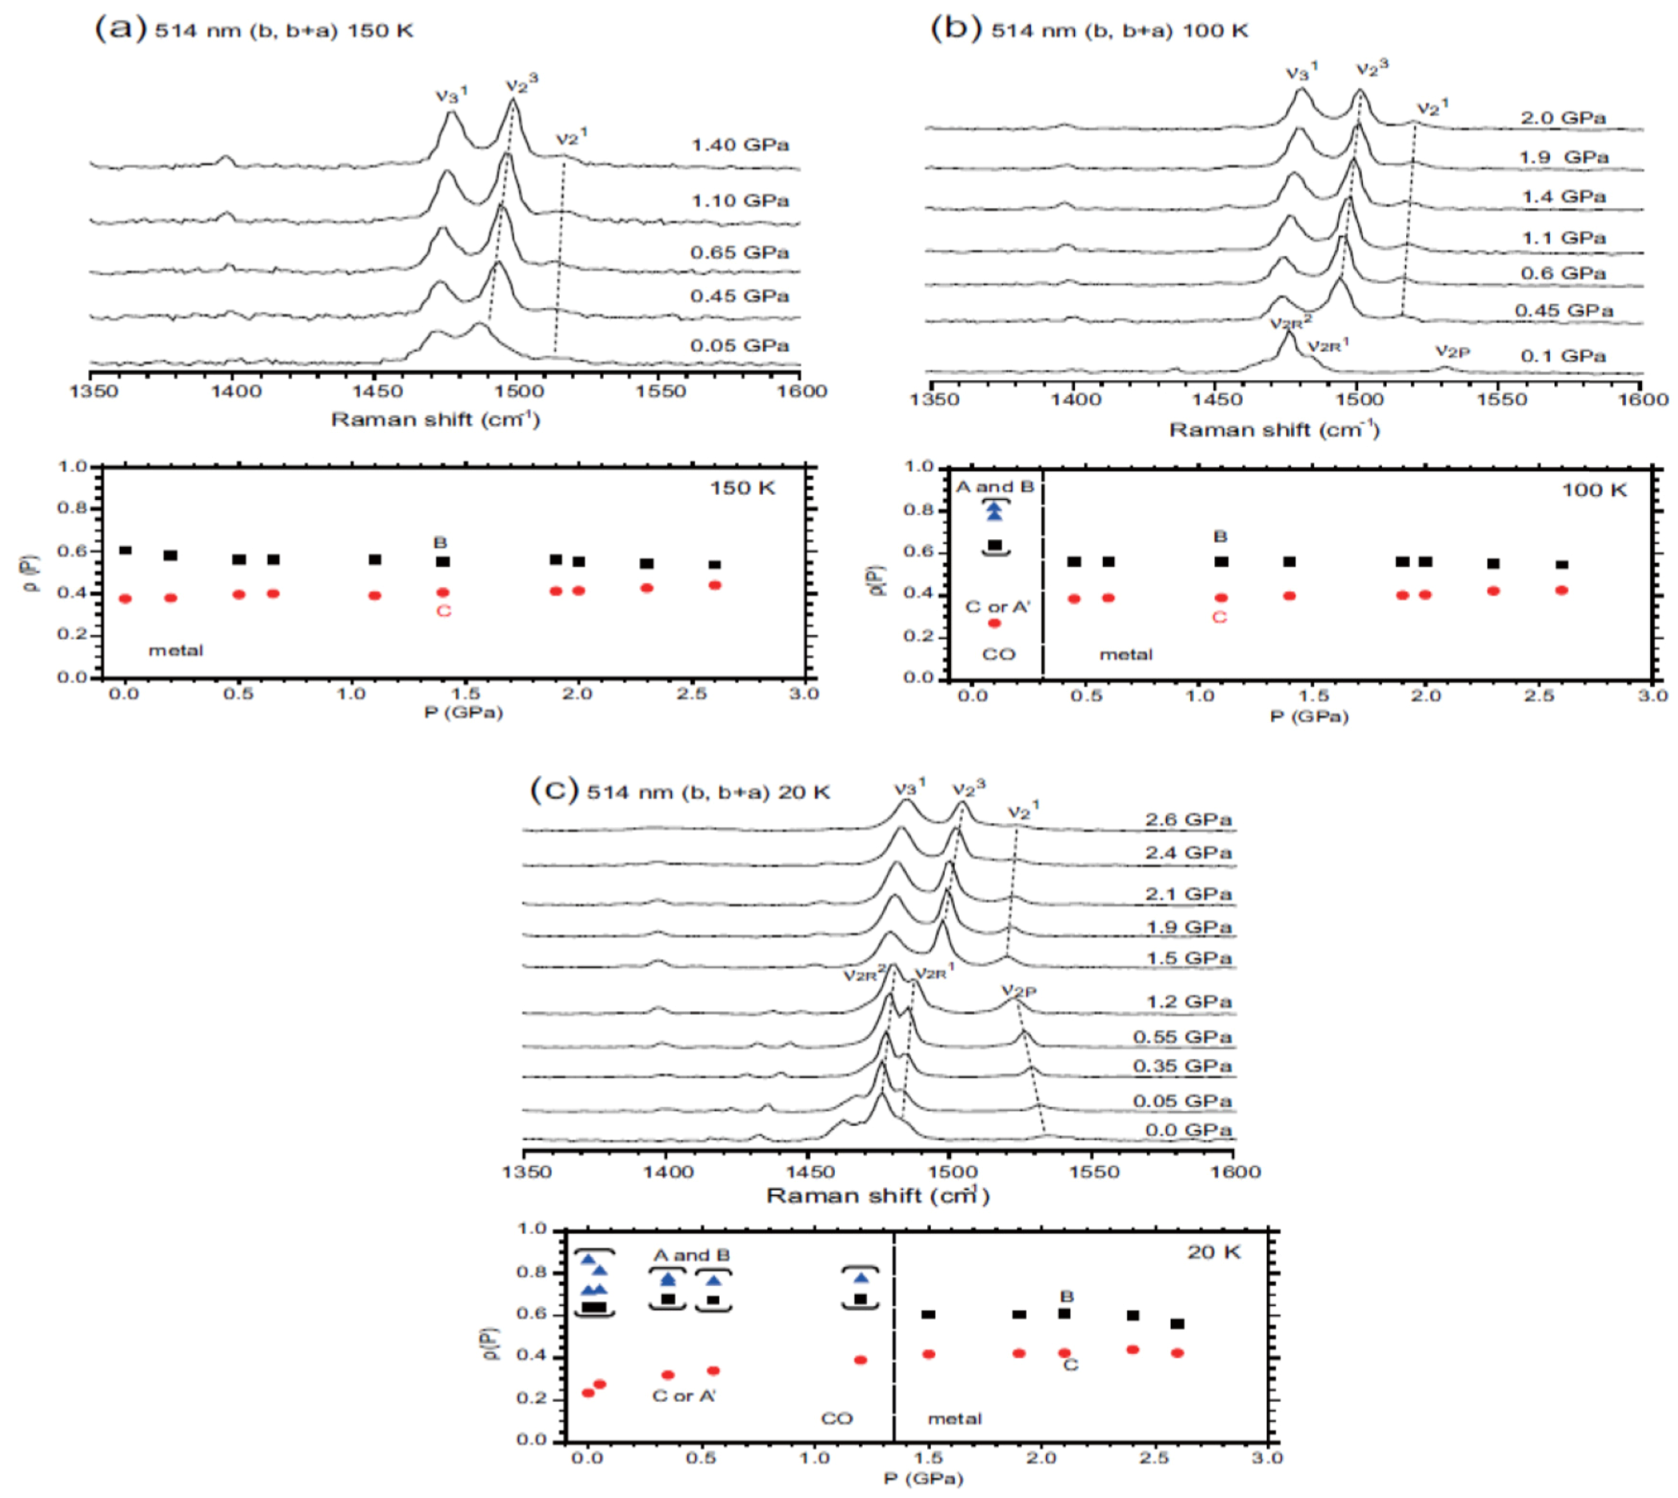
In a metallic phase, the site charges approach uniform charge distribution as in θ-I3 due to a non-uniform increase in transfer integrals on increasing hydrostatic pressure. This result suggests that the crystal structure of the zero-gap state of α-I3 is slightly modulated so as to equalize sites B and C. However, there still remains a site-charge difference in ZGS. Alemany et al., reported the band calculation of α-I3 [129] using the atomic parameters at 1.76 GPa that is determined by Kondo et al. [163]. They used the generalized gradient approximation to DFT, and found the contact point at the Fermi level. According to their calculation, the site hole numbers changes from ρA = ρA’ = 0.521, ρB = 0.546, ρC = 0.382 at ambient pressure to ρA = ρA′ = 0.576, ρB = 0.457, ρC = 0.361 at 1.76 GPa, where the most charge-rich site is interchanged between A=A′ and B sites and the maximum amplitude is enlarged from Δρmax = 0.164 at ambient pressure to Δρmax = 0.215. This change is opposite to the above mentioned trend shown in Figure 24a.
5.4. Optical Conductivity of α-(BEDT-TTF)2I3
The optical conductivity of α-I3 has been published by several groups. Yakushi et al., reported optical conductivity from 720 cm−1 to 25000 cm−1 [164]. They found a drastic change in reflectivity at TMI, and presented a calculation of the optical conductivity in the metallic phase based on a tight-binding approximation neglecting Coulomb interaction. The polarization (anisotropic) ratio of the optical weight was qualitatively reproduced. Zelezny et al., reported temperature dependent reflectivity in the range of 10–700 cm−1, and transmittance in the 10–33 cm−1 range [165]. They found a gap-like decrease in optical conductivity below 100 cm−1 in the CO phase, and they found a lattice phonon at 31.7 cm−1 in the E||b spectrum at 20 K. Dressel et al., reported optical conductivity in the range of 15–5500 cm−1 along with temperature-dependent microwave conductivity (10, 12, 35, 60, and 100 GHz) [166]. They determined the optical gap to be 400 cm−1, and found a strong phonon at 35 cm−1 below TMI. The similarity to the CDW system was pointed out from the experimental findings of non-linear transport, high dielectric permittivity, and 35 cm−1 band, although α-I3 is not a CDW system. More recently, Clauss et al., reported the optical conductivity in the range of 10–10000 cm−1 [133,167]. They found no Drude response above TMI, and they determined the CO gap to be 600 cm−1 below TMI. They estimated the effective transfer integrals comparing with theoretical calculation of the extended Hubbard model for a quarter-filled square lattice [40]. Figure 25 shows the reflectivity and optical conductivity of α-I3 that is reported by Yue et al. [130]. The optical conductivity agrees well with that reported by Clauss et al. [133,167]. According to the theoretical model by Merino et al. [40], the spectral weight of the electronic excitation at ~6t (t is the transfer integral of square lattice) in the CO phase shifts to ~2t–3t with Drude response in the metallic phase. The corresponding peak shift is not clear in the E||b spectrum. As Clauss et al., pointed out, the spectral weight in the infrared region shifts to the gap region in the metallic phase. This behavior is typically found in the E||a spectrum. No Drude response was observed in the metallic phase. It is difficult to specify the cause of non-Drude behavior, because the metallic phase exists only at high temperature, at which thermal excitations collapse the quasi-particle band as described for the optical conductivity of θ-I3 in Section 4.3, and/or they blur the small semimetallic Fermi surface. Incidentally, a well-defined Drude response is observed in α-MHg (M = NH4, K, Rb, Tl), because these compounds are a metallic down to low temperature [29,30].
The collective excitation in the CO state has been investigated in analogy with CDW. The experimental findings of large permittivity in the range of 50–50000 Hz and nonlinear conductivity of α-I3 in the CO phase recalled the sliding of CDW [166]. The observation of the voltage oscillation in the 7–28 kHz region suggests collective transport [168]. A recent permittivity experiment from 1 Hz to 1 MHz indicates the existence of a large dielectric relaxation mode [133,169]. Ivek et al., interpreted this low-frequency dielectric relaxation mode to be a phason-like behavior. Dressel et al., reported an attempt to find a collective CO mode in the low-frequency region, and they assigned the strong 35 cm−1 band to a collective CO excitation [170]. However, the corresponding strong band is not indicated in ref. [133,167]. Yue et al., reported the transmittance of the single crystal of α-I3.down to 28 cm−1 [130]. They confirmed the 31 cm−1 band which Zelezny et al., reported [165] but did not find such a strong band at 35 cm−1. More extensive experimental and theoretical studies will be necessary to establish collective CO excitation.

Figure 25.
Temperature dependent reflectivity and optical conductivity of α-(BEDT-TTF)2I3. The optical conductivities are taken from ref. [130].
Figure 25.
Temperature dependent reflectivity and optical conductivity of α-(BEDT-TTF)2I3. The optical conductivities are taken from ref. [130].
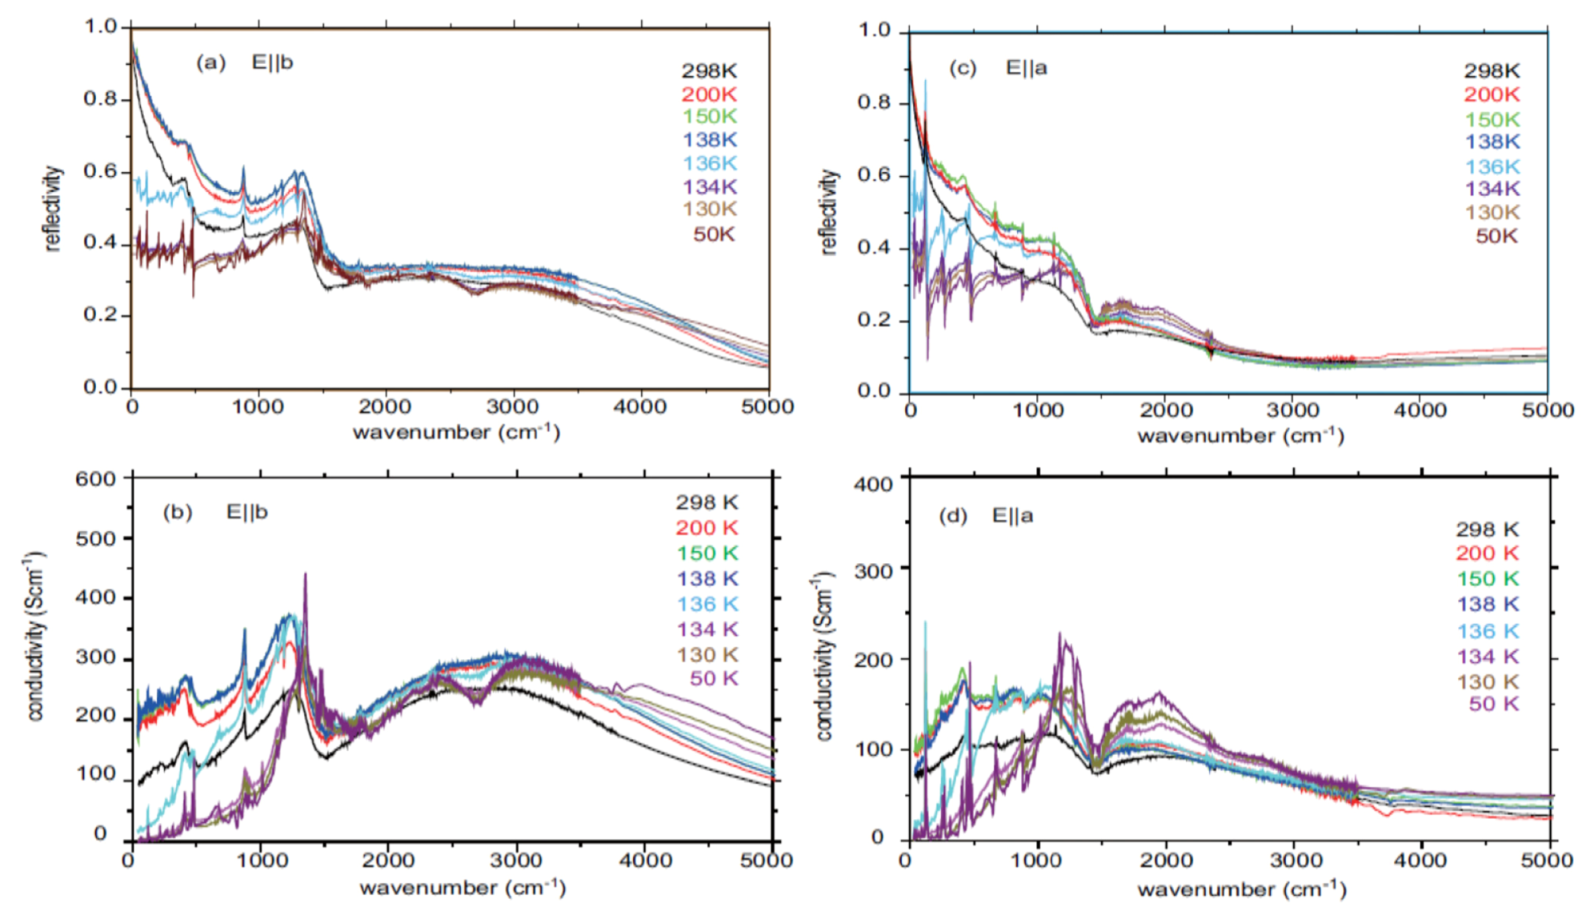
5.5. α′-(BEDT-TTF)2IBr2
α′-(BEDT-TTF)2IBr2 (abbreviated as α′-IBr2) has a layered structure similar to α-I3, but it is not isostructural with the α-type BEDT-TTF salts [171]. Similar to α-I3, the unit cell contains four molecules with a herringbone arrangement. Unlike α-I3, on the other hand, the unit cell contains two crystallographically independent groups (A, A′) and (B, B′), in which A and A′ (B and B′) are connected by inversion symmetry within each group. The band structure is calculated to be semimetallic, and the bandwidth of α′-IBr2 is the narrowest among the α-type BEDT-TTF salts [171]. Reflecting the narrow bandwidth, α′-IBr2 is semiconducting (ρRT~0.3 Ωcm) with an activation energy of ~0.16 eV at around room temperature. The electrical resistivity increases steeply by an order of magnitude at around 200 K, and this compound moves into a high-resistivity state with the same activation energy [172]. The phase transition of α′-IBr2 was investigated by means of NMR [173] and x-ray diffraction [171,174] experiments. The NMR study suggested that the thermal motion of the ethylene groups of BEDT-TTF begins to freeze gradually at around 250 K [173]. X-ray diffraction study confirmed this suggestion analyzing the temperature factors of the carbon atoms in one of the ethylene groups [171]. The ordering of the ethylene group occurs continuously from room temperature down to 70 K. Except for this ordering, no distinct structural change was reported above and below 200 K. Neither superlattice spots nor diffuse x-ray scattering has been found down to 20 K [171]. The magnetic susceptibility also shows no clear anomaly at around 200 K [172]. Inokuchi et al., reported the optical conductivity and Raman spectrum of this compound, and they suggested that the unit cell involves two non-equivalent molecules with different valence [175]. X-ray diffraction study suggested that the electron-phonon interaction is extremely weak in this system.
Yue et al., investigated the infrared and Raman spectra of α′-IBr2, and assigned the Raman spectrum with the aid of polarization dependence and 13C-substituted compounds [176]. Based on the assignment, they showed clear evidence that the low-temperature high-resistivity phase is a charge-ordered state. Combined with the ν27 mode, they estimated the site charge distribution to be (0.9, 0.8, 0.2, 0.1), and thus the maximum CO amplitude is very large, Δρmax = 0.8. Although the side band of ν27R2 (indicated by an arrow in Figure 26) is assigned to CH2 bending mode, it may be assigned to ν27R1 instead of another side band, because the low-frequency side band is observed in the deuterium-substituted compound. In this case, the site charge distribution and Δρmax are estimated to be (1.0, 0.8, 0.2, 0.1) and Δρmax = 0.9. Furthermore, they found that the inversion symmetry is broken in the CO state. If the unit cell has inversion symmetry, the ν2 mode is classified into two Raman-active (in-phase) modes and two infrared-active (out-of-phase) modes. In the CO phase, they found four ν2 modes in the Raman spectrum of the 13C-substituted α-IBr2. They took notice of the stretching vibration of IBr2− as a marker band for the inversion symmetry. However, the splitting of this band seems not to be decisive to judge the breaking of inversion symmetry, as the frequency of this mode is comparable with the lattice phonon. Since IBr2− is not located on the center of symmetry in the unit cell, the intramolecular vibration is influenced by the non-centrosymmetric crystal field. The ν2 or ν3 mode is much safer as a marker band. Taking the symmetry into account, they proposed two possible arrangements, diagonal stripes along the a-b and b axes, as the CO pattern. These two stripes are probably competing and generate frustration in this compound.
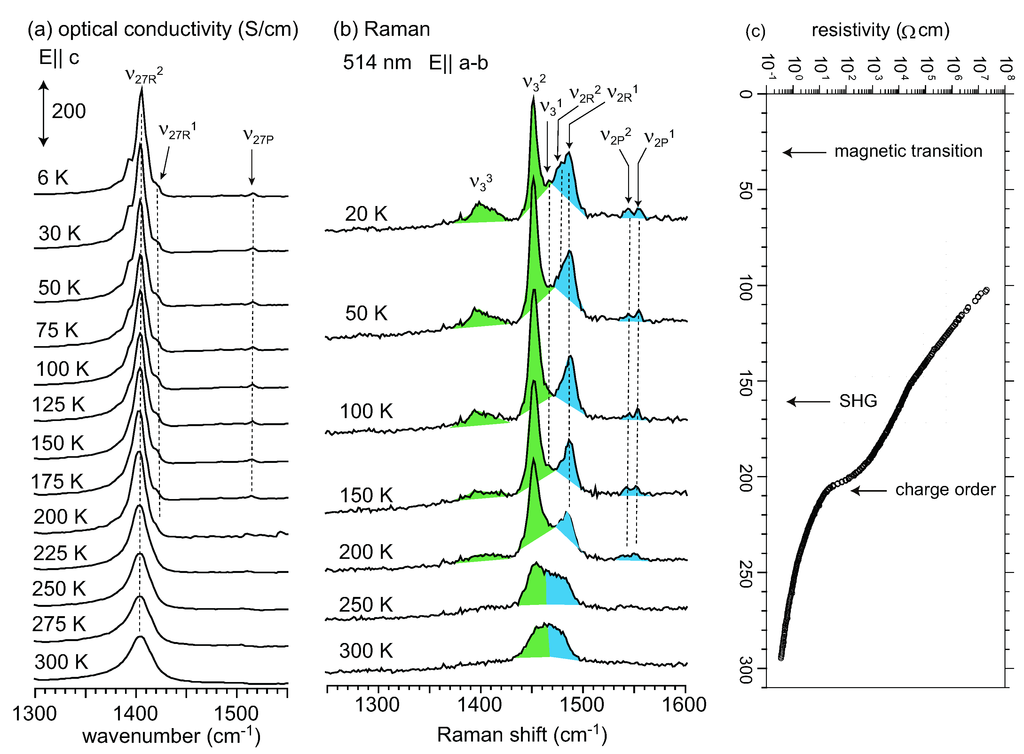
Figure 26.
Temperature dependences of the (a) Infrared-active ν27 mode; (b) Raman-active ν2 and ν3 modes; and (c) electrical resistivity in α′-(BEDT-TTF)2IBr2. See ref. [176] for the argument of assignment. Figure 26a,c are taken from ref. [58].
Figure 26.
Temperature dependences of the (a) Infrared-active ν27 mode; (b) Raman-active ν2 and ν3 modes; and (c) electrical resistivity in α′-(BEDT-TTF)2IBr2. See ref. [176] for the argument of assignment. Figure 26a,c are taken from ref. [58].

Yue et al., analyzed the resistivity and magnetic susceptibility [58]. They found that the resistivity curve is approximately expressed by a single exponential curve below ~210 K, whereas it cannot be expressed by a single exponential curve above ~210 K, where the activation energy exponentially decreases against 1/T. The magnetic susceptibility is expressed by an alternating Heisenberg model down to 30 K. At around 30 K this compound abruptly loses susceptibility and becomes non-magnetic with hysteresis [177]. They pointed out that every crystal cracked when the crystal was cooled across this transition temperature. As the deuterium substituted α’-IBr2 does not show the 30 K phase transition, the interaction with IBr2− may be associated with this magnetic phase transition. Yamamoto et al., found an onset of SHG at 160 K using an SHG microscope, and they argued for the growth of ferroelectric polarization below 160 K [136,178]. Therefore, this compound has three phase transitions at ~210 K, ~160 K, and ~30 K. This behaviour is different from that of α-I3, in which all of these transitions occur at the same temperature (~135 K).
Figure 26 shows the infrared-active ν27 mode and Raman-active ν2 and ν3 modes along with the electrical resistivity [58]. The charge-sensitive ν27 and ν2 modes are already split at room temperature, and the spectral change against temperature is continuous as in θ-Cu2(CN)[N(CN)2]2 and θm-TlZn. It is therefore obvious that the line shapes of the ν27 and ν2 modes reflect the case of τΔν >> 1 over the whole temperature range. On increasing temperature, as shown in Figure 26b, the ν3 mode is weakened toward the transition temperature at ~210 K. This spectral change suggests shortening of the coherence length ζ of the CO domain [58]. The optical conductivity has a clear gap below 200 K, whereas it has finite density of states above 210 K. The temperature dependence is continuous as for θm-TlZn. In the limit of ζ = 0, the individual holes, perhaps polaron, are randomly hopping at high temperature. Assuming this extreme case, Yue et al., interpreted the phase transition at 210 K as an order-disorder transition [58]. They qualitatively explained the optical conductivity change based on the order-disorder model of the atomic limit. According to this simple model, the finite density of states above 210 K is generated by the disordered configurations of localized holes, the energy of which is given by the coordination number around the hole [58,177]. The electrical and magnetic properties and spectroscopic feature closely resemble those of θ-Cu2(CN)[N(CN)2]2, hence the high-temperature phase might be understood in the same way as θ-Cu2(CN)[N(CN)2]2, in which the short-range CO domain grows extensively. However, strong frustration perhaps suppresses the growth of short-range order in this compound.
This simple model cannot explain the difference in temperature between the order-disorder (~210 K) and ferroelectric (~160 K) transitions. In the atomic limit, the Coulomb repulsion along two diagonal stripes is nearly the same. These nearly degenerate short-range CO domains compete with each other and generate frustration, when the coherence length of CO increases. This frustration may cause the above successive ferroelectric transition. Recently, weak superlattice spots for a × b × 2c were found in an x-ray study conducted at BL-8A beamline of the Photon Factory Facility, KEK [179]. Based on the structural modulation, an antiferroelectric state is proposed as the intermediate phase (160–210 K) before the ferroelectric transition.
Yue et al., estimated the kinetic energy from the integration of optical conductivity [177], which is 0.1, 0.3, and 0.4 eV per unit cell for α′-IBr2, α-I3, and α-NH4Hg, respectively. This result indicates that the transfer integrals of α′-IBr2 are very small compared with those of α-I3, and α-NH4Hg. Therefore, in the case of α′-IBr2, the spin degree of freedom survives after the CO transition due to the small spin gap (~82 K) coming from the small exchange energy along the stripe. On the other hand, in α-I3, the exchange energy is larger and the dimerization along the stripe is larger than that in α′-IBr2, and furthermore, the dimerization is enhanced below the phase transition of α-I3 [128,171]. These two factors result in a large spin gap (440 K) as reported by Sugano et al. [180]. The difference in the magnitude of spin gap is the cause of the simultaneous transition of charge order and non-magnetic state. The difference in ferroelectric transition is not clear at the moment. Possibly, the frustration plays a role in the successive transition to the ferroelectric state in α′-IBr2.
6. Summary
The charge-ordering phase transition arises from the competition between the kinetic energy gain and the cost of on-site and nearest-neighbor inter-site Coulomb energy. In some compounds such as θ-type BEDT-TTF salts, geometrical frustration stabilizes the metallic state, and lattice distortion sometimes plays a dominant role for dissolving the frustration. Even in such a case, the transfer integral plays an essential role for the properties of the materials [78]. Transfer integrals depend considerably on the counter anions and temperature, whereas Coulomb interaction is almost insensitive to such a modification. The rough values of the kinetic energy per unit formula (=hole) are shown in Figure 27, which are estimated from the room-temperature optical conductivity [181]. The kinetic energy is a stabilization energy due to the delocalization of the valence electron over the crystal. The kinetic energy is associated with the bandwidth: the wider the bandwidth, the larger the kinetic energy. The kinetic energy including the correlation effect is experimentally estimated from the optical conductivity [182]. The kinetic energy –EK was calculated in the same way as reported by Yue et al. [177].
The kinetic energy of β″-(BEDT-TTF)(TCNQ) is comparable with those of θm-TlZn and θo-TlZn, which undergo a metal-insulator transition while maintaining a large CO amplitude (Δρ~0.6) over the whole temperature range. In contrast to the θ-type salts, this compound continuously changes the spectral feature from a large CO amplitude (Δρ~0.6) to a small amplitude (Δρ~0) on lowering the temperature. Experimentally, the split charge-sensitive modes merge into a single mode in the low-temperature region. The transport properties below 20 K indicate Fermi-liquid behavior. It is speculated from the optical conductivity and charge-sensitive modes that the coherent state below 20 K collapses above 20 K and continuously changes into a charge-ordered metal with a pseudogap. As the hydrostatic pressure reproduces the same spectral change for the Raman-active mode, the variation of the transfer integral due to lattice contraction has a big influence on the electronic state of this compound.

Figure 27.
Kinetic energy per a formula unit (■) plotted as a function of the lattice parameter ratio. In the case of the θ-type crystal, the crystal axis along the stacking direction is doubled. The inset shows the schematic molecular arrangement and crystal axes. In the compounds framed by the green rectangle, the CO amplitude is small (Δρ~0.1) over the whole temperature range. In the compounds framed by the yellow rounded rectangle, the CO amplitude is large (Δρ~0.6) over the whole temperature range. In the compound framed by the triangle, the CO amplitude changes at the phase transition, small amplitude (Δρ~0.2) at high temperature and large amplitude (Δρmax~0.6) at low temperature. In the compound framed by the inverted triangle, the amplitude changes continuously, large amplitude at high temperature (Δρ~0.6) and small amplitude (Δρ~0) at low temperature.
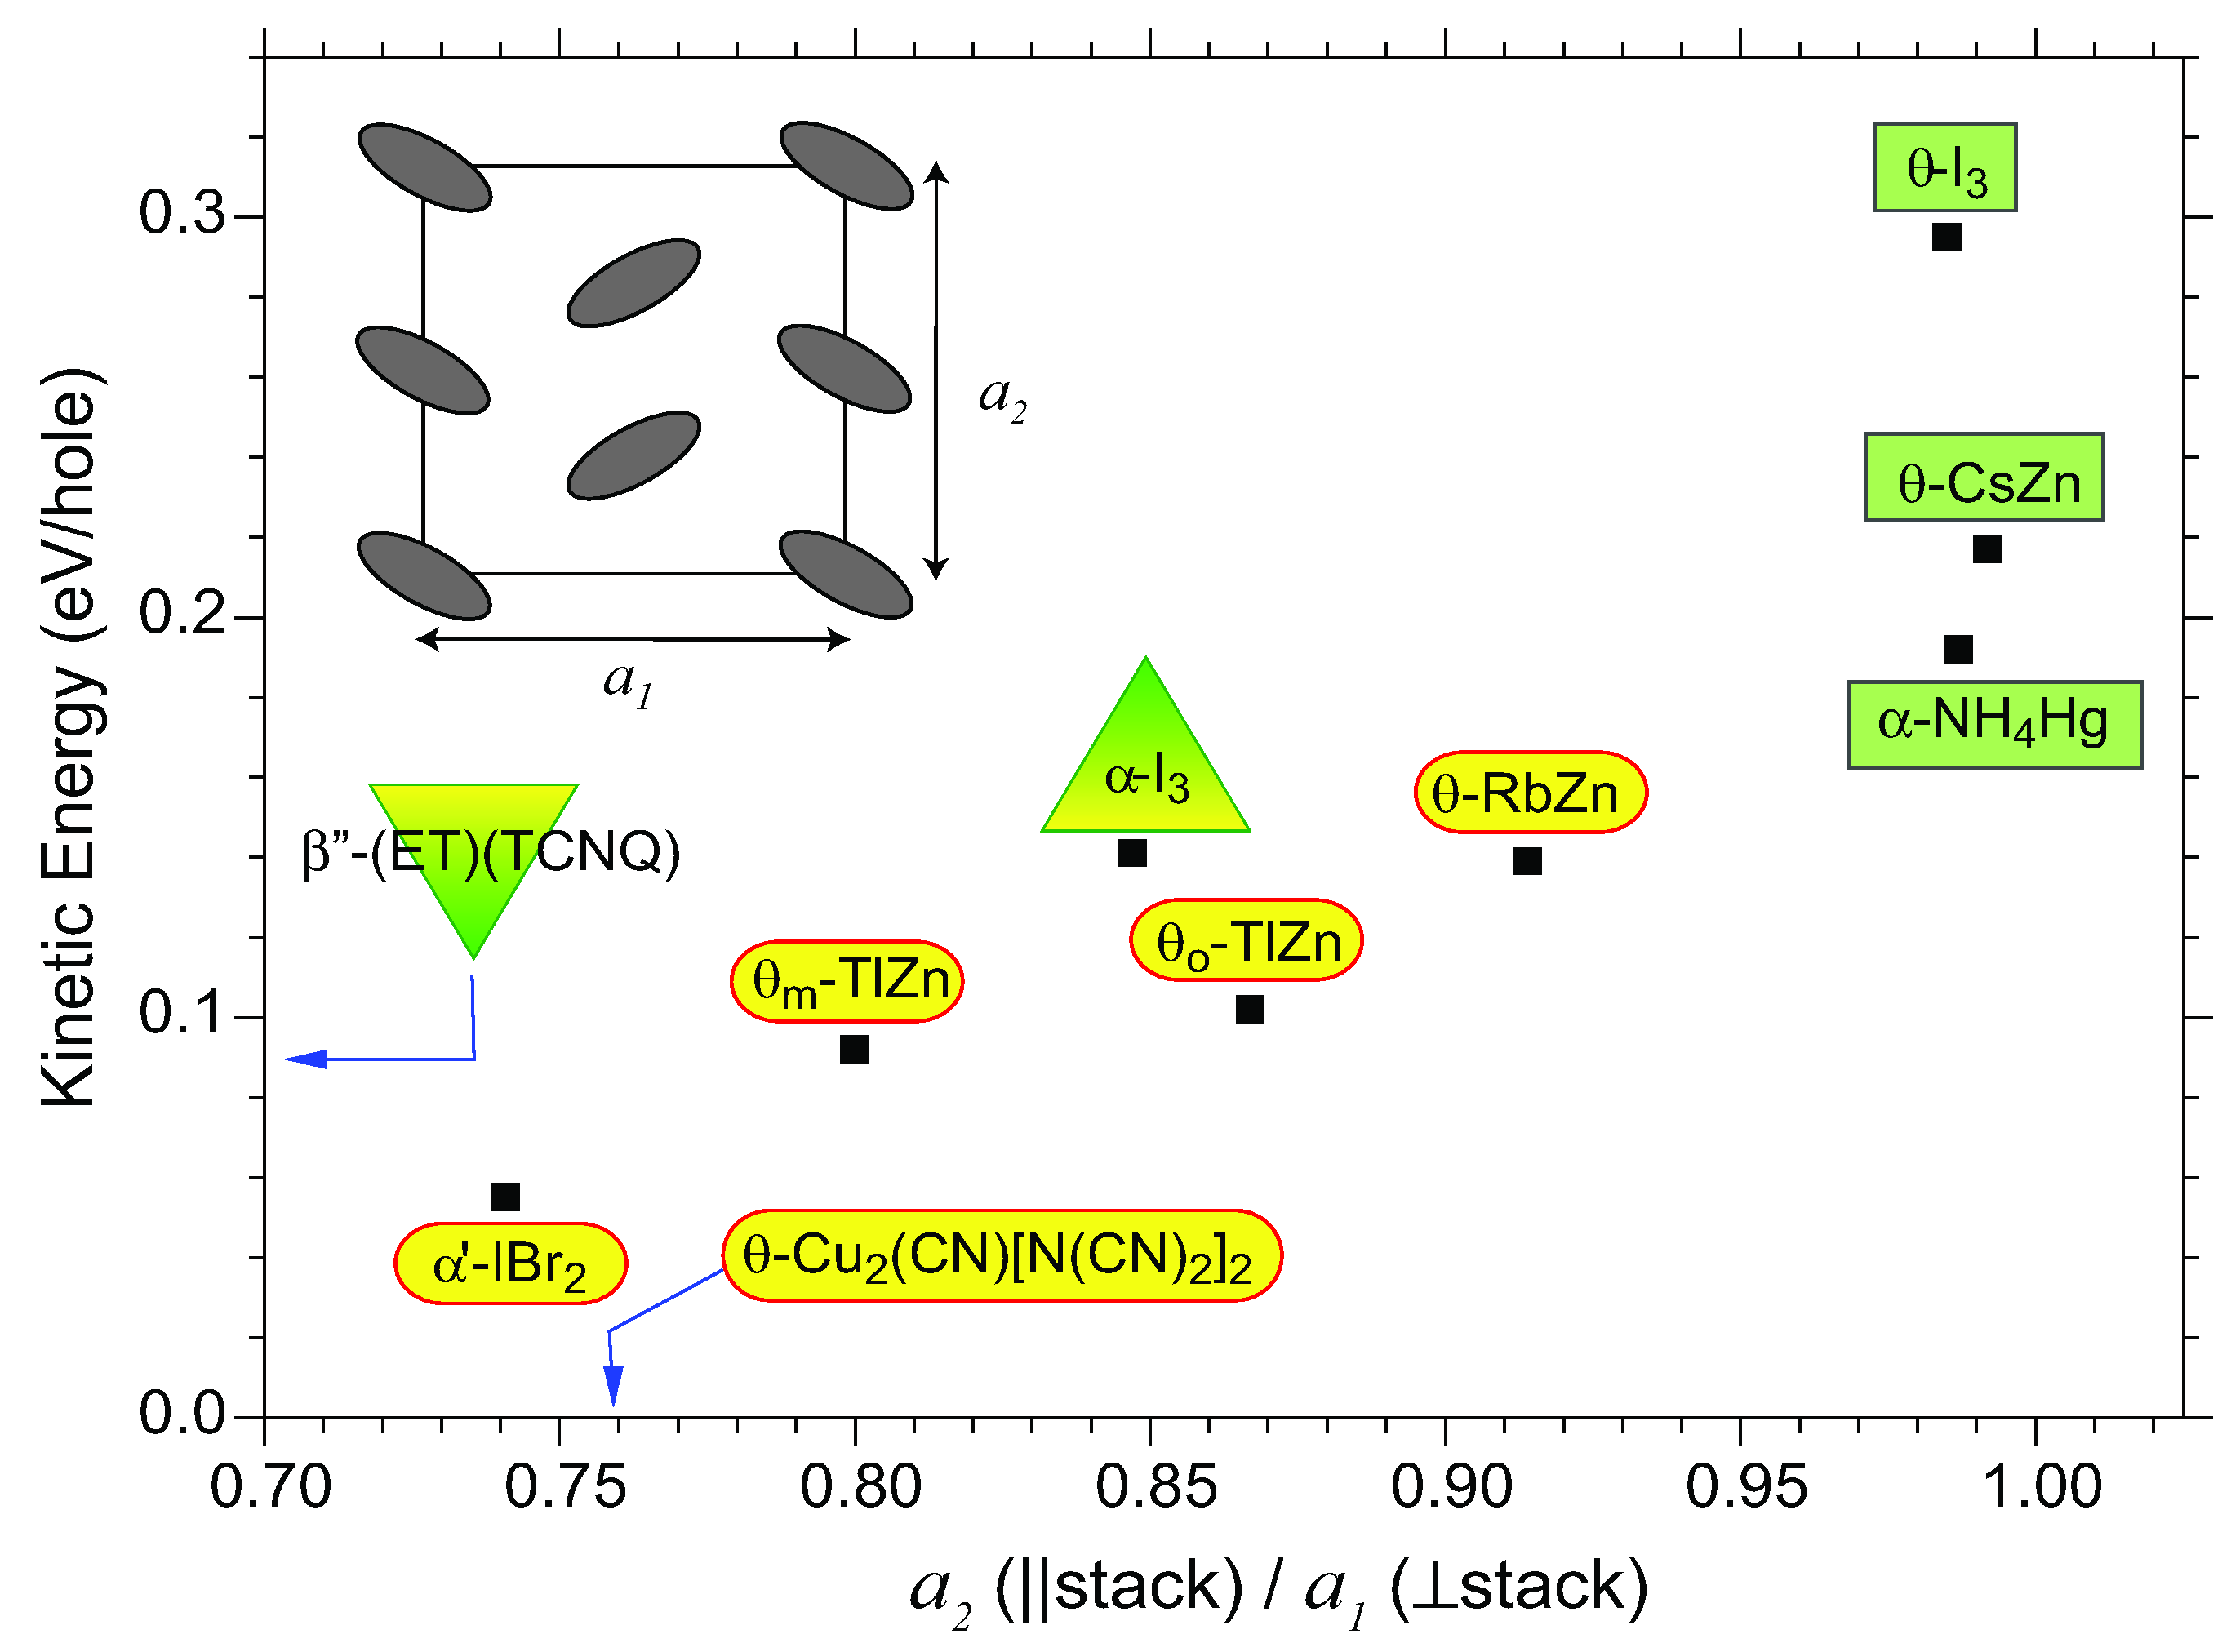
The four θ-type BEDT-TTF salts, θ-RbZn, θo-TlZn, θm-TlZn, and θ-Cu2(CN)[N(CN)2]2, (yellow color in Figure 27) show an MI transition. However, they maintain a large CO amplitude (Δρ~0.6) in both metallic and insulating phases. In the CO phase of the θ-type BEDT-TTF salts, the CO pattern is a horizontal stripe in θ-RbZn, θo-TlZn, and θ-Cu2(CN)[N(CN)2]2, as concluded by the selection rule of the ν3 modes. On the other hand, the diagonal stripe is claimed in θm-TlZn. In contrast to the α-type BEDT-TTF salts, the θ-type compounds except θm-TlZn have a non-polar space group P212121 in the CO phase. Probably, the θ-type compounds except for θm-TlZn do not have ferroelectric polarization in the CO phase in spite of the non-centrosymmetric space group. As the CO amplitude is large even in the metallic phase, this phase is regarded as a CO metal. However, the compound can be classified into two groups, [θ-RbZn, θo-TlZn] and [θm-TlZn, θ-Cu2(CN)[N(CN)2]2]. The phase transition in the former is discontinuous, whereas it is continuous in the latter. The activation energy of the resistivity in the latter is significantly larger, and the precursor ν3 bands are found in the latter. In the metallic phase of the latter group, short-range stripe CO probably grows more extensively than in the former group.
The kinetic energy of θ-CsZn and θ-I3 is significantly larger than the others among the θ-type BEDT-TTF salts (green color in Figure 27). The CO amplitude of these compounds is much smaller than in the others. The amplitude of the former is Δρ < 0.08, and Δρ < 0.07 in the latter. An indication of CO fluctuation is found in the Raman spectrum and optical conductivity of θ-CsZn, in which the frustration between the stripe and threefold COs is dominant. θ-I3 has a zero-energy (Drude) peak in the optical conductivity at 4 K, while the coherent state collapses at 100 K.
The kinetic energy of α-I3 is comparable with that of θ-RbZn. The amplitude of CO discontinuously changes from a small amplitude (at high temperature) to a large amplitude (at low temperature) at the MI transition temperature. Below the MI transition temperature, the localized charge is arranged in a horizontal stripe involving two charge-rich sites and two charge-poor sites with an amplitude of Δρ ≈ 0.4–0.6. In the CO phase, the inversion symmetry is broken, and strong SHG is found. Observation of a macroscopic polar (ferroelectric) domain is demonstrated by SHG interferometry. A fast optical response is also reported. This unconventional ferroelectricity is called electronic ferroelectricity. In the metallic phase, the broad linewidth of the charge-sensitive mode indicates fluctuation of the CO. This fluctuation is well suppressed by hydrostatic pressure.
The kinetic energy of α-NH4Hg is significantly larger than that of α-I3. The linewidth of the charge-sensitive mode is narrow in α-MHg (M = NH4, K, Rb, Tl). Among these four compounds, the inversion symmetry is locally broken in α-MHg (M = K, Rb, Tl). This phenomenon is attributed to the anion-sublattice coupled incommensurate CDW. The amplitude of the CDW is estimated to be Δρ < 0.05. On the other hand, the fluctuation of CO is indicated in the Raman spectrum of α-NH4Hg which undergoes superconducting state at 1 K.
α-I3 in the metallic phase and α-NH4Hg involve three non-equivalent sites in the unit cell. Reflecting the non-uniform site, the charge-sensitive mode split into three. The maximum site-charge difference is estimated to be Δρmax~0.2 both in metallic α-I3 and α-NH4Hg. The most charge-poor site is the C site in α-I3 and the A site in α-NH4Hg. First principle calculation agrees with the experimental results for α-I3. In α-NH4Hg, however, there is disagreement in the most charge-poor site, between the band calculation and the interpretation of the charge-sensitive mode. The site charge distribution under hydrostatic pressure is estimated for α-I3 and θ-I3. In the metallic phase, the site charge distribution approaches a uniform charge distribution on increasing pressure. However, a non-uniform site charge distribution remains in the zero-gap state of α-I3. The zero-gap state of θ-I3 under hydrostatic pressure keeps uniform charge distribution unlike in α-I3.
The kinetic energy of α′-IBr2 is smallest among the compounds discussed in this paper, and probably comparable with that of θ-Cu2(CN)[N(CN)2]2. The electrical and magnetic properties and spectroscopic feature closely resemble each other. The ground state is a non-magnetic CO state with large amplitude (Δρ ≈ 0.6–0.8). α′-IBr2 shows successive transitions at ~210 K and ~160 K and magnetic transition at ~30 K. The large CO amplitude is maintained over the whole temperature range. The ordering of charge sets in at ~210 K, the ferroelectric domain begins to grow at ~160 K, and spin singlet state is formed at ~30 K accompanied by structural distortion.
Acknowledgments
The author deeply thanks all the collaborators for their invaluable contribution to this work. In particular, collaborations and discussions with K. Yamamoto, M. Uruichi, and T. Yamamoto of Institute for molecular science, A. Kawamoto of Hokkaido University, and H. M. Yamamoto and R. Kato of RIKEN are highly appreciated. This work was partly supported by a Grant-in-Aid for Scientific Research (Grant No. 19350074) from MEXT Japan.
References and Notes
- Girlando, A.; Bozio, R.; Pecile, C. Infrared and Raman spectroscopic evidence of ground state charge densities at TCNQ sites in crystalline Cs2TCNQ3. Chem. Phys. Lett. 1974, 25, 409–412. [Google Scholar]
- Bozio, R.; Girlando, A.; Pecile, C. Vibrational analysis of spectra of quinoid molecular ions. J. Chem. Soc. Faraday Trans. 1975, 71, 1237–1254. [Google Scholar] [CrossRef]
- Matsuzaki, S.; Kuwata, R.; Toyoda, K. Raman spectra of conducting TCNQ salts; estimation of the degree of charge transfer from vibrational frequencies. Solid State Commun. 1980, 33, 403–405. [Google Scholar]
- Chappell, J.S.; Bloch, A.N.; Bryden, W.A.; Maxfield, M.; Poehler, T.O.; Cowan, D.O. Degree of charge transfer in organic conductors by infrared absorption spectroscopy. J. Am. Chem. Soc. 1980, 103, 2442–2443. [Google Scholar]
- Kagoshima, S.; Ishiguro, T.; Anzai, H. X-ray scattering study of phonon anomalies and superstructures in TTF-TCNQ. J. Phys. Soc. Jpn. 1976, 41, 2061–2071. [Google Scholar] [CrossRef]
- Kondo, J.; Yamaji, K. Density correlation of classical 1-d electron gas with reference to the 4κF anomaly in TTF-TCNQ. J. Phys. Soc. Jpn. 1977, 43, 424–436. [Google Scholar] [CrossRef]
- Torrance, J.B. Spin waves, scattering at 4κF, and spin-Peierls fluctuations in organic metal: Tetrathiafulvalene-Tetracyanoquinodimethane (TTF-TCNQ). Phys. Rev. 1978, 17, 3099–3103. [Google Scholar] [CrossRef]
- Hubbard, J. Generalized wigner lattices in one dimension and some applications to tetracyanoquinodimethane (TCNQ) salts. Phys. Rev. 1978, 17, 494–505. [Google Scholar] [CrossRef]
- Hiraki, K.; Kanoda, K. Wigner crystal type of charge ordring in an organic conductor with a quarter-filled band: (DI-DCNQI)2Ag. Phys. Rev. Lett. 1998, 80, 4737–4740. [Google Scholar] [CrossRef]
- Seo, H.; Fukuyama, H. Antiferromagntic phases of one-dimensional quarter-filled organic conductors. J. Phys. Soc. Jpn. 1997, 66, 1249–1252. [Google Scholar] [CrossRef]
- Chow, D.S.; Zamborszky, F.; Alavi, B.; Tantillo, D.J.; Baur, A.; Merlic, C.A.; Brown, S.E. Charge ordering in the TMTTF family of molecular conductors. Phys. Rev. Lett. 2000, 85, 1698–1701. [Google Scholar] [CrossRef]
- Moldenhauer, J.; Horn, C.; Pokhondnia, K.I.; Schweitzer, D.; Heinen, I.; Keller, H.J. FT-IR absorption spectroscopy of BEDT-TTF radical salts: Charge transfer and donor-anion interaction. Synth. Metal. 1993, 60, 31–38. [Google Scholar] [CrossRef]
- Kino, H.; Fukuyama, H. On the phase transition of α-(ET)2I3. J. Phys. Soc. Jpn. 1995, 64, 1877–1880. [Google Scholar] [CrossRef]
- Takano, Y.; Hiraki, K.; Yamamoto, H.M.; Nakamura, T.; Takahashi, T. Charge disproportionation in the organic conductor, α-(BEDT-TTF)2I3. J. Phys. Chem. Solid 2001, 62, 393–395. [Google Scholar] [CrossRef]
- Miyagawa, K.; Kawamoto, A.; Kanoda, K. Charge ordering in a quasi-two-dimensional organic conductor. Phys. Rev. 2000, 62, R7679–R7682. [Google Scholar] [CrossRef]
- Seo, H. Charge ordering in organic ET compounds. J. Phys. Soc. Jpn. 2000, 69, 805–820. [Google Scholar] [CrossRef]
- McKenzie, R.H.; Merino, J.; Marston, J.B.; Sushkov, O.P. Charge ordering and antiferromagnetic exchange in layered molecular crystals of the θ-type. Phys. Rev. 2001, 64, 085109:1–085109:11. [Google Scholar]
- Kuroki, K. Theoretical aspects of charge correlations in θ-(BEDT-TTF)2X. Sci. Technol. Adv. Mater. 2009, 10, 024312:1–024312:11. [Google Scholar]
- Mazumdar, S.; Clay, R.T.; Campbell, D.K. Bond-order and charge-density waves in the isotropic interacting two-dimensional quarter-filled band and the insulating state proximate to organic superconductivity. Phys. Rev. 2000, 62, 13400–13425. [Google Scholar] [CrossRef]
- Clay, R.T.; Mazumdar, S.; Campbell, D.K. Charge ordering in θ-(BEDT-TTF)2X materials. J. Phys. Soc. Jpn. 2002, 71, 1816–1819. [Google Scholar] [CrossRef]
- Dayal, S.; Clay, R.T.; Li, H.; Mazumdar, S. Paired-electron crystal: Order from frustration in the quarter-filled band. Phys. Rev. 2011, 83, 245106:1–245106:12. [Google Scholar]
- Merino, J.; McKenzie, R.H. Superconductivity mediated by charge fluctuations in layered molecular crystals. Phys. Rev. Lett. 2001, 87, 237002:1–237002:4. [Google Scholar]
- Cano-Cortes, L.; Merino, J.; Fratini, S. Quantum critical behavior of electrons at the edge of charge order. Phys. Rev. Lett. 2010, 105, 036405:1–036405:4. [Google Scholar]
- Takahashi, T.; Nogami, Y.; Yakushi, K. Charge ordering in organic conductors. J. Phys. Soc. Jpn. 2006, 75, 051008:1–051008:17. [Google Scholar]
- Seo, H.; Merino, J.; Yoshioka, H.; Ogata, M. Theoretical aspects of charge ordering in molecular conductors. J. Phys. Soc. Jpn. 2006, 75, 051009:1–051009:20. [Google Scholar]
- Dressel, M.; Drichko, N. Optical properties of two-dimensional organic conductors: Signatures of charge ordering and correlation effects. Chem. Rev. 2004, 104, 5689–5715. [Google Scholar] [CrossRef]
- Dressel, M. Quantum criticality in organic conductors? Fermi liquid versus non-Fermi-liquid behavior. J. Phys. Condens. Matter 2011, 23, 293201:1–293201:21. [Google Scholar]
- Nad, F.; Monceau, P. Dielectric response of the charge ordered state in the quasi-one-dimensional conductors. J. Phys. Soc. Jpn. 2006, 75, 051005:1–051005:12. [Google Scholar]
- Dressel, M.; Drichko, N.; Schlueter, J.; Merino, J. Proximity of the layered organic conductors α-(BEDT-TTF)2MHg(SCN)4 (M = K, NH4) to a charge-ordering transition. Phys. Rev. Lett. 2003, 90, 167002:1–167002:4. [Google Scholar]
- Drichko, N.; Dressel, M.; Kuntscher, C.A.; Pashkin, A.; Greco, A.; Merino, J.; Schlueter, J. Electronic properties of correlated metals in the vicinity of a charge-order transition: Optical spectroscopy of α-(BEDT-TTF)2MHg(SCN)4 (M = NH4, Rb, Tl). Phys. Rev. 2006, 74, 235121:1–235121:11. [Google Scholar]
- Kaiser, S.; Dressel, M.; Sun, Y.; Greco, A.; Schlueter, J.A.; Gard, G.L.; Drichko, N. Bandwidth tuning triggers interplay of charge order and superconductivity in two-dimensional organic materials. Phys. Rev. Lett. 2010, 105, 206402:1–206402:4. [Google Scholar]
- Tanaka, M.; Yamamoto, K.; Uruichi, M.; Yamamoto, T.; Yakushi, K.; Kimura, S.; Mori, H. Infrared and Raman study of the charge-ordered state in the vicinity of the superconducting state in the organic conductor β-(meso-DMBEDT-TTF)2PF6. J. Phys. Soc. Jpn. 2008, 77, 024714:1–024714:8. [Google Scholar]
- Morinaka, N.; Takahashi, K.; Chiba, R.; Yoshikane, F.; Niizeki, S.; Tanaka, M.; Yakushi, K.; Koeda, M.; Hedo, K.; Fujiwara, T.; et al. Superconductivity competitive with checkerboard-type charge ordering in the organic conductor β-(meso-DMBEDT-TTF)2PF6. Phys. Rev. 2009, 80, 092508:1–092508:4. [Google Scholar]
- Girlando, A.; Masino, M.; Kaiser, S.; Sun, Y.; Drichiko, N.; Dressel, M.; Mori, H. Spectroscopic characterization of charge order fluctuations in BEDT-TTF metals and superconductors. Phys. Status Solidi 2012, 249, 953–956. [Google Scholar] [CrossRef]
- Kobayashi, A.; Katayama, S.; Suzumura, Y. Superconductivity in charge ordered metal for quasi-two-dimensional organic conductor. J. Phys. Soc. Jpn. 2005, 74, 2897–2900. [Google Scholar] [CrossRef]
- Pouget, J.-P. Bond and charge ordering in low-dimensional organic conductors. Physica B 2012, 407, 1762–1770. [Google Scholar] [CrossRef]
- Pouget, J.-P.; Foury-Leylekian, P.; Alemany, P.; Canadell, E. Charge ordering in low dimensional organic conductors: Structural aspects. Phys. Status Solidi 2012, 249, 937–942. [Google Scholar] [CrossRef]
- Ouyang, J.; Yakushi, K.; Misaki, Y.; Tanaka, K. Raman spectroscopic evidence for the charge disproportionation in a quasi-two-dimensional organic conductor θ-(BDT-TTP)2Cu(NCS)2. Phys. Rev. 2001, 63, 054301:1–054301:6. [Google Scholar]
- Yakushi, K.; Yamamoto, K.; Simonyan, M.; Ouyang, J.; Nakano, C.; Misaki, Y.; Tanaka, K. Charge-ordering and magnetic phase transitions in θ-(BDT-TTP)2Cu(NCS)2. Phys. Rev. 2002, 66, 235102:1–235102:5. [Google Scholar]
- Merino, J.; Greco, A.; McKenzie, R.H.; Calandra, M. Dynamical properties of a strongly correlated model for quarter-filled layered organic molecular crystals. Phys. Rev. 2003, 68, 245121:1–245121:15. [Google Scholar]
- Seo, H.; Tsutsumi, K.; Ogata, M.; Merino, J. Charge fluctuation in geometrically frustrated charge ordering system. J. Phys. Soc. Jpn. 2006, 75, 114707:1–114707:8. [Google Scholar]
- Kozlov, M.E.; Pokhondnia, K.I.; Yurchenko, A.A. The assignment of fundamental vibrations of BEDT-TTF and BEDT-TTF-d8. Spectrochim. Acta 1987, 43A, 323–329. [Google Scholar]
- Kozlov, M.E.; Pokhondnia, K.I.; Yurchenko, A.A. Electron molecular vibration coupling in vibrational spectra of BEDT-TTF based radical cation salts. Spectrochim. Acta 1989, 45A, 437–444. [Google Scholar]
- Eldridge, J.E.; Homes, C.C.; Williams, J.M.; Kini, A.M.; Wang, H.H. The assignment of the normal modes of the BEDT-TTF electron-donor molecule using the infrared and Raman spectra of several isotopic analogs. Spectrochim. Acta 1995, 51A, 947–960. [Google Scholar]
- Wang, H.H.; Ferraro, J.R.; Williams, J.M.; Geiser, U.; Schlueter, J.A. Rapid Raman spectroscopic determination of the stoichiometry of microscopic quantities of BEDT-TTF-based organic conducors and superconductors. J. Chem. Soc. Chem. Commun. 1994, 1893–1894. [Google Scholar]
- Yamamoto, T.; Uruichi, M.; Yamamoto, K.; Yakushi, K.; Kawamoto, A.; Taniguchi, H. Examination of the charge-sensitive vibrational modes in bis(ethylenedithio)tetrathiafulvalene. J. Phys. Chem. 2005, 109, 15226–15235. [Google Scholar]
- Although frequency is proportional to the square root of force constant, the frequency practically linearly depends upon the force constant in a narrow frequency range, Δω = ω(0) − ω(1)
- Rice, M.J.; Lipari, N.O.; Strassler, S. Dimerized organic linear-chain conductors and the unambiguous experimental determination of electron-molecular-vibration coupling constants. Phys. Rev. Lett. 1977, 21, 1357–1362. [Google Scholar]
- Rice, M.J. Towards the experimental determiation of the fundamental microscopic parameters of organic ion-radical compounds. Solid State Commun. 1979, 31, 93–98. [Google Scholar] [CrossRef]
- Girlando, A.; Bozio, R.; Pecile, C.; Torrance, J.B. Discovery of vibronic effects in the Raman spectra of mixed-stack charge-transfer crystals. Phys. Rev. 1982, 26, 2306–2309. [Google Scholar] [CrossRef]
- Painelli, A.; Girlando, A. Electron-molecular vibration (e-mv) coupling in charge-transfer compounds and its consequences on the optical spectra: A theoretical framework. J. Chem. Phys. 1986, 84, 5655–5671. [Google Scholar] [CrossRef]
- Yamamoto, K.; Yakushi, K. Electron-molecular vibration coupling effect on the Raman spectrum of organic charge transfer salts. J. Phys. (France) 2004, 114, 153–155. [Google Scholar] [CrossRef]
- Visentini, G.; Masino, M.; Bellitto, C.; Girlando, A. Experimental determination of BEDT-TTF+ electron-molecular vibration coupling constants through optical microreflectance. Phys. Rev. 1998, 58, 9460–9467. [Google Scholar] [CrossRef]
- Yartsev, V.M.; Graja, A. Electron-intramolecular vibration coupling in charge-transfer salts studied by infrared spectroscopy. Int. J. Mod. Phys. 1998, 12, 1643–1672. [Google Scholar] [CrossRef]
- Faltermeier, D.; Barz, J.; Dumm, M.; Dressel, M.; Drichko, N.; Petrov, B.; Semkin, V.; Vlasova, R.; Meziere, C.; Batil, P. Bandwidth-controlled Mott transition in κ-(BEDT-TTF)2Cu[N(CN)2]-BrxCl1−x: Optical studies of localized charge excitations. Phys. Rev. 2007, 76, 165113:1–165113:12. [Google Scholar]
- Girlando, A. Charge sensitive vibrations and electron-molecular vibration coupling in bis(ethylenethio)-thetrathiafulvalene (BEDT-TTF). J. Phys. Chem. 2011, 115, 19371–19378. [Google Scholar]
- Yamamoto, T.; Yakushi, K.; Shimizu, Y.; Saito, G. Infrared and Raman study of the charge-ordered state of θ-(ET)2Cu(CN)[N(CN)2]2. J. Phys. Soc. Jpn. 2004, 73, 2326–2332. [Google Scholar] [CrossRef]
- Yue, Y.; Nakano, C.; Yamamoto, K.; Uruichi, M.; Wojciechowski, R.; Inokuchi, M.; Yakushi, K.; Kawamoto, A. Charge order-disorder phase transition in α′-(Bis(ethylenedithio)tetrathiafulvalene)2 IBr2 [α′-(BEDT-TTF)2IBr2]. J. Phys. Soc. Jpn. 2009, 78, 044701:1–044701:10. [Google Scholar]
- Kubo, R. A stochastic theory of line shape. Adv. Chem. Phys. 1969, 15, 101–127. [Google Scholar] [CrossRef]
- Sue, J.; Yan, Y.J.; Mukamel, S. Raman excitation profiles of polyatomic molecules in condensed phases. A stochastic theory. J. Chem. Phys. 1986, 85, 462–474. [Google Scholar] [CrossRef]
- Uruichi, M.; Yakushi, K.; Yamamoto, H.M.; Kato, R. Infrared and Raman studies of the charge-ordering phase transition at ~170 K in the quarter-filled organic conductor, β″-(ET) (TCNQ). J. Phys. Soc. Jpn. 2006, 75, 074720:1–074720:10. [Google Scholar]
- Yamamoto, H.M.; Hagiwara, M.; Kato, R. New phase of (BEDT-TTF)(TCNQ). Synth. Metal. 2003, 133, 449–451. [Google Scholar] [CrossRef]
- Nogami, Y. Private communication. 2009. Okayama University. [Google Scholar]
- Yamamoto, H.M.; Tajima, N.; Hagiwara, M.; Kato, R.; Yamaura, J.I. Strange electric magnetic behaviour of new (BEDT-TTF)(TCNQ). Synth. Metal. 2003, 135, 623–624. [Google Scholar] [CrossRef]
- Yasuzuka, S.; Terakura, C.; Terashima, T.; Yakabe, T.; Terai, Y.; Yamamoto, H.M.; Kato, R.; Uji, S. Fermi surface and resistance anomalies in ET-TCNQ. Synth. Metal. 2003, 135, 647–648. [Google Scholar] [CrossRef]
- Yasuzuka, S.; Graf, D.; Choi, E.S.; Brooks, J.S.; Terashima, T.; Konoike, T.; Enomoto, K.; Nishimura, M.; Yamamoto, H.M.; Kato, R.; et al. Pressure-induced Fermi surface change in quasi-one-dimensional conductor β″-(ET)(TCNQ). J. Phys. IV Fr. 2004, 114, 157–158. [Google Scholar] [CrossRef]
- Yasuzuka, S.; Uji, S.; Enomoto, K.; Konoike, T.; Nishimura, M.; Terashima, T.; Graf, D.; Choi, E.S.; Brooks, J.S.; Yamamoto, H.M.; et al. Pressure effect on fermi surface in β″-(ET)(TCNQ). Synth. Metal. 2005, 152, 437–440. [Google Scholar] [CrossRef]
- Kimata, M.; Ohta, H.; Koyama, K.; Oshima, Y.; Motokawa, M.; Yamamoto, H.M.; Kato, R. Development of the high field magneto-optical measurement system with a rotational cavity for the study of organic conductors. Int. J. Mod. Phys. 2004, 18, 3803–3806. [Google Scholar] [CrossRef]
- Kimata, M.; Oshima, Y.; Ohta, H.; Koyama, K.; Motokawa, M.; Yamamoto, H.M.; Kato, R. Magnetooptical measurements of β″-(BEDT-TTF)(TCNQ). Physica B 2004, 346, 382–386. [Google Scholar] [CrossRef]
- Yakushi, K.; Uruichi, M.; Yamamoto, H.M.; Kato, R. Dynamical fluctuation of the site-charge density in metallic β″-(BEDT-TTF)(TCNQ). J. Phys. IV Fr. 2004, 114, 149–151. [Google Scholar] [CrossRef]
- Drichko, N.; Kaiser, S.; Sun, Y.; Clauss, C.; Dressel, M.; Mori, H.; Schlueter, J.; Zhyliaeva, E.I.; Torunova, S.A.; Lyubovskaya, R.N. Evidence for charge order in organic superconductors obtained by vibrational spectroscopy. Physica B 2009, 404, 490–493. [Google Scholar]
- Yamamoto, K.; Yakushi, K.; Miyagawa, K.; Kanota, K.; Kawamoto, A. Charge ordering in θ-(BEDT-TTF)2RbZn(SCN)4 studied by vibrational spectroscopy. Phys. Rev. 2002, 65, 085110:1–085110:8. [Google Scholar]
- There is another incoherent optical excitation at ~U with very weak intensity, which corresponds to the optical transition from the lower Hubbard to the upper Hubbard band.
- Merino, J. Nonlocal Coulomb Correlation in metals close to a charge order insulator transition. Phys. Rev. Lett. 2007, 99, 036404:1–036404:4. [Google Scholar]
- Kondo, R.; Higa, M.; Kagoshima, S.; Hoshino, H.; Mori, T.; Mori, H. Electrical and structural properties of θ-type BEDT-TTF organic conductors under uniaxial strain. J. Phys. Soc. Jpn. 2006, 75, 044716:1–044716:7. [Google Scholar]
- Kuroki, K. The origin of the charge ordering and its relevance to superconductivity in θ-(BEDT-TTF)2X: The effect of the fermi surface nesting and the distant electron-electron interactions. J. Phys. Soc. Jpn. 2006, 75, 114716:1–114716:14. [Google Scholar]
- Hotta, C. Classification of quasi-two dimensional organic conductors based on a new minimal model. J. Phys. Soc. Jpn. 2003, 72, 840–853. [Google Scholar] [CrossRef]
- Watanabe, H.; Ogata, M. Novel charge order and superconductivity in two-dimensional frustrated lattice at quarter filling. J. Phys. Soc. Jpn. 2006, 75, 063702:1–063702:4. [Google Scholar]
- Mori, H.; Tanaka, S.; Mori, T. Systematic study of the electronic state of θ-type BEDT-TTF organic conductors by changing electronic correlation. Phys. Rev. 1998, 57, 12023–12029. [Google Scholar] [CrossRef]
- Kobayashi, H.; Kato, R.; Kobayashi, A.; Nishio, Y.; Kajita, K.; Sasaki, W. New molecular superconductor (BEDT-TTF)2(I3)x(AuI2)1−x (x < 0.02). Chem. Lett. 1986, 789–792. [Google Scholar]
- Mori, H.; Tanaka, S.; Mori, T.; Kobayashi, A.; Kobayashi, H. Crystal structure and physical properties of M = Rb and Tl salts of (BEDT-TTF)2MM′(SCN)4, [M′ = Co, Zn]. Bull. Chem. Soc. Jpn. 1998, 71, 797–806. [Google Scholar] [CrossRef]
- Komatsu, T.; Sato, H.; Nakamura, T.; Matsukawa, N.; Yamochi, H.; Saito, G.; Kusunoki, M.; Sakagushi, K.; Kagoshima, S. The electrical and magnetic properties of a novel two-dimensional antiferromagnet based on BEDT-TTF, θ-(BEDT-TTF)2Cu(CN)[N(CN)2]2. Bull Chem. Soc. Jpn. 1995, 68, 2233–2244. [Google Scholar] [CrossRef]
- The doublet of ν2P is interpreted as the Fermi resonance [72].
- Watanabe, M.; Noda, Y.; Nogami, Y.; Mori, H. Transfer integrals and spatial pattern of charge ordering in θ-(BEDT-TTF)2RbZn(SCN)4 at 90 K. J. Phys. Soc. Jpn. 2004, 73, 116–122. [Google Scholar] [CrossRef]
- Suzuki, K.; Yamamoto, K.; Yakushi, K. Charge-ordering transition in orthorhombic and monoclinic single crystals of θ-(BEDT-TTF)2TlZn(SCN)4 studied by vibrational spectroscopy. Phys. Rev. 2004, 69, 085114:1–085114:11. [Google Scholar]
- Tajima, H.; Kyoden, S.; Mori, H.; Tanaka, S. Estimation of charge-ordering patterns in θ-ET2MM′(SCN)4(MM′ = RbCo, RbZn, CsZn) by reflection spectroscopy. Phys. Rev. 2000, 62, 9378–9385. [Google Scholar] [CrossRef]
- Tanaka, Y.; Yonemitsu, K. Effects of electron-lattice coupling on charge order in θ-(ET)2X. J. Phys. Soc. Jpn. 2008, 77, 034708:1–034708:9. [Google Scholar]
- Chiba, R.; Hiraki, K.; Takahashi, T.; Yamamoto, H.M.; Nakamura, T. Extremely slow charge fluctuations in the metallic state of the two-dimensional molecular conductor θ-(BEDT-TTF)2RbZn(SCN)4. Phys. Rev. Lett. 2004, 93, 216405:1–216405:4. [Google Scholar]
- Nakamura, T.; Miyagawa, W.; Kinami, R.; Konishi, Y.; Takahashi, T. Low-temperature electronic states in θ-(BEDT-TTF)2RbZn(SCN)4: Competition of different ground states. Synth. Metal. 1999, 103, 1898–1899. [Google Scholar] [CrossRef]
- Kanoda, K.; Ohnou, K.; Kodama, M.; Miyagawa, K.; Itou, T.; Hiraki, K. Charge ordering and frustration in organic conductors. J. Phys. IV Fr. 2005, 131, 21–26. [Google Scholar] [CrossRef]
- Watanabe, M.; Noda, Y.; Nogami, Y.; Mori, H. Investigation of X-ray diffuse scattering in θ-(BEDT-TTF)2RbM′(SCN)4. Synth. Metal. 2003, 135, 665–666. [Google Scholar] [CrossRef]
- Nogami, Y.; Hanasaki, N.; Watanabe, M.; Yamamoto, K.; Ito, T.; Ikeda, N.; Ohsumi, H.; Tokawa, H.; Noda, Y.; Terasaki, I.; et al. Charge order competition leading to nonlinearity in organic thyristor family. J. Phys. Soc. Jpn. 2010, 79. [Google Scholar] [CrossRef]
- A weak broad ν3 band is probably involved in the low-frequency region of the broad ν2 band. The assignment of the broad ν2 band with the aid of isotope shift is given in ref. [94].
- Suzuki, K.; Yamamoto, K.; Yakushi, K.; Kawamoto, A. Infrared and Raman studies of θ-(BEDT-TTF)2CsZn(SCN)4: Comparison with the frozen state of θ-(BEDT-TTF)2RbZn(SCN)4. J. Phys. Soc. Jpn. 2005, 74, 2631–2639. [Google Scholar] [CrossRef]
- Wang, N.L.; Mori, H.; Tanaka, S.; Dong, J.; Clayman, B.P. Far infrared study of insulator-metal transition in θ-(BEDT-TTF)2RbZn(SCN)4. J. Phys. Condens. Matter 2001, 13, 5463–5470. [Google Scholar] [CrossRef]
- Nishimoto, S.; Shingai, M.; Ohta, Y. Coexistence of distinct charge fluctuations in θ-(BEDT-TTF)2X. Phys. Rev. 2008, 78, 035113:1–035113:9. [Google Scholar]
- The reason why the ν2 mode of metallic I3 salt is significantly deviated from the center of ν2P and ν2R is ascribed to the interaction between ν2R and the neighbor ν3A. [46].
- Mori, T. Non-Stripe charge order in the θ-phase organic conductors. J. Phys. Soc. Jpn. 2003, 72, 1469–1475. [Google Scholar] [CrossRef]
- Mori, T. Estimation of off-site coulomb integrals and phase diagrams of charge ordered states in the θ-phase organic conductor. Bull. Chem. Soc. Jpn. 2000, 73, 2243–2253. [Google Scholar] [CrossRef]
- Watanabe, M.; Nogami, Y.; Oshima, K.; Mori, H.; Tanaka, S. Novel pressure-induced 2κF CDW state in organic low-dimensional compound θ-(BEDT-TTF)2CsCo(SCN)4. J. Phys. Soc. Jpn. 1999, 68, 2654–2663. [Google Scholar] [CrossRef]
- Watanabe, M.; Yamamoto, K.; Ito, T.; Nakashima, Y.; Tanabe, M.; Hanasaki, N.; Ikeda, N.; Nogami, Y.; Ohsumi, H.; Toyokawa, H.; et al. Non-thermal evidence for current-induced melting of charge order in θ-(BEDT-TTF)2CsZn(SCN)4. J. Phys. Soc. Jpn. 2008, 77, 065004:1–065004:2. [Google Scholar]
- Inagaki, K.; Terasaki, I.; Mori, H.; Mori, T. Large dielectric constant and giant nonlinear conduction in organic conductor θ-(BEDT-TTF)2CsZn(SCN)4. J. Phys. Soc. Jpn. 2004, 73, 3364–3369. [Google Scholar] [CrossRef]
- Sawano, F.; Terasaki, I.; Mori, H.; Mori, T.; Watanabe, M.; Ikeda, N.; Nogami, Y.; Noda, Y. An organic thyristor. Nature 2005, 437, 522–524. [Google Scholar] [CrossRef]
- Chiba, R.; Hiraki, K.; Takahashi, T.; Yamamoto, H.M.; Nakamura, T. Charge disproportionation and dynamics in θ-(BEDT-TTF)2CsZn(SCN)4. Phys. Rev. 2008, 77, 115113:1–115113:10. [Google Scholar]
- Nad, F.; Monceau, P.; Yamamoto, H.M. A possible glass-like state in θ-(BEDT-TTF)2CsZn(SCN)4 at low temperature. J. Phys. Condens. Matter 2008, 20, 485211:1–485211:6. [Google Scholar]
- Udagawa, M.; Motome, Y. Charge ordering and coexistence of charge fluctuations in quasi-two-dimensional organic conductors θ-(BEDT-TTF)2X. Phys. Rev. Lett. 2007, 98, 206405:1–206405:4. [Google Scholar]
- Kajita, K.; Nishio, Y.; Moriyama, S.; Sasaki, W.; Kato, R.; Kobayashi, H.; Kobayashi, A. ew organic suprconductors κ- and θ-(BEDT-TTF)2I3; Transport property. Solid State Commun. 1987, 64, 1279–1284. [Google Scholar] [CrossRef]
- Salameh, B.; Nothardt, A.; Balthes, E.; Schmidt, W.; Schweitzer, D.; Strempfer, J.; Hinrichsen, B.; Jansen, M.; Maude, D.K. Electronic properties of the organic metals θ-(BEDT-TTF)2I3 and θT-(BEDT-TTF)2I3. Phys. Rev. 2007, 75, 054509:1–054509:13. [Google Scholar]
- The symmetry of 3a × 3c superlattice has not been clarified.
- Wang, N.L.; Feng, T.; Chen, Z.J.; Mori, H. Infrared properties of θ-type ET charge-transfer salts: θ-(ET)2RbZn(SCN)4 vs. θ-(ET)2CsZn(SCN)4. Synth. Metal. 2003, 135, 701–702. [Google Scholar] [CrossRef]
- Wojciechowski, R.; Yamamoto, K.; Yakushi, K.; Inokuchi, M.; Kawamoto, A. High-pressure Raman study of the charge ordering in α-(BEDT-TTF)2I3. Phys. Rev. 2003, 67, 224105:1–224105:11. [Google Scholar]
- Takenaka, K.; Tamura, M.; Tajima, N. Collapse of coherence quasiparticle states in θ-(bedt-ttf)2i3 observed by optical spectroscopy. Phys. Rev. Lett. 2005, 95, 227801:1–227801:4. [Google Scholar]
- Kobayashi, A.; Kato, R.; Kobayashi, H.; Moriyama, S.; Nishio, Y.; Kajita, K.; Sasaki, W. Anion arrangement in a new molecular superconductor, θ-(BEDT-TTF)2(I3)1−x(AuI2)x, (x < 0.02). Chem. Lett. 1986, 2017–2020. [Google Scholar]
- Tamura, M.; Yakushi, K.; Kuroda, H. Temperature dependence of the polarized reflectance spectra of the θ-Type of bis(ethylenedithio)tetrathiafulvalenium) triiodide θ-(BEDT-TTF)2I3: Estimation of band parameters. J. Phys. Soc. Jpn. 1988, 57, 3239–3247. [Google Scholar] [CrossRef]
- ACS, Molecular Conductors: Thematic Issue (Special issue); ACS Publication: Washington, DC, USA, 2004; pp. 4887–5781.
- Mori, T. Structural genealogy of BEDT-TTF-based organic conductors I. Parallel molecules: β and β″ phases. Bull. Chem. Soc. Jpn. 1998, 71, 2509–2526. [Google Scholar] [CrossRef]
- Mori, T. Structural genealogy of BEDT-TTF-based organic conductors II. Inclined molecules: θ- and α-, and κ-phases. Bull. Chem. Soc. Jpn. 1999, 72, 179–197. [Google Scholar] [CrossRef]
- Mori, T. Structural genealogy of BEDT-TTF-based organic conductors III. Twisted molecules: δ- and α’-phases. Bull. Chem. Soc. Jpn. 1998, 72, 2011–2027. [Google Scholar] [CrossRef]
- Takano, Y.; Hiraki, K.; Yamamoto, H.M.; Nakamura, T.; Takahashi, T. Charge ordering in α-(BEDT-TTF)2I3. Synth. Metal. 2001, 120, 1081–1082. [Google Scholar] [CrossRef]
- Tajima, N.; Ebina-Tajima, A.; Tamura, M.; Nishio, Y.; Kajita, K. Effects of uniaxial strain on transport properties of organic conductor α-(BEDT-TTF)2I3 and discovery of superconductivity. J. Phys. Soc. Jpn. 2002, 71, 1832–1835. [Google Scholar] [CrossRef]
- Tajima, N.; Kajita, K. Experimental study organic zero-gap conductor α-(BEDT-TTF)2I3. Sci. Technol. Adv. Mater. 2009, 10, 024308:1–024308:7. [Google Scholar]
- Kobayashi, A.; Katayama, S.; Suzumura, Y. Theoretical study of the zero-gap organic conductor α-(BEDT-TTF)2I3. Sci. Technol. Adv. Mater. 2009, 10, 024309:1–024309:15. [Google Scholar]
- Iwai, S.; Yamamoto, K.; Kashiwazaki, A.; Hiramatsu, F.; Nakaya, H.; Kawakami, Y.; Yakushi, K.; Okamoto, H.; Mori, H.; Nishio, Y. Photoinduced melting of a stripe-type charge-order and metallic domain formation in a layered BEDT-TTF-based organic salt. Phys. Rev. Lett. 2007, 98, 097402:1–097402:4. [Google Scholar]
- Yamamoto, K.; Iwai, S.; Boyko, S.; Kashiwazaki, A.; Hiramatsu, F.; Okabe, C.; Nishi, N.; Yakushi, K. Strong optical nonlinearity and its ultrafast response associated with electron ferroelectricity in an organic conductor. J. Phys. Soc. Jpn. 2008, 77, 074709:1–074709:6. [Google Scholar]
- Bender, K.; Henning, I.; Schweitzer, D.; Dietz, K.; Endres, H.; Keller, H.J. Synthesis, structure, and physical properties of a two-dimensional organic metal, di[bis(ethylenedithiolo)tetrathio-fulvalene] triiodide, (BEDT-TTF)2+I3-. Mol. Cryst. Liq. Cryst. 1984, 108, 359–371. [Google Scholar] [CrossRef]
- Kino, H.; Fukuyama, H. Phase diagram of two-dimensional organic conductors: (BEDT-TTF)2X. J. Phys. Soc. Jpn. 1996, 65, 2158–2169. [Google Scholar] [CrossRef]
- Takahashi, T.; Hiraki, K.; Moroto, S.; Tajima, N.; Takano, Y.; Kubo, Y.; Satsukawa, H.; Chiba, R.; Yamamoto, H.M.; Kato, R.; et al. Charge disproportionation, everywhere! J. Phys. IV Fr. 2004, 114, 3–8. [Google Scholar] [CrossRef]
- Kakiuchi, T.; Wakabayashi, Y.; Sawa, H.; Takahashi, T.; Nakamura, T. Charge ordering in α-(BEDT-TTF)2I3 by synchrotron x-ray diffraction. J. Phys. Soc. Jpn. 2007, 76, 113702:1–113702:10. [Google Scholar]
- Alemany, P.; Pouget, J.-P.; Canadell, E. Essential role of anions in the charge ordering transition of α-(BEDT-TTF)2I3. Phys. Rev. B 2012, 85, 195118:1–195118:10. [Google Scholar]
- Yue, Y.; Yamamoto, K.; Uruichi, M.; Nakano, C.; Yakushi, K.; Yamada, S.; Hiejima, T.; Kawamoto, A. Nonuniform site-charge distribution and fluctuations of charge order in the metallic state of α-(BEDT-TTF)2I3. Phys. Rev. 2010, 82, 075134:1–075134:8. [Google Scholar]
- Yamamoto, K.; Kowalska, A.A.; Yue, Y.; Yakushi, K. Vibronic activation of molecular vibrational overtones in the infrared spectra of charge-ordered organic conductors. Phys. Rev. 2011, 84, 064306:1–064306:13. [Google Scholar]
- Yamamoto, K.; Kowalska, A.A.; Yue, Y.; Yakushi, K. E-mv coupling of vibrational overtone in organic conductors: Relationship to optical nonlinearity and ferroelectricity. Physica B 2012, 407, 1775–1778. [Google Scholar] [CrossRef]
- Ivek, T.; Korin-Hamzic, N.; Milat, O.; Tomic, S.; Clauss, C.; Drichko, N.; Schweitzer, D.; Dressel, M. Electrodynamic response of the charge ordering phase: Dielectric and optical studies of α-(BEDT-TTF)2I3. Phys. Rev. 2011, 83, 165128:1–165128:13. [Google Scholar]
- Moroto, S.; Hiraki, K.-I.; Takano, Y.; Kubo, Y.; Takahashi, T.; Yamamoto, H.M.; Nakmura, T. Charge disproportionation in the metallic state of α-(BEDT-TTF)2I3. J. Phys. IV Fr. 2004, 114, 339–340. [Google Scholar]
- Kawai, T.; Kawamoto, A. 13C-NMR study of charge ordering state in the organic conductor, α-(BEDT-TTF)2I3. J. Phys. Soc. Jpn. 2009, 78, 074711:1–074711:6. [Google Scholar]
- Yamamoto, K.; Yakushi, K. Second-Harmonic Generation Study Of Ferroelectric Organic Conductors α-(BEDT-TTF)2X (X = I3 and I2Br). In Molecular Electronic and Related Materials—Control and Probe with Light; Naito, T., Ed.; Transworld Research Network: Kerala, Indian, 2010; pp. 185–201. [Google Scholar]
- Yamamoto, K.; Kowalska, A.A.; Yakushi, K. Direct observation of ferroelectric domains by Wigner crystallization of electrons in α-[bis(ethylenedithio)tetetrathiafulvalene]2I3. App. Phys. Lett. 2010, 96, 122901:1–122901:3. [Google Scholar]
- Ikeda, N.; Ohsumi, H.; Ohwada, K.; Ishii, K.; Inami, T.; Kakura, K.; Murakami, Y.; Yoshii, K.; Mori, S.; Horibe, Y.; et al. Ferroelectricity from iron valence ordering in the charge-frustrated system LuFe2O4. Nature 2005, 436, 1136–1138. [Google Scholar]
- Iwai, S.; Yamamoto, K.; Hiramatsu, F.; Nakaya, H.; Kawakami, Y.; Yakushi, K. Hydrostatic pressure effect on photoinduced insulator-to-metal transition in the layered organic salt α-(BEDT-TTF)2I3. Phys. Rev. 2008, 77, 125131:1–125131:5. [Google Scholar]
- Kawakami, Y.; Fukatsu, T.; Sakurai, Y.; Unno, H.; Itoh, H.; Iwai, S.; Sasaki, T.; Yamamoto, K.; Yakushi, K.; Yonemitsu, K. Early-State dynamics of light-matter interaction leading to the insulator-to-metal transition in a charge ordered organic crystal. Phys. Rev. Lett. 2010, 105, 246402:1–246402:4. [Google Scholar]
- Mori, H.; Tanaka, S.; Oshima, K.; Saito, G.; Mori, T.; Maruyama, Y.; Inokuchi, H. Electrical properties and crystal structure of mercury (II) thiocyanate salts based upon BEDT-TTF with Li+, K+, NH4+, Rb+, and Cs+. Synth. Metal. 1991, 42, 2013–2018. [Google Scholar] [CrossRef]
- Mori, H.; Tanaka, S.; Oshima, M.; Saito, G.; Mori, T.; Maruyama, Y.; Inokuchi, H. Crystal and electronic structures of (BEDT-TTF)2[MHg(SCN)4] (M = K and NH4). Bull. Chem. Soc. Jpn. 1990, 63, 2183–2190. [Google Scholar] [CrossRef]
- Kobayashi, H.; Kato, R.; Kobayashi, A.; Nishio, Y.; Kajita, K.; Sasaki, W. Crystal and electronic structures of layered molecular superconductor, θ-(BEDT-TTF)2(I3)x(AuI2)1−x (x < 0.02). Chem. Lett. 1986, 833–836. [Google Scholar]
- Tajima, N.; Tamura, M.; Nishio, Y.; Kajita, K.; Iye, Y. Transport property of an organic conductor α-(BEDT-TTF)2I3 under hydrostatic pressure—Discovery of a novel type of conductor. J. Phys. Soc. Jpn. 2000, 69, 543–551. [Google Scholar] [CrossRef]
- Hiejima, T.; Yamada, S.; Uruichi, M.; Yakushi, K. Infrared and Raman studies of α-(BEDT-TTF)2 MHg(SCN)4 with M = NH4 and K at low temperature: Breaking of inversion symmetry due to charge-ordering fluctuation. Physica B 2010, 405, 5153–5156. [Google Scholar]
- Foury-Leylekian, P.; Ravy, S.; Pouget, J.-P.; Muller, H. X-ray study of the density wave instability of α-(BEDT-TTF)2MHg(SCN)4 with M = K and Rb. Synth. Metal. 2003, 137, 1271–1272. [Google Scholar] [CrossRef]
- Foury-Leylekian, P.; Pouget, J.-P.; Lee, Y.-J.; Nieminen, R.M.; Ordejon, P.; Canadell, E. Density-wave instability in α-(BEDT-TTF)2KHg(SCN)4 studied by x-ray diffuse scattering and by first-principle calculations. Phys. Rev. 2010, 82, 134116:1–134116:14. [Google Scholar]
- This value was estimated from the separation of ν27j mode, (~7 cm−1)/(140 cm−1/e).
- Yamamoto, T.; Yamamoto, H.M.; Kato, R.; Uruichi, M.; Yakushi, K.; Akutsu, H.; Sato-Akutsu, A.; Kawamoto, A.; Turner, S.S.; Day, P. Inhomogeneous site charges at the boundary between the insulating, superconducting, and metallic phases of β″-type bis-ethylenedithio-tetrathiafulvalene molecular charge-transfer salts. Phys. Rev. 2008, 77, 205120:1–205120:13. [Google Scholar]
- Bangura, A.F.; Coldea, A.I.; Singleton, J.; Ardavan, A.; Akutsu-Sato, A.; Akutsu, H.; Turner, S.S.; Day, P.; Yamamoto, T.; Yakushi, K. Robust superconducting state in the low-quasiparticle-density due to proximity to a charge-ordered state. Phys. Rev. 2005, 72, 014543:1–014543:13. [Google Scholar]
- See ref. [46] about the reason why this equation is applicable in the range of 0 ≤ ρ ≤ 0.8.
- Although frequency is proportional to the square root of force constant, the frequency practically linearly depends upon the force constant in a narrow frequency range, Δω = ω(0) – ω(1)
- The κ- and β′-ET salts with ρ = 0.5 have a dimer unit with large transfer integral. However, the blue shift of ν2 is not attributed to the emv (electron-molecular-vibration) coupling, because similar blue shift is found in non-dimeric θ-(ET)2I3 which will be shown in the next subsection.
- Hess, L.A.; Prasad, P.N. Vibrational dephasing in organic solids: Temperature dependence of Raman active internal mode of naphthalene. J. Phys. Chem. 1980, 72, 573–579. [Google Scholar] [CrossRef]
- The frequency of the infrared-active ν27 mode at ρ = 0.5 is also deviated from the linear relationship. The examination similar to ν2 is necessary including temperature dependence.
- Kayatama, S.; Kobayashi, A.; Suzumura, Y. Effect of anion potential on the zero-gap state in the two-dimensional organic conductor α-(BEDT-TTF)2I3. J. Phys. Conf. Ser. 2008, 132, 012003:1–012003:7. [Google Scholar]
- Kobayashi, A.; Katayama, S.; Suzumura, Y.; Fukuyama, H. Massless fermions in organic conductor. J. Phys. Soc. Jpn. 2007, 76, 034711:1–034711:6. [Google Scholar]
- Ishibashi, S.; Tamura, T.; Kohyama, M.; Terakura, K. Ab initio electronic-structure calculation. J. Phys. Soc. Jpn. 2006, 75, 015005:1–015005:2. [Google Scholar]
- Tamura, M.; Matsuzaki, F.; Tajima, N.; Nishio, Y.; Kajita, K. Transport study of an organic conductor, θ-(BEDT-TTF)2I3. Synth. Metal. 1997, 86, 2007–2008. [Google Scholar] [CrossRef]
- Tajima, N.; Tajima, A.; Tamura, M.; Kato, R.; Nishio, Y.; Kajita, K. Pressure control of transport property of organic conductors; α-, θ-(BEDT-TTF)2I3 and θ-(DIETS)2[Au(CN)4]. J. Phys. IV Fr. 2004, 114, 263–267. [Google Scholar] [CrossRef]
- Miyagawa, K.; Hirayama, M.; Tamura, M.; Kanoda, K. 13C NMR study on zero-gap state in the organic conductor θ-(BEDT-TTF)2I3 under pressure. J. Phys. Soc. Jpn. 2010, 79, 063703:1–063703:3. [Google Scholar]
- As ν2R is mixed with ν31, the hole numbers shown in the CO state shown in Figure 5b,c are inaccurate.
- Kondo, R.; Kagoshima, S.; Tajima, N.; Kato, R. Crystal and electronic structures of the quasi-two-dimensional organic conductor α-(BEDT-TTF)2I3 and its selenium analogue α-(BEDT-TSeF)2I3 under hydrostatic pressure at room temperature. J. Phys. Soc. Jpn. 2009, 78, 114714:1–114714:7. [Google Scholar]
- Yakushi, K.; Kanbara, H.; Tajima, H.; Kuroda, H.; Saito, G.; Mori, T. Temperature dependence of the reflectance spectra of the single crystals of bis(ethylenedithio)tetrathiafulvalene salts. α-(BEDT-TTF)3(ReO4)2 and α-(BEDT-TTF)2I3. Bull. Chem. Soc. Jpn. 1987, 60, 4251–4257. [Google Scholar] [CrossRef]
- Zelezny, V.; Petzelt, J.; Swietlik, R.; Gorshunov, B.P.; Volkov, A.A.; Kozlov, G.V.; Schweitzer, D.; Keller, H.J. Far infrared response of α- and αt-(BEDT-TTF)2I3. J. Phys. Fr. 1990, 51, 869–881. [Google Scholar] [CrossRef]
- Dressel, M.; Gruner, G.; Pouget, J.P.; Breining, A.; Schweitzer, D. Field and frequency dependent transport in the two-dimensional organic conductor α-(BEDT-TTF)2I3. J. Phys. I Fr. 1994, 4, 579–594. [Google Scholar] [CrossRef]
- Clauss, C.; Drichko, N.; Schweitzer, D.; Dressel, M. Charge-order gap in α-(BEDT-TTF)2I3. Physica B 2010, 405, S144–S146. [Google Scholar] [CrossRef]
- Tamura, K.; Ozawa, T.; Bando, Y.; Kawamoto, T.; Mori, T. Voltage oscillation associated with nonlinear conductivity in the organic conductor α-(BEDT-TTF)2I3. J. Appl. Phys. 2010, 107, 103716:1–103716:5. [Google Scholar]
- Ivek, T.; Korin-Hamzic, B.; Milat, O.; Tomic, S.; Clauss, C.; Drichko, N.; Schweitzer, D.; Dressel, M. Collective excitation in the charge-ordered phase of α-(BEDT-TTF)2I3. Phys. Rev. Lett. 2010, 104, 206406:1–206406:4. [Google Scholar]
- Dressel, M.; Drichko, N.; Kaiser, S. Collective charge-order excitations. Physica C 2010, 470, S589–S591. [Google Scholar] [CrossRef]
- Watanabe, M.; Nishikawa, M.; Nogami, Y.; Oshima, K.; Saito, G. Low temperature structure of the α′-(BEDT-TTF)2IBr2 organic magnetic semiconductor. J. Korean Phys. Soc. 1997, 31, 95–98. [Google Scholar]
- Tokumoto, M.; Anzai, H.; Ishiguro, T.; Saito, G.; Kobayashi, H.; Kato, R.; Kobayashi, A. Electrical and magnetic properties of organic semiconductors, (BEDT-TTF)2X (X = IBr2, IBrCl, and ICl2). Synth. Metal. 1987, 19, 215–220. [Google Scholar] [CrossRef]
- Maniwa, Y.; Takahashi, T.; Saito, G. 1H NMR in organic superconductor β-(BEDT-TTF)2I3. J. Phys. Soc. Jpn. 1986, 55, 47–50. [Google Scholar] [CrossRef]
- Nogami, Y.; Kagoshima, S.; Sugano, T.; Saito, G. X-ray evidence for structural changes in the organic conductors, α-(BEDT-TTF)2I3, α-(BEDT-TTF)2IBr2,and β-(BEDT-TTF)2I3. Synth. Metal. 1986, 16, 367–377. [Google Scholar] [CrossRef]
- Inokuchi, M.; Yakushi, K.; Kinoshita, M.; Saito, G. Optical properties of α′-(BEDT-TTF)2IBr2. Synth. Metal. 1992, 103, 2102–2103. [Google Scholar]
- Yue, Y.; Nakano, C.; Yamamoto, K.; Uruichi, M.; Yakushi, K.; Kawamoto, A. Charge-ordering phase transition in α′-(BEDT-TTF)2IBr2. J. Phys. Conf. Ser. 2008, 132, 012007:1–012007:7. [Google Scholar]
- Yue, Y.; Yamamoto, K.; Nakano, C.; Uruichi, M.; Yakushi, K.; Inokuchi, M.; Hiejima, T.; Kawamoto, A. Order-disorder type of charge-ordering phase transition in narrow-bandwidth compound, α′-(BEDT-TTF)2IBr2. Physica B 2010, 405, S232–S236. [Google Scholar]
- Kowalska, A.A.; Yamamoto, K.; Yakushi, K. Ferroelectric polarization in α′-(ET)2IBr2 studied by second-harmonic generation microscopy. J. Phys. Conf. Ser. 2008, 132, 012006:1–012006:5. [Google Scholar]
- Yamashita, A.; Watanabe, M.; Kobayashi, K.; Kumai, R.; Yamamoto, K.; Yakushi, K.; Noda, Y. SR-based study of successive phase transition of α′-(BEDT-TTF)2IBr2 II. Meeting Abstr. Phys. Soc. Jpn. 2012, 67, 907. [Google Scholar]
- Sugano, T.; Saito, G.; Kinoshita, M. Conduction-electron-spin resonance in organic conductors: A and b phases of di[bis(ethylenedithiolo)tetrathiafulvalene]triiodide [(BEDT-TTF)2I3]. Phys. Rev. 1986, 34, 117–125. [Google Scholar] [CrossRef]
- The optical conductivities from 50–6000 cm−1 of α′-IBr2, α-I3 and α-NH4Hg were obtained in our research group. The low-frequency region from 0–600 cm−1 of β″-(BEDT-TTF)(TCNQ), θm-RbZn, θo-RbZn, and θ-CsZn were extrapolated to the dc conductivity value by straight line. The optical conductivities of θ-RbZn and θ-I3 were taken from the papers reported by Wang [95] and Takenaka [112], respectively.
- Van der Marel, D. Optical Signatures of Electron Correlations in the Cuprates. In Strong Interactions in Low Dimensions; Baeriswyl, D., Degiorgi, L., Eds.; Kluwer Academic Publishers: Dordrecht, The Netherlands, 2004; pp. 237–276. [Google Scholar]
© 2012 by the authors; licensee MDPI, Basel, Switzerland. This article is an open-access article distributed under the terms and conditions of the Creative Commons Attribution license (http://creativecommons.org/licenses/by/3.0/).