Review

Photoinduced Phase Transitions in α-, θ-, and κ-type ET Salts: Ultrafast Melting of the Electronic Ordering

by
Shinichiro Iwai
1,2
1
Department of Physics, Tohoku University, Sendai 980-8578, Japan
2
CREST (Core Research for Evolutional Science & Technology), JST (Japan Science and Technology Agency), Sendai 980-8578, Japan
Crystals 2012, 2(2), 590-617; https://doi.org/10.3390/cryst2020590
Submission received: 14 March 2012 / Revised: 23 April 2012 / Accepted: 24 April 2012 / Published: 30 May 2012
(This article belongs to the Special Issue Molecular Conductors)

Abstract

:
Photoinduced phase transitions in organic compounds with strong electron correlation ET [bis(ethylenedithio)-tetrathiafulvalene)-based salts α-(ET)2I3, θ-(ET)2RbZn(SCN)4, κ-(d-ET)2Cu[N(CN)2Br] were discussed based, on time resolved optical pump-probe spectroscopy using ~150 fs mid-infrared pulse, 12 fs near infrared pulse, and sub-picosecond terahertz pulse. (i) In charge-ordered insulators α-(ET)2I3 and θ-(ET)2RbZn(SCN)4, we captured ultrafast snapshots of charge dynamics i.e., immediate (ca. 15 fs) generation of a microscopic metallic state (or equivalently the microscopic melting of the charge order) which is driven by the coherent oscillation (period; 18 fs) of correlated electrons. Subsequently, condensation of the microscopic metallic state to the macroscopic scale occurs in α-(ET)2I3. However, in θ-(ET)2RbZn(SCN)4, such condensation is prevented by the large potential barrier reflecting the structural difference between the insulator and metal; (ii) In a Dimer–Mott insulator κ-(d-ET)2Cu[N(CN)2Br], photogeneration of the metallic state rises during ca. 1 ps that is much slower than the melting of charge order, because the photoinduced insulator to metal transition is driven by the intradimer molecular displacement in the dimer Mott insulator. The ultrafast dynamics of photoinduced insulator–metal transitions depend strongly on the molecular arrangement, reflecting various competing phases in the ET sheets.

1. Introduction

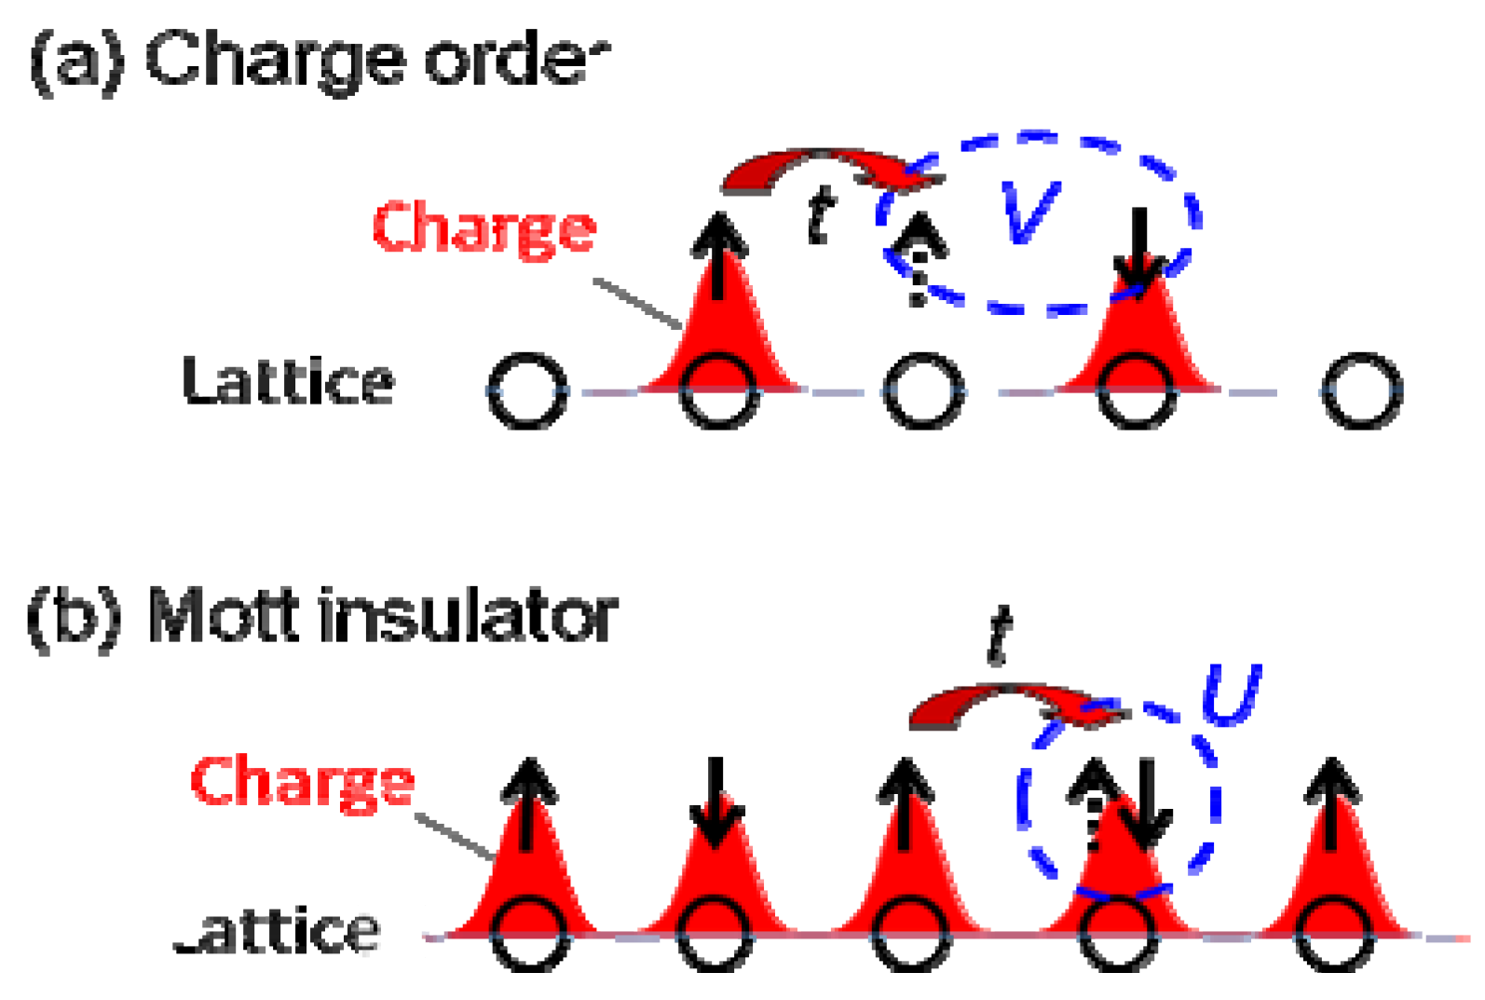
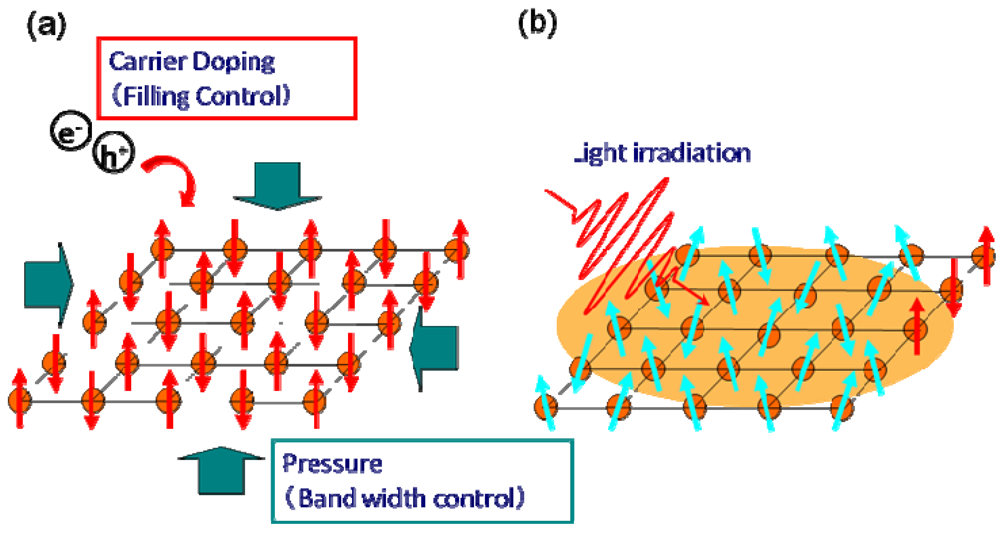
The insulator to metal (I–M) transition is the most well known electronic phase transition in correlated electron systems, as described in the text book [1]. The I–M transition is a melting of the frozen charge, which is localized by Coulomb repulsion interaction U (on-site) and V (inter-site), i.e., the charge-ordered (CO) insulator and Mott insulator. Figure 1a,b shows the schematic illustrations of the CO insulator (Figure 1a) and the Mott insulator (Figure 1b), respectively. Charges are localized in a pattern of 1, 0, 1, 0, 1, … in the CO insulator and 1, 1, 1, 1, … in the Mott insulator. The dramatic change of the electronic phase from insulator to metal attracts much attention in itself, but this phenomenon is also related to other exotic phase transitions involving superconductivity, ferroelectricity, and ferromagnetism. Many examples of I–M transitions induced by the filling control (FC) and the bandwidth control (BC) have been reported in 3d transition metal oxides [2] and/or low dimensional organic conductors [3,4] (Figure 2a). In addition, photoexcitation can induce I–M transition [5,6,7,8,9,10,11,12,13,14,15,16] (Figure 2b).
Figure 1. Schematic illustrations of (a) CO insulator and (b) Mott insulator. U, V, and t respectively represent on-site and inter-site Coulomb energies and an intermolecular transfer integral.
Crystals 02 00590 g001
Figure 2. (a) Schematic illustrations of filling control (FC) and bandwidth control (BC) I–M transition and (b) the photoinduced I–M transition.
Crystals 02 00590 g002
The photoinduced I–M transitions (PIMTs) are dynamic melting of the electron ordering in a Mott insulator and the CO insulator. The Mott and the CO insulators sometimes compete with the dielectrically and/or magnetically ordered phases or the superconducting state [1,2,3,4].
Therefore, PIMT is expected to induce electronic or magnetic order. Ultrashort laser technology enables us to realize high-speed switching in terabit/s of optical, electronic and/or magnetic properties (Figure 3a). Furthermore, discovery of new material phases (orders B and C in Figure 3b) as non-equilibrium states on the free energy surface with multi stabilities is expected.
Figure 3. Schematic illustrations of (a) optical switch and (b) photoinduced phase transition from the ground state to non-equilibrium states on the free energy surface with multiple stabilities.
Crystals 02 00590 g003
Layered organic compounds (ET)2X [ET; bis(ethylenedithio)tetrathiafulvalene, hereafter ET, X; anion (acceptor)] are typical of organic compounds with strong electron correlation [3,4]. The series of this compound consists of ET (donor, D) and acceptor (A) sheets, as portrayed schematically in Figure 4. A characteristic feature of this organic salt is that the difference in the molecular arrangement in the donor sheet shows various polytypes such as θ-, α-, and κ-types, as depicted in Figure 5. In D2A-type charge transfer (CT) salts, the highest occupied molecular orbital band of D sheets (average charge of a D molecule is +0.5) is 3/4-filling. In such salts, a CO insulator, in which the electrons (or holes) are sometimes localized on the molecular site in a pattern as shown by a red circle, is stabilized at low temperature (Figure 5a,b).
The I–M transition is an electronic transition. However, such a dramatic change of the electronic state necessarily affects the lattice, although the manner of electron–lattice interaction depends strongly on the kind of compound. The I–M transition in the typical ET salts α-(ET)2I3 (Figure 5a, CO I–M transition temperature; Tco = 135 K) [17,18,19,20,21,22] shows very small structural change [P1(CO), P Crystals 02 00590 i009(-) (metal)]. However, the I–M transition in another CO compound, θ-(ET)2RbZn(SCN)4 (Figure 5b, Tco = 195 K) [23,24,25], shows the large symmetry breaking of the molecular arrangement upon the I–M transition (C2(CO), I222(metal)), which is induced by changes of the intermolecular dihedral angle. An interesting aspect of the CO is ferroelectricity. Our recent results reveal that a CO state in α-(ET)2I3 shows ferroelectricity, which is attributable to the breaking of the inversion symmetry as a result of charge disproportionation, not by a structural deformation [26]. Such ferroelectricity induced by the electronic origin (electronic ferroelectricity [27,28,29]) is advantageous for high speed switching or modulation of dielectric properties.
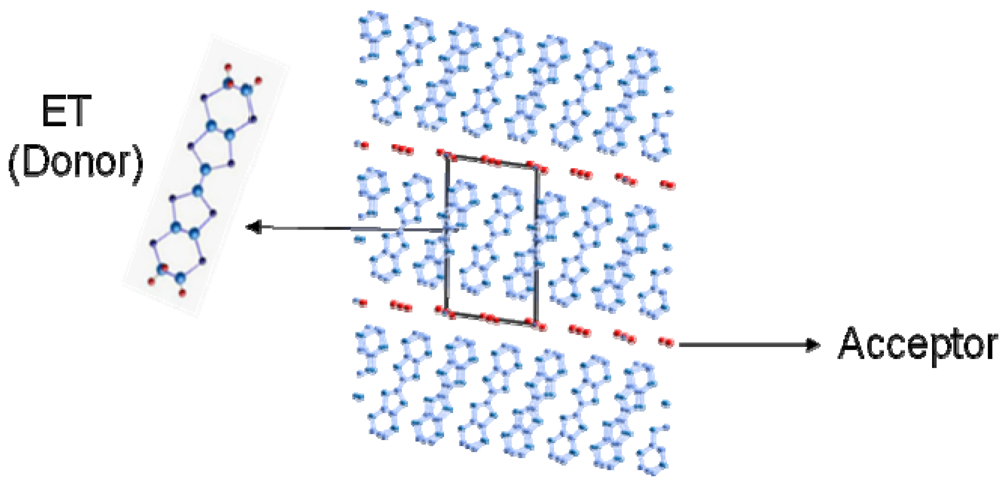
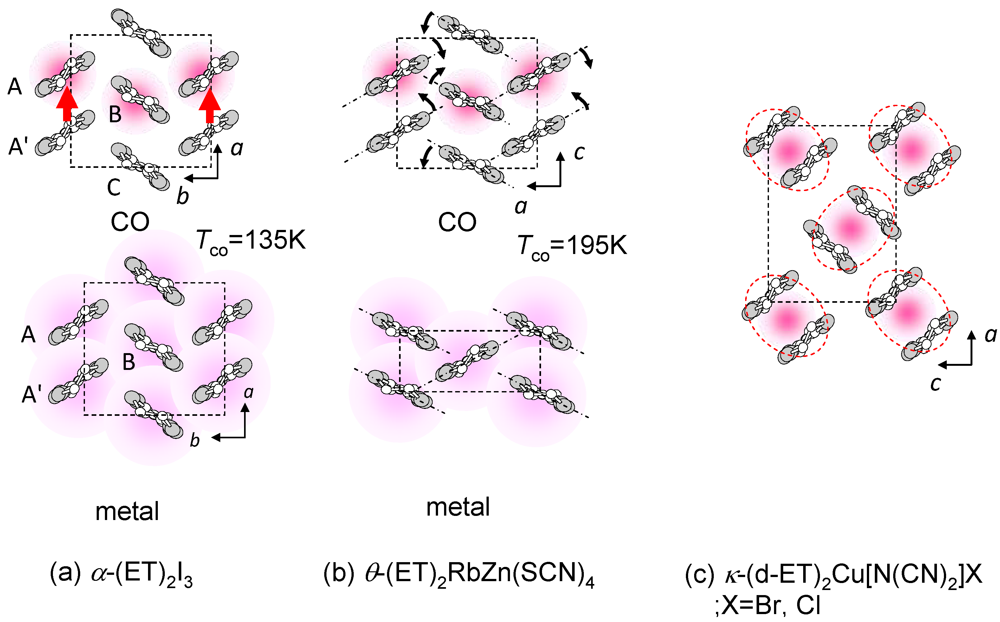
Figure 4. Crystal structure of (ET)2X consisting of donor (ET) layers and acceptor layers.
Crystals 02 00590 g004
Figure 5. Schematic illustration of the molecular arrangement for (a) α-(ET)2I3; (b) θ-(ET)2RbZn(SCN)4; (c) κ-(d-ET)2Cu[N(CN)2]X (X = Br, Cl). Red circles and dashed rectangles respectively denote the localized charge and the unit cell. Red arrows indicate the electric dipole moment induced by the CO.
Crystals 02 00590 g005
Other layered ET salts κ-(d-ET)2Cu[N(CN)2]Br and κ-(d-ET)2Cu[N(CN)2]Cl presented in Figure 5c are Dimer–Mott (DM) insulators [30,31,32,33,34,35]. In κ-type ET salts, the ET layer has a unit comprising a pair of ET molecules (ET dimer). If an effective on-site Coulomb energy Udimer on each dimer site is larger than a critical value, which is usually of the order of the bandwidth and proportional to interdimer (or equivalently inter-site) transfer energy t, then electrons are localized on each dimer site in a Hubbard model, forming a Dimer–Mott insulator.
Various electronic properties have been observed using physical and chemical methods for tuning of bandwidth. The BC phase diagram of κ type (ET)2X salt, comprising a Mott insulator and metal (superconductor) phases, separated by a characteristic curved boundary, is drawn by changing chemical pressure through deuteration of ET and substitutions of X, or by changing of external pressure as discussed in a later section.
In this study, we investigated the fundamental mechanism of photoinduced melting of the CO and the Mott insulators for different polytypes θ, α, and κ type salts. The differences in molecular re-arrangement in the thermal I–M transition for respective polytypes are evident. Therefore, such an approach is effective for clarifying the roles of the electron correlation and the electron-phonon interaction in the PIMT.
This review is organized as follows; in Section 2, experimental setups for various methods of time resolved spectroscopy in near-infrared, mid-infrared (IR) and terahertz (THz) regions for investigating the PIMT will be described. In Section 3, PIMT in CO insulators α-(ET)2I3 and θ-(ET)2RbZn(SCN)4 will be discussed, based on results of near-IR and mid-IR pump-probe spectroscopy with time resolution of 200 fs (3.1.–3.3.) [15,36], optical pump-THz probe spectroscopy (3.4.) [37], high-time resolution spectroscopy using infrared 3-optical cycle (12 fs) pulses (3.5.) [38]. The PIMT in the Dimer–Mott insulator κ-(d-ET)2Cu[N(CN)2]Br is discussed in Section 4 [39]. In Section 5, we summarize the results described above.

2. Experimental Section

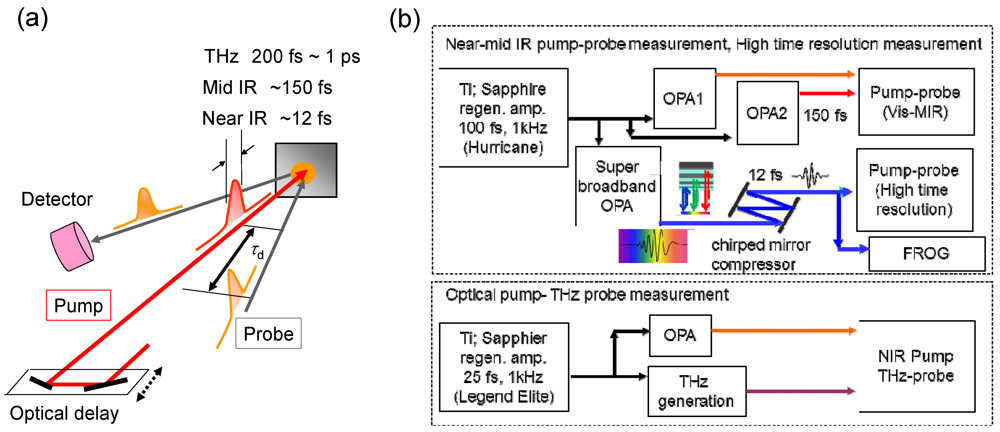
Single crystals of α-(ET)2I3 (~1.5 × 1.5 × 0.2 mm), θ-(ET)2RbZn(SCN)4 (~1 × 1 × 0.2 mm) and deuterated κ-(d-ET)2Cu[N(CN)2]Br (~1 × 1 × 0.5 mm) and κ-(d-ET)2Cu[N(CN)2]Cl (~1 × 1 × 0.5 mm) were prepared using a previously reported procedure [17,23,31]. A schematic illustration of pump-probe spectroscopy (Figure 6a) and diagram of the experiments (Figure 6b) are presented. Photoinduced changes of the electronic states in the sample were measured by the probe lights, which are reflected or transmitted from the sample. For near and mid-IR pump-probe measurements, the fundamental output from a Ti: Sapphire regenerative amplifier (Hurricane; Spectra-Physics), operating at 1 kHz, 800 nm, with a pulse width of ca. 100 fs, was used for the excitation of optical parametric amplifiers (OPAs) or the generation of THz pulse.
For the near- and mid-IR pump-probe measurements, signal, idler pulses generated in type II β-BaB2O4 (BBO) and differential frequency generation (DFG) between them were used as pump and probe lights. Energies of pump and probe beams are, respectively, Eex = 0.89 eV and Epr = 0.1–0.8 eV. Time resolution of the near- mid IR pump-probe measurement was approximately 200 fs, determined by the pulse width of the signal, idler and DFG pulses (100–150 fs). For pump-probe spectroscopy with higher time resolution, super broadband 2nd stage OPA with a degenerate type I configuration in BBO crystal [40], which was pumped by the Ti: sapphire amplifier, was constructed. In such degenerate OPA, phase matching condition is satisfied in 1.2–2 μm, resulting in the super broadband OPA. Such super broadband pulses were compressed using the computer controlled active mirror compressor or chirped mirror compressor. The center wavelength and pulse width were, respectively, measured by the frequency resolved time gating (FROG) measurement as 12 fs, and 1400 nm. In this measurement, time resolution of the pump-probe measurement was evaluated as 15 fs by the cross correlation at the 10-μm-thick BBO at the sample position in the cryostat.
Figure 6. (a) Schematic illustration of pump-probe (reflection detected) spectroscopy. τd represents the time delay between the pump and the probe pulses. Time resolution of the measurement setups are, respectively, 200 fs [near-IR, mid-IR (0.1–0.8 eV), 12 fs [near-IR (0.65–0.9 eV)], and ~1 ps [THz (2–25 meV)]; (b) Experimental diagrams of visible-mid IR pump-probe measurement, high time resolution measurement and optical pump and THz probe measurement.
Crystals 02 00590 g006
For the optical-pump THz-probe experiment, a THz probe pulse was generated by the second-order nonlinear effect in ZnTe crystal (thickness, 3 mm) and GaP crystal (thickness, 0.5 mm). We employed the 25 fs pulse from a Ti: sapphire regenerative amplifier (Legend Elite USX; Coherent Inc.) as an excitation source for generating a THz pulse. The terahertz pulse was focused on the 1.2-mm diameter sample surface. The residual beam was used for generating a 1400 nm pump beam in the OPA. The pumping diameter on the sample was ca. 2 mm. The transmitted THz probe was detected using an electro-optical (EO) sampling method. The probing energy region and the time resolution were, respectively, 0.5–7 THz and ca. 1 ps.

3. Photoinduced Melting of CO and Metallic Domain Formation in α-(ET)2I3 and θ-(ET)2RbZn(SCN)4 [15,36,37,38,39]

3.1. Mid-IR Response Reflecting the Photoinduced I–M Transition [15,36]

Figure 7a,c respectively shows the polarized reflectivity spectra of α-(ET)2I3 and of θ-(ET)2RbZn(SCN)4 for the electric field of light perpendicular to the molecular stack [a-axis in α-(ET)2I and c-axis in θ-(ET)2RbZn(SCN)4]. A reflection band at less than 0.8 eV was assigned to the CT transition between the ET molecules [41,42,43]. Reflectivity (R) spectra for temperatures T > Tco and T < Tco are shown respectively as dashed and solid curves. Open circles in Figure 7b,d shows the transient reflectivity change ΔR/R spectra at 20 K.
Figure 7. Reflectivity spectra of (a) α-(ET)2I3; (c-(ET)2RbZn(SCN)4 [15]. ΔR/R spectra measured at td = 0.1 ps (20 K) are shown as red circles for (b) α-(ET)2I3; (d) θ-(ET)2RbZn(SCN)4. Excitation energy Eex and intensity Iex are, respectively, 0.89 eV and 0.1 mJ/cm2. Differential spectra (RM-RI)/RI reflecting the thermal I–M transition are shown in (b) and (d) as solid curves.
Crystals 02 00590 g007
The pump (Eex = 0.89 eV) and probe lights were polarized perpendicular to the molecular stack. The ΔR/R spectra measured at td = 0.1 ps are analogous to the differential reflectivity spectra (RM RI)/RI (solid curves in Figure 7b,d), in which RM and RI respectively represent the reflectivity of the high temperature {150 K [α-(ET)2I], 200 K[θ-(ET)2RbZn(SCN)4]} metallic and CO insulator phases {20 K [α-(ET)2I], 10 K [θ-(ET)2RbZn(SCN)4]}, which indicates that the PIMT occurs immediately after photoexcitation in both compounds. The spectral coincidence between (RM RI)/RI and the transient reflectivity in the mid-infrared region shows that the optical excitation results in the generation of the metallic state, which is similar to the high-temperature metal.
The magnitude of ΔR/R observed at 0.1–0.8 eV for td = 0.1 ps increases linearly with excitation intensity (Iex) up to 0.1 mJ/cm2. Considering the absorption coefficients {5000 cm−1 [α − (ET)2I3], 15,000 cm−1 [θ-(ET)2RbZn(SCN)4]} at 0.89 eV and unit cell volumes [1690 Å3 for α-(ET)2I3, 2050 Å3 for θ-(ET)2RbZn(SCN)4], the Iex of 0.1 mJ/cm2 corresponds to the excitation of one photon per approximately 600 [α-(ET)2I3], 1600 [θ-(ET)2RbZn(SCN)4] and donor molecules. The efficiency of the PIMT is evaluated as 250 [α-(ET)2I3], and 100 [θ-(ET)2RbZn(SCN)4] molecules/photon. According to these results, PIMT starts with the generation of the microscopic metallic clusters of 100–200 molecules (a scale of ca. 10 nm).
The ultrafast (<100 fs) PIMTs for both α-(ET)2I3 and θ-(ET)2RbZn(SCN)4 suggest that these responses are not driven by structural instability. Recent results of the pump-probe experiment using three-optical cycle (12 fs) IR pulses shows that the initial process occurs in the timescale of ca. 15 fs [38], as shown in Section 3.5. Such an ultrafast response indicates that the molecular rearrangement or structural change is unimportant and that electronic processes play a main role because the initial response is as fast as the timescale of the intermolecular CT (ca. 20–40 fs).

3.2. Recovery Dynamics of the Photoinduced Metallic State
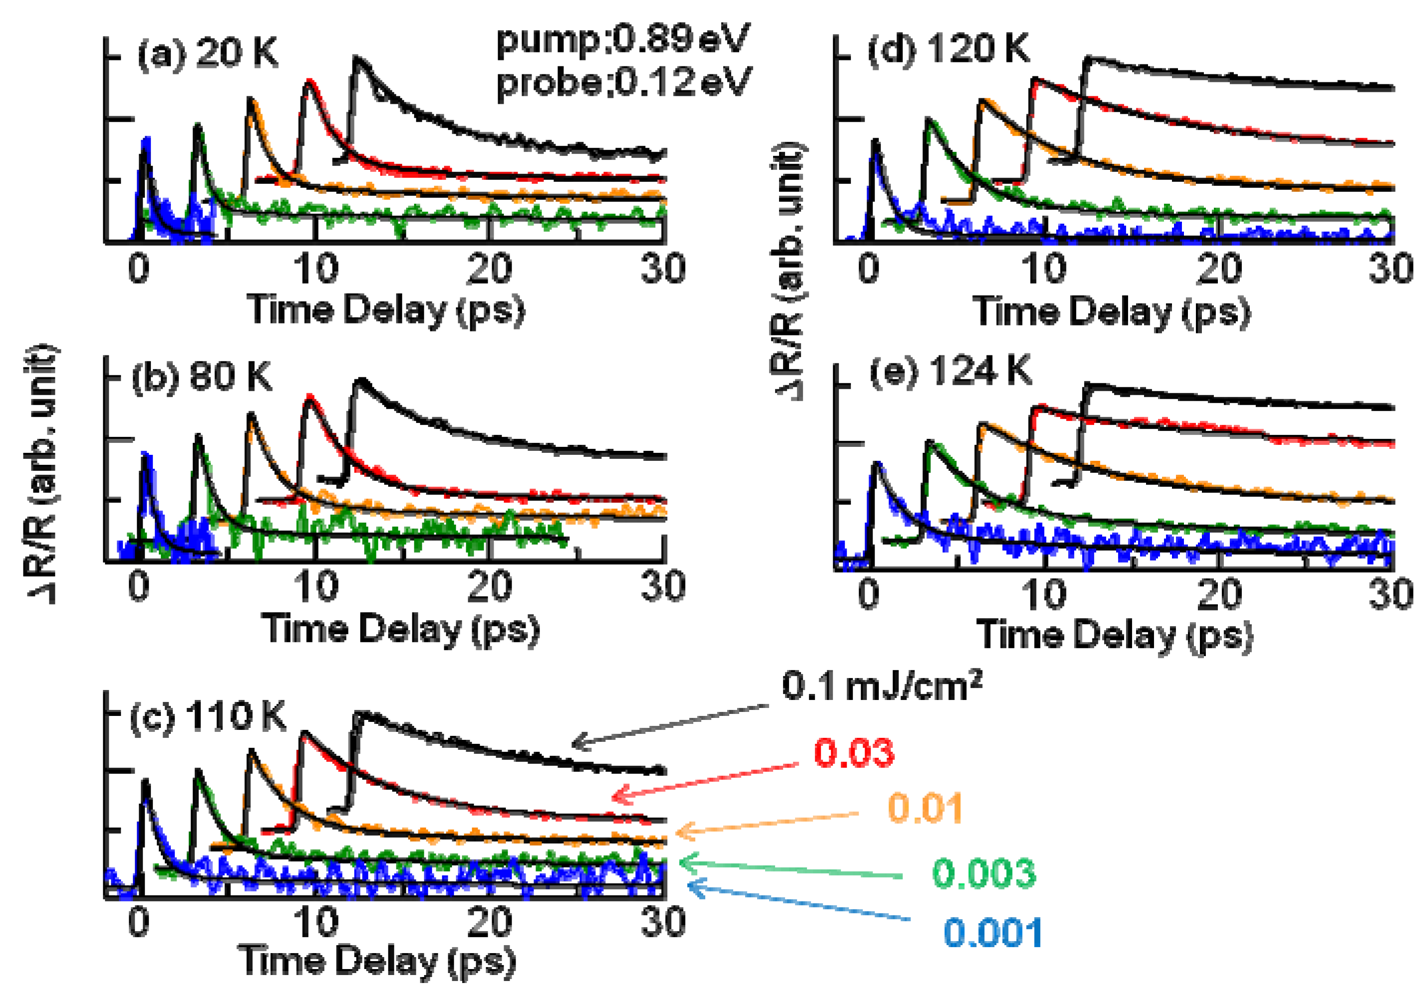
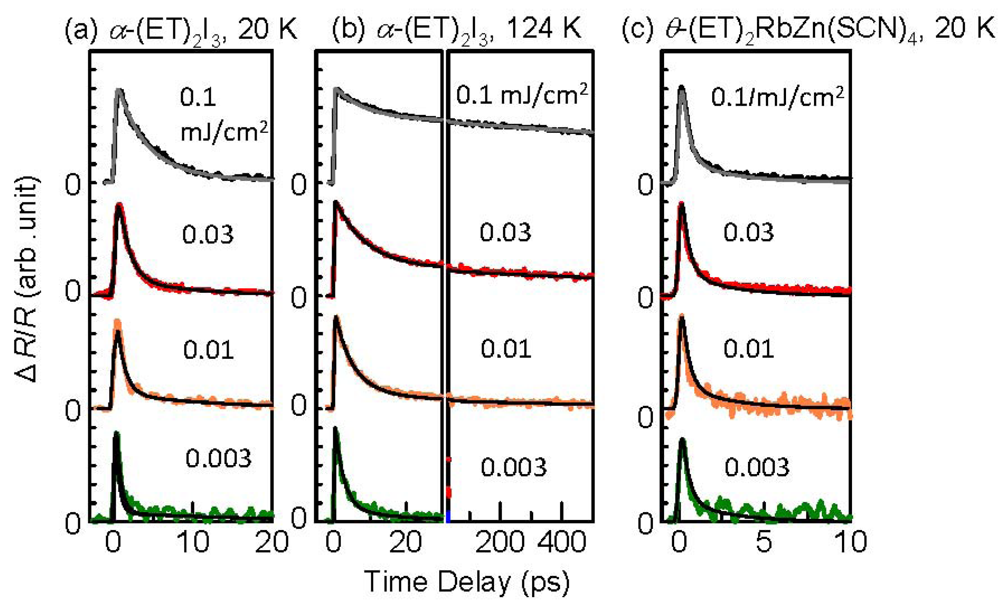
In this section, relaxation processes of the photoinduced metallic state are discussed. Time evolutions of ΔR/R at 0.12 eV in α-(ET)2I3, reflecting the recovery dynamics of the photoinduced metallic state to the original CO state for various Iex values and temperatures, are shown in Figure 8a–e. Figure 9a,b summarize the time evolutions [Figure 9a α-(ET)2I3 (20 K), Figure 9b α-(ET)2I3 (124 K)] together with that of θ-(ET)2RbZn(SCN)4 (20 K) (Figure 9c). The decay curves of α-(ET)2I3 depend strongly on Iex and temperature. Figure 9b shows that the decay time of the dominant component lengthens with Iex in the picosecond region. At 124 K, just below Tco, the decay time increases more markedly with Iex from the sub-picosecond to the nanosecond time domain. The longer decay time for the larger Iex near Tco suggests the inhomogeneous characteristics of the photoinduced metallic state, as portrayed in Figure 10, i.e., the microscopic metallic domain is relaxed rapidly to the charge-ordered state for small Iex. For large Iex, the microscopic domains were condensed into the macroscopic domain to reduce the interfacial energy, accompanying the molecular rearrangement, as described later.
Figure 8. Time evolutions of ΔR/R at 0.12 eV in α-(ET)2I3, reflecting the recovery dynamics of the photoinduced metallic state to the original CO state for various Iex values and temperatures are shown. Fitting curves [see the text (3.3)] are also shown as black curves.
Crystals 02 00590 g008
Decay profiles for θ-(ET)2RbZn(SCN)4 (Figure 9c) were fitted using a two-component exponential curve ΔR(t)/R = Afast exp(−t/τfast) + Aslow exp (−t/τslow) whose decay times τfast, τslow [fractions Afast/(Afast + Aslow), Aslow/(Afast + Aslow)] are τfast = 0.2 ps (0.83) and τslow = 2 ps (0.17). The recovery dynamics are independent of Iex (0.001–0.1 mJ cm−2) and temperature (20–150 K).
The thermodynamic natures of the photoinduced macroscopic metallic domain in α-(ET)2I3 will be described in the next section. Here, the difference between the relaxation dynamics of α-(ET)2I3 and that of θ-(ET)2RbZn(SCN)4 is considered. In θ-(ET)2RbZn(SCN)4, marked temperature and Iex dependences were not observed, indicating that the condensation of the dense metallic domain did not occur. These results are related with how different from each other the structures of the I-phase and M-phase are in the thermal I–M transition for both compounds: in the CO phase of θ-(ET)2RbZn(SCN)4, structural symmetry is reduced by the change in molecular rotation in the a-c plane and molecular tilts from the b-axis [23,24,25] (Figure 5b), modulating the intermolecular CT, although such structural modification is very small in the thermal I–M transition of α-(ET)2I3 [18,19] (Figure 5a). Considering the large molecular rearrangement is observed in θ-(ET)2RbZn(SCN)4 [23,24], potential barriers against molecular displacement, such as changes of dihedral angle, might block the evolution of macroscopic quasi-stable metallic domains. Consequently, the microscopic, unstable metallic domains return to the charge-ordered states within a few picoseconds (Figure 10b). The small structural difference and the small barrier between the CO and metallic phases in α-(ET)2I3 favor generation of the macroscopic metallic domains (Figure 10c).
Figure 9. Time evolutions of ΔR/R for [(a) α-(ET)2I3 (20 K), (b,c) α-(ET)2I3 (124 K)] are summarized together with that of θ-(ET)2RbZn(SCN)4 (20 K) (c).
Crystals 02 00590 g009
Figure 10. Schematic illustrations of (a) initially produced microscopic metallic domains; (b) fast recovery of the charge-ordered state in θ-(ET)2RbZn(SCN)4; (c) macroscopic metallic domain in α-(ET)2I3.
Crystals 02 00590 g010
Accordingly, the primary processes of the PIMT in the CO ET salts consist of the following two steps: (i) generation of the microscopic domain by the electronic photo-doping response (α-(ET)2I3, θ-(ET)2RbZn(SCN)4) in <100 fs timescale and (ii) the condensation of the metallic domain accompanying the molecular rearrangement (α-(ET)2I3). Detailed dynamics of the microscopic metallic state in a shorter time region will be discussed in Section 3.5.

3.3. Thermodynamic Nature of the Photoinduced I–M Transition Critical Slowing Down in α-(ET)2I3. [15,36]

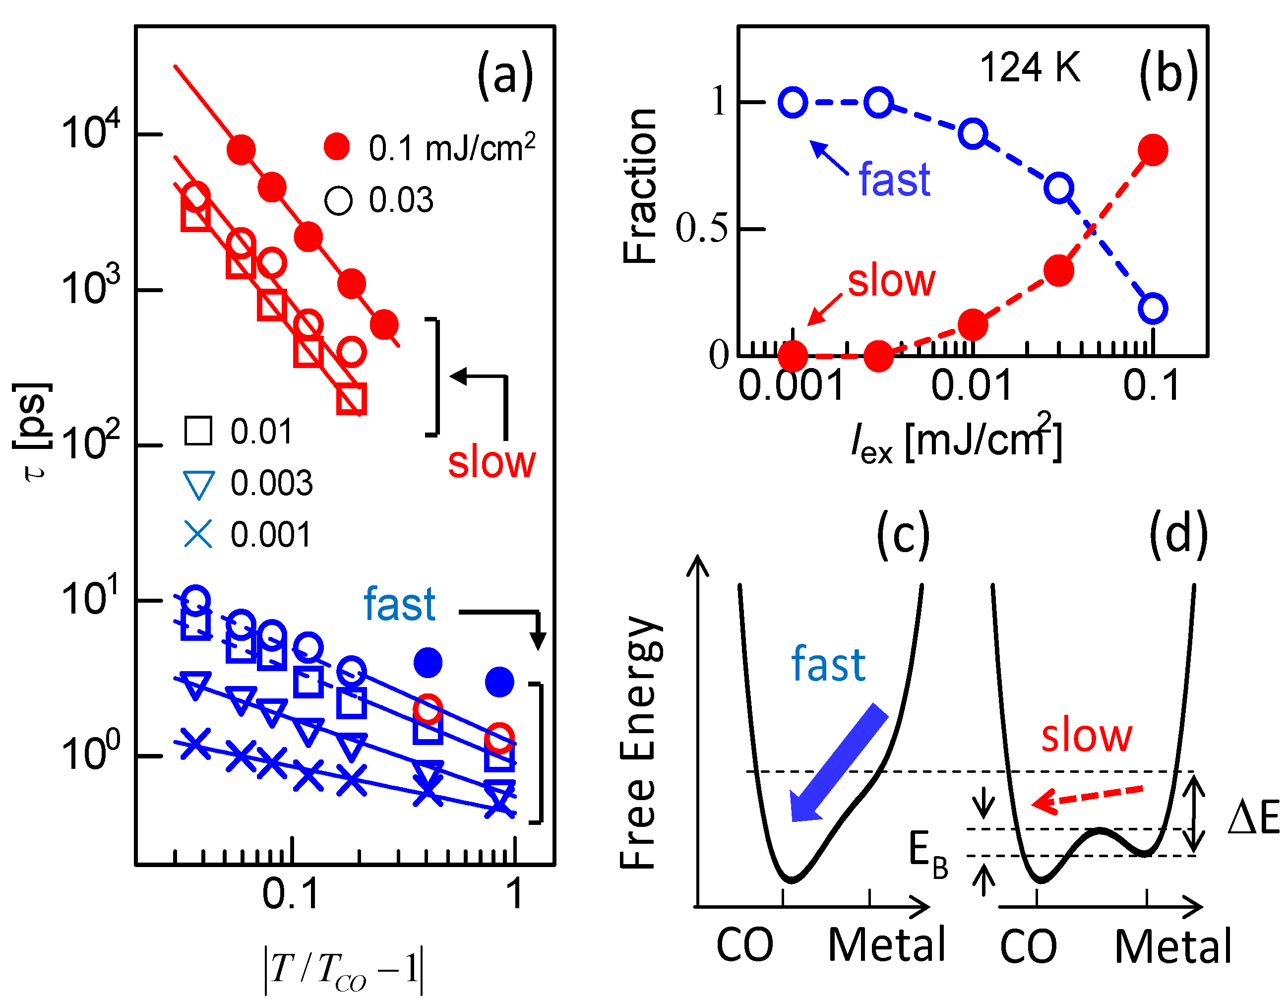
Another feature of the PIMT in α-(ET)2I3 is that the relaxation time (τ) of the metallic state shows critical slowing down (CSD) [44], indicating a reduction of the thermodynamic recovery force of the CO state near Tco, as shown in Figure 11c,d, i.e., a large instability induces fast recovery for T << Tco (Figure 11c). The slower recovery for T~Tco is attributable to its slight instability (Figure 11d). The thermodynamic natures of the photoinduced phase transition have been extracted from the CSD [45,46]. As described in the previous section, the slower decay for larger Iex is attributable to condensation of the short-lived microscopic domain to the macroscopic domain. The temperature dependence of the decay times of ΔR/R, τfast and τslow, are shown as functions of reduced temperature |T/Tco − 1| for various Iex values in Figure 11a. Furthermore, τfast and τslow represent the time constants obtained from the fitting procedure, with three exponential functions whose time constants are τfast ~ 1 ps, τmiddle ~15 ps, and τslow ~ 1 ns (Figure 8 and Figure 9). Of the three components, the decay time of the small (ca. 5%) component τmiddle (~15 ps) is independent of temperature, indicating that τmiddle is unrelated to the I–M transition. The Iex dependences of the relative fraction for the fast and slow components are presented in Figure 11b. The fast component was observed solely for small Iex, whereas the slow component becomes dominant for large Iex. Therefore, τfast and τslow are attributable to the relaxation of the microscopic and the macroscopic metallic domains. Figure 11a shows that, for T < Tco, τfast and τslow increase with |T/Tco − 1|.
According to the dynamic scaling theory (DST) of the second-order transition, the CSD observed in the relaxation time (τ) of the quasi-stable state can be represented by τ Crystals 02 00590 i001 |T/Tco − 1|vz, where ν and z respectively signify critical exponents of the correlation length ξ and the dynamic critical exponent. For Iex > 0.01 mJ cm−2, τslow shows νz = 1.8, which is close to the calculated value (=2.1665), as evaluated by Monte Carlo simulation within the framework of the 2-D Ising model [47]. The slow component is therefore attributable to the macroscopic metallic domain. These results underscore that the thermodynamic characteristics of the microscopic domain differ from those of the macroscopic domain.
The concept of CSD is available for the second-order transition, although the thermal I–M transition in α-(ET)2I3 is the first-order phase transition. The reason for the observation of CSD-like behavior in the photoinduced metallic state is regarded as explained below. In a second-order phase transition, the energy barrier EB (Figure 11c,d) between both phases is smaller than the energy scale of the critical behavior, i.e., the energy difference ΔE >> EB. In the thermal phase transition, ΔE is in the energy scale of the thermal fluctuation kBT (ca. 10 meV).
Figure 11. (a) Relaxation times of the photoinduced metallic state in α-(ET)2I3, τfast and τslow, are shown as a function of |T/Tco− 1| for various Iex; (b) Fraction of the fast (open circles: τfast ~ 1 ps) and slow (closed circles: τslow ~ 1 ns) decay components are shown as a function of Iex (124 K); (c,d) Schematic illustrations of free energy surface for (c) T << Tco (fast relaxation) and (d) T~Tco (slow relaxation).
Crystals 02 00590 g011
The energy scale of the fluctuation induced by the photoexcitation is extremely large (ca. 1000 meV). Therefore, ΔE >> EB might be satisfied for the photoinduced phase transition, even if the relation is not satisfied in the thermal phase transition because the photoinduced metallic state is far from the ground state. In other words, the observed CSD-like behaviors are not the true “critical” phenomena.

3.4. THz Spectroscopy of Photoinduced Phase Transition Electronic State of Photoinduced Metallic State [37]

Spectroscopic measurement in THz or equivalently the far IR region is well known as a powerful technique for investigating the metallic state in transition metal oxides and low-dimensional organic conductors. To investigate the electronic state of the photoinduced metallic state with the lifetime of approximately one picosecond, transient THz spectra in a picosecond timescale should be obtained using the time resolved optical pump-THz probe spectroscopy.
In earlier sections [Section 3.1.–Section 3.3], we described that the short-lived (ca. picosecond) microscopic metallic state was observed for weak excitation at T << Tco, whereas the macroscopic metallic state is stabilized in the timescale of >ns for strong excitation at T~Tco. Such a dramatic change of the lifetime, depending on Iex and temperature, strongly suggests a difference between the electronic characteristics of the microscopic metal and that of the macroscopic metal. However, optical spectra in mid-IR region cannot probe such a difference.
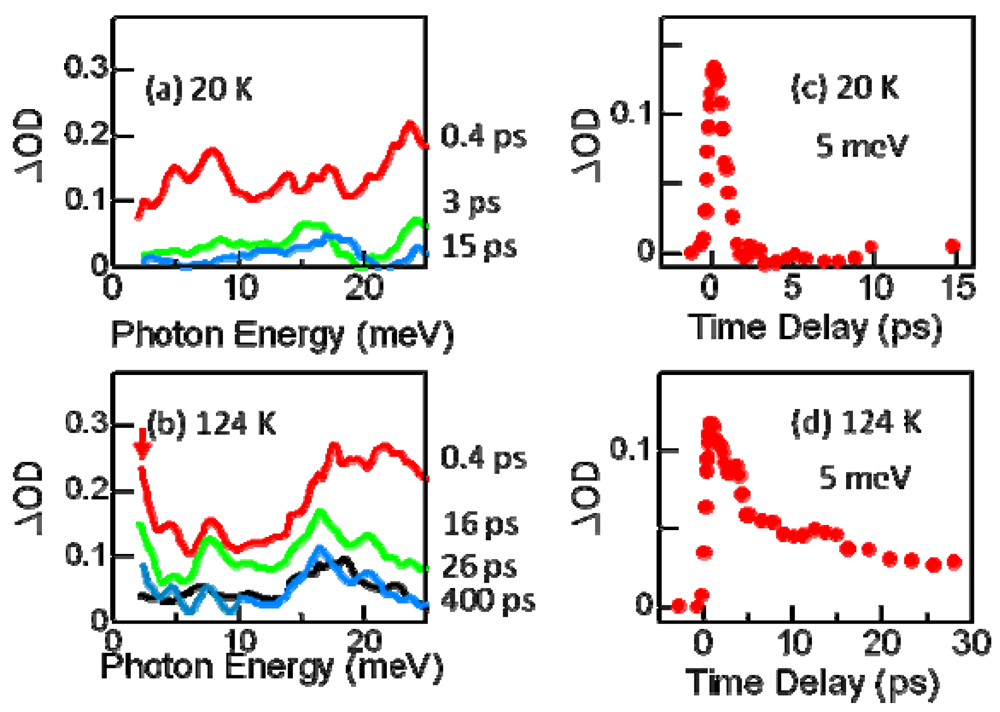
Figure 12a,b shows transient terahertz (ΔOD, photoinduced absorption change) spectra observed respectively at 20 K (a) and 124 K (b) (t = 0.1 ps, Iex = 0.03 mJ/cm2). Both spectra show an absorption increase in the THz region, indicating a closing of the optical gap. The time profiles of the ΔOD shown in Figure 12c,d shows behaviors that are analogous to those of mid-IR response (Figure 8 and Figure 9). However, the transient THz spectra in Figure 12a,b provide additional information, i.e., broad absorption is detected at 20 K, although the Drude-like spectral weight exists in the low energy (<5 meV) region at 124 K (red arrow in Figure 12b). Considering that the time profile presented in Figure 12d reflects the recovery of the macroscopic metallic state, the Drude-like THz response detected at 124 K (T ~ Tco) corresponds to the macroscopic metallic state. The broad absorption increase at 20 K (T << Tco) is attributable to the microscopic metallic state.
Figure 12. (a,b) Transient absorption (ΔOD) spectra in α-(ET)2I3 at (a) 20 K; (b) 124 K in THz region (Eex = 0.89 eV, Iex = 0.03 mJ/cm2); (c,d) Time evolutions detected at 5 meV [(c) 20 K; (d) 124 K].
Crystals 02 00590 g012
It is worth noting that the Drude-like spectral weight detected at 124 K is not observed for the thermal I–M transition, indicating that the low energy electronic characteristics of the photoinduced metallic state differ from those of the high-temperature (HT) steady state metallic state. The electronic properties of the photoinduced macroscopic metallic state remain unclear. However, one possible explanation is that in the photoinduced macroscopic metallic state, the charge disproportionation (CD) is melted on the B–C molecular stacks in Figure 5 arising from the asymmetric structure, is markedly weakened in addition to the melting of the correlated CD on the A–A′ stack. In the HT metallic state, however, the CD on the B–C stack remains [18].

3.5. Ultrafast Snapshot of Correlated Electron Dynamics 10 fs Spectroscopy of Photoinduced Phase Transition [38,41]

In earlier sections, the recovery dynamics of the photoinduced metallic state were discussed, based on the near-, mid-IR and THz spectroscopy with the time resolution of 200 fs to 1 ps. However, that is insufficient to capture the initial dynamics for the I–M transition. Here, ultrafast snapshots are captured using the 3-optical cycle 12 fs pulse in near IR region.
In 1/n filling system (n: 2, 3, 4...), the regularly localized charge patterns shown by Figure 1a,b are balanced electrostatically if the Coulomb repulsion interaction is sufficiently large. That is, a correlated insulator such as the CO insulator (Figure 1a) and the Mott insulator (Figure 2b). The FC I–M transition is the melting of such regularly localized charge patterns realized using chemical carrier doping. The mechanism of PIMT is sometimes understood using the concept of photo-carrier doping [10]. However, the primary dynamics immediately after the photoexcitation cannot be described by such static carrier redistribution. That requires a more dynamic picture because the PIMT is triggered by the generation of high-frequency electric polarization. Therefore, our fundamental question is “How does such high-frequency electronic oscillation engender the phase transition?”
Recent technology of femtosecond light pulses in the 10 fs region, which are roughly equal to the timescale of the intermolecular electronic motion, enables us to understand the early stage dynamics of PIMT in organic CT compound [38,48]. Here, we employed few-optical-cycle infrared pulses (pulse width, ca. 12 fs) in pump-probe measurements to investigate the early stage dynamics of electron motion in α-(ET)2I3.
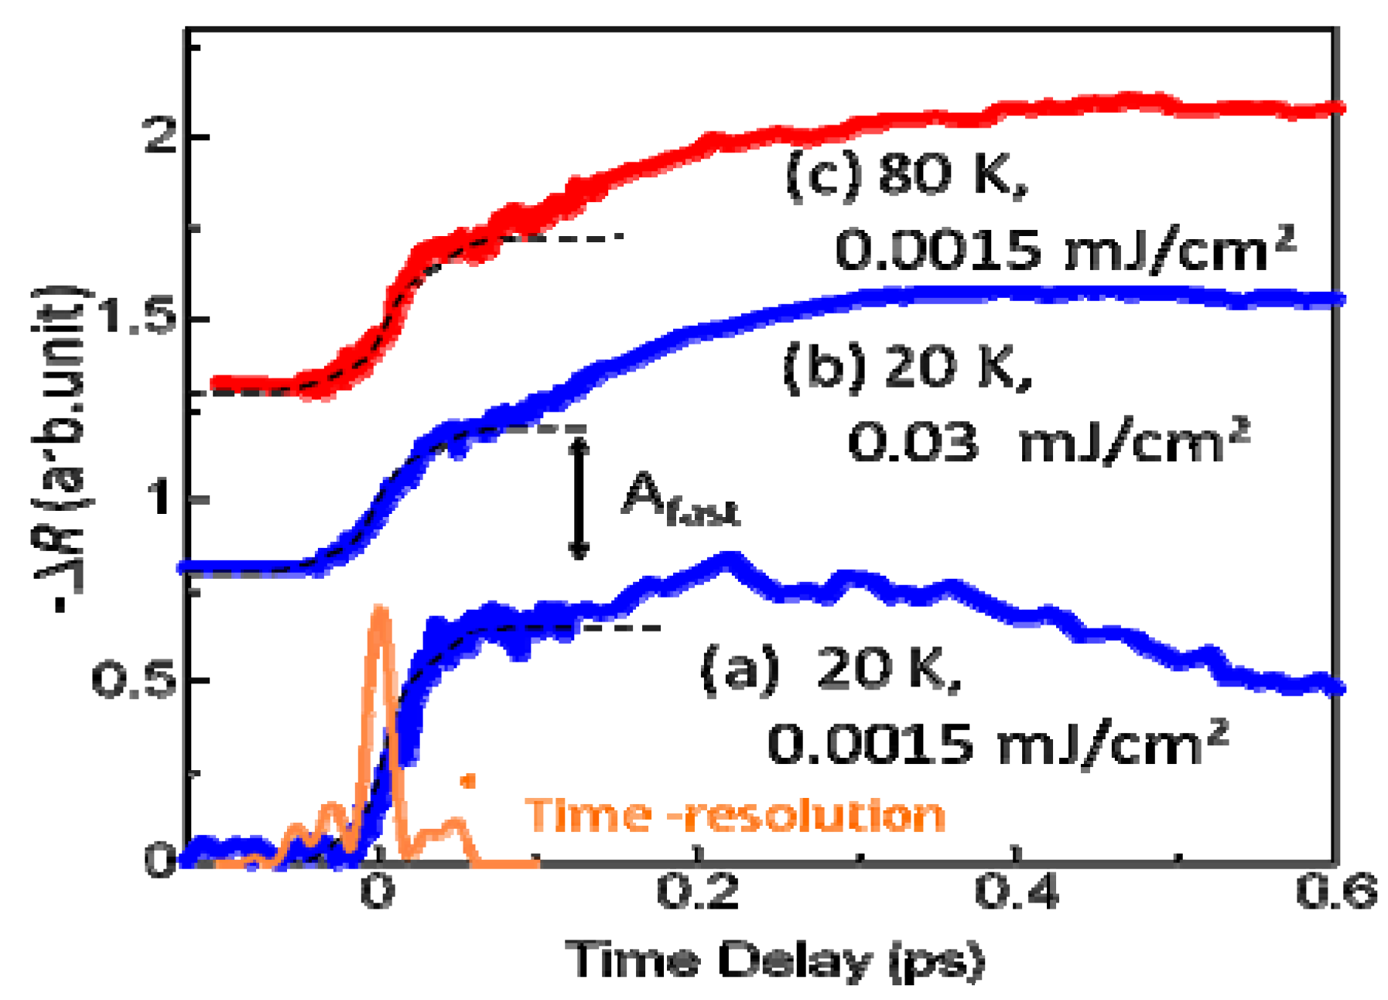
Figure 13a–c shows the time evolution of ΔR/R measured at 0.7 eV at 20 K [(a) Iex = 0.0015 mJ cm–2); (b) Iex = 0.03 mJ/cm2] and 80 K [(c) Iex = 0.0015 mJ/cm2] under excitation by 12 fs pulses, reflecting the generation dynamics of the photoinduced metallic state. The spectral range of the pump and the probe pulses generated by the degenerate OPA (indicated by the orange shaded area in Figure 13a) corresponds to the high-energy side of the intermolecular CT transition. The ΔR/R spectrum shows a marked decrease at ca. 0.7 eV, which indicates the occurrence of the PIMT. The Iex =0.03 mJ/cm2 corresponds to a density of 1 photon/1500 molecules for 0.89 eV excitation. The timescale of the initial rise in the ΔR/R signal (<20 fs) is as fast as that of the correlated electron motion, as discussed later.
Figure 13. Time evolutions of ΔR/R in α-(ET)2I3 at 20 K for (a) Iex = 0.0015 mJ/cm2; (b) 0.03 mJ/cm2 (blue curves) and at (c) 80 K (red curve: Iex =0.0015 mJ/cm2). The orange curve represents the cross-correlation profile between the pump and the probe pulses as a response function G(t).
Crystals 02 00590 g013
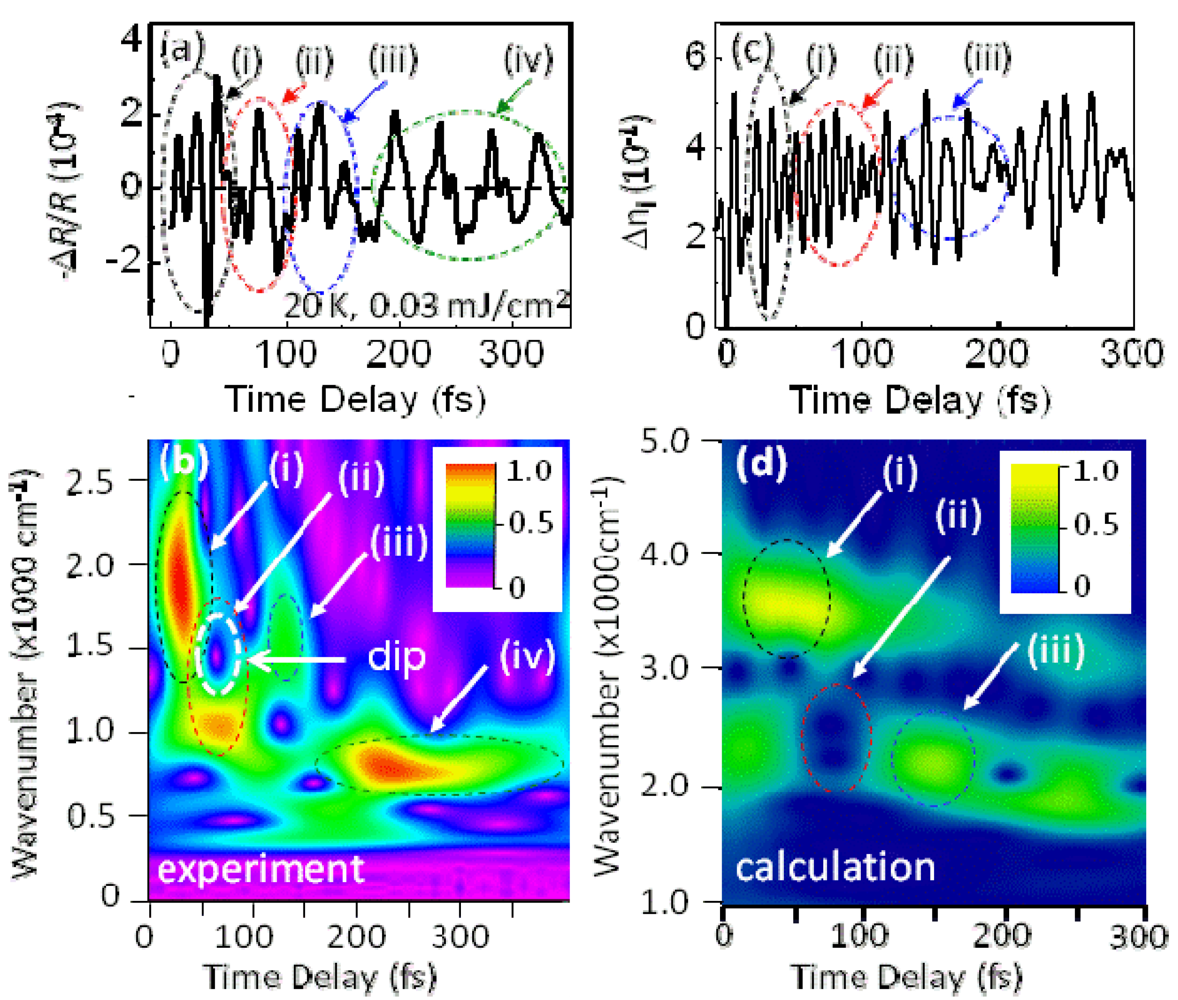
The high-frequency oscillating component of ΔR/R (20 K, Iex = 0.03 mJ/cm2) was obtained using a Fourier high-pass (>300 cm–1) filter (Figure 14a). In addition, a time-frequency spectrogram (Figure 14b) and time-resolved spectra (Figure 15b–e) were obtained by wavelet (WL) analysis of the oscillating component. As indicated by the black dashed circle shown as (i) in Figure 14a,b, the spectrogram is dominated by the broad signal at ca. 1800 cm–1 for td <50 fs. The signal peak exhibits a drastic frequency change with td between (ii) ca. 1000 cm–1 and (iii) 1450 cm–1 for td = 50-200 fs. Then, the (iv) signal approaches ca. 820 cm–1 for td > 200 fs.
Figure 14. (a) High-frequency oscillating component of ΔR/R in α-(ET)2I3 at 20 K for I = 0.03 mJ/m2, which was obtained using a Fourier high-pass (>300 cm–1) filter; (b) Time-frequency spectrogram calculated using wavelet analysis of the high-frequency oscillating component; (c) Calculated photoinduced charge-density modulation (Δni) at molecule A in the extended Peierls–Hubbard model with EMV coupling (see the text); (d) Spectrogram of calculated Δn [38].
Crystals 02 00590 g014
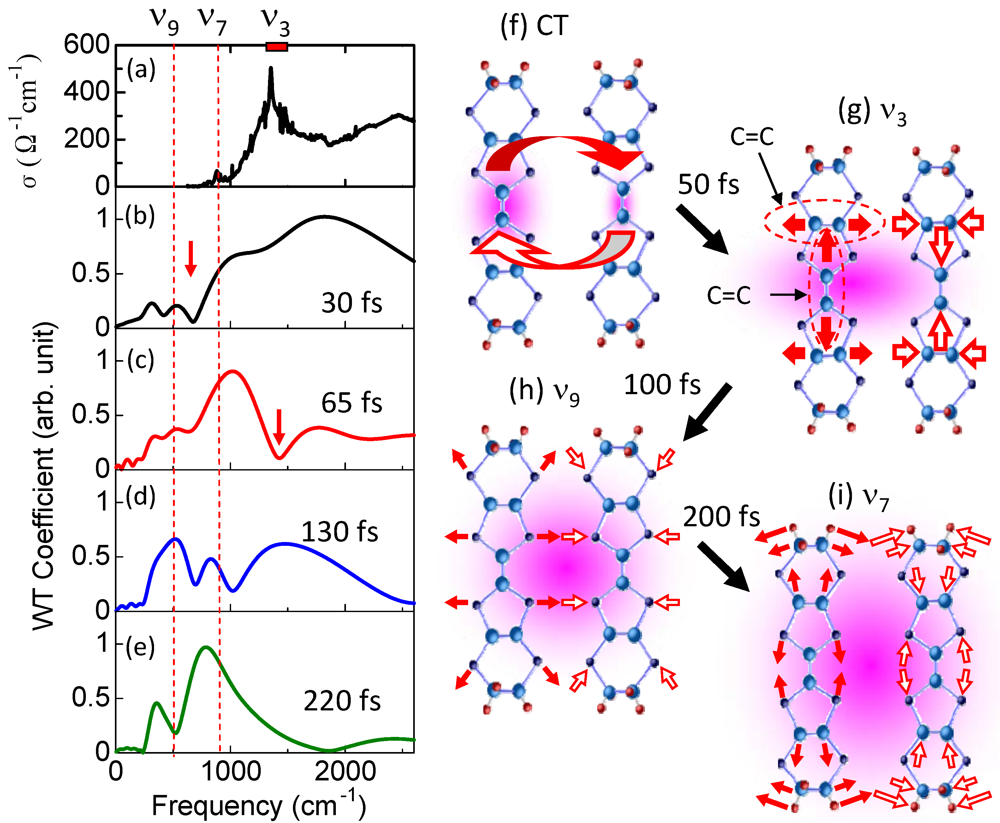
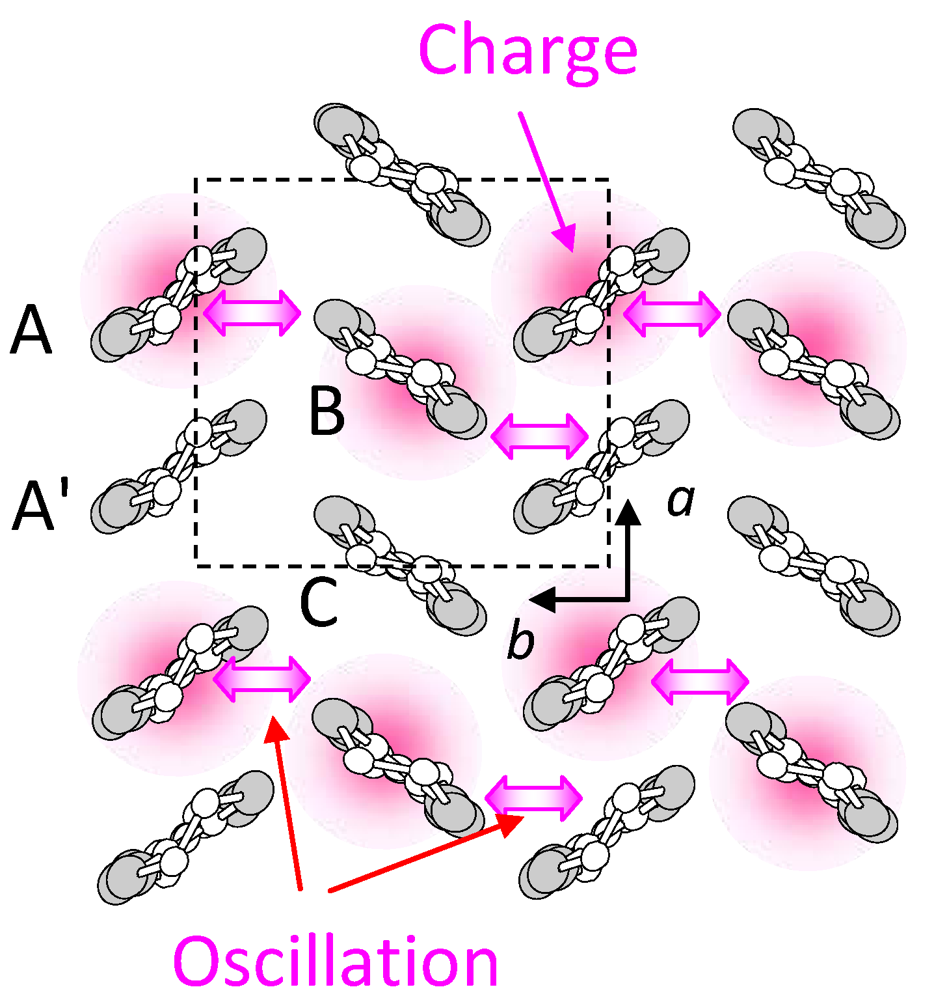
It is worth noting that the broad spectrum at ca. 1800 cm–1 exhibiting the spectral gap at ca. 1000 cm–1 for td = 30 fs [Figure 15b and (i) in Figure 14a,b] is analogous to the steady state optical conductivity spectrum (Figure 15a). Therefore, the oscillation at 1800 cm–1 is attributable to the electron oscillation reflecting the CO gap. This is the first observation of electron oscillation in the time domain. Figure 16 portrays a schematic illustration of such intermolecular electron oscillations. These electron oscillations are efficiently induced between the charge-rich sites (A and B sites) and between the charge-rich site and charge-poor site (B and A’ sites) [38,41,42], as shown by the arrows in Figure 16 and Figure 15f.
Figure 15. (a) Steady state optical conductivity spectrum measured at 10 K in α-(ET)2I3; (be) Time-resolved spectra calculated from Figure 14a; (fi) Schematic illustration of (f) intermolecular electron modulation and intramolecular vibrations (g)ν3, (h)ν9, and (i)ν7 [38].
Crystals 02 00590 g015
Figure 16. Schematic presentation of the electronic oscillation with a period of 18 fs in α-(ET)2I3. The oscillation occurs respectively between A (charge-rich) and B (charge-rich) sites and between B (charge-rich) and A′ (charge-poor) sites.
Crystals 02 00590 g016
Considering that C=C stretching modes ν3 (presented in Figure 15g) appear between 1352 and 1476 cm–1 [49,50,51], the spectral hollow that appears at ca. 1450 cm–1 [arrow in Figure 15c and (ii) in Figure 14a,b] is attributable to the destructive interference that prevails between the electron oscillation and the intramolecular ν3 mode. The observation of such destructive interference, which is attributable to Fano antiresonance [52] at ca. 50 fs indicates that the electron oscillation begins to interact coherently with the intramolecular ν3 mode at the finite time delay. Considering the strong electron molecular vibration (EMV) coupling of the ν3 mode [49,50,51], it is reasonable to consider that the electron oscillation selectively induces the intermolecular anti-phase ν3 vibration, as shown in Figure 15f,g [49,50,51]. After 100 fs, the hollow at approximately 1450 cm–1 disappears; a broad band appears at 1450 cm-1, reflecting the electronic dephasing [Figure 15d and (iii) in Figure 14b]. Then, the disappearance of the broad 1450 cm–1 mode indicates that the coherent ν3 vibration is dephased by interaction with other vibrations.
The other signals at ca. 500 cm–1 (Figure 15d) and 820 cm–1 (Figure 15e) after td = 150 fs are respectively attributable to the ν9 (508 cm–1) (called breathing mode) and ν7 (896 cm–1) modes, as illustrated in Figure 15h,i [49,50,51]. These modes also show large EMV coupling constants (ν3, 0.746; ν9, 0.476; ν7, 0.117; in dimensionless units). Figure 14b and Figure 15c,e suggest that sequential changes occurred in the interacting modes from the local C=C stretching mode (ν3) to the more delocalized breathing mode (ν9) and ν7 mode showing the pathway of e–e and e–ph interactions that leads to the I–M from the electron oscillation.
Yonemitsu et al. calculated the photoinduced electron dynamics by numerically solving the time-dependent Schrödinger equation for the exact many-body wave function for electrons coupled with classical intermolecular phonons and quantum intramolecular phonons, to consider the correlated electron motion and the coherent interplay between the electron and intramolecular ν3 vibration [38,41,42].
Crystals 02 00590 i002
where Crystals 02 00590 i003 creates an electron with spin σ at site i, Crystals 02 00590 i004 , ui,j denotes the intermolecular phonon’s displacement, bi+ creates a quantum phonon of energy ωb, and g is the EMV coupling strength. The other notation is standard, as introduced in an earlier report [41]. Using an eight-site periodic cluster and the same model parameters as those described in that report (ωb = 0.36 eV, g = 0.0625 eV, and an oscillating electric field along the b-axis having a Gaussian profile of duration 5 fs and center frequency ωb = 0.35 eV), we calculated the time evolution of ni at molecule A (Figure 16) for td < 300 fs (Figure 14c) and conducted WL analysis (Figure 14d). The broad peak from 3000 to 4000 cm-1 at around td = 30 fs corresponds to that of the calculated conductivity spectrum in that earlier report [41], indicating that the peak is attributable to the electron oscillation presented in Figure 16 [(i) in Figure 14c,d]. The difference between the experimental and calculated values of the conductivity peak (experiment, 1000–2000 cm−1; calculation, 3000–4000 cm−1) can be attributed to the small cluster size.
For td = 50–100 fs, the spectral hollow at 2000–3000 cm−1 is attributable to the destructive interference between the correlated electron oscillation and the phonon [(ii) in Figure 14c,d]. Then, the phonon peak appears after td = 100 fs [(iii) in Figure 14c,d]. This calculated WL spectrogram that reflects the electron rν3 vibration interference is qualitatively analogous to the experimentally obtained result (Figure 14 b). For td > 100 fs, however, the observed WL spectrogram cannot be reproduced by the calculated one because the other vibrations are not considered in the calculation.
As indicated by the dashed curve in Figure 13a, the time required for the generation of the metallic state (τr) was evaluated as 15 fs at 20 K for Iex = 0.0015 mJ/cm2 using Equation (2):
Crystals 02 00590 i005
where Afast and G(t) respectively represent the coefficient and response function. Here, the cross-correlation profile between the pump and the probe pulses was used as G(t) (orange curve in Figure 13a). A τr value of 15 fs is comparable to the timescale of the electron oscillation (1800 cm–1) in Figure 14a, indicating that the early stage dynamics of the PIMT are driven by the electronic response. This rapid generation process dominates the weak excitation (Iex = 0.015 mJ/cm2) at 20 K.
However, the contribution of an additional slower (ca. 300 fs) growth component increases with Iex and temperature, as indicated by the result for the strong excitation (Iex = 0.03 mJ/cm2) at 20 K and at high temperature 80 K for Iex = 0.0015 mJ/cm2, as presented in Figure 13c, reflecting the generation of the quasi-stable metallic state [15,37]. Considering that the coherent intramolecular vibrations are detected during this slower (ca. 300 fs) growth, it is inferred that the quasi-stable metallic state is generated by the interplay between the electron oscillation and the vibrations.
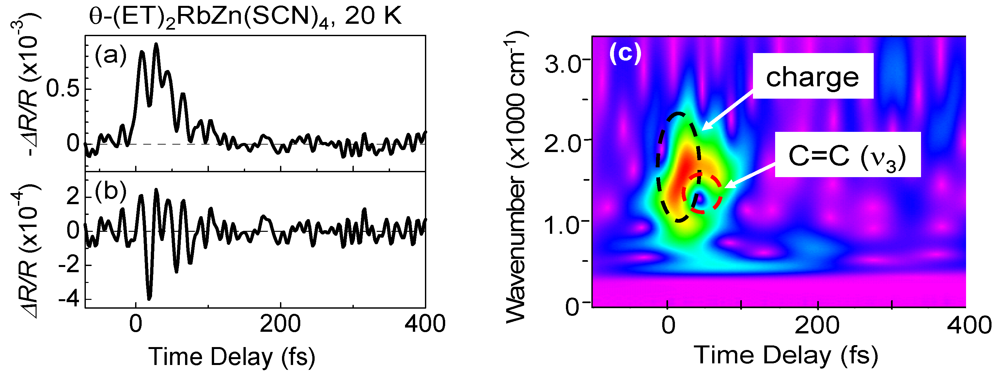
The time evolution of ΔR/R for θ-(ET)2RbZn(SCN)4 is presented in Figure 17. In the near-IR and mid-IR spectroscopy with the time resolution of 200 fs, reflectivity changes disappear at a timescale shorter than 1 ps, reflecting that the microscopic metallic state has not condensed and the CO state quickly recovers [15]. As indicated in the oscillating component (Figure 17b) of ΔR/R and the spectrogram (Figure 17c) in θ-(ET)2RbZn(SCN)4, the electronic oscillation at ca. 1800 cm−1 and the Fano resonance were observed. However, the other oscillating structure detected for α-(ET)2I3 (500 cm−1, 820 cm−1) at a later time delay have not been detected at all. Considering that the macroscopic metallic state is not stabilized in θ-(ET)2RbZn(SCN)4, it is confirmed that the generation of the microscopic metallic state is initially driven by the coherent electronic oscillation. However, oscillation with lower frequencies (500 cm−1, 820 cm−1) is related to the condensation of the macroscopic metallic state in α-(ET)2I3.
Figure 17. (a) Time evolution of ΔR/R in θ-(ET)2RbZn(SCN)4; (b) Oscillating component of ΔR/R and (c) spectrogram.
Crystals 02 00590 g017
The results presented above provide a clear microscopic view of the light-electron-lattice interactions leading up to the PIMT. It is worth noting that this view differs markedly from the traditional description of the e-ph interactions in the framework of thermodynamic analysis such as those obtained using a two-temperature model. The e-ph interaction begins to start before the electrons reach the quasi-equilibrium state. Moreover, finding the electronic coherence before the excited state is affected by the vibrations is important because the coherence of the correlated electron motion is indispensable for realizing optical manipulation of the electronic phase transition. Coherent control has been a central issue for the optical manipulation in few-body atomic systems. The interaction mode, which should be controlled, has not been specified in the PIMT because the initial dynamics are so fast and complicated. Observations of the electronic oscillation and the C=C vibration immediately after excitation will lead to the development of coherent control of the PIMT.

4. Photoinduced I–M Transition in Dimer–Mott Insulator κ-(d-ET)2Cu[N(CN)2]Br [35]

4.1. Bandwidth Control Mott Transition in κ-Type ET Salts

Another well-known layered ET salts with strong electron correlation is κ-(ET)2X, as presented in Figure 5c [3,30]. This compound exhibits phase transitions from the DM insulator to metal and superconducting states by application of chemical or hydrostatic pressures [30,31,32,33,34,35]. In such BC control I–M transition, the kinetic energy of the electron is enhanced by increasing the intermolecular overlapping of electronic wave functions.
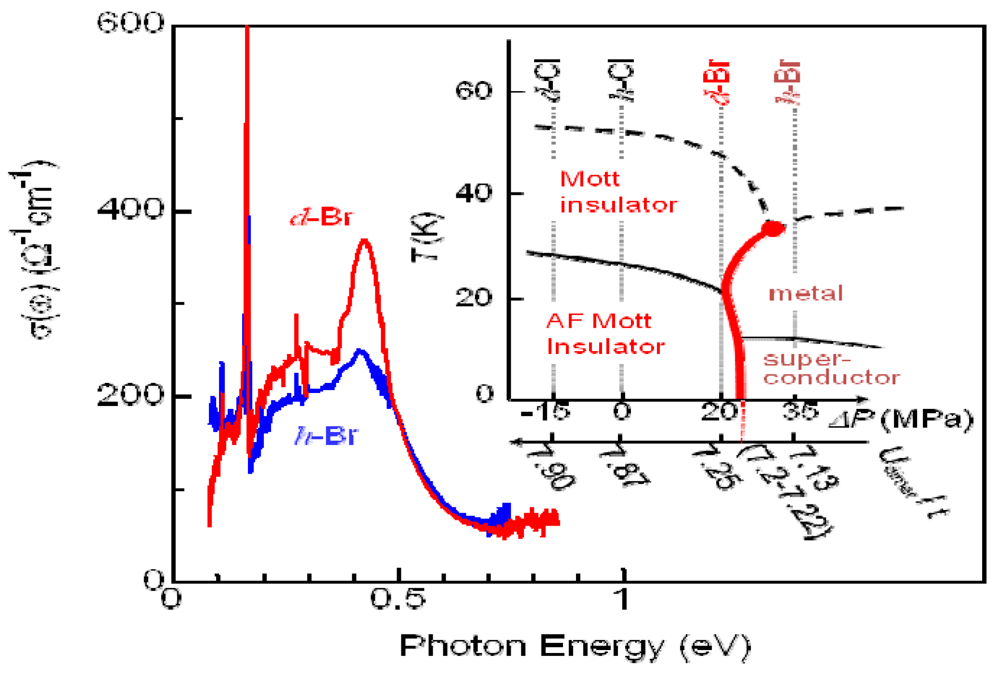
Around the characteristic curved phase boundary (1st order phase transition line) in the phase diagram (inset in Figure 18) for the partially deuterated sample κ-[(d-ET)x(h-ET)1x]2Cu[N(CN)2]Br, [(d-ET) and (h-ET) show deuterated and non-deuterated ET molecules], phase separation occurs [30,31,32,33,34,35]. For our experiment, we used the fully deuterated κ-(d-ET)2Cu[N(CN)2]Br (d-Br) and κ-(d-ET)2Cu[N(CN)2]Cl (d-Cl) which are positioned as insulators, respectively, at lesser or greater distance from the first-order I–M phase boundary, although hydrogenated κ-(h-ET)2Cu[N(CN)2]Br (h-Br) is a metal.
Figure 18. Optical conductivity σ(ω) spectra of d-Br (red) and h-Br (blue) at 10 K. The inset shows the phase diagram of κ-(ET)2X as functions of external pressure (ΔP) and Udimer/t, which is drawn by changing the deuteration of ET and substitutions of X.
Crystals 02 00590 g018

4.2. Mid-Infrared Pump-Probe Spectroscopy of κ-(d-ET)2Cu[N(CN)2]Br (d-Br) and κ-(d-ET)2Cu[N(CN)2]Cl (d-Cl)

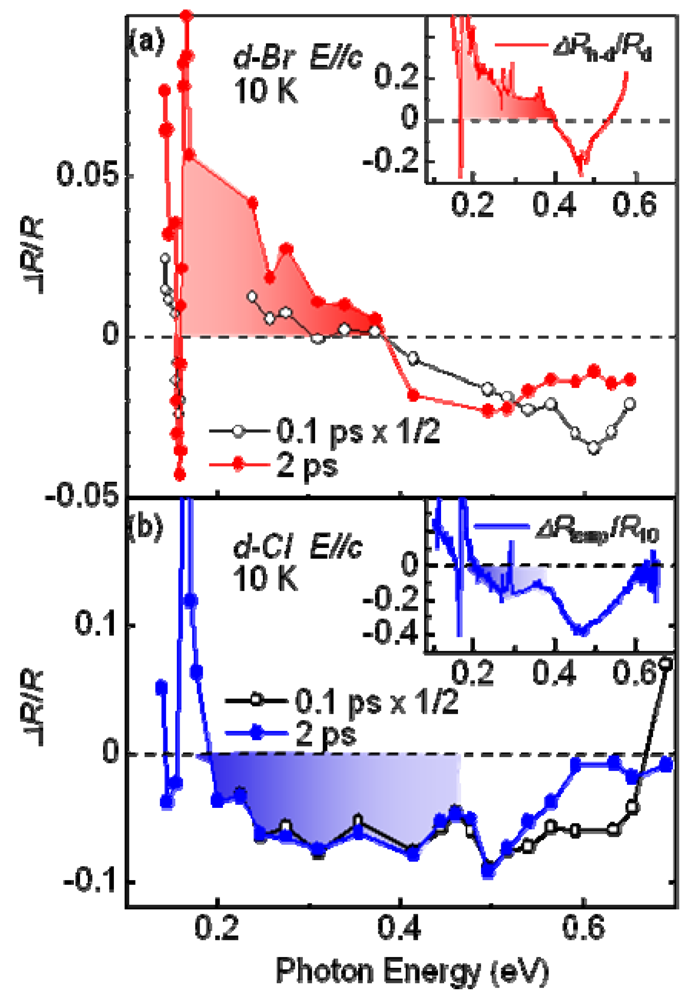
Optical conductivity σ(ω) spectra of the DM insulator d-Br and metallic h-Br are obtained by carrying out a Kramers–Kronig transformation of the reflectivity spectra, as presented in Figure 18. The peak at 0.45 eV and a lower energy shoulder are respectively attributable to the intradimer (bonding to anti-bonding) transition and interdimer Hubbard gap transition [34,35]. Insets of Figure 19a,b show a differential spectrum between h-Br and d-Br at 10 K (ΔRh−d/Rd; red curve) and that for d-Br between 80 K and 10 K (ΔRtemp/R10; blue curve), which respectively reflect the I–M transition and the temperature increase. The characteristic increase in ΔRh−d/Rd around <0.4 eV (red shade) is attributable to a Drude-like reflection, although the decrease in ΔRtemp/R10 around 0.2–0.6 eV (blue shade) reflects the thermal excitation of carriers against the small activation energy. In these compounds, the thermal I–M transition does not occur.
Figure 19. ΔR/R spectra at td = 0.1 ps and 2 ps for d-Br (a) and d-Cl (b) under excitation of 0.89 eV. Insets of (a) and (b) present differential spectra between h-Br and d-Br (a, ΔRh− d/Rd; red curve) at 10 K and between 80 K and 10 K (b, ΔRtemp/R10; blue curve) of d-r [39].
Crystals 02 00590 g019
Figure 19a,b show transient reflectivity (ΔR/R) spectra of d-Br and d-Cl, respectively at time delays td of 0.1 ps and 2 ps, under excitation at 0.89 eV. Actually, intradimer bonding to anti-bonding transition mainly contributes to σ(ω) at 0.89 eV. For d-Br, immediately after photo-irradiation, ΔR/R shows a negative value attributable to bleaching of the intradimer transition by the photo-carrier generation. Then, the amplitude of the Drude-like reflection at <0.4 eV increases. The ΔR/R spectrum at td = 2 ps is analogous to ΔRh−d/Rd, indicating the occurrence of PIMT. However, for d-Cl, ΔR/R decreases at <0.4 eV for any time delay, indicating that the PIMT does not occur at all. The efficiency of PIMT for d-Br was estimated as 50 dimers/photon from the fact that ΔR/R at 0.3 eV was approximately 10% of ΔRh−d/Rd; the photon density was 0.1 mJ/cm2 (i.e., 1 photon/500 molecules).

4.3. Dynamics of Charge and Lattice in the Dimer–Mott Insulator

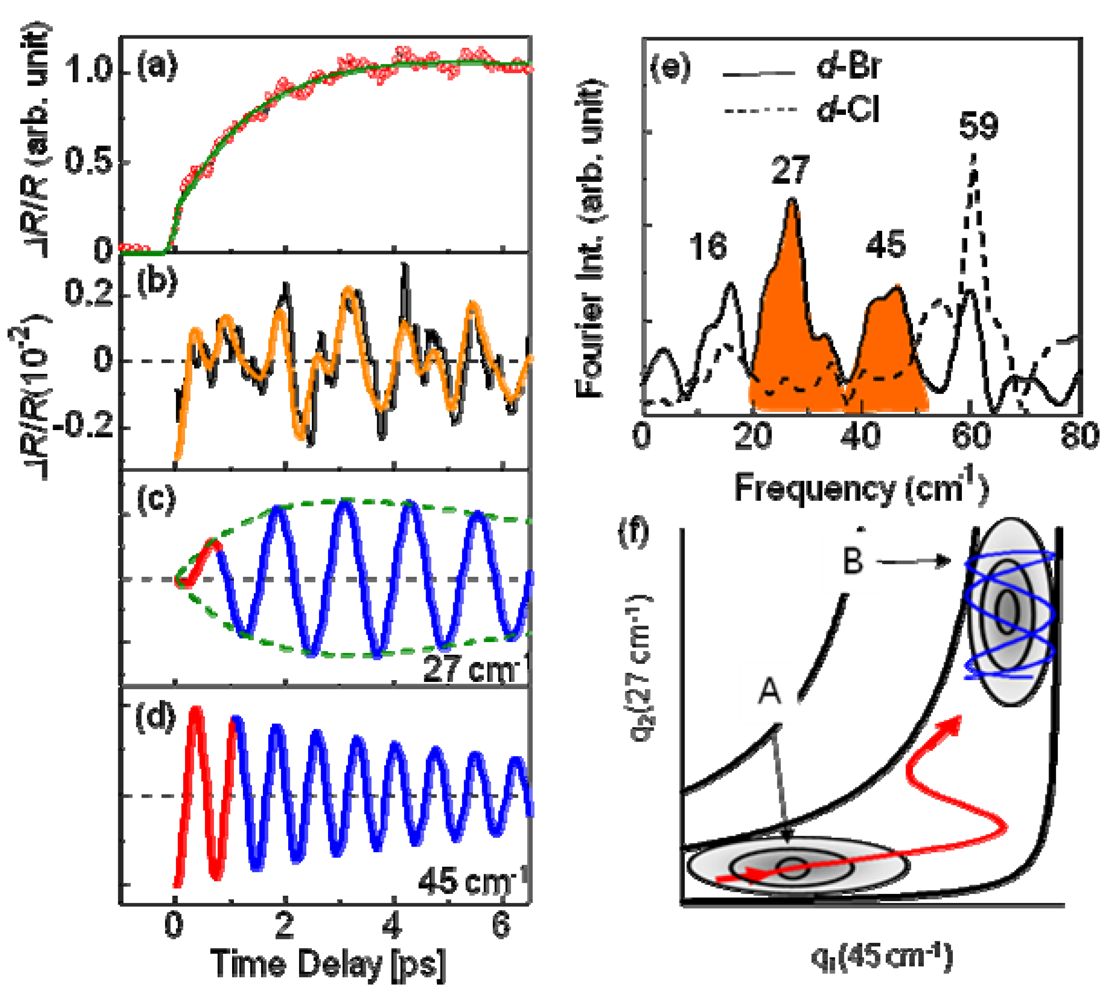
Figure 20a shows time evolutions of the ΔR/R for d-Br observed at 0.26 eV, which indicate generation of the metallic state. The time profile, which reflects metallization, is reproduced by the Equation Crystals 02 00590 i006, as shown by the solid green curve, where A = –1.44, τg = 1.1 ps, B = 2.44, and τ1 = 70 ps. It is worth noting that the generation time of the metallic state τg is considerably longer than the timescale (ca. 40 fs) of the inter-site charge transfer, suggesting that the I–M transition occurs because of the intermolecular motion and not the electronic process.
Figure 20. (a) Time evolutions of ΔR/R for d-Br detected at 0.26 eV under excitation at 0.89 eV (red circles with green fitted curve); (b) The time profile of the oscillating component of ΔR/R for d-Br (0.89 eV excitation); (c,d) The 27 cm–1 (c) and 45 cm–1 (d) cosine-like oscillations, which were obtained through analysis (see the text); (e) Fourier transformed spectra of the oscillation for d-Br and d-Cl; (f) Classical trajectories representing coherent phonon dynamics in the potential surface. A and B respectively denote the excited Mott insulator state and the photoinduced metallic state [39].
Crystals 02 00590 g020
The oscillating structure in the time evolution of ΔR/R at 0.26 eV also indicates the contribution of the intermolecular coherent motion to the PIMT. The time profile and Fourier transformed spectrum of the oscillating component ΔRosc(t)/R for d-Br are shown respectively in Figure 20b–e. Analyses were conducted using the Equation Crystals 02 00590 i007, and the oscillating frequencies ωi (i = 1–4) were estimated as 16, 27, 45, and 59 cm–1. Here, τri, τI, and ϕi respectively present the rise and decay time constant and the initial phase for each oscillation. Actually, ϕi is smaller than 0.1 π, indicating a cosine-like oscillation, which is detected in the photoinduced phase transition, and is attributable to the displacive excitation of the coherent phonon in the photoexcited state or the photoinduced metallic state [53], and not in the ground state. Among these oscillations, the 27 cm–1 and 45 cm–1 modes are not detected in d-Cl, as shown by the dashed curve in Figure 20e. Accordingly, these two modes are related to the PIMT. It is worth noting that the 27 cm–1 mode shows a finite rise time of τr2 = 1 ps (Figure 20c), which is identical to the timescale of metallization tg, whereas the 45 cm−1 mode appears instantaneously (Figure 20d). Therefore, as shown by the classical trajectories in the q1(45 cm–1)–q2(27 cm–1) potential surface (Figure 20f), the 45 cm–1 mode phonon is regarded as induced along the q1 axes (red curve) immediately after generation in the photoexcited insulator state (A). Then, the 27 cm–1 mode oscillates along the q2 axis (blue curve) in the metallic state (B). Observation of the 27 cm–1 mode in the Raman spectrum of metallic h-Br [54] supports the consideration presented above. Possible candidates for such coherent low-frequency phonons are intradimer molecular motions that effectively modulate the tdimer, i.e., the intradimer molecular displacements such as stretching and libration, which are triggered by bonding to the anti-bonding excitation, causing a decrease in tdimer and Udimer/2; this results in metallization.
Next, we roughly evaluate the photoinduced intradimer molecular displacement and corresponding change in UdimerUdimer) more quantitatively. Here, Udimer and t of pristine samples are calculated as Crystals 02 00590 i008, where tp and tq are anisotropic interdimer transfer integrals calculated using the extended Huckel method with structural data [55,56], although a more precise formula for Udimer is presented [57,58]. In the past, Udimer/t for the phase boundary was also estimated from precise studies of the phase diagram of κ-[(h-ET)1−x(d-ET)x]2Cu[N(CN)2]Br [31]. Considering that Udimer/t values for d-Br and the I–M boundary are calculated as 7.25 and 7.2–7.22, respectively, as presented in Figure 18, observation of the PIMT reveals that the change of Udimer/t upon PIMT is approximately 0.4–0.7%. Therefore, ΔUdimer is estimated as approximately 0.4%–0.7% because the photoinduced change in Udimer/t is mainly attributable to the ΔUdimer. Such a small change of Udimer is indicative of small molecular displacements. If we simply assume that the intradimer relative molecular distances are changed for reducing tdimer to ca. Udimer/2, then the magnitude of the displacement is as small as 0.05% of the molecular distance in the dimer. Furthermore, Udimer/t for d-Cl is 7.87. Therefore, ΔUdimer must be greater than 9% to induce the PIMT. A very large displacement of 0.5% is necessary to obtain such a large ΔUdimer value, which might be the reason why the PIMT is not detected in d-Cl. These results and discussion demonstrate the optical modulation of Udimer and the resultant PIMT in the DM insulator κ-(d-ET)2Cu[N(CN)2]Br. Under intradimer excitation, the PIMT is driven by the intradimer molecular displacements, which decrease Udimer by approximately 0.4%–0.7%. Moreover, the mechanism of the PIMT strongly depends on the excitation photon energy [39], i.e., the excitation of the Hubbard band (~0.3 eV) shows FC type I–M transition. That was also analyzed theoretically [57,58].
Very recently, higher time-resolution measurement using 3-optical cycle 12 fs IR pulse showed that the intense intramolecular C=C stretching vibration (oscillation period = 25 fs) is driven by strong EMV coupling in the dimer system for κ-(d-ET)2Cu[N(CN)2]Br. After the rapid damping of this coherent C=C motion, various intramolecular and intermolecular modes are also driven, which might be induced by the nonlinear EMV coupling. Finally, low-frequency (<100 cm−1) intradimer modes modulate the tdimer and Udimer. Details of primary dynamics faster than 100 fs will be described at a later opportunity.

4.4. Slower Dynamics of the Photoinduced Metallic State
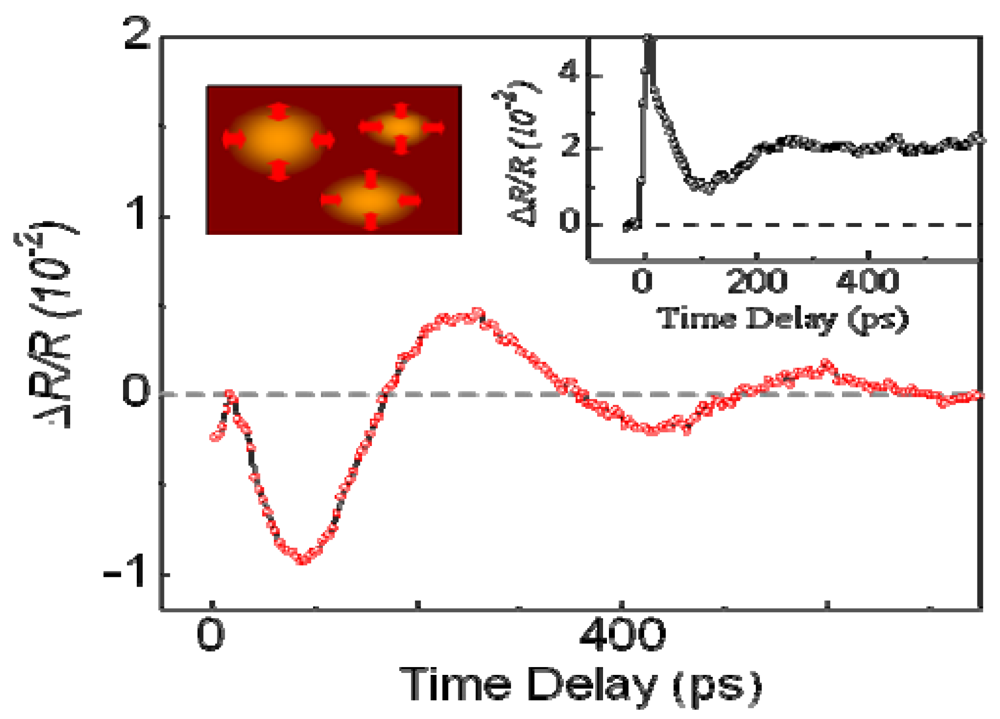
At the end of this section, we discuss the slower dynamics occurring after the PIMT is completed. The photoinduced I–M domain wall (DW), which is in a highly non-equilibrium state, is expected to exhibit novel properties near the critical end point of the first-order phase boundary in Figure 18 [30,31,32,33]. The inset of Figure 21 shows time evolutions of ΔR/R at 0.31 eV, indicating generation of the metallic state. The most impressive feature of the time evolution is the oscillation of the structure with a period of 340 ps, which is estimated from the oscillating component shown by red circles.
Figure 21. Time evolutions of ΔR/R (inset) and the oscillating component detected at 0.31 eV for the slow time domain, together with a schematic illustration of the oscillating photoinduced metallic domain.
Crystals 02 00590 g021
In some compounds exhibiting photoinduced structural transitions, such oscillations in time domain with the period of several tens~hundreds ps have been attributable to the coherent acoustic phonon as a propagation of a shock wave. The period of such a coherent acoustic phonon strongly depends on the detection energy, reflecting the dispersion of the acoustic phonon [59]. However, in this case, the frequency of the oscillation is independent of the probe energy. Moreover, the amplitude spectrum is analogous to the ΔRh−d/Rd (not shown). Accordingly, such a long-period oscillation is attributable not to propagating or standing acoustic waves, but to the coherent modulation of the metallic volume fraction, suggesting oscillating DW motion.
Such interpretation using a DW picture is supported by the real-imaging observation of the phase separation near the phase boundary in the BC–Mott transition [60]. The DW oscillation such as this is regarded as driven by the thermodynamic instability of the photoinduced state. Usually, it is disturbed by the I–M energy difference, potential barrier, and de-phasing process occurring via an electron–lattice interaction. However, for the PIMT in d-Br, the I–M energy difference and the barrier height between phases are tuned to be very small near the characteristic curved phase boundary and the critical endpoint at 35–40 K because the molecular displacement with the I–M transition is very small. In fact, the oscillating amplitude shows a maximum at approximately 25 K.

5. Summary

In this review, photoinduced I–M transitions in CO organic insulators α-(ET)2I3, θ-(ET)2RbZn(SCN)4, DM insulator κ-(d-ET)2Cu[N(CN)2Br] are discussed, based on results of pump-probe spectroscopy in near-IR, mid-IR, and THz regions in the timescale of 10 fs–100 ps.
The initial process of the PIMT is understood as an immediate (ca. 15 fs) generation of microscopic metallic domain that consists of ca. 100 molecules. Then, this initially generated microscopic metallic domain is condensed to a macroscopic metallic domain to reduce an I–M interfacial energy in a timescale of ca. 200 fs for α-(ET)2I3. On the other hand, condensation to the macroscopic metal does not occur in θ-(ET)2RbZn(SCN)4 because the structural symmetry of the metallic state differs markedly from that of the insulating state, i.e., the potential barrier in the free energy surface for the first-order phase transition is sufficiently large. For both compounds, the initial electronic response is regarded as playing a main role in the generation of the microscopic domains, whereas the electron–phonon interaction or the molecular rearrangement effectively contributes to condensation to the macroscopic domain in α-(ET)2I3. The initial electronic process for generating the microscopic metallic state is driven by the coherent electron oscillation. Snapshots of such electronic oscillation and the Fano interference between the electronic and intramolecular C=C vibration were taken for the first time ever reported.
In the Dimer–Mott insulator κ-(d-ET)2Cu[N(CN)2Br], which is positioned near the I–M phase boundary in the phase diagram of bandwidth Mott transition, intradimer bonding anti-bonding excitation induces an photoinduced I–M transition. However, in this compound, the I–M transition occurs in the timescale of 1 ps that is much slower than that for the melting of CO described above. The photoinduced I–M transition in κ-(d-ET)2Cu[N(CN)2Br] is driven by the intradimer distortions induced by the intradimer excitation, resulting in the reduction of the intradimer kinetic energy tdim~Udim/2. Recent results with higher time-resolution measurement using 3-optical cycle 12 fs IR pulse shows that the intense intramolecular C=C stretching vibration causes intermolecular modes inducing I–M transition. In the near future, we will report on the faster dynamics of the light-correlated electron interaction measured by the sub 10 fs carrier-envelope phase (CEP) stabilized pulse in these organic conductors.
Another interesting feature has been detected in DM insulator κ-(ET)2Cu2(CN)3, which is positioned near the phase boundary between the DM and the ferroelectric CO insulators. We observed the photoinduced growth of the ferroelectric CO cluster under the excitation of the DM insulator. There are few studies of such photoinduced reconstruction of the electronic ordering [61], although the photoinduced melting of electronic ordering such as CO and the DM insulator has been reported. The photoinduced phase transition of such a new type will be discussed at a later opportunity.

Acknowledgments

We thank our collaborators Y. Kawakami, H. Nakaya, K. Itoh, T. Ishikawa, H. Itoh, S. Ishihara (Tohoku University), K. Yamamoto, K. Yakushi, K. Yonemitsu, (Institute for Molecular Science), T. Sasaki, N. Yoneyama, N. Kobayashi (Institute for Materials Research, Tohoku Univ.), S. Saito (National Institute for Communications and Information Tech.). We also thank H. Kishida (Nagoya Univ.), H. Seo (Riken), A. Takahashi (Nagoya Institute of Tech.), M. Watanabe (Tohoku Univ.), C. Hotta (Kyoto Sangyo Univ.), H. Matsueda (Sendai National College of Tech.) for their helpful discussions. This work was supported by Grants-in-Aid for Scientific Research from the Ministry of Education, Culture, Sports, Science, and Technology “New Frontiers in Materials Science Opened by Molecular Degrees of Freedom” (No. 20110005) and A, No. 23244062.

References

  1. Mott, N.F. Metal–Insulator Transitions, 2nd ed; Taylor & Francis: New York, NY, USA, 1990. [Google Scholar]
  2. Imada, M.; Fujimori, A.; Tokura, Y. Metal-insulatortransitions. Rev. Mod. Phys. 1998, 70, 1039–1263. [Google Scholar] [CrossRef]
  3. Batail, P. Molecular conductors. Chem. Rev. 2004, 104, 4887–4890. [Google Scholar] [CrossRef]
  4. Kagoshima, S.; Kanoda, K.; Mori, T. Special topic on organic conductors. J. Phys. Soc. Jpn. 2006, 75, 051001–051016. [Google Scholar] [CrossRef]
  5. Gonokami, M.; Koshihara, S. Special topic on photoinduced phase transition and their dynamics. J. Phys. Soc. Jpn. 2006, 75, 011001–051005. [Google Scholar] [CrossRef]
  6. Yonemitsu, K.; Nasu, K. Theory of photoinduced phase transitions in itinerant electron systems. Phys. Rep. 2008, 465, 1–60. [Google Scholar] [CrossRef]
  7. Basov, D.N.; Averitt, R.D.; van der Marel, D.; Martin, D.; Hauel, K. Electrodynamics of correlated electron materials. Rev. Mod. Phys. 2011, 83, 471–541. [Google Scholar] [CrossRef]
  8. Miyano, K.; Tanaka, T.; Tomioka, Y.; Tokura, Y. Photoinduced insulator-to-metal transition in a perovskitemanganite. Phys. Rev. Lett. 1997, 78, 4257–4260. [Google Scholar]
  9. Cavalleri, A.; Toth, Cs.; Siders, C.W.; Squir, J.A.; Raksi, F.; Forget, P.; Kieffer, J.C.V. Femtosecond structural dynamics in VO2 during an ultrafast solid-solid phase transition. Phys. Rev. Lett. 2001, 87. [Google Scholar]
  10. Iwai, S.; Ono, M.; Maeda, A.; Matsuzaki, H.; Kishida, H.; Okamoto, H.; Tokura, Y. Ultrafast optical switching to a metallic state by photoinduced mott transition in a halogen-bridged nickel-chain compound. Phys. Rev. Lett. 2003, 91, 057401:1–057401:4. [Google Scholar]
  11. Perfetti, L.; Loukakos, P.A.; Lisowski, M.; Bovensiepen, U.; Berger, H.; Biermann, S.; Cornaglia, P.S.; Georges, A.; Wolf, M. Time evolution of the electronic structure of 1T-TaS2 through the insulator-metal transition. Phys. Rev. Lett. 2006, 97, 067402:1–067402:4. [Google Scholar]
  12. Polli, D.; Rini, M.; Wall, S.; Schoenlein, R.W.; Tomioka, Y.; Tokura, Y.; Cerullo, G.; Cavalleri, A. Coherent orbital waves in the photo-induced insulator-metal dynamics of a magnetoresistive manganite. Nature Mat. 2007, 6, 643–647. [Google Scholar]
  13. Chollet, M.; Guerien, L.; Uchida, N.; Fukaya, S.; Shimoda, H.; Ishikawa, T.; Matsuda, K.; Hasegawa, T.; Ota, A.; Yamochi, H.; et al. Gigantic photoresponse in ¼-filled-band organic salt (EDO-TTF)2PF6. Science 2005, 7, 86–89. [Google Scholar]
  14. Tajima, N.; Fujisawa, J.; Naka, N.; Ishihara, T.; Kato, R.; Nishio, Y.; Kajita, K. Photo-induced insulator-metal transition in an organic conductor α-(BEDT-TTF)2I3. J. Phys. Soc. Jpn. 2005, 74, 511–514. [Google Scholar]
  15. Iwai, S.; Yamamoto, K.; Kashiwazaki, A.; Hiramatsu, F.; Nakaya, H.; Kawakami, Y.; Yakushi, K.; Okamoto, H.; Mori, H.; Nishio, Y. Photoinduced melting of a stripe-type charge-order and metallic domain formation in a layered BEDT-TTF-based organic salt. Phys. Rev. Lett. 2007, 98, 097402:1–097402:4. [Google Scholar]
  16. Okamoto, H.; Matsuzaki, H.; Wakabayashi, T.; Takahashi, Y.; Hasegawa, T. Photoinduced metallic state mediated by spin-charge separation in a one-dimensional organic Mott insulator. Phys. Rev. Lett. 2006, 98, 037401:1–037401:4. [Google Scholar]
  17. Bender, K.; Henning, I.; Schweitzer, D.; Dietz, K.; Endre, H.; Keller, H.J. Synthesis, structure and physical properties of a two-dimensional organic metal, Di[bis(ethylenedithiolo)tetrathiofulvalene] triiodide, (BEDT-TTF)+2 I3. Mol. Cryst. Liq. Cryst. 1984, 108, 359–371. [Google Scholar] [CrossRef]
  18. Kakiuchi, T.; Wakabayashi, Y.; Sawa, H.; Takahashi, T.; Nakamura, T. Charge ordering in α-(BEDT-TTF)2I3 by synchrotron X-ray diffraction. J. Phys. Soc. Jpn. 2007, 76, 113702:1–113702:4. [Google Scholar]
  19. Tanaka, Y.; Yonemitsu, K. Charge order with structural distortion in organic conductors: Comparison between θ-(ET)2RbZn(SCN)4 and α-(ET)2I3. J. Phys. Soc. Jpn. 2008, 77. [Google Scholar]
  20. Ivek, T.; Korin-Hamzic, B.; Milat, O.; Tomic, S.; Clauss, C.; Drichiko, N.; Schweitzer, D.; Dressel, M. Collective excitations in the charge-ordered phase of α-(BEDT-TTF)2I3. Phys. Rev. Lett. 2010, 104, 206406:1–206406:4. [Google Scholar]
  21. Ivek, T.; Korin-Hamzic, B.; Milat, O.; Tomic, S.; Clauss, C.; Drichiko, N.; Schweitzer, D.; Dressel, M. Electrodynamic response of the charge ordering phase: Dielectric and optical studies of α-(BEDT-TTF)2I3. Phys. Rev. B 2011, 83, 165128:1–165128:13. [Google Scholar]
  22. Girlando, A. Chrage sensitive vibrations and electron-molecular vibration coupling in Bis(ethylenedithio)-tetrathiafulvalene(BEDT-TTF). J. Phys. Chem. C 2011, 115, 19371–19378. [Google Scholar] [CrossRef]
  23. Mori, H.; Tanaka, S.; Mori, T. Systematic study of the electronic state in theta-type BEDT-TTF organic conductors by changing the electronic correlation. Phys. Rev. B 1998, 57, 12023–12029. [Google Scholar]
  24. Watanabe, M.; Noda, Y.; Nogami, Y.; Mori, H. Transfer integrals and the spatial pattern of charge ordering in θ-(BEDT-TTF)2RbZn(SCN)4 at 90 K. J. Phys. Soc. Jpn. 2004, 73, 116–122. [Google Scholar] [CrossRef]
  25. Miyashita, S.; Yonemitsu, K. Charge ordering in θ-(BEDT-TTF)2RbZn(SCN)4: Cooperative effects of electron correlations and lattice distortions. Phys. Rev. B 2007, 75, 245112. [Google Scholar] [CrossRef]
  26. Yamamoto, K.; Iwai, S.; Boyko, S.; Kashiwazaki, A.; Hiramatsu, F.; Okabe, C.; Nishi, N.; Yakushi, K. Strong optical nonlinearity and its ultrafast response associated with electron ferroelectricity in an organic conductor. J. Phys. Soc. Jpn. 2008, 77, 74709:1–74709:6. [Google Scholar]
  27. Monceu, P.; Nad, F.Y.; Brazovskii, S. Ferroelectric Mott-hubbard phase of organic (TMTTF)2X conductors. Phys. Rev. Lett. 2001, 86, 4080–4083. [Google Scholar] [CrossRef]
  28. van der Brink, J.; Khomskii, D.I. Multiferroicity due to charge ordering. J. Phys.: Condens. Matter. 2008, 20. [Google Scholar]
  29. Ishihara, S. Electronic ferroelectricity and frustration. J. Phys. Soc. Jpn. 2010, 9, 011010:1–011010:4. [Google Scholar]
  30. Kanoda, K. Metal-insulator transition in κ-(ET)2X and (DCNQI)2M: Two contrasting manifestation of electron correlation. J. Phys. Soc. Jpn. 2006, 75. [Google Scholar]
  31. Yoneyama, N.; Sasaki, T.; Kobayashi, T. Substitution effect by deuterated donors on superconductivity in κ-(BEDT-TTF)2Cu[N(CN)2]Br. J. Phys. Soc. Jpn. 2004, 73, 1434–1437. [Google Scholar] [CrossRef]
  32. Kagawa, F.; Miyagawa, K.; Kanoda, K. Unconventional critical behaviour in a quasi-two-dimensional organic conductor. Nature 2005, 436, 534–537. [Google Scholar]
  33. de Souza, M.; Bruhl, A.; Strack, C.H.; Wolf, B.; Scweitzer, D.; Lang, M. Anomalous lattice response at the Mott transition in a quasi-2D organic conductor. Phys. Rev. Lett. 2007, 99, 037003:1–037003:4. [Google Scholar]
  34. Faltermeier, D.; Barz, J.; Dumm, M.; Dressel, M.; Drichko, N.; Petrov, B.; Semkin, V.; Vlasova, R.; Meźière, C.; Batail, P. Bandwidth-controlled Mott transition in κ-(BEDT-TTF)2Cu[N(CN)2]BrxCl1−x: optical studies of localized charge excitations. Phys. Rev. B 2007, 76, 165113:1–165113:12. [Google Scholar]
  35. Dumm, M.; Faltermeier, D.; Drichko, N.; Dressel, M. Bandwidth-controlled Mott transition in ê-(BEDT-TTF)2Cu[N(CN)2]BrxCl1−x: Optical studies of correlated carriers. Phys. Rev. B. 2009, 79, 195106:1–195106:11. [Google Scholar]
  36. Iwai, S.; Yamamoto, K.; Hiramatsu, F.; Nakaya, H.; Kawakami, Y.; Yakushi, K. Hydrostatic pressure effect on photoinduced insulator-to-metal transition in the layered organic salt α-(BEDT-TTF)2I3. Phys. Rev. B 2008, 77, 125131:1–125131:5. [Google Scholar]
  37. Nakaya, H.; Itoh, K.; Takahashi, Y.; Itoh, H.; Iwai, S.; Saito, A.; Yamamoto, K.; Yakushi, K. Terahertz responses of the high-temperature metallic phase and photoinduced metallic state in the ferroelectric charge-ordered organic salt α-(ET)2I3. Phys. Rev. B 2010, 81, 155111:1–155111:6. [Google Scholar]
  38. Kawakami, Y.; Fukatsu, T.; Sakurai, Y.; Unno, H.; Itoh, H.; Iwai, S.; Sasaki, T.; Yamamoto, K.; Yakushi, K.; Yonemitsu, K. Early-stage dynamics of light-matter interaction leading to the insulator-to-metal transition in a charge ordered organic crystal. Phys. Rev. Lett. 2010, 105, 246402:1–246402:4. [Google Scholar]
  39. Kawakami, Y.; Iwai, S.; Fukatsu, T.; Yoneyama, N.; Sasaki, T.; Kobayashi, N. Optical modulation of effective on-site coulomb energy for the mott transition in an organic dimer insulator. Phys. Rev. Lett. 2009, 103, 066403:1–066403:4. [Google Scholar]
  40. Brida, D.; Cirmi, G.; Manzone, C.; Bonora, S.; Villoresi, P.; de Silvestri, S.; Cerullo, G. Sub-two-cycle light pulses at 1.6 μm from an optical parametric amplifier. Opt. Lett. 2008, 33, 741–743. [Google Scholar]
  41. Miyashita, S.; Tanaka, Y.; Iwai, S.; Yonemitsu, K. Charge, lattice, and spin dynamics in photoinduced phase transitions from charge-ordered insulator to metal in quasi-two-dimensional organic conductors. J. Phys. Soc. Jpn. 2010, 79. [Google Scholar]
  42. Tanaka, Y.; Yonemitsu, K. Growth dynamics of photoinduced domains in two-dimensional charge-ordered conductors depending on stabilization mechanisms. J. Phys. Soc. Jpn. 2010, 79, 024712:1–024712:8. [Google Scholar]
  43. Gomi, H.; Takahashi, A.; Tastumi, T.; Kobayashi, S.; Miyamoto, K.; Lee, J.D.; Aihara, M.J. Photogenerated metallic states in charge-ordered insulators in (BEDT-TTF)2X. Phys. Soc. Jpn. 2011, 80, 034709:1–034709:10. [Google Scholar]
  44. Hohenberg, P.C.; Halperin, B.I. Theory of dynamic critical phenomena. Rev. Mod. Phys. 1977, 49, 435–479. [Google Scholar] [CrossRef]
  45. Kise, T.; Ogasawara, T.; Ashida, M.; Tomioka, Y.; Tokura, Y.; Kuwata-Gonokami, M. Ultrafast spin dynamics and critical behavior in half-metallic ferromagnet: Sr2FeMoO6. Phys. Rev. Lett. 2000, 85, 1986–1989. [Google Scholar] [CrossRef]
  46. Liu, X.J.; Moritomo, Y.; Nakamura, A.; Tanaka, H.; Kawai, T. Critical behavior of a photodisordered spin system in doped manganite. Phys. Rev. B 2001, 64, 100401R:1–100401R:4. [Google Scholar]
  47. Nightingale, M.P.; Blote, H.W. Dynamic exponent of the two-dimensional ising model and montecarlo computation of the subdominant eigenvalue of the stochastic matrix. J. Phys. Rev. lett. 1996, 76, 4548–4551. [Google Scholar] [CrossRef]
  48. Wall, S.; Brida, D.; Clark, S.R.; Ehrke, H.P.; Jaksch, D.; Ardavan, A.; Bonora, S.; Uemura, H.; Takahashi, Y.; Hasegawa, T.; et al. Quantum interference between charge excitation paths in a solid-state Mott insulator. Nat. Phys. 2011, 7, 114–118. [Google Scholar] [CrossRef]
  49. Yue, Y.; Yamamoto, K.; Uruichi, M.; Nakano, C.; Yakaushi, K.; Yamada, S.; Hiejima, T.; Kawamoto, A. Nonuniform site-charge distribution and fluctuations of charge order in the metallic state of α-(BEDT-TTF)2I3. Phys. Rev. B 2010, 82, 075134:1–075134:8. [Google Scholar]
  50. Yamamoto, K.; Kowalska, A.A.; Yue, Y.; Yakushi, K. Vibronic activation of molecular vibrational overtones in the infrared spectra of charge-ordered organic conductors. Phys. Rev B 2011, 84, 064306:1–064306:13. [Google Scholar]
  51. Kozlov, M.E.; Pokhodina, K.I.; Yurchenko, A.A. Electron molecular vibration coupling in vibrational spectra of BEDT-TTF based radical cation salts. SpectrochmicaActa. 1989, 45, 437–444. [Google Scholar]
  52. Hase, M.; Kitajima, M.; Constantinescu, A.M.; Petek, H. The birth of a quasiparticle in silicon observed in time-requency space. Nature 2003, 426, 51–54. [Google Scholar]
  53. Zeiger, H.J.; Vidal, J.; Cheng, T.K.; Ippen, E.P.; Dresselhaus, G.; Dresselhaus, M.S. Theory for displacive excitation of coherent phonons. Phys. Rev. B 1992, 45, 768–778. [Google Scholar]
  54. Sekine, T.; Ohmamiuda, A.; Tanokura, Y.; Saito, G.; Ikeda, K.; Nakamura, T.; Takahashi, T. Low-frequency Raman spectra in κ-(BEDT-TTF)2Cu(NCS)2 and κ-(BEDT-TTF)2Cu[N(CN)2]Br. Synth. Met. 1995, 70, 981–982. [Google Scholar] [CrossRef]
  55. Watanabe, M. Low temperature structure and insulating phase of 2-dimensional organic conductors with 3/4 filled band. Available online: http://ousar.lib.okayama-u.ac.jp/file/8246/20111122120654/K001886_honbun.pdf (accessed on 22 December 2011). Ph.D. Thesis, Okayama University, March 1999..
  56. Mori, T.; Kobayashi, A.; Sasaki, Y.; Kobayashi, H.; Saito, G.; Inokuchi, H. The Intermolecular interaction of tetrathiafulvalene and bis(ethylenedithio)-tetrathiafulvalene in organic metals. calculation of orbital overlaps and models of energy-band structures. Bull. Chem. Soc. Jpn. 1984, 57, 627–633. [Google Scholar] [CrossRef]
  57. Yonemitsu, K.; Miyashita, S.; Maeshima, N. Phoexcitation-energy dependent transient pathways from a dimer Mott insulator to a metal. J. Phys. Soc. Jpn. 2011, 80, 084710:1–084710:5. [Google Scholar]
  58. Tatsumi, T.; Gomi, H.; Takahashi, A.; Hirao, Y.; Aihara, M. Photoexcited states in dimer Mott insulators κ -(BEDT-TTF)2X. J. Phys. Soc. Jpn. 2012, 81, 034712:1–034712:12. [Google Scholar]
  59. Iwai, S.; Tanaka, S.; Fujinuma, K.; Kishida, H.; Okamoto, H.; Tokura, Y. Ultrafast optical switching from an ionic to a neutral state in tetrathiafulvalene-p-Chloranil(TTf-CA) observed in femtosecond reflection spectroscopy. Phys. Rev. Lett. 2002, 88, 057402:1–057402:4. [Google Scholar]
  60. Sasaki, T.; Yoneyama, N.; Kobayashi, N.; Ikemoto, Y.; Kimura, H. Imaging phase separation near the Mott boundary of the correlated organic superconductors κ-(BEDT-TTF)2X. Phys. Rev. Lett. 2004, 92, 227001:1–227001:4. [Google Scholar]
  61. Onda, K.; Ogihara, S.; Yonemitsu, K.; Maeshima, N.; Ishikawa, T.; Okimoto, Y.; Shao, X.; Nakano, Y.; Yamochi, H.; Saito, G.; et al. Photoinduced change in the charge order pattern in the quarter-filled organic conductor (EDO-TTF)2PF6 with a strong electron-phonon interaction. Phys. Rev. Lett. 2009, 103, 027402:1–027402:4. [Google Scholar]