Abstract
The polymorphism of ammonium nitrate has significantly limited its application. Incorporating potassium nitrate into crystals of ammonium nitrate is one of the most commonly used methods to inhibit its polymorphic transition. To accurately prepare crystals of ammonium nitrate with varying contents of potassium nitrate, the solid–liquid phase equilibrium relationship of the quaternary system (NH4NO3-KNO3-H2O-C2H5OH) was studied at 298.15 and 303.15 K. The solubility of components in the equilibrium liquid phase and the composition of the wet-solid phase were determined through formaldehyde titration and gravimetric methods. Based on the solubility data, the phase diagram of the multicomponent system was subsequently constructed. Experimental data demonstrate that the concentration of ammonium nitrate in solution decreases as the potassium nitrate concentration increases. Furthermore, as the ethanol content in the solvent system increases, the equilibrium solubility of ammonium nitrate and potassium nitrate exhibits a concomitant reduction. Correlation analysis of the solubility data for the multicomponent system was performed using the nonrandom two-liquid model. Error analysis demonstrates that the calculated values exhibit satisfactory agreement with the experimental data.
1. Introduction
Ammonium nitrate (AN) is a widely used chemical substance, typically used in agricultural fertilizers and industrial explosives [1,2,3]. The cations and anions of AN both contain nitrogen atoms and can be used as fertilizers to promote plant growth. In addition, AN can also be used to prepare oxidants in industrial explosives, gas generators, and propellants [4,5,6,7]. Different crystals form in AN, however, in different temperature ranges [8,9,10]. This series of crystal transformation is accompanied by significant changes in crystal structure and lattice volume, which makes AN extremely prone to crystal particle breakage, thereby limiting the application of AN crystals [11]. Therefore, knowing how to control the crystal transformation of AN crystals is a key issue that needs to be addressed during production, storage, and use.
The most common way of controlling the crystal transformation of AN is by adding potassium nitrate (KN), where the amount of KN has a significant impact on the control effect [12,13,14,15,16]. The adding methods include mechanical grinding, solution recrystallization, melting, and spray drying. The simplest and most effective method is to dissolve AN and KN in solvent and then recrystallize them [17,18,19,20]. To evaluate the effect of KN on the crystal transformation of AN, it is necessary to accurately prepare a saturated solution of AN containing KN. The basis for the preparation of saturated solutions, however, is the equilibrium relationship of the two nitrates in the solvent.
The solubility of KN in ethanol and water mixtures has been studied [21]. Shao [22] studied the solubility of AN in a mixed solvent system, and the results are listed in Table 1. Additionally, extensive research has been conducted on the equilibrium solubility of AN and KN in water [23,24]. The equilibrium relationship between AN and KN in mixed solvent systems, however, has not been reported in the literature. Therefore, in this study, we examined the equilibrium relationship of multiple systems (AN–KN–ethanol–water) at 298.15 and 303.15 K.

Table 1.
Experimental mass fraction solubility of AN in mixed solvents of (water and ethanol) with various mass fractions within the temperature range from T/K = (273.15 to 313.15) under 101.3 kPaa (data from [22]).
2. Experimental
2.1. Materials and Apparatus
AN was provided by Xilong Chemical Co., Ltd., located in Beijing, China, with a purity of 0.950 in the mass fraction. It was recrystallized several times in acetone. The final content of AN employed for solubility measurement was 0.998 in the mass fraction, which was confirmed using high-performance liquid chromatography (HPLC). KN was provided by Sinopharm Chemical Reagent Co., Ltd., located in Shanghai, China, with a purity of 0.990 in the mass fraction. The mixed solution was composed of water and ethanol, and the ethanol was analytical grade and provided by Sinopharm Chemical Reagent Co., Ltd. The purity of the solvent was higher than 0.993 in the mass fraction, which was determined by gas chromatography. The detailed information for the chemicals used in this study is presented in Table 2.

Table 2.
Source and properties of AN and the selected solvents.
The temperature was controlled by a smart thermostatic bath (model: DZKW-4, Ningbo Scientz Biotechnology Co., Ltd., located in Ningbo, China.) with a precision of ±0.01 K. The solution system was heated and a constant temperature was maintained by this device to achieve phase equilibrium at the target temperature. The mass of solute, solvent, and mixture was determined using an analytical balance (model: BSA224S, Sartorius Scientific Instruments Co., Ltd., located in Beijing, China.) with a precision of ±0.0001 g. In this study, the solubility of AN and KN in different mixed solvents was measured by the isothermal dissolution equilibrium method [25]. The experimental setup consisted of a 100 mL jacketed glass container equipped with a magnetic stirrer, connected to an intelligent constant temperature water bath (model: DZKW-4, Ningbo Science Biotechnology Co., Ltd., located in Ningbo, China.) with a standard uncertainty of 0.02 K.
2.2. Preparation of Mixed Solvents and Solutes
The mixed solvent used in this study was composed of water and ethanol, with water mass ratios of 0.5, 0.7, and 0.9. The two solvents were accurately weighed using an analytical balance, and the total mass was controlled to approximately 30 g. The solvents were thoroughly mixed in an Erlenmeyer flask, which was then stoppered to prevent evaporation of the mixed solvent. The preparation process and subsequent measurements were conducted under atmospheric pressure.
The appropriate addition ratio was selected based on the solubility of the two solutes in the mixed solvent [21,22]. The mass of both solutes was accurately weighed with an analytical balance according to the selected addition ratio. The weighed nitrates were then added to an Erlenmeyer flask containing the mixed solvent, followed by sealing the flask with a stopper.
2.3. Solubility Measurement
The Erlenmeyer flask containing solutes and solvents was heated in a water bath until complete dissolution of the solutes was achieved. The heating temperature was maintained slightly above the experimental equilibrium temperature. Upon complete dissolution, the flask was transferred to an intelligent constant temperature water bath set at 298.15 K and 303.15 K. To determine the solid–liquid equilibrium time, 0.5 mL aliquots of the supernatant solution were periodically withdrawn at 1 h intervals using a syringe filter (PTFE, 0.2 μm). The ammonium ion concentration in the sampled solution was subsequently determined by formaldehyde titration.
Equilibrium of the solid–liquid phase was confirmed when identical results were obtained from two consecutive analyses. Following equilibrium attainment, stirring was terminated, and the solution was maintained at a constant temperature within the flask for a minimum of 1 h to allow settling. The supernatant liquid phase was transferred via a preheated 5 mL syringe into a 25 mL volumetric flask. Mass measurements of both the empty volumetric flask and the solution-containing flask were performed using an analytical balance (±0.1 mg sensitivity).
The pipetted solution was diluted to a final volume of 25 mL. Then, 2 mL of the diluted solution was pipetted into an Erlenmeyer flask. The content of NH4+ in the diluted solution was determined by formaldehyde titration [26]. An appropriate amount of neutral formaldehyde was added to the flask, mixed thoroughly, and allowed to stand for 1 min. After adding two drops of phenolphthalein, the solution was titrated with a freshly prepared 0.02 mol/L NaOH solution. The solution turned slightly pink and remained stable for 30 s, indicating the titration endpoint. Parallel experiments were performed in triplicate.
A preheated syringe was used to transfer a measured volume of the liquid into a small crucible. The crucible was then placed in an oven and heated according to the protocols described in References [21,27]. The weight of the crucible was recorded prior to heating, along with the weight after the solution had been added.
Evaporation was divided into two stages. In the first stage, the temperature was set to 50 °C to ensure slow evaporation of the solvent in the crucible until only solid remained. In the second stage, the samples were transferred into a vacuum-drying oven (Model: DZF-6020), where the system was maintained under a vacuum of 0.08 MPa with concurrent temperature elevation to 80 °C for residual solvent evaporation in the crystals. The total mass of the crucible and crystal was measured every 3 h using an analytical balance until the difference between consecutive measurements was <0.2 mg, indicating complete dryness. Then the amount of KN in the liquid phase was calculated based on the previously recorded mass of the empty crucible, the mass of the crucible containing the solution, and the concentration of AN.
Solid–phase analysis in the equilibrium system was conducted using Schreinemaker’s wet slag method. The liquid phase was removed from the container, and a small amount of solid phase with residual surface liquid was collected using a spatula. Gravimetric measurements of the empty crucible, the crucible containing the wet-solid phase, and the crucible containing dried crystals were performed using an analytical balance, following the previously described drying protocol. After data collection, the dried crystals in the crucible were dissolved in deionized water, and the solution was transferred to an Erlenmeyer flask. The inner walls of the crucible were rinsed three times with deionized water, and all rinsates were combined into the Erlenmeyer flask. The concentration of NH₄⁺ in the resulting solution was determined by formaldehyde titration, from which the KN concentration was derived. The remainder of wet residues was identified by powder X-ray diffraction. The crystal was characterized by XRD (D8 Advance, Bruker, Karlsruhe, Germany) equipped with Cu-Kα radiation (λ = 0.15418 nm), with an exploration range of 10–60°, a step size of 0.02°, and a goniometer speed of 10°/min.
3. Results and Discussion
3.1. Experimental Analysis
The solubility data for AN were from the measurement results of Shao [22] and are listed in Table 1, and the data for KN are from a previous study [21]. Comparing the solubility of the two solutes, we found that AN was more soluble in the mixed solvent system of ethanol and water than KN. When the ethanol content in the solvent system increased, the solubility of AN and KN decreased. Therefore, ethanol could be used as an antisolvent for the crystallization of AN and KN. Unless otherwise specified, water–ethanol ratios in this work are defined by mass.
The equilibrium time analysis indicates that the multicomponent system requires 14 h to reach equilibrium. The experimentally determined equilibrium solubility data for AN and KN are listed in Table 3 and Table 4. Phase equilibrium diagrams, derived from these data, are presented in Figure 1, Figure 2, Figure 3, Figure 4, Figure 5 and Figure 6. From the data given in Table 3 and Table 4 and the results shown in Figure 1, Figure 2, Figure 3, Figure 4, Figure 5 and Figure 6, we found that AN and KN had the highest solubility when the ethanol content in the solvent was 0.1. When the ethanol content in the solvent was 0.3 and 0.5, the solubility of AN and KN was significantly reduced. The solubility of the two solutes was the lowest when the ethanol content was 0.5. We observed this phenomenon in the experimental data and plots at temperatures of 298.15 and 303.15 K. The solubility of AN and the corresponding KN decreased with the increase in ethanol content, which further indicated that ethanol could promote the precipitation of AN and KN crystals. Because the mixed solvent of ethanol and water was more unfavorable for the dissolution of KN, the solubility data of KN in the three solvent systems were always smaller than that of AN. When the temperature was 298.15 K and 303.15 K, the solubility data for KN were still smaller than the data for AN, which indicated that AN was more soluble in the mixed solvent than KN.

Table 3.
Solid–liquid equilibrium of the NH4NO3-KNO3-C2H5OH-H2O system at T = 298.15 K.

Table 4.
Solid–liquid equilibrium of the NH4NO3-KNO3-C2H5OH-H2O system at T = 303.15 K.
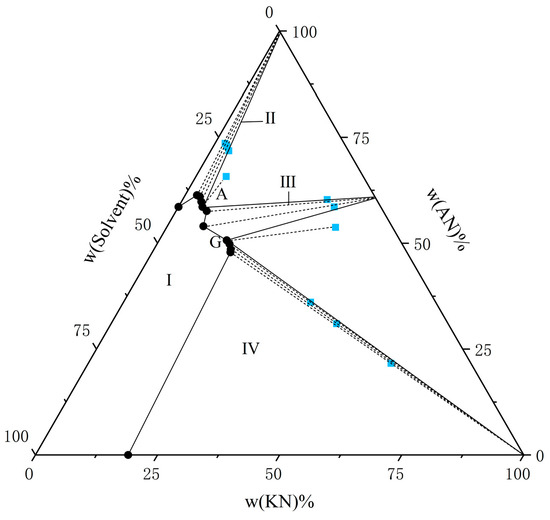
Figure 1.
The solubility of AN and KN in a binary solvent system (water–ethanol = 9:1) at T = 298.15 K. The black circle represents the amount of solutes in the equilibrium liquid phase, and the blue square represents the amount of solute in the wet-solid phase.
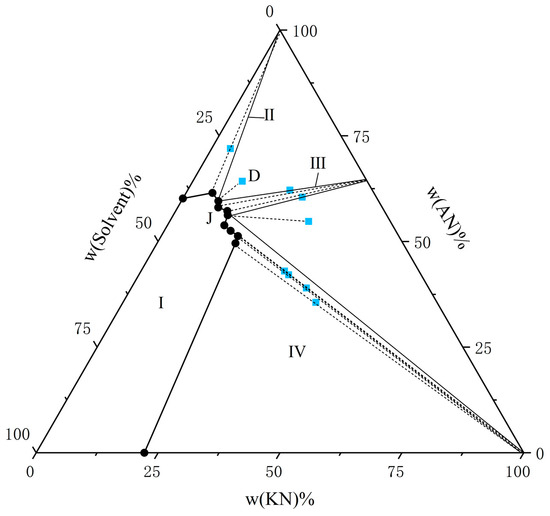
Figure 2.
The solubility of AN and KN in a binary solvent system (water–ethanol = 9:1) at T = 303.15 K. The black circle represents the amount of solutes in the equilibrium liquid phase, and the blue square represents the amount of solute in the wet-solid phase.
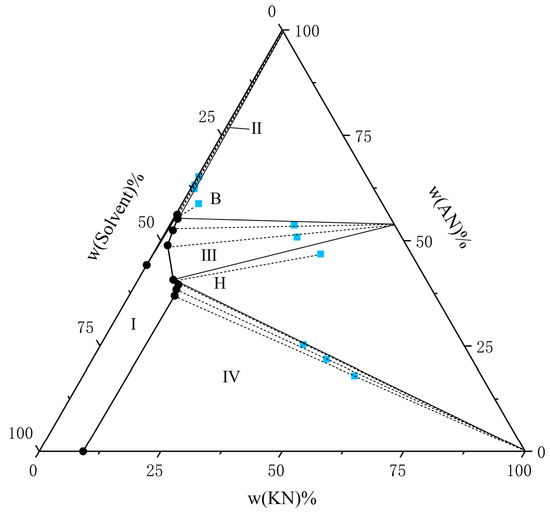
Figure 3.
The solubility of AN and KN in a binary solvent system (water–ethanol = 7:3) at T = 298.15 K. The black circle represents the amount of solutes in the equilibrium liquid phase, and the blue square represents the amount of solute in the wet-solid phase.
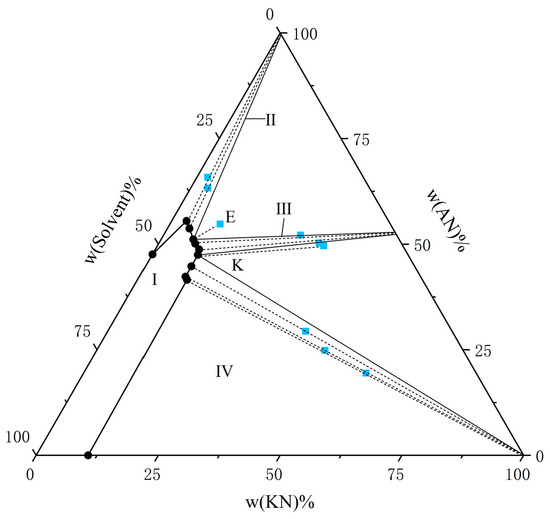
Figure 4.
The solubility of AN and KN in a binary solvent system (water–ethanol = 7:3) at T = 303.15 K. The black circle represents the amount of solutes in the equilibrium liquid phase, and the blue square represents the amount of solute in the wet-solid phase.
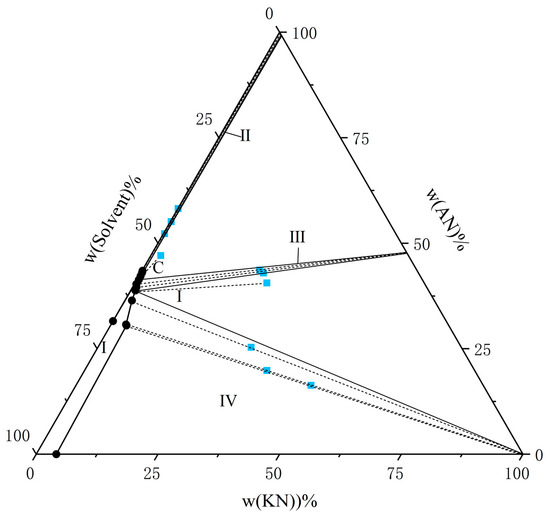
Figure 5.
The solubility of AN and KN in a binary solvent system (water–ethanol = 5:5) at T = 298.15 K. The black circle represents the amount of solutes in the equilibrium liquid phase, and the blue square represents the amount of solute in the wet-solid phase.
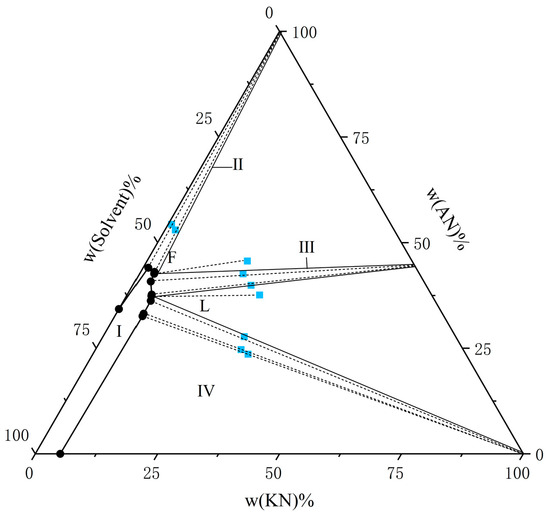
Figure 6.
The solubility of AN and KN in a binary solvent system (water–ethanol = 5:5) at T = 303.15 K. The black circle represents the amount of solutes in the equilibrium liquid phase, and the blue square represents the amount of solute in the wet-solid phase.
From the experimental data presented in Figure 1, Figure 2, Figure 3, Figure 4, Figure 5 and Figure 6, both AN and KN were found to exhibit two co-saturation points and three distinct crystallization regions under the specified experimental conditions. Points A, B, C, D, E, and F correspond to the co-saturation points between AN and the AN–KN mixed system, with their X-ray diffraction (XRD) characterization profiles displayed in Figure 7 and Figure 8. Similarly, points G, H, I, J, K, and L represent the co-saturation points of KN and the AN–KN system, and their XRD patterns are illustrated in Figure 9 and Figure 10. In the phase equilibrium diagram, Region I is identified as the unsaturated solution zone, where no crystalline precipitation occurs. Region II designates the crystallization zone of pure AN, Region III represents the crystallization zone for AN–KN, and Region IV indicates the crystallization region for KN.
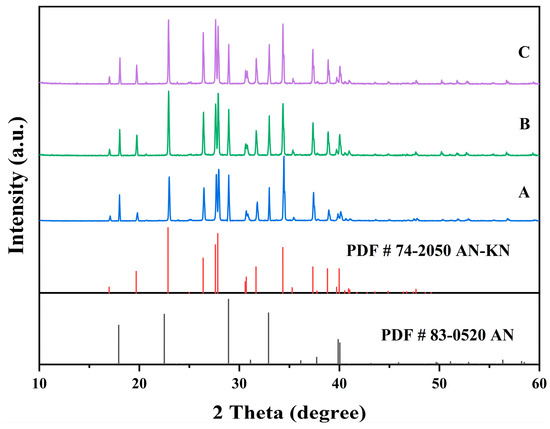
Figure 7.
X-ray diffraction patterns of the co-saturation points A, B, and C at 298.15K.
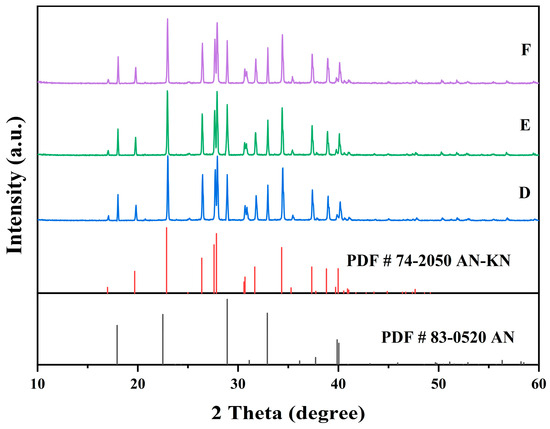
Figure 8.
X-ray diffraction patterns of the co-saturation points D, E, and F at 303.15K.
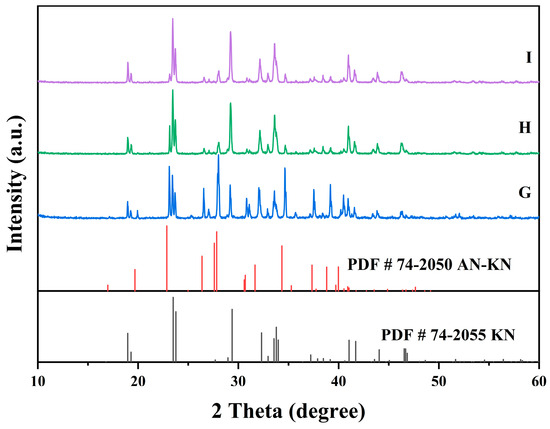
Figure 9.
X-ray diffraction patterns of the co-saturation points G, H, and I at 298.15K.
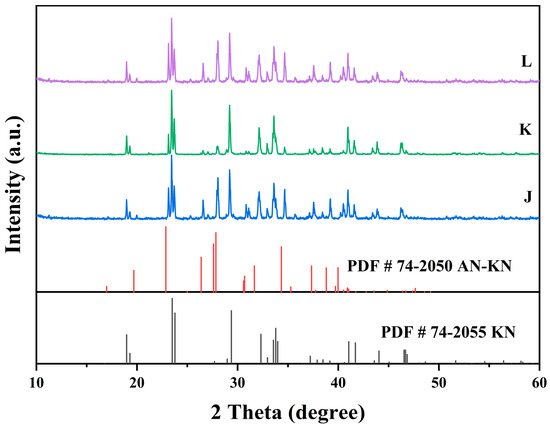
Figure 10.
X-ray diffraction patterns of the co-saturation points J, K, and L at 303.15K.
In Figure 7, the XRD patterns of AN and AN–KN mixed crystal are obtained from standard cards PDF#83-0520 and PDF#74-2050, respectively. By comparing these standard cards with the co-saturation point XRD patterns under different conditions, the characteristic peaks of the AN standard card completely match some peaks of the co-saturation points. The remaining unmatched peaks of the co-saturation points fully align with those of the AN–KN mixed crystal. Therefore, the co-saturation points under three different conditions consist of AN and AN–KN mixed crystal. In Figure 9, the XRD pattern of KN is obtained from standard card PDF#74-2055. By comparing the KN and AN–KN mixed crystal standard cards with the co-saturation point patterns, the characteristic peaks of KN all correspond to some peaks of the co-saturation points. The remaining unmatched peaks of the co-saturation points match those of the mixed crystal. Thus, the co-saturation points in Figure 9 consist of KN and AN–KN mixed crystal. Figure 8 and Figure 10 show similar trends and conclusions to Figure 7 and Figure 9.
As shown in Table 3 and Table 4 and Figure 1, Figure 2, Figure 3, Figure 4, Figure 5 and Figure 6, the solubility data of AN and the corresponding KN followed the same trend under different solvent systems and temperatures. When the solubility data for KN gradually increased, the solubility data of the corresponding AN gradually decreased, which was caused by the common ion effect. In particular, the solubility of AN in a given solvent system was less than that of AN in the presence of trace amounts of KN. This phenomenon may have been due to the fact that AN was more likely to interact with solvents under this solvent system. Thus, the high concentration of NO3− promoted the equilibrium in the wet-solid phase to shift to the right, and the AN was decomposed into NH4+ and NO3−, which increased the concentration of NH4+ in the liquid phase, and it reached a supersaturated state. Therefore, to accurately control the composition of AN and KN in the liquid phase, it was necessary to obtain the solubility relationship between AN and KN in a specified solvent system.
From Figure 1, Figure 2, Figure 3, Figure 4, Figure 5 and Figure 6, it is observed that the solvent composition significantly affects the crystallization zone of the AN–KN mixed crystal. As the ethanol content in the mixed solvent decreases, the crystallization zone of the AN–KN mixed crystal gradually shifts toward the more soluble AN side. Combined with solubility data, this phenomenon is attributed to the difference in solubility between AN and KN in the same solvent system. When the ethanol content in the solvent system decreases, the polarity of the solvent system increases, leading to a much greater change in the supersaturation of AN in the mixed solvent compared to KN. Consequently, more AN crystallizes out to maintain equilibrium. To obtain a purer AN–KN mixed crystal, it is necessary to minimize the AN crystallization zone and maximize the AN–KN mixed crystal crystallization zone. Comparing Figure 1, Figure 2, Figure 3, Figure 4, Figure 5 and Figure 6, under the conditions of an equilibrium temperature of 298.15 K and a solvent composition of water–ethanol = 7:3, the AN–KN mixed crystal crystallization zone is the largest. Therefore, under these conditions, it is easier to obtain pure AN–KN mixed crystal crystals, which is most favorable for preparing modified AN crystals.
3.2. Theoretical Calculations
3.2.1. Nonrandom Two-Liquid Model and Error Analysis
Zeng et al. [27] used the NRTL model to correlate the experimental solubility of potassium acetate in a water–methanol–methyl acetate–potassium acetate mixed system, and the model showed a good performance for this correlation. Chen et al. [28] studied the phase equilibriums of the ternary system KCl-(NH2)2CO-H2O by using the isothermal dissolution equilibrium method. The NRTL model was also employed to correlate the solubility data of the system and the correlation of this model was very good.
To study the equilibrium relationship of two nitrates, we used the nonrandom two-liquid (NRTL) model in the activity coefficient equation. The general formula of the NRTL model is as follows:
where , , is the molar fraction of dissolution, and is the adjustable parameter of the model. Then, , is the interaction parameter, which can be obtained by experimental solubility regression.
The activity coefficients in the NRTL model can be calculated using Equation (2):
represents the melting enthalpy of the solute. The enthalpies of fusion of AN, KN, and the AN–KN mixed crystal are 6.62 kJ/mol, 9.66 kJ/mol, and 8.04 kJ/mol, respectively [29,30]. T is the equilibrium temperature. Tm is the melting point and R is the fixed constant 8.314 J/(mol∙K).
We evaluated the fitting error analysis using the relative average deviation (RAD), root mean square deviation (RMSD), and standard deviation (), as follows:
3.2.2. Calculation Results
Due to the fixed mass ratio and complete miscibility of water and ethanol in the solvent system, the physicochemical properties of the mixed solvent exhibit homogeneity. To simplify the model, the mixed solvent was treated as a single component during the modeling calculations. The solubility data of AN and KN were separately correlated with the NRTL model for each of the three solvent systems. Table 5 lists the relevant interaction parameters and error estimation.

Table 5.
Correlation parameters of NRTL model for solubility of pure solutes in solvents.
AN and KN formed a mixed crystal when crystallized. When the solid–liquid phase was equilibrized, the solubility product of the mixed crystal had the following relationship [14,31]:
When the NRTL model is used to correlate the equilibrium solubility of AN and KN in mixed solvent systems, the interaction parameters between the individual solutes and solvent systems listed in Table 5 are incorporated into the NRTL model for multicomponent solute systems. The two corresponding adjustable parameters from Table 5 are selected based on the solvent composition of the target system and subsequently incorporated into the NRTL model. Furthermore, by integrating this model with Equations (6) and (7), the equilibrium solubility of AN and KN can be effectively correlated.
The fitted data and curves are shown in Table 6, Table 7 and Table 8 and Figure 11, Figure 12, Figure 13, Figure 14, Figure 15 and Figure 16, respectively. The interaction parameters and solubility product obtained by equation regression are listed in Table 9. The error estimation is also included. According to Table 9, when the solvent system was water–ethanol = 9:1, the model association data and the experimental data were in the best agreement, where RAD was 2.08 and was 0.029. The fitting data curve and the experimental data curve basically coincided, as shown in Figure 11 and Figure 12. The fitting curve represented changes in the solubility of AN and KN in the solvent system. When the solvent system was water–ethanol = 5:5, RAD was 4.422 and was 0.095. The fitting curve had poor consistency with the data when the KN content was almost zero, but it still reflected the solubility change of the two solutes. These curves are shown in Figure 15 and Figure 16. Through the correlation model, we accurately predicted the amount of one solute according to the amount of the other solute, thus providing a data reference for the preparation of the equilibrium liquid phase and the precipitation of modified crystals.

Table 6.
Experimental and calculated solid–liquid equilibrium values of NH4NO3-KNO3-C2H5OH-H2O system with water–ethanol = 9:1 (mass ratio).

Table 7.
Experimental and calculated solid–liquid equilibrium values of NH4NO3-KNO3-C2H5OH-H2O system with water–ethanol = 7:3 (mass ratio).

Table 8.
Experimental and calculated solid–liquid equilibrium values of NH4NO3-KNO3-C2H5OH-H2O system with water–ethanol = 5:5 (mass ratio).

Figure 11.
Comparison of experimental data on solubility of AN and KN in mixed solvents (water–ethanol = 9:1) at T = 298.15 K with calculated data from the NRTL model. The black circle represents the experimental data, and the green triangle represents the calculated data.
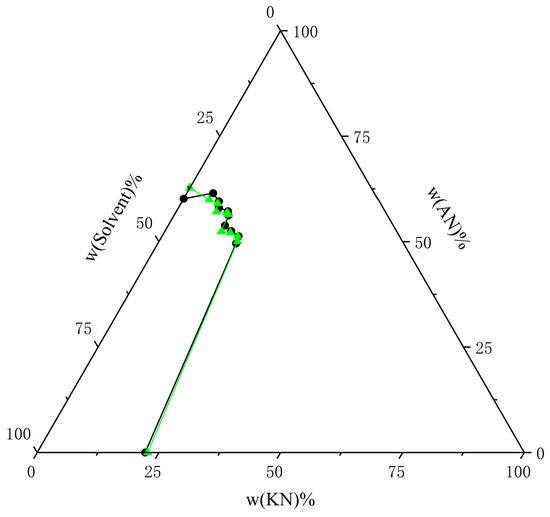
Figure 12.
Comparison of experimental data on solubility of AN and KN in mixed solvents (water–ethanol = 9:1) at T = 303.15 K with calculated data from the NRTL model. The black circle represents the experimental data, and the green triangle represents the calculated data.
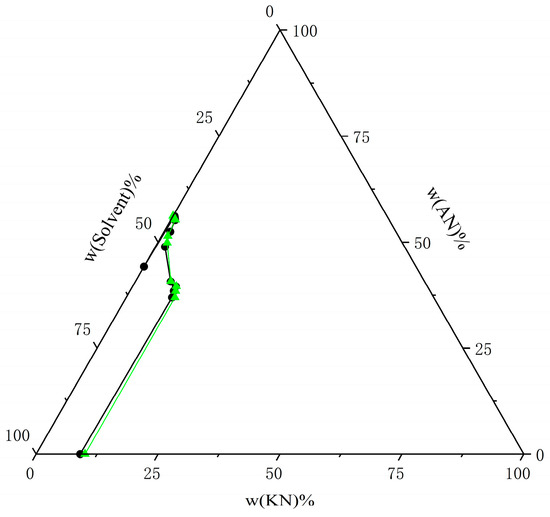
Figure 13.
Comparison of experimental data on solubility of AN and KN in mixed solvents (water–ethanol = 7:3) at T = 298.15 K with calculated data from the NRTL model. The black circle represents the experimental data, and the green triangle represents the calculated data.
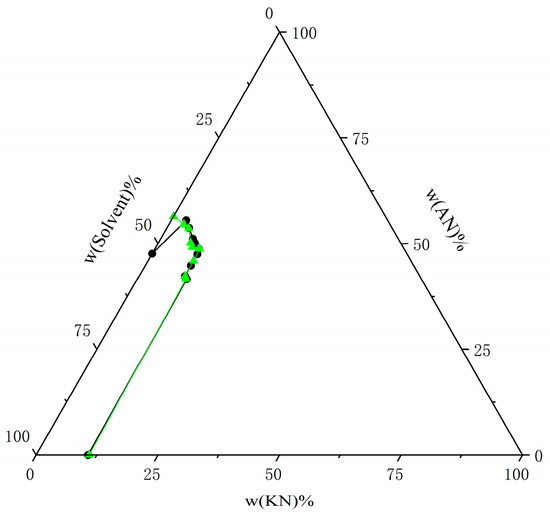
Figure 14.
Comparison of experimental data on solubility of AN and KN in mixed solvents (water–ethanol = 7:3) at T = 303.15 K with calculated data from the NRTL model. The black circle represents the experimental data, and the green triangle represents the calculated data.

Figure 15.
Comparison of experimental data on solubility of AN and KN in mixed solvents (water–ethanol = 5:5) at T = 298.15 K with calculated data from the NRTL model. The black circle represents the experimental data, and the green triangle represents the calculated data.
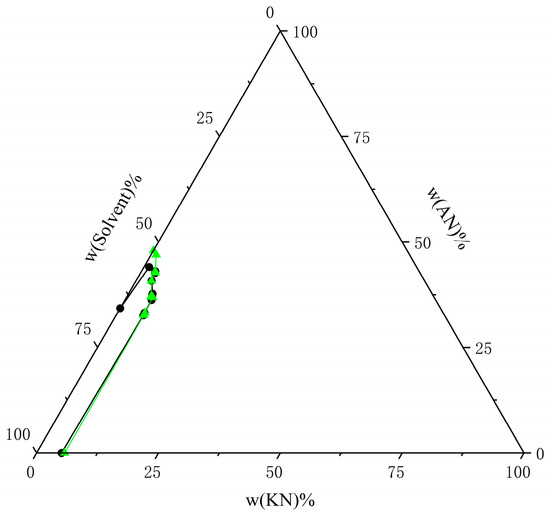
Figure 16.
Comparison of experimental data on solubility of AN and KN in mixed solvents (water–ethanol = 5:5) at T = 303.15 K with calculated data from the NRTL model. The black circle represents the experimental data, and the green triangle represents the calculated data.

Table 9.
Correlation parameters of NRTL model for solubility of AN and KN in solvents.
When the ethanol content in the solvent was 0.1, the solubility products of the mixed crystal at different temperatures obtained by model correlation were 2.114 and 2.946. The solubility product parameters were larger than those of the other two solvent systems. When the ethanol content in the solvent system was 0.5, the solubility products obtained by the model association were the smallest, at 0.504 and 0.738. By comparing the solubility product of the mixed crystal formed by AN and KN under different solvent systems and temperatures, we found that the solubility product of the mixed crystal was larger at higher temperatures. In addition, with the increased ethanol content in the solvent system, the solubility product of the mixed crystal decreased. The change in the solubility product indicated that ethanol could be used as an antisolvent to promote the precipitation of AN and KN, which was consistent with the conclusion of the experimental data analysis.
4. Conclusions
In this study, we determined the solubility of AN and KN in the specified solvent system by a combination of formaldehyde titration and the gravimetric method. It was found that the solubilities of AN and KN were affected by each other as well as the ethanol content in the solvent system. Moreover, the solubility of AN and KN in the specified solvent was correlated by the NRTL model, in that the correlation model curve was consistent with the experimental data curve, which reflected the solubility changes of the two solutes.
The correlation curve enables rapid determination of the amount of another solute based on the mass of one solute, providing data guidance for the preparation of equilibrium liquid phases and modified crystal crystallization.
Author Contributions
Conceptualization, X.W.; methodology, X.W.; software, X.W.; validation, X.W.; investigation, X.W. and H.F.; resources, G.Y.; data curation, X.W.; writing—original draft preparation, X.W.; writing—review and editing, X.W. and G.Y.; visualization, X.W.; supervision, G.Y.; funding acquisition, G.Y. All authors have read and agreed to the published version of the manuscript.
Funding
The present work was financially supported by the Yangzhou Science and Technology Bureau, China (Project Number: 2012038-3).
Data Availability Statement
The raw data supporting the conclusions of this article will be made available by the authors on request.
Conflicts of Interest
The authors declare no conflicts of interest.
References
- Klapötke, T.M. Ammonium nitrate-fertilizer, explosives, gas generator. Chem. Unserer Zeit. 2021, 55, 256–263. [Google Scholar] [CrossRef]
- Jos, J.; Mathew, S. Ammonium nitrate as an eco-friendly oxidizer for composite solid propellants: Promises and challenges. Crit. Rev. Solid State Mater. Sci. 2017, 42, 470–498. [Google Scholar] [CrossRef]
- Willey, R.J.; Shah, K.D. Ammonium nitrate & fertilizer safety. Process Saf. Prog. 2024, 43, 417. [Google Scholar]
- Mahadevan, E.G. Ammonium Nitrate Explosives for Civil Applications: Slurries, Emulsions and Ammonium Nitrate Fuel Oils; John Wiley & Sons: Hoboken, NJ, USA, 2013. [Google Scholar]
- Zyuzin, I.N.; Lempert, D.B. Ways to create fuels for stoichiometric gas- generating CHNO-compositions with low ammonium nitrate fraction. Propellants Explos. Pyrotech. Int. J. Deal. Sci. Technol. Asp. Energetic Mater. 2007, 32, 42–51. [Google Scholar] [CrossRef]
- Harrison, A.J.; Otte, A.; Carvajal, T.; Pinal, R.; Beaudoin, S.P. Cohesive hamaker constants and dispersive surface energies of RDX, PETN, TNT, and ammonium nitrate based explosives. Propellants Explos. Pyrotech. 2015, 40, 892–897. [Google Scholar] [CrossRef]
- Miyake, A.; Takahara, K.; Ogawa, T.; Ogata, Y.; Arai, H. Influence of physical properties of ammonium nitrate on the detonation behaviour of ANFO. J. Loss Prev. Process Ind. 2001, 14, 533–538. [Google Scholar] [CrossRef]
- Dunuwille, M.; Yoo, C.S. Phase diagram of ammonium nitrate. J. Chem. Phys. 2013, 139, 214503. [Google Scholar] [CrossRef] [PubMed]
- Engel, W.; Menke, K. Development of propellants containing ammonium nitrate. Def. Sci. J. 1996, 46, 311. [Google Scholar] [CrossRef][Green Version]
- Oommen, C.; Jain, S.R. Ammonium nitrate: A promising rocket propellant oxidizer. J. Hazard. Mater. 1999, 67, 253–281. [Google Scholar] [CrossRef]
- Asgari, A.; Ghani, K.; Keshavarz, M.H. Investigating the effect of copper (II) coordination compound with azodicarbonamide ligand on the phase-stabilization of ammonium nitrate. Z. Anorg. Allg. Chem. 2018, 644, 58–64. [Google Scholar] [CrossRef]
- Kumar, P. Advances in phase stabilization techniques of AN using KDN and other chemical compounds for preparing green oxidizers. Def. Technol. 2019, 15, 949–957. [Google Scholar] [CrossRef]
- Kaniewski, M.; Hoffmann, K.; Hoffmann, J. Influence of selected potassium salts on thermal stability of ammonium nitrate. Thermochim. Acta 2019, 678, 178313. [Google Scholar] [CrossRef]
- Holden, J.R.; Dickinson, C.W. Crystal structures of three solid solution phases of ammonium nitrate and potassium nitrate. J. Phys. Chem. 1975, 79, 249–256. [Google Scholar] [CrossRef]
- Oommen, C.; Jain, S.R. Phase modification of ammonium nitrate by potassium salts. J. Therm. Anal. Calorim. 1999, 55, 903–918. [Google Scholar] [CrossRef]
- Vyazenova, I.A.; Taranushich, V.A.; Chernyshev, V.M.; Bogdanova, V.A. Phase stabilization of ammonium nitrate by double addition of potassium nitrate and melamine. Russ. J. Appl. Chem. 2017, 90, 1392–1396. [Google Scholar] [CrossRef]
- Vargeese, A.A.; Joshi, S.S.; Krishnamurthy, V.N. Effect of method of crystallization on the IV–III and IV–II polymorphic transitions of ammonium nitrate. J. Hazard. Mater. 2009, 161, 373–379. [Google Scholar] [CrossRef]
- Kestila, E.; Valkonen, J. Effect of the crystallization on the phase transitions IV-III and IV-II of ammonium nitrate. Thermochim. Acta 1993, 214, 305–314. [Google Scholar] [CrossRef]
- Tan, L.; Xu, S.; Xia, L.H.; Wu, Q.J.; Liu, D.B. The effect of mixing methods on the phase transition of ammonium nitrate. Sci. Technol. Energ. Mater. 2017, 78, 5–11. [Google Scholar]
- Nagayama, S.; Katoh, K.; Higashi, E.; Hayashi, M.; Kumagae, K.; Habu, H.; Wada, Y.; Nakano, K.; Arai, M. Moisture proofing of spray dried particles comprising ammonium nitrate/potassium nitrate/polymer. Propellants. Explos. Pyrotech. 2015, 40, 544–550. [Google Scholar] [CrossRef]
- Gomez Garcia, M.A.; Dobrosz-Gomez, I.; Ojeda Toro, J.C. Potassium nitrate solubility in (water + ethanol) mixed solvents at different temperatures and hydrochloric acid concentrations. experimental study and modeling using the extended UNIQUAC model. J. Chem. Eng. Data 2020, 65, 567–576. [Google Scholar] [CrossRef]
- Shao, C. Preparation and Surface Modification Study of Medium-Fineness Phase-Stabilized Ammonium Nitrate. Master’s Thesis, Yangzhou University, Yangzhou, China, 2016. [Google Scholar]
- Kudryashova, O.S.; Kataev, A.V.; Malinina, L.N. Solubility in the NaNO3–NH4NO3–KNO3–H2O system. Russ. J. Inorg. Chem. 2015, 60, 355–361. [Google Scholar] [CrossRef]
- Wrobel-Kaszanek, A.; Druzynski, S.; Kiełkowska, U.; Mazurek, K. Equilibrium study in the KNO3 +NH4NO3 +H2O system at temperatures from 293.15 to 323.15 K. J. Chem. Eng. Data 2019, 64, 784–790. [Google Scholar] [CrossRef]
- Yuan, J.S.; Han, H.R.; Wang, J.K. Research on phases equilibrium of binary mixed solvent system of nitrate. Haihuyan Yu Huagong. 2005, 34, 1–3. [Google Scholar]
- Yakov, I.; Tur, Y. Theoretical bases of the ammonium ion determination by formol titration. Rev. Anal. Chem. 2010, 29, 25–38. [Google Scholar]
- Zeng, Y.R.; Chen, X.M.; Guo, C.; Zhao, S.Y.; Zheng, H.D.; Wang, L.E. Measurement and correlation of liquid–liquid equilibrium data for water + methanol + methyl acetate + potassium acetate. Fluid Phase Equilib. 2013, 354, 319–325. [Google Scholar] [CrossRef]
- Chen, L.Q.; Li, T.X.; Shi, L.J.; Wang, S.H.; Meng, Z.Y.; Zhang, J.; Zhu, J. Phase equilibrium and crystallization process of the ternary system KCl-(NH2)2CO-H2O at different temperatures. J. Chem. 2023, 2023, 1–15. [Google Scholar] [CrossRef]
- Zeng, G.Y.; Zhou, J.H.; Huang, H. Effect of Inorganic Additives on Phase Transition of Ammonium Nitrate. J. Energ. Mater. 2007, 15, 400–403. [Google Scholar]
- Gao, H.X.; Ye, C.F.; Piekarski, C.M.; Shreeve, J.M. Computational Characterization of Energetic Salts. J. Phys. Chem. C 2007, 111, 10718–10731. [Google Scholar] [CrossRef]
- Chen, J.H. Phase Equilibrium Thermodynamics and Quantum Chemistry Study of Phenylurea-Nitrobenzoic Acid Eutectic Synthesis. Master’s Thesis, Yangzhou University, Yangzhou, China, 2023. [Google Scholar]
Disclaimer/Publisher’s Note: The statements, opinions and data contained in all publications are solely those of the individual author(s) and contributor(s) and not of MDPI and/or the editor(s). MDPI and/or the editor(s) disclaim responsibility for any injury to people or property resulting from any ideas, methods, instructions or products referred to in the content. |
© 2025 by the authors. Licensee MDPI, Basel, Switzerland. This article is an open access article distributed under the terms and conditions of the Creative Commons Attribution (CC BY) license (https://creativecommons.org/licenses/by/4.0/).