Abstract
Hydrogels represent a versatile class of materials with remarkable potential as three-dimensional matrices for nanoparticle integration. This study explores the mechanism of silver nanoparticle formation within a polyacrylamide–alginate hybrid hydrogel, employing a controlled reduction–oxidation reaction between silver nitrate (AgNO3) and sodium borohydride (NaBH4) across a temperature gradient (5–70 °C). Characterization techniques, including Raman, infrared, and UV-Vis spectroscopies, X-ray diffraction, and scanning electron microscopy, were employed to analyze the structural and optical properties of the nanoparticles and the hydrogel. The results show that, as the temperature rose, nanoparticle numbers decreased, while their size increased. Consistently octahedral in shape and averaging 100–120 nm, these nanoparticles revealed a temperature-dependent growth pattern, with rare larger crystals emerging more frequently at higher temperatures. The findings highlight the potential of hybrid hydrogels as effective matrices for the incorporation of metal nanoparticles, paving the way for applications in drug delivery, biosensing, and antimicrobial treatments.
1. Introduction
Gels are composite materials consisting of a three-dimensional polymer network and a liquid phase dispersed between the meshes and pores of this network [1]. Thanks to its surface tension, the liquid phase acts as a force opposite to the elastic recall force of the polymer network and prevents it from collapsing on itself. The liquid component constitutes the largest fraction of a gel, both in terms of weight and volume. Depending on the nature of the liquid, gels can be divided into organogels, in the general case, and hydrogels, when the liquid phase is water [2].
The physicochemical properties can then be finely tuned by controlling the chemistry of the polymer chains, their average molecular weight, the degree of cross-linking, the water content and by the presence of possible additives, making gels and hydrogels powerful tools for a variety of applications in numerous sectors, ranging from sensors [3] to actuators [4].
Hydrogels, particularly those derived from biocompatible polymer chains like alginate and chitosan, are gaining significant attention in the biomedical field. These versatile materials exhibit remarkable properties that make them ideal for a wide range of applications. Often referred to as “smart” materials, hydrogels can respond dynamically to environmental stimuli, enhancing their functionality in various medical contexts. Their unique characteristics enable innovations in drug delivery, tissue engineering, wound healing, and more, showcasing their potential to revolutionize healthcare solutions [5].
In the biomedical sector, hydrogels are employed as intraocular vitreous fillers, in tissue engineering (e.g., skin, cartilage, and cardiovascular tissue regeneration [6,7]), in wound dressings, and in controlled drug delivery. Their effectiveness can be further enhanced by incorporating specific additives, such as nanoparticles, which improve their mechanical and functional properties [8].
Nanoparticles are defined as systems with sizes smaller than 100 nm [9]. Nanoparticles are increasingly being utilized in both diagnostic and therapeutic applications, showcasing their versatility in the biomedical field [10], and often showing good capacity as therapeutic agents, such as antimicrobial, anticancer, and free radical scavenging agents [11]. Nevertheless, nanoparticles may have serious problems in terms of toxicity [12], and the aspects of nanotoxicity and biocompatibility are topics of great interest and research [13].
The combination of hydrogels with nanoparticles offers a promising strategy to overcome challenges related to drug delivery and controlled release. These hydrogel–nanoparticle composites allow for localized drug delivery, improving bioavailability at the target site while minimizing systemic toxicity. Additional advantages include enhanced stability, controlled release profiles, tunable mechanical properties, and reduced off-target effects, making them highly adaptable across different medical applications Therefore, hydrogel–nanoparticle composites can effectively integrate the beneficial properties of both parent systems while minimizing any potential adverse effects of nanosystems [14].
There are several ways to prepare these systems. The simplest method involves allowing pre-synthesized nanoparticles to diffuse into the gel. For example, a partially or fully dehydrated gel can absorb a liquid containing dispersed nanoparticles. As the liquid penetrates and swells the gel, the nanoparticles become incorporated into the matrix. However, this method often results in strong distribution gradients, limiting its applicability [14].
A more effective approach involves in situ nanoparticle synthesis within the hydrogel matrix through controlled chemical reactions. Nanoparticles can be synthesized by precipitation [15,16] or controlled oxidation–reduction processes [17]. For instance, metallic nanoparticles can be conveniently prepared by the controlled reduction of their compounds, using sodium borohydride, NaBH4, reducing monosaccharides, trisodium citrate, Na3C6H5O7, and others. The careful control of the experimental conditions leads to the formation of nanoparticles.
In the case of a loaded gel, this result can be achieved allowing it to absorb initially a solution of certain compound and, then, after the equilibrium has been established, a second solution of another compound, which can react with the first. As the reaction takes places, nanoparticles can be eventually formed directly within the matrix. This method is very effective and can lead to the formation of many types of particles and reduce distribution gradients. Figure 1 shows a schematic representation of the steps of this process: A partially hydrated gel is brought into contact with a solution and swells. Gels can remain in this state even when the excess solution is removed, as the liquid is absorbed. When the solution containing compound B is brought into contact with the gel, it can begin to slowly diffuse and the chemical reaction between A and B can occur locally. Eventually, the excess of the second solution is also removed, while the nanoparticles remain inside the gel.
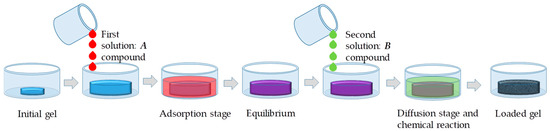
Figure 1.
Steps required for the synthesis of nanoparticles inside a hydrogel: absorption of solution A, reaching equilibrium, absorption of solution B, diffusion, and in situ reaction.
This method, while effective and often leading to optimized materials with the advantage of ease of implementation, still presents some open questions regarding particle growth. Specifically, the influence of external conditions, like temperature, pH, and concentration, on particle size, morphology, appearance, distribution, and homogeneity warrants further investigation. Furthermore, the interactions between the polymer matrix and the growing particles, while likely crucial, can vary significantly depending on the specific gel used. This study focuses on the growth and interactions of silver nanoparticles within a hybrid hydrogel—a gel composed of two distinct polymers—due to their promising potential in diverse applications, particularly in the medical field. Hybrid hydrogels can exhibit properties superior to those of their individual constituent polymers. In this paper, a system of alginate and polyacrylamide, leveraging alginate’s high biocompatibility and polyacrylamide’s excellent mechanical properties, is investigated.
The gel was first allowed to absorb a solution of silver nitrate and then one of sodium borohydride, a rather powerful reducing agent. The process was conducted between 5 and 70 °C, to investigate the effect of the temperature on nanoparticle formation, on their morphology, on their average size, and on concentration.
Some specimens prepared in this way were characterized by Raman, IR, and UV-Vis spectroscopies, X-ray diffraction, thermal analysis, by swelling analysis, and by optical and scanning electron microscopy to study the appearance and the general features of the nanoparticles inside the gel.
2. Experimental Section
2.1. Materials and Methods
The synthesis of the hydrogel was performed by dissolving 2 g of sodium alginate (SA, purchased by Sigma Aldrich (St. Louis, MO, USA), with an average molecular weight in the range 20,000–60,000 Da, according to the manufacturer’s specifications) in 100 mL of water at 60 °C, adding 15 g of acrylamide (purchased by Sigma Aldrich), 0.01 g/10 mL of N,N’-methylenebisacrylamide (MBA, purchased by Sigma Aldrich), and a potassium persulfate initiator (KPS, purchased by Sigma Aldrich). Subsequently, 0.2 mL of N,N,N’,N’-tetramethylethylenediamine (TEMED, purchased by Sigma Aldrich) was added [18]. The preparation of the gels was carried out in large enough containers (approximately 7 cm in diameter), proportionally to the initial masses of the starting materials, to allow the formation of samples with thicknesses not exceeding a few mm.
The silver nanoparticles were prepared by submerging the hydrogel in a 20 mL solution of AgNO3 (10 mM) (purchased by Carlo Erba Reagents, Milano, Italy) for 24 h at room temperature to complete the diffusion inside the gel structure. It can be assumed that, after this period a uniform distribution of metal cations inside the gel is achieved. After 24 h, the gels were removed from the container, their surface cleaned, and the residual drops of saline solution present on it were removed and then they were re-immersed in a 5 mM NaBH4 (purchased by Merck KGaA, Darmstadt, Germany) solution for an additional 24 h. During this stage, the samples were kept at different temperatures, ranging from 5 °C and 70 °C. Finally, the gels are removed from the liquid so that they could be analyzed. The concentrations of the reagent solutions and all other parameters were kept fixed in all experiments, so that only the effect of temperature alone could be investigated. For characterizations, the gels were dehydrated by leaving them for a few days at 40 °C.
2.2. Characterization Methods
The Raman spectra of the compounds and mixtures were acquired, at room temperature, by a BWTEK i-Raman plus spectrometer (B&W Tek, Plainsboro, NJ, USA) equipped with a 785 nm laser in the range of 100–3500 cm−1 with a spectral resolution of 2 cm−1. The measurement parameters, such as acquisition time, number of repetitions, and laser power, were selected for each sample to maximize the signal-to-noise ratio. The standard acquisition, however, was 20 repetitions of 10 s each. This instrument has a maximal power of 350 mW, but in most cases, only 10% of it was used. For each spectrum, a reference acquisition was previously carried out with the same parameters to subtract the instrumental background. IR spectra were collected using a PerkinElmerSpectrum Two FT-IR Spectrometer (PerkinElmer, Waltham, MA, USA), equipped with room-temperature LiTaO3 (lithium tantalate) MIR detector with a SNR of 9300:1 with a best resolution of 0.5 cm−1 between 450 cm−1 and 4000 cm−1 and measuring the transmittance of the sample.
The UV-Vis absorbance spectra were acquired using a high-resolution, double-beam, double-monochromator JASCO V-760 UV–Visible Spectrophotometer (JASCO Corporation Hachioji, Tokyo, Japan), working with a deuterium lamp in the range between 187 and 350 nm and with a halogen lamp in the range between 300 and 900 nm and a photomultiplier tube as the detector. The spectra were collected averaging 10 acquisitions in the range of 200–900 nm with spectral bandwidth as narrow as 2 nm and scanning speed equal to 400 nm/min, after baseline correction.
The X-ray powder diffraction (XRPD) investigations were performed to determine the crystalline phases, using a Philips X’Pert PRO 3040/60 diffractometer (Philips, Amsterdam, The Netherlands) operating at 40 kV, 40 mA, with Bragg–Brentano geometry, equipped with a Cu Kα source (1.54178 Å), Ni-filtered, and with a curved graphite monochromator. PANalytical High Score software (version 4.1) was used for data elaboration. The XRD acquisitions were performed using these parameters: start position: 10° [2θ]; end position: 100° [2θ]; step size: 0.0250°; scan step time: 6.0000 s; scan type: continuous.
The thermal analysis was performed for each sample using an STA 409C simultaneous analyzer (Netzsch, Selb, Germany) equipped with a DSC/TG sample carrier system, supporting an S-type thermocouple. During the thermal program set up in the tests, the changes in sample mass (TG expressed as % mass loss) and in heat flow due to transformation from one state to another or other physical phenomena (DSC expressed as mW/mg) were measured. DSC/TG analyses were performed under dynamic air atmosphere with a flow rate of 100 mL/min and a heating rate of 5 °C/min up to 650 °C.
A first insight into the hydrogel aspect was obtained by observing the samples under a Leica M80 optical microscope (OM), equipped with an EC3 camera and using the Leica Application Suite (LAS) EX software (version 3.4) for acquiring and characterizing the images. The characterization, morphology, and composition of the samples, in their dehydrated state, were performed by scanning electron microscopy using a FEI QUANTA INSPECT S Scanning Electron Microscope (SEM), in the low-vacuum mode, (FEI Company, Eindhoven, The Netherlands). Observations were carried out at different magnifications using both secondary electron and backscattered electron detectors at a 10 mm working distance, with energy ranging from 10 to 20 KV. The elemental analysis was carried out in the most significant areas of the samples using an Energy Dispersive X-ray spectroscopy (EDS-Bruker (Billerica, MA, U.S), XFlash Compact 6|30M), equipped with Esprit Compact software for data elaboration.
3. Results
3.1. General Characterization
Hybrid hydrogels offer superior physicochemical properties compared to conventional hydrogels, including enhanced mechanical properties, stability, homogeneity, and biocompatibility. Their versatility has garnered significant scientific interest due to their numerous potential applications [19,20,21]. These materials consist of chemically distinct polymer chains linked together through intricate cross-linking, which can be physical, chemical, or due to structural entanglement. A key advantage is their ability to incorporate biologically active polymers, such as polysaccharides, proteins, or peptides, through physical or chemical bonds. The degree of interpenetration between the different building blocks can vary widely, ranging from the molecular level to much larger domains, depending on the size and nature of the constituent polymers.
In this work, an alginate/polyacrylamide composite material was prepared, as these blends can have mechanical properties very similar to several human tissues, such as cartilage, depending on the ratio of the two components. The alginate component provides excellent biocompatibility, while the polyacrylamide network provides the system with high stability and resistance. Depending on the synthesis strategy used, the three-dimensional network is made up of polyacrylamide, while the alginate chains are entangled and intertwined between the meshes.
Sodium alginate is a salt of alginic acid, which in turn is a naturally occurring, edible polysaccharide found in brown algae. This acid is a linear copolymer made by blocks of (1→4)-linked β-D-mannuronate (M) and α-L-guluronate (G) residues, linked together by strong covalent bonds [22]. Alginate-based hydrogels are widely studied as a common biomaterial for the bio-fabrication of scaffolds and tissue regeneration and for their favorable properties encouraging regeneration, cell proliferation, and mechanical strength [23]. Figure 2 shows the chemical structure of the sodium alginate molecule.
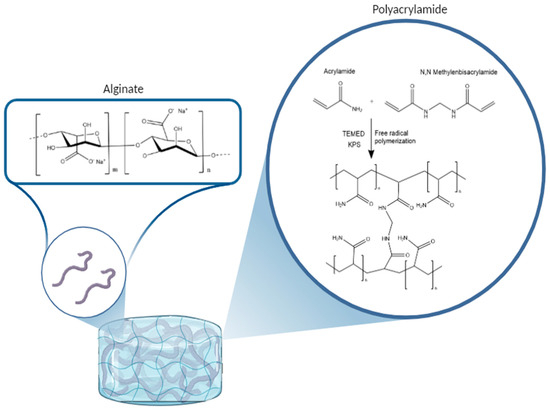
Figure 2.
Representation of the chemical pathway for the formation of the alginate/polyacrylamide hybrid gel.
Sodium alginate is a salt of alginic acid, which in turn is a naturally occurring, edible polysaccharide found in brown algae. This acid is a linear copolymer made by blocks of (1→4)-linked β-D-mannuronate (M) and α-L-guluronate (G) residues, linked together by strong covalent bonds [22]. Polyacrylamide is a synthetic polymer with the formula (-CH2CHCONH2-)n having a linear chain structure.
Polymerization occurs because MBA can react with acrylic and vinyl monomers, such as acrylonitrile, acrylamide, or similar molecules, by radical pathway, forming cross-linked gels, in the presence of peroxides, REDOX initiators, or ultraviolet light. In this case, KPS, which is also a powerful oxidant, acts as an initiator.
In fact, especially in the presence of TEMED, which catalyzes its decomposition, it originates radicals, according to the reaction:
[O3SO-OSO3]2− ⇌ 2 [SO4]•−
These radicals, as an initial stage of polymerization, break the double bonds of acrylamide.
Figure 2 shows the chemical structure of alginate and polyacrylamide chains and a schematic of the chemical process leading to cross-linking and then gelation used in this case for the formation of the hydrogel [24].
The gels thus prepared show excellent uniformity and good mechanical properties, including elasticity, absorption capacity, toughness, and consistency. The homogeneity of these gels is proven by spectroscopic measurements conducted at numerous points of the samples, which result in completely superimposable spectra.
A typical IR spectrum of a gel is shown in Figure 3A, while Figure 3B shows the Raman spectrum of the same sample, as prepared, i.e., without nanoparticles.
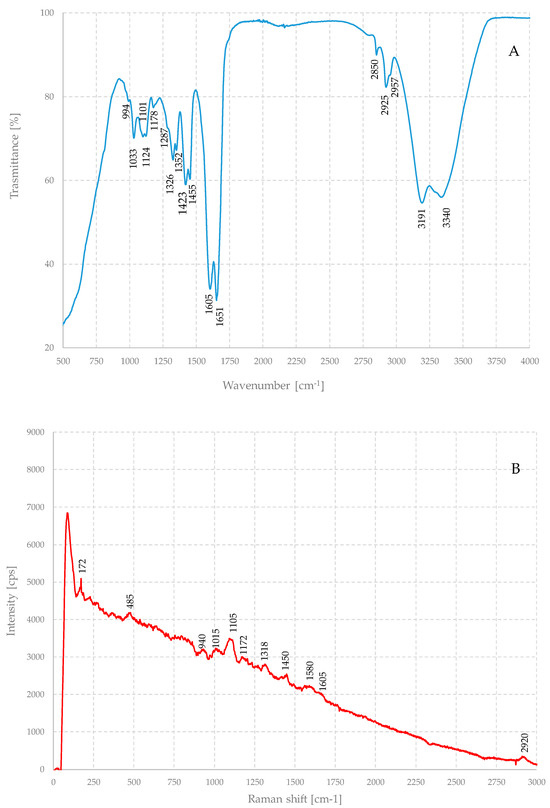
Figure 3.
IR (A) and Raman (B) spectra of the dehydrated pristine hybrid hydrogel.
Vibrational spectroscopic techniques are powerful tools for the non-destructive chemical characterization of samples. Raman and IR techniques provide important information for qualitative and quantitative analysis, and they can be considered from many points of view as complementary. Nevertheless, in both cases, the interpretation of the spectral features of this gel is not trivial, because it is a multicomponent material. Both spectra are the result of the combination of the spectral characteristics of the alginate component and that of the polyacrylamide, although, comparing the spectra with those known in the scientific literature, the latter seems to be the most important component.
The IR spectrum shows as its main feature a broad band between about 3550 cm−1 and 3000 cm−1, which is in the region corresponding to the stretching of the OH, NH, and NH2 groups, as can be expected from a system where hydroxyls and amides are present.
There are two signals at about 3340 cm−1 and 3190 cm−1 that can be associated with the antisymmetric and symmetric stretching of the NH2 groups, respectively. Instead, the hydroxyl peaks are not immediately identifiable but are included in the main band. Other important features are the C-H bonds stretching around 2960, 2925, and 2850 cm−1.
Carbonyl stretching bands fall between 1900 and 1600 cm−1 and, in this range, this sample exhibits two intense and narrow bands at about 1650 cm−1 and at about 1605 cm−1 that can attributed to carbonyl group of amides and carbohydrates.
Below about 1460 cm−1 there are bands due mainly to the bending modes of NH groups and stretching skeleton vibrations and among C–C–C and C–O–C [25,26,27,28], but the specific attribution of each band may not be trivial. Finally, below 1000 cm−1, the fingerprint region begins.
Similar considerations can be made for the Raman spectrum. The main bands of the spectrum can be attributed to the same functional groups. Indeed, it has been reported that, in the first case, the Raman spectra are sensitive to the presence of guluronic and mannuronic acid units [29]. While guluronic acid units originate a band around 1025 cm−1, mannuronic acid shows a band at approximately 1100 cm−1, and their relative abundance determines the ratio between the intensity of these bands. Bands around 1450 and 1170 cm−1 are associated with the vibrations of polysaccharide backbones, with the symmetric vibration of glycosidic bonds [30]. In any case, both techniques demonstrated that the polymerization and subsequent gelation occurred successfully and that the samples were extremely uniform and homogeneous.
Nanoparticles are formed because of the oxidation–reduction reaction between silver nitrate and sodium borohydride. The former is commonly used as a starting reagent for the synthesis of nanoparticles, even in complex matrices, and not only in the case of dispersions in water [31,32], while the second one is a well-known powerful reducing agent [33,34].
Sodium borohydride reacts with protic solvents that release spontaneously hydrogen, but at room temperature, a dilute solution is stable long enough for the process to occur and, in fact, it is commonly used as an efficient reducing agent for silver nanoparticles. The aqueous solution might be less stable at 70 °C, but even in this case, the formation of crystalline particles was observed, so that the reaction also occurs at this temperature.
Formally, the ion BH4- behaves as the hydride ion H- and, therefore, one mole of electrons is available for every 0.5 mole of molecular hydrogen formed by oxidation.
It is possible to write the following redox reactions [35]:
AgNO3 + NaBH4 + 3 H2O → Ag + 7/2 H2 + H3BO3 + NaNO3
The method proved to be very effective in the preparation of loaded gels. Figure 4 shows optical photos of samples cut from an unloaded gel and the top view (B) and section view (C) of samples cut from a loaded gel prepared at room temperature.
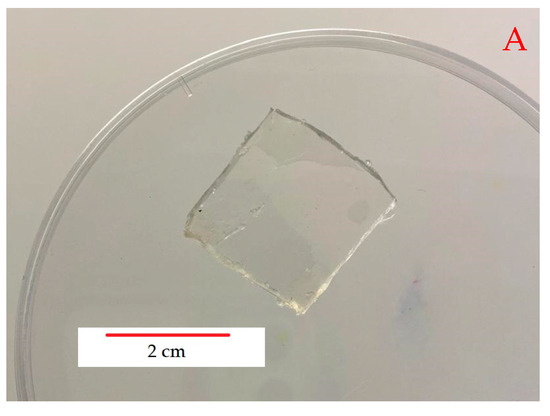
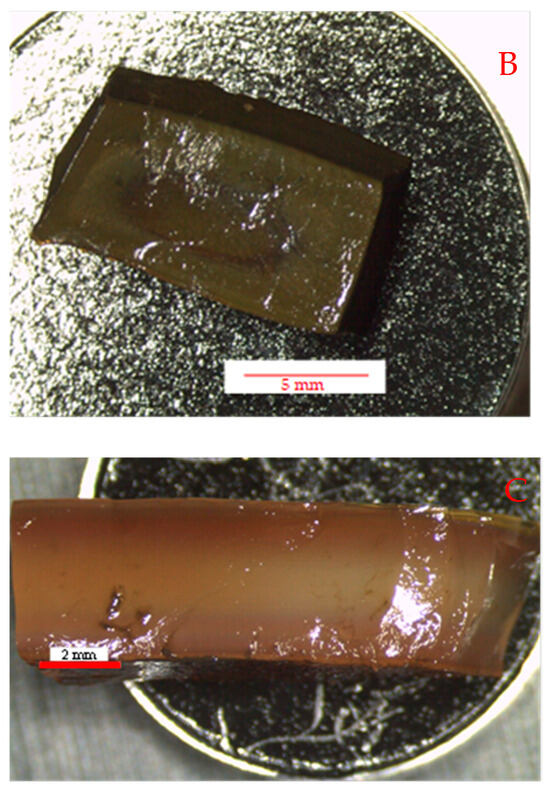
Figure 4.
Optical images of an unloaded gel (A) and a loaded gel prepared a room temperature (top view (B) and section (C)).
The parent gel is, as expected, almost completely transparent, whereas those after absorbing silver nitrate and subsequently reacting with sodium borohydride appear to have a rather dark brown color. On the surface, the samples are very uniform; however, in the section, their central part is lighter, suggesting that there is a lower concentration of particles in the center, although not zero. This means that the reaction front, which moves from the outside towards the center of the samples, can only proceed for a few mm of thickness in the samples, probably less than 2 mm, at least in the experimental conditions discussed in this paper. However, from the point of view of possible applications, especially in the biomedical field and as an antimicrobial system, this may not constitute a real limitation, because only the particles closest to the gel surface can interact with the external environment. In any case, the gels were prepared so as to have a thickness of a few mm, comparable with the diffusion of the reagents inside them and, therefore, it can be assumed that the formation of the particles can occur throughout the thickness of the samples.
Figure 5 shows SEM images of a pure gel (A) and a loaded one, both on the surface and in depth (B and C, respectively).


Figure 5.
SEM image of a hybrid hydrogel without nanoparticles (A) and with nanoparticles prepared by controlled REDOX reaction at room temperature, seen on the surface (B) and in depth (C).
These images show that both the unloaded and loaded gels are very uniform and they appear very homogeneous and isotropic at the micrometric or even sub-micrometric scale. In the case of the loaded material, an abundance of particles of a size much smaller than a micron is observable. Near the surface, they appear much more numerous than towards the center, which is consistent with the fact that the reaction front proceeds from the outside towards the inside, but their morphology is very similar.
EDS analyses were performed in several areas to determine the composition of these particles. Since they are very small in size, it is impossible to measure their chemical nature and that of the matrix separately; however, the presence of silver is evident. Figure 6 shows a typical EDX spectrum carried out on a large particle (Figure 6A) and in a small area (Figure 6B).
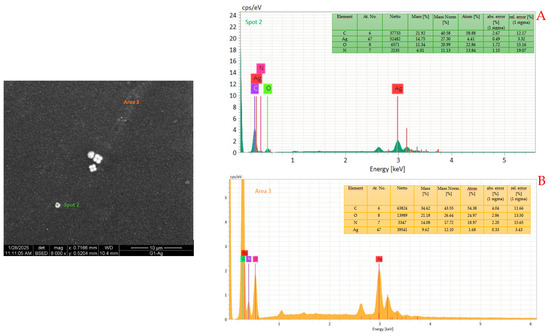
Figure 6.
EXD spectra of a large particle (A) and of a small area (B), with the atomic compositions.
Figure 7 shows an EDS map of the silver distribution in the sample, and it results that its distribution is very uniform and there are no areas where silver is particularly abundant or others where it is absent and no gradient can be observed. Again, since both the average size of the particles and their average distance are very small, it is not possible to directly associate its presence with the individual particles, but it does not seem plausible that it is simply dispersed in the matrix and, on the contrary, this proves that the REDOX reaction has also occurred successfully inside the gel.
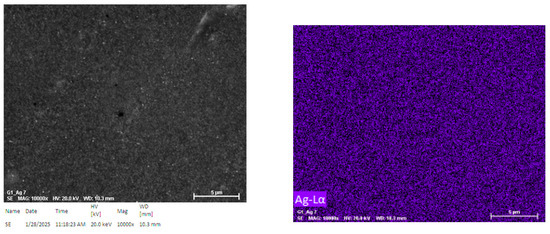
Figure 7.
Silver EDS distribution map inside the gel.
The color of the loaded gels strongly depends on the presence and concentration of the nanoparticles. Actually, silver colloids show different colors because of their light absorption and scattering due to plasmonic resonance, which, in turn, depends on the average particle size [36] and it varies from pale yellow to deep green through orange, red, deep purple, and light blue as, being constant other factors, the particle size increases. The loaded gel is very dark, even almost black, but this can be justified by considering that the color of the dispersions also depends on other factors, including the morphology and concentration of the particles and their synergistic combination and that high concentrations lead to darker colors [37]. The concentration of particles, as demonstrated by the SEM images, is very high in the samples.
It is possible to characterize silver nanoparticles and determine their main characteristics by UV-Vis spectroscopy. This technique is in fact a well-known and powerful tool for analyzing metal nanoparticles [38]. It is a simple, and inexpensive technique that provides a non-invasive and fast screening of nanosystems, providing information such as their size, morphology, and aggregation because the spectra are highly sensitive to these factors since the localized surface plasmon resonance of metal nanoparticles allows for a high absorption of photons in the range between about 200 and 900 nm [39].
However, in this case, the application of this technique is made problematic by the polymer matrix. In fact, by their nature, these polymers could have transitions in the same spectral range as the silver particles, due to the presence of groups, such as carbonyls and double bonds, which can absorb UV photons. Since nanoparticles constitute a very small fraction of the samples both by mass and volume, their contribution may be very small and difficult to recognize. On the other hand, it is not possible to remove the matrix, either thermally or chemically, without the risk of altering or modifying the particles. Furthermore, it would be difficult to completely catch (e.g., by filtering or sieving) such small objects without important losses, above all of the smallest fractions.
For these reasons, it was decided to perform the UV absorption analyses on the loaded gel sample completely dried and reduced to powder and then dispersed in water in a ratio of approximately 1:10. For comparison, the pure gel sample, without particles, was also treated and analyzed in the same way. It is interesting to note that the gel powders quickly reabsorb water and create a uniform mass directly inside the sample holder with simple manual stirring.
In addition, the residual liquid obtained after the absorption stage of the sodium borohydride solution by the gel was also analyzed. At the end of this step, this liquid appears slightly brown in color, suggesting that some particles have escaped from the gel.
Figure 8 shows the UV-Vis spectra of the parent gel in the form of a dispersion in water (A), of the loaded gel, analogously dispersed in water (B), and the residual liquid with nanoparticles (C).
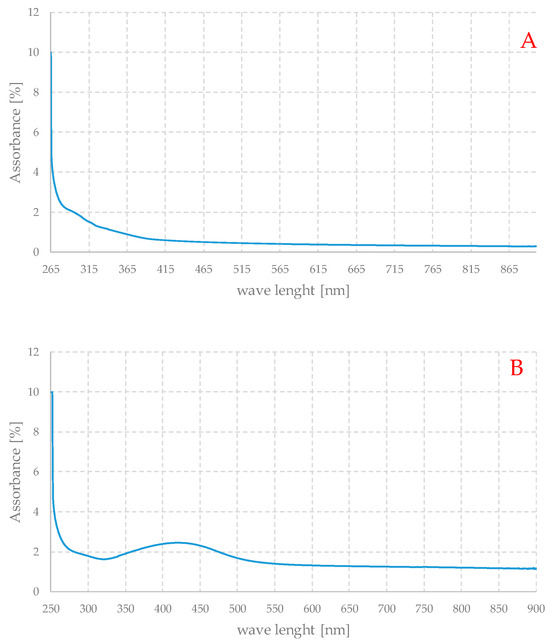
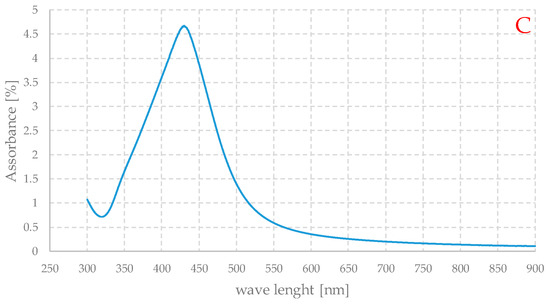
Figure 8.
UV-Vis absorption spectra of pure gel (A) and Ag-loaded (B) dispersed in water and of the residual liquid with nanoparticles (C), obtained after the REDOX step of preparation.
The spectra thus obtained should be understood as qualitative, because some important factors such as concentration are not known. Nevertheless, Figures B and C show the typical appearance of the UV spectra of silver nanoparticle-based systems. Spectrum A shows a strong absorption below about 250 nm, which evidently corresponds to the electronic transitions of the organic component of the material. Spectrum B is very similar to the previous one, with the same type of absorption at high energies, but a peak centered at about 420 nm is also evident, while in spectrum C, since the organic component is absent, this absorption signal is not present, but only a peak in the same range as in the case of the loaded gel. The maximum is at slightly shorter wavelengths, but the two curves are generally quite similar. The spectrum of the loaded gel exhibits a non-zero absorbance, but practically independent of the wavelength between 550 and 900 nm. This can be due to the weak absorption of the organic part of the material and to the scattering of light due to the particles themselves. This can also account for the very dark color of these gels.
In general, the peak position is strictly dependent on the average particle size, and the maximum centered between 400 and 450 nm is associated with particles of about 80–90 nm in size [38,40], a value that seems quite compatible with the SEM observations.
From the image analysis, in fact, it is possible to establish the dispersion curves of the particle size and evaluate their widths and other characteristics. Figure 9 shows the histogram of the particle size distribution curve.
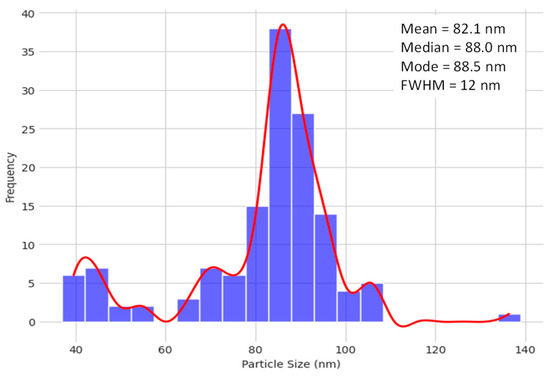
Figure 9.
Histogram of the particle size distribution curve.
This method should be seen as indicative rather than exactly correct. Furthermore, this technique can overestimate the fraction of small particles. In fact, some particles can appear smaller than they actually are, if they are “deeper” in the gel than the observation plane. Despite this, the curve is quite narrow, although slightly asymmetric, with a full width at half maximum (FWHM) of around 10–15 nm. The peak of the curve is centered at around 82 nm.
To gain further insight into the nature of the particles and to gain structural information on the gels, they were also analyzed by XRD diffraction. The XRD analysis of the samples was performed both on the gel with no particles and on the loaded ones, in both cases for both hydrated and completely dehydrated samples, to investigate the crystallinity of these particles and to verify if they induce any changes in the polymer matrix. In the case of the hydrated samples, two pieces were cut to fit the available space in the sample holder, while the dry samples were carefully ground and pulverized before analysis.
Figure 10 shows XRD patterns: the parent gel (A) hydrated and dehydrated and an equally hydrated and dehydrated loaded gel (B), prepared at room temperature.
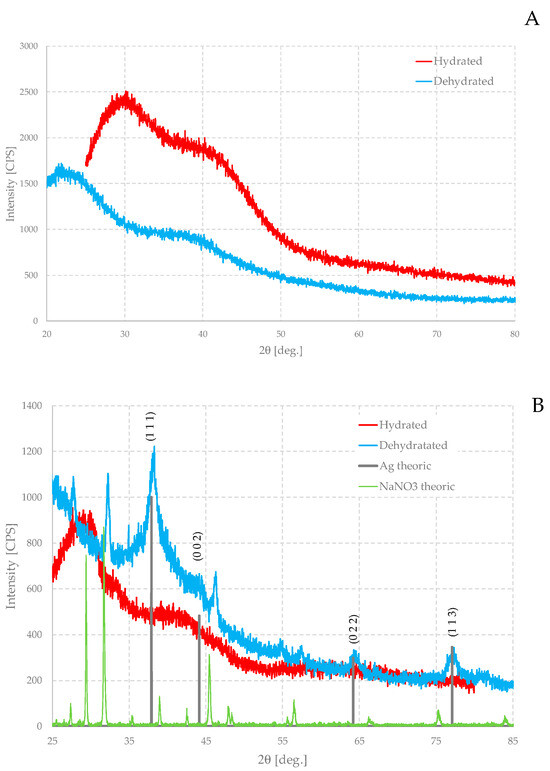
Figure 10.
XRD patterns of pure alginate gel (A) and Ag-loaded gel (B). In figure (B), the theoretical pattern of metal silver is also shown.
Taking these measurements for this type of material requires special care and attention, due to the intrinsic nature of the samples. X-ray diffraction is very useful in the case of crystalline samples, but gels are basically amorphous and the amount of nanoparticles, in terms of mass and volume, is very small, meaning that their contribution to the total XRD pattern is also very weak. This contribution can be even more meaningless for a hydrated gel, because the large water content makes the ratio between the mass of the nanoparticles and the total mass of the samples even smaller.
There are also technical issues to be addressed. Most diffractometers require that the sample to be analyzed lies on a precise plane to avoid geometric and systematic errors in the position of the diffraction peaks. For this reason, the sample holder must be filled carefully, avoiding that the surface of the sample is below or above this ideal plane, but coincides with it. In the case of gels, this is not easy to achieve because it is necessary to cut pieces of the correct shape and size from the sample. The samples are also very elastic and partially sticky, especially the loaded ones. While, for pure gels, this represents a relative problem, because they lack precise structural characteristics, in the case of loaded materials, however, an imperfect positioning of the sample to be analyzed could lead to a non-negligible shift of any eventual peaks, making identification difficult. Nevertheless, the results of these analyses can be interesting.
The patterns are quite similar to each other, especially those of hydrated gels, and they are very noisy and weak, as usually found in the literature for these materials.
Polymers can be semicrystalline and exhibit some peaks in their diffractograms due to the possible presence of ordered domains, such as lamellae, sheets, spherulites, or other structures. However, it is more difficult to observe these structures in gels or in general in cross-linked polymers, because the pieces of chain between two successive cross-linking points are shorter and the cross-linking points constrain the movement of the individual units or chains. Cross-linking decreases the possibility of the ordered packing and, on the contrary, favors the presence of large amorphous areas.
The XRD of the parent hydrated gel is characterized by a very broad, intense peak, approximately between a 2θ angle of about 25° and 40°, so that its maximum lies at a 2θ angle of about 30°. The spectrum then shows a second very broad peak with a maximum at about 42°. The intensity of the maximum is approximately two-thirds of that of the main peak, so that the second peak appears as a sort of shoulder of the first. The diffractogram of the dehydrated gel is very similar, but the first peak shifts to much smaller angles and the maximum is located at about 22°. The second signal, on the other hand, does not change its position much, staying at about 40°.
It is difficult to justify the presence of these humps in the spectrum, which may indicate the presence of modest local ordered arrangements. However, it should be kept in mind that, for this material, there are two sublattices to consider, one due to the polyacrylamide and the other due to the alginate, and each might provide a different contribution. In any case, it appears that the sample is very homogeneous on a large scale.
A similar situation can be observed in loaded hydrated gels. However, the first peak appears much narrower and the second less intense. The first maximum shifts to slightly lower angles, while the second one does not change its position. In the diffractogram of the loaded gel, additional bands also appear, a rather narrow one between the two main ones and a very wide one centered at around 2θ = 60°, which are not immediately recognizable in the parent gel. This could suggest that the presence of the particles perturbs, at least locally, the structure of the gel and could even induce slightly more ordered areas.
The XRD pattern of the dehydrated sample is very different from the others. Also, in this case, there is a component in the diffractogram due to the amorphous matrix and, as in the case of the pure gel, the absence of water causes the humps to shift to smaller angles, but the main feature is the presence of some quite wide peaks. Evidently, the absence of water increases the ratio of the mass of the particles to the rest of the matrix so that their signals are recognizable. These peaks can be readily assigned to metallic silver as well as sodium nitrate (NaNO3), which forms as an additional product in the oxidation–reduction reaction. It is a very soluble salt and, therefore, in any case, not detectable in the hydrated gel, but when the water is removed, it too is forced to crystallize inside the gel. Silver peaks may also be present in the hydrated sample, but they are so weak that they are confused with the noise of the curve.
It is not trivial to understand how nanoparticles induce structural change in gels and what effects they have on polymer meshes and, thus, how the diffractograms change because of their presence. In crystalline materials, it is well known that the XRD peaks of isostructural systems shift towards respectively smaller or larger angles if their crystal cell expands or compresses due, for example, to chemical substitution or the application of an external pressure. This behavior is obviously not immediately transferable to amorphous materials because the shifting of the peaks is due to the change in distances among the lattice planes, which are obviously absent, but it could be imagined something similar in this case too.
Hydrated gels have stretched polymer chains, leading to more coherent diffraction and, thus, diffraction peaks at smaller angles. Dehydrated gels have collapsed, twisted chains, resulting in less coherent diffraction. While gels are amorphous, they still exhibit diffraction peaks due to local order. Just as crystal lattice changes shift XRD peaks in crystalline materials, changes in gel polymer chain extension (due to hydration) can similarly affect the position of diffraction peaks/bumps, shifting them to smaller angles when the chains are more stretched (hydrated) and larger angles when the chains are collapsed (dehydrated).
Nanoparticles can be expected to force the chains to stretch further, just for a steric effect, so that the signals in the diffractograms shift towards lower angles. They can also change the amount of water present in the gel and, actually, the swelling of the loaded gels is much higher, as will be shown shortly, which can certainly cause the polymer meshes to expand considerably.
The swelling behavior is shown in Figure 11: The gels were first completely dehydrated, leaving them in an oven at 40 °C for at least one week, and then immersed in distilled water to allow them to reabsorb it. Samples of approximately 0.1/0.2 g 1 cm × 1 cm were immersed in 40 mL of distilled water, changing it every time, and weighed after fixed intervals.
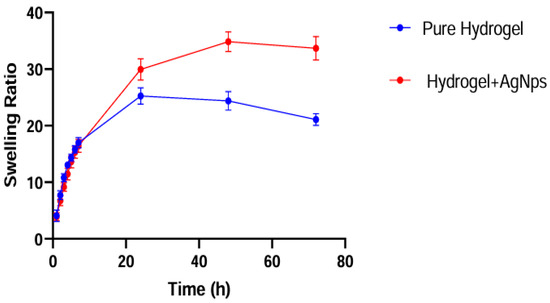
Figure 11.
Swelling behavior as a function of time for the pure and Ag-loaded hydrogels.
Swelling, Sm, can be defined as:
where Sm is the mass variation associated to swelling, and mf and m0 (i.e., the mass of gel in its dehydrated state) are the final and initial masses, respectively. To reduce the experimental error, which may be due, among other things, to the difficulty of handling these samples (for example, gels may lose mass during the removal of excess water or on the contrary water may remain attached to their surface), the value was averaged over the weight variation in at least ten samples.
Both kinds of gels show a very high capacity to absorb water, as the swelling ratio after 24 is about 25 and 30 for the unloaded and loaded gel, respectively. Since the matrix is the same, the gels have a similar behavior and comparable absorption rate and statistically behave in the same way; however, the water absorption capacity is much higher for the silver-loaded gel than the parent gel.
The nanoparticles also have effects on the thermal properties of the gels, as can be observed in Figure 12, which shows the DSC-TG curves of different dehydrated samples.
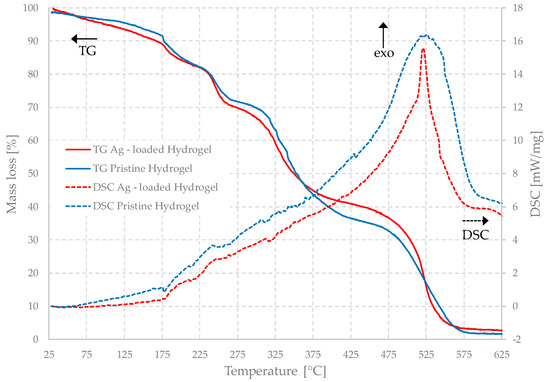
Figure 12.
Simultaneous TG and DSC of the unloaded and Ag-loaded hydrogels.
These hydrogels also show great thermal stability. It is worth noting that the gel is stable up to about 150 °C, with a small loss of mass associated with the evaporation of residual water and, again, the Ag-loaded gel confirms its higher capability of absorbing water since the small residue is released more slowly and at slightly higher temperatures than the one without nanoparticles. The last step is the most exothermic one and indicates that the complete degradation of the gels, in all the cases, occurs no earlier than 400 °C, with the peak at approximately 525 °C, and it is complete at about 580 °C. The samples decompose practically completely, turning into volatile compounds, such as CO2, and leaving a very small quantity of solid residues and ash. The overall mass loss of the loaded sample is slightly smaller, less than 1%, which is likely due to the metallic silver residues. Between 200 °C and 400 °C, some exothermic degradation reactions occur, to which smaller mass losses are associated.
Both the DSC and TG curves of the unloaded and loaded gels are very similar. The temperatures at which the transformations and mass losses occur are practically identical below about 350 °C. The filled sample loses slightly more mass between room temperature and 200 °C, which is consistent with the possible higher presence of water in it and with the differences observed in the diffractograms. Furthermore, this means that these transformations are due to the polymer matrix alone.
At higher temperatures, some differences are observable. The TG curves diverge at this temperature and, in the range between 400 °C and 500 °C, the parent gel shows a slightly higher mass loss. For the loaded gels, in fact, the mass is nearly constant for about 50 °C, between 400 °C and 450 °C, and then it changes more abruptly. Above about 520 °C, the difference among the curves decreases, and the final plateau occurs at an almost identical value. The most significant difference is in the DSC curves, because they are completely coincident between room temperature and approximately 450 °C, but the main peak has a very different shape in the two cases.
In the case of the loaded gel, the peak is much sharper than that in the other system, in which it has a more rounded shape. However, the temperature at which the maximum occurs is, in fact, the same, and the starting and ending temperatures are almost identical. This indicates that all transformations are, therefore, due to the polymeric component, but that silver nanoparticles have a rather surprising stabilizing effect on the matrix, which becomes more resistant to the temperature increase. The very broad DSC peak observed in the pristine gel may indicate that, as the degradation proceeds, chains with different molecular weights are formed, each with a slightly different thermal behavior, while this phenomenon is inhibited or at least reduced in the case of the loaded gel. This behavior is not uncommon in nanocomposites [41,42]. It can be related to the presence of many functional groups, often hydrophilic, present on the polymer chains, which can have chemical and electrostatic favorable interactions with the surface of the nanoparticles. These interactions, on the one hand, make the dispersion of nanoparticles inside the gels more stable and, on the other hand, it makes the matrix more resistant.
3.2. Microscopic Characterization
Silver nanoparticles can have very different morphologies and crystalline habits, depending on the conditions under which they are synthesized [43,44,45]. They can be present as quasi-spherical, cubic, octahedral, planar triangular, rods, and of many other shapes. This is often due to the nature of the reducing agent, the presence of activators, capping and dispersing agents, and the experimental conditions. All these factors can direct the formation of one type of nanoparticle at the expense of others, regulating their kinetics.
However, in the case of their growth inside a matrix, i.e., in a situation that is different from the free formation of the particles in an aqueous medium, the diffusion rate of the reacting phases and their concentration must also be taken into consideration.
Figure 13A shows the average appearance of a gel in which the particle formation reaction at room temperature occurs. It is possible to notice a very high number of particles of very uniform size, in the range of 80–120 nm, which is consistent with the average size of silver nanoparticles that can be obtained by controlled reduction using sodium borohydride. In fact, when prepared in aqueous media, using this reducing agent, the nanoparticles have a size ranging from 50 up to 140 nm, depending on the experimental conditions [46].
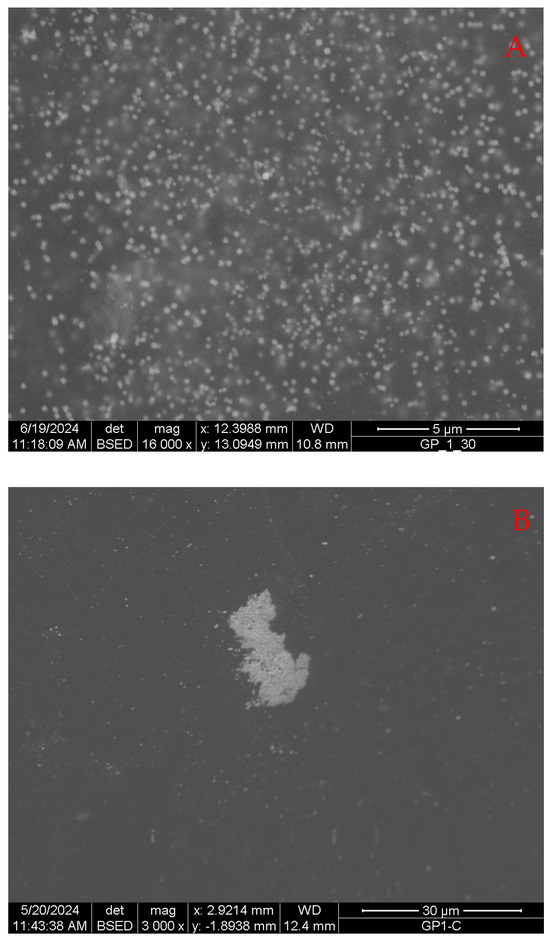
Figure 13.
SEM image of a gel sample loaded with silver particles, prepared at 25 °C: general appearance (A) and particle accumulation area (B).
Some particles appear to have sharper edges than others, which on the contrary appear to be more blurred, but this may be due to the fact that the latter are deeper in the gel matrix than the observation plane and, therefore, are reached and reflect a smaller quantity of electrons. These particles appear as squares in most cases. Since, in this case, it is not possible to observe the free particles, but they are seen along a plane, which is the surface of the gel, what is observed is, therefore, a two-dimensional view of three-dimensional objects. The square appearance is very compatible with particles with an octahedral habit, although the cubic one cannot be completely ruled out. The average distance between them is comparable to their average size, and it can therefore be said that this distance is in the range between one time and twice the size of the particles. However, in the same sample, there are some rare areas where there are aggregates of particles that are not uniform (Figure 13B). Although, in these areas, the particles are on average closer together, their appearance and morphology are still very similar to those of the others.
These types of aggregates are quite rare in the observed samples, suggesting that their origin is peculiar. It is worth noting that the area around them is rather poor in other isolated particles and that, therefore, the gel is somehow depleted. Probably, these areas form inside of macroscopic defects of the gel, where a certain amount of reacting solutions accumulate, removing it from its immediate surroundings.
In this sample, there are few crystals, with a size much larger than the average size of the other particles, as can be seen in Figure 14: the left insert allows to evaluate the size of this crystal. These large particles are extremely rare, as can be seen in the right insert of the same image that shows its surroundings at a larger scale. No other large crystals are evident, even at great distances, meaning that there are only a few of them for every thousand or tens of thousands of standard-sized nanoparticles.
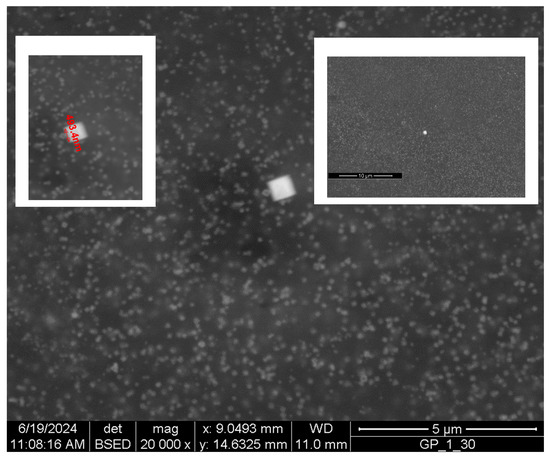
Figure 14.
SEM image of a nanocrystal and its immediate surroundings.
This larger particle resembles, although its chemical–physical origin is very different, what is sometimes observed in sintered materials in the case of exaggerated grain growth [47,48]. In this case, some grains become tens or hundreds of times larger than the average size of the others, and this behavior is normally associated with an extremely high-growth kinetics, which in turn is due to the presence of liquid or mobile phases in the microstructure of these sintered bodies. It is difficult to offer an explanation regarding the origin of this nanocrystal inside the gel matrix; however, it seems plausible that, also in this case, the growth kinetics was much greater than that of the other particles, which in accordance with their narrow size distribution curve. The kinetics of formation of these particles must be very constant and they all appear at the same time; otherwise, the distribution curve would be wider and, next to a few large ones, there would be other very small ones. The largest particles would be the first to have formed and, therefore, would have had more available time to grow.
On the contrary, this crystal seems to be the only one much larger than average, and this means that it formed with a higher growth kinetics than the other particles. There may be a few explanations for this behavior. For instance, this is due to an initial fluctuation in the concentrations of reagent solutions, or some residues of the substances used to make polymerization and gelation occur could have had a catalytic action for growth, acting as a heterogeneous nucleation center. Another possibility is that this is due to some local defect of the gel at the microscopic scale, such as, for example, a region where, for random reasons, the cross-linking is lower than its average value. The crystal, thus, would have formed in an area with more free space available.
It has an almost perfect square shape. The same reasoning proposed previously can be extended to it: What is observed is the planar section of a three-dimensional object. It could therefore be cubic if observed face on, or it could be octahedral if observed with one vertex towards the line of sight. The second possibility seems more correct because the square looks to be formed by four triangles joined at the center. The morphology of this crystal is not different from that of the smaller particles, and this suggests that their shape depends on the fact that they form inside a gel matrix and not freely in a liquid medium. The interactions between the growing particles and the matrix must therefore play a very important role.
Figure 15 shows the typical appearance of particles formed at 5 °C in 24 h (A), at 50 °C (B), and that of particles formed at the same time at 70 °C (C).
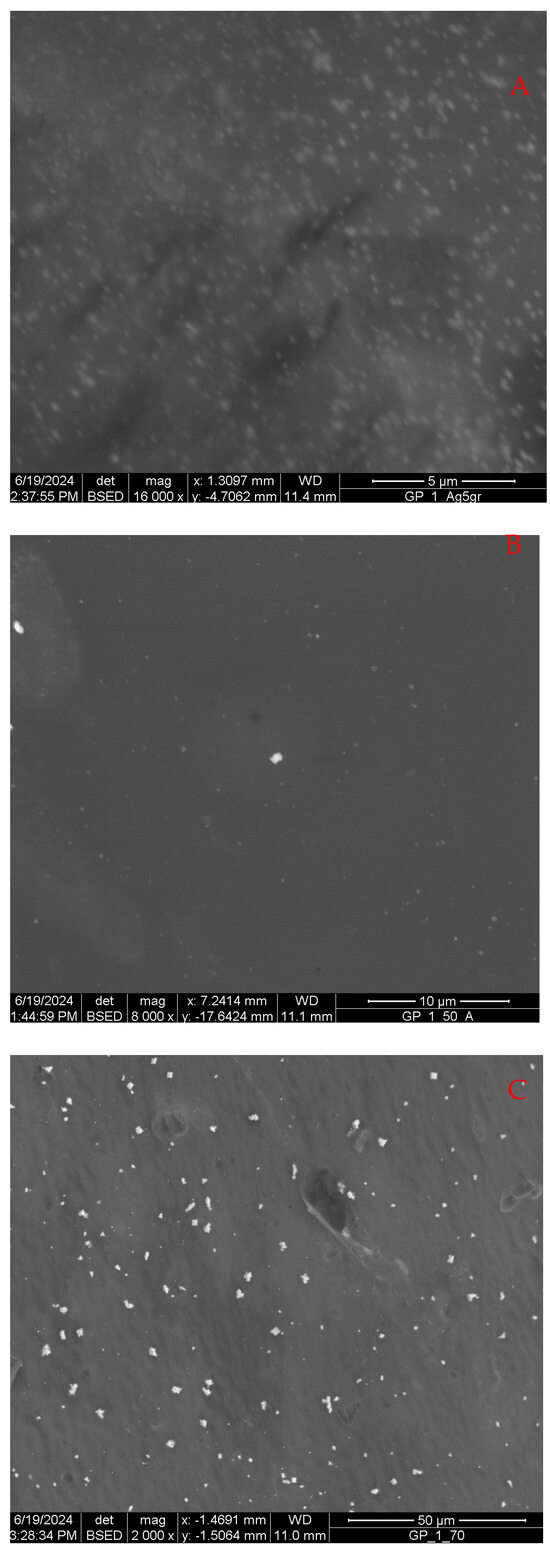
Figure 15.
SEM images of Ag-loaded samples, prepared at 5 °C (A), 50 °C (B), and 70 °C (C).
All samples are still very homogeneous, in the sense that they also show a uniform distribution of similar particles without any particular and evident spatial gradients, but they are also quite different from each other. The samples prepared at the two lowest temperatures are very similar to each other, while the one made at 70 °C is mainly made up of a few large particles, some of which are larger than 200 nm. At this temperature, most of the particles have an octahedral shape; however, other particles with an irregular appearance are also present. It seems that these particles are an aggregation of other smaller ones. At this temperature, moreover, the particle distribution curve is somewhat broader than that at lower temperatures. In all the cases, some agglomerates of particles are present, approximately with the same frequency. This seems to confirm that they form where the gel tissue presents irregularities or defects. In the sample prepared at 5 °C, very large nanocrystals were not detected, which instead become more frequent at 50 °C and common in the sample prepared at 70 °C, meaning that their presence depends on the temperature. The main difference between these samples is that, in the samples prepared below 30 °C, there are a very large number of particles around 80 nm, while in the one prepared at 70 °C, there are few particles, all much larger. The sample prepared at 50 °C appears to be intermediate between these two situations and in this case two distinct populations of nanoparticles coexist. Here, small-sized nanoparticles are present and are the most abundant group, although they are not as common as at lower temperatures, while many larger-sized particles appear, but not as common as at 70 °C. It is interesting to note that there are virtually no particles of intermediate size between these two populations, and this suggests that it is very likely that the larger particles are not formed as a result of evolution and growth from small ones due to ripening or coarsening phenomena, but rather that both groups are formed independently at the beginning of the reaction and that, once formed, the particles do not change either shape or size. The decrease in the number of particles as the temperature increases is consistent with the increase in their average size, because it must be kept in mind that the initial amount of available silver was the same in all samples. In fact, one can imagine that a few large particles have a total mass equal to that of numerous small particles and, therefore, the number of particles and their size are inversely proportional.
4. Discussion
The alginate–polyacrylamide hybrid gel is an interesting material with attractive applications, especially in the biomedical field [20,21]. It can be prepared with an easily controllable chemical reaction that leads to a very homogeneous and uniform material. It is also a valid matrix for the growth of nanoparticles, pointing the way to potentially even superior composite materials.
The formation of nanoparticles occurs in several steps. Initially, the gel must absorb the silver nitrate solution, and it must spread evenly throughout the volume. A time of 24 h seems to be sufficient time for this purpose. Once the gel is placed in contact with the sodium borohydride solution, particle formation occurs virtually instantaneously, as it could be expected from a REDOX reaction, and there is no subsequent evolution of the particles. In other words, the particles form almost instantly as the sodium borohydride solution diffuses toward the center of the gel sample and, once they are formed, they do not change further. This is also important because sodium borohydride can decompose spontaneously at temperatures above room temperature, and if the oxidation–reduction reaction was slow at high temperatures, no particle would form at all.
Moreover, if this process was slow and the growth nuclei appeared at different times, particles of different sizes and possibly also different shapes would be observed. This is in contrast with microstructural observations, which instead show, at any temperature, particles that are very homogeneous in size. The temperature is anyway an important parameter for the growth, since the higher the temperature, the larger the particles that form.
For all samples, once the conditions are fixed, the particles normally have a rather constant size, except in the case of the sample prepared at 50 °C, for which two distinct groups of particles appear to be present. The smaller ones are comparable or slightly larger in size than the particles observed in the samples prepared at lower temperatures, while the group of larger particles is rather similar to that found in the sample prepared at 70 °C. There are no particles with sizes between these two types. This also seems to exclude that the larger particles derive from the smaller ones, for example, through a dissolution–recrystallization process or other kind of ripening or coarsening mechanism. On the contrary, the size of the particles is controlled by the interactions they have with the gel matrix.
Compared to free formation in an aqueous environment, in this case, growth occurs within a matrix, and the individual meshes of the gel network can be imagined as acting as microreactors. This is an important factor in the driving force that determines the appearance and size of the nanoparticles. When a nanoparticle forms under these conditions, it exerts a force against the polymer structure of the gel, forcing it to expand, allowing it to be accommodated. The temperature has the effect of stretching the chains of a polymeric material, increasing the radius of the random coils in non-cross-linked polymers and the width of the meshes in cross-linked ones [49,50,51,52]. In this sense, the volume of the microreactor becomes larger, and there is more space available for the nanoparticle to grow, so that it can become larger in agreement with the experimental observations.
Likely, the particles form inside the gel mesh and can grow until they consume all the locally available parent reagents. Once they are finished, they stop growing further and are not subject to further evolution. This would imply that the larger the available volume, i.e., the larger the mesh volume, the larger the final size of the particle. In turn, the available volume between the chains of a gel depends on the number of cross-linking points, but also on external factors, such as temperature.
Often, depending on the nature of the polymeric material, this effect is not simply linear, but there is a temperature above which the stretching and expansion effect becomes more noticeable. For this specific gel, this temperature could be around 50 °C at which larger particles begin to appear in greater numbers. It could be imagined that, around 50 °C, locally, the gel chains begin to unfold.
This behavior could also provide an explanation for the presence of rare crystals that are much larger than average. They could form where, by chance, the gel structure is defective and with less cross-linking, therefore inside a microreactor with a larger volume available. Furthermore, diffusion coefficients also increase with the temperature, and this can allow for higher growth rates. The increased diffusion also plays an important role in their formation. They are practically absent in gels prepared below room temperature, but their number increases as it rises, and regardless of their origin, they grow more if the diffusion rate of silver is greater, that is, if the temperature increases.
Silver particles have, at all temperatures, an octahedral shape, which is evidently the most favorable, although it can be complex to offer an explanation. In fact, the equilibrium shape of nanoparticles and nanocrystals is the result of the combination of several factors, including the surface energy of the crystal faces, their growth rate, the type of crystal lattice of that material, the rate of diffusion of atoms or molecules through the growth medium, and interactions with this medium. Nanoparticles assume the shape that optimizes all these factors.
Although the interactions between nanoparticles and the alginate gel are favorable due to the electrostatic forces among the polar groups present on polymeric chains and the surface of silver, as proven by thermal analyses showing the slightly greater stability of the loaded gel, at the initial stage, their formation represents a perturbation of the mechanical equilibrium of the gel. It, therefore, seems plausible that the favored shape of the particles is the one that minimizes this perturbation, that is, the one that has a small total surface area for a given volume. Based on simple geometric considerations, the octahedron is a polyhedron that, for a given volume, has a relatively small total surface area, smaller than that of the tetrahedron or cube and many other solids, such as rods, needles, or plates. Furthermore, it should also be considered that silver crystallizes in an FCC lattice and that, therefore, the octahedral faces have Miller indices [1 1 1], have a large surface atomic density, and are close-packed. These aspects together seem to indicate that the octahedral shape is the energetically favorable one.
5. Conclusions
An alginate–polyacrylamide hybrid hydrogel was prepared by a radical reaction and subsequently loaded with silver nanoparticles. This gel holds great promise for biomedical applications due to its remarkable properties [53].
There are some interesting reviews and general articles about this subject [54,55]. In particular, among the possible applications, the notable antibacterial activity of the loaded gels must certainly be highlighted [10,56,57].
In the present study, silver nanoparticles were dispersed in alginate gels that were prepared in two steps by a controlled oxidation–reduction reaction using sodium borohydride as the reducing agent at different temperatures in the range between 5 ° and 70 °C. In the first step, a silver nitrate solution was allowed to be absorbed by the gel and, once it had spread uniformly, in the second step, the gel was immersed in the reducing solution.
This process proved to be very effective, and many particles were formed inside the gel matrix.
They have, at each temperature, a very narrow size distribution curve. When increasing the temperature, their number decreases, while their average size increases. This is consistent with the fact that the amount of total silver available was the same in all samples.
All nanoparticles are octahedral, regardless of the temperature at which the formation process occurred, meaning that this is the most favorable morphology.
While the average particle size is around 100–120 nm, a few very large nanocrystals, of about 0.5 microns in size, are also present. They are practically absent at the lowest temperature and very rare at room temperature, becoming more common at 70 °C.
Author Contributions
Conceptualization, A.U.; methodology, S.C. and A.U.; validation, C.C.; investigation, S.C., C.C., V.C., A.S. and C.M.C.; writing—original draft preparation, S.C. and A.U.; writing—review and editing, S.C. and A.U. All authors have read and agreed to the published version of the manuscript.
Funding
This research was funded by the National Recovery and Resilience Plan (Piano 494 Nazionale di Ripresa e Resilienza—PNRR-I.3.3, DM 117-2023) ID: 8959, as a part of the European 495; by recovery programme NextGenerationEU (NGEU) and by regional project LINC-ER, funded by “Regione Emilia-Romagna”, DGR N. 545/2019 Theranosti Centre srl.
Data Availability Statement
The original contributions presented in this study are included in the article. Further inquiries can be directed to the corresponding author.
Acknowledgments
The authors would like to greatly thank Roberta Guzzinati and Stefania Casu for their help in performing the experiments, particularly for the spectroscopic part.
Conflicts of Interest
The authors declare no conflicts of interest.
References
- Metta, S.; Khan, M.A.; Lakshmi, M.; Poojadevi, P.; Shruthi, K. A Review: Pharmaceutical Gels and Their Types with a Prominent Role in Drug Delivery Systems. Int. J. Curr. Pharm. Res. 2023, 10, 686–701. [Google Scholar]
- Pinto, T.C.; Martins, A.J.; Pastrana, L.; Pereira, M.C.; Cerqueira, M.A. Oleogel-Based Systems for the Delivery of Bioactive Compounds in Foods. Gels 2021, 7, 86. [Google Scholar] [CrossRef] [PubMed]
- Ma, J.; Zhong, J.; Sun, F.; Liu, B.; Peng, Z.; Lian, J.; Wu, X.; Li, L.; Hao, M.; Zhang, T. Hydrogel sensors for biomedical electronics. Chem. Eng. J. 2024, 481, 148317. [Google Scholar] [CrossRef]
- Zhen, H.; Zhang, J. Rapid-Responsive Hydrogel Actuators with Hierarchical Structures: Strategies and Applications. ACS Appl. Polym. Mater. 2023, 5, 4605. [Google Scholar] [CrossRef]
- Liu, B.; Chen, K. Advances in Hydrogel-Based Drug Delivery Systems. Gels 2024, 10, 262. [Google Scholar] [CrossRef] [PubMed]
- Olteanu, G.; Neacșu, S.M.; Joița, F.A.; Musuc, A.M.; Lupu, E.C.; Ioniță-Mîndrican, C.B.; Lupuliasa, D.; Mititelu, M. Advancements in Regenerative Hydrogels in Skin Wound Treatment: A Comprehensive Review. Int. J. Mol. Sci. 2024, 25, 3849. [Google Scholar] [CrossRef]
- Li, P.; Hu, J.; Wang, J.; Zhang, J.; Wang, L.; Zhang, C. The Role of Hydrogel in Cardiac Repair and Regeneration for Myocardial Infarction: Recent Advances and Future Perspectives. Bioengineering 2023, 10, 165. [Google Scholar] [CrossRef] [PubMed]
- Nunes, D.; Andrade, S.; Ramalho, M.J.; Loureiro, J.A.; Pereira, M.C. Polymeric Nanoparticles-Loaded Hydrogels for Biomedical Applications: A Systematic Review on In Vivo Findings. Polymers 2022, 14, 1010. [Google Scholar] [CrossRef]
- Joudeh, N.; Linke, D. Nanoparticle Classification, Physicochemical Properties, Characterization, and Applications: A Comprehensive Review for Biologists. J. Nanobiotechnol. 2022, 20, 262. [Google Scholar] [CrossRef] [PubMed]
- Aldakheel, F.M.; Sayed, M.M.E.; Mohsen, D.; Fagir, M.H.; El Dein, D.K. Green Synthesis of Silver Nanoparticles Loaded Hydrogel for Wound Healing; Systematic Review. Gels 2023, 9, 530. [Google Scholar] [CrossRef] [PubMed]
- Dai, T.; He, W.; Yao, C.; Ma, X.; Ren, W.; Mai, Y.; Wu, A. Applications of inorganic nanoparticles in the diagnosis and therapy of atherosclerosis. Biomater. Sci. 2020, 8, 3784. [Google Scholar] [CrossRef]
- Zhang, N.; Xiong, G.; Liu, Z. Toxicity of Metal-Based Nanoparticles: Challenges in the Nano Era. Front. Bioeng. Biotechnol. 2022, 10, 1001572. [Google Scholar] [CrossRef] [PubMed]
- Sharma, N.; Kurmi, B.D.; Singh, D.; Mehan, S.; Khanna, K.; Karwasra, R.; Kakkar, D. Nanoparticles Toxicity: An Overview of Its Mechanism and Plausible Mitigation Strategies. J. Drug Target. 2024, 32, 457–469. [Google Scholar] [CrossRef] [PubMed]
- Jiang, Y.; Krishnan, N.; Heo, J.; Fang, R.H.; Zhang, L. Nanoparticle–Hydrogel Superstructures for Biomedical Applications. J. Control. Release 2020, 324, 505–521. [Google Scholar] [CrossRef] [PubMed]
- Nam, N.H.; Luong, N.H. Nanoparticles: Synthesis and Applications. In Materials for Biomedical Engineering; Elsevier: Amsterdam, The Netherlands, 2019; pp. 211–240. [Google Scholar] [CrossRef]
- Altammar, K.A. A Review on Nanoparticles: Characteristics, Synthesis, Applications, and Challenges. Front. Microbiol. 2023, 14, 1155622. [Google Scholar] [CrossRef]
- Szczyglewska, P.; Feliczak-Guzik, A.; Nowak, I. Nanotechnology–General Aspects: A Chemical Reduction Approach to the Synthesis of Nanoparticles. Molecules 2023, 28, 4932. [Google Scholar] [CrossRef] [PubMed]
- Karchoubi, F.; Ghotli, R.A.; Pahlevani, H.; Salehi, M.B. New Insights into Nanocomposite Hydrogels: A Review on Recent Advances in Characteristics and Applications. Adv. Ind. Eng. Polym. Res. 2024, 7, 54–78. [Google Scholar] [CrossRef]
- Rana, M.M.; De la Hoz Siegler, H. Evolution of Hybrid Hydrogels: Next-Generation Biomaterials for Drug Delivery and Tissue Engineering. Gels 2024, 10, 216. [Google Scholar] [CrossRef]
- Cai, M.-H.; Chen, X.-Y.; Fu, L.-Q.; Du, W.-L.; Yang, X.; Mou, X.-Z.; Hu, P.-Y. Design and Development of Hybrid Hydrogels for Biomedical Applications: Recent Trends in Anticancer Drug Delivery and Tissue Engineering. Front. Bioeng. Biotechnol. 2021, 9, 630943. [Google Scholar] [CrossRef]
- Palmese, L.L.; Kumar Thapa, R.; OSullivan, M.; Kiick, K.L. Hybrid hydrogels for biomedical applications. Curr. Opin. Chem. Eng. 2019, 24, 143–157. [Google Scholar] [CrossRef]
- Wang, B.; Wan, Y.; Zheng, Y.; Lee, X.; Liu, T.; Yu, Z.; Gao, B. Alginate-Based Composites for Environmental Applications: A Critical Review. Crit. Rev. Environ. Sci. Technol. 2018, 49, 318–356. [Google Scholar] [CrossRef]
- Wang, L.; Shelton, R.M.; Cooper, P.R.; Lawson, M.; Triffitt, J.T.; Barralet, J.E. Evaluation of Sodium Alginate for Bone Marrow Cell Tissue Engineering. Biomaterials 2003, 24, 3475–3481. [Google Scholar] [CrossRef]
- Hou, Y.; Ma, S.; Hao, J.; Lin, C.; Zhao, J.; Sui, X. Construction and Ion Transport-Related Applications of the Hydrogel-Based Membrane with 3D Nanochannels. Polymers 2022, 14, 4037. [Google Scholar] [CrossRef] [PubMed]
- Patel, G.M.; Patel, C.P.; Trivedi, H.C. Ceric-Induced Grafting of Methyl Acrylate onto Sodium Salt of Partially Carboxymethylated Sodium Alginate. Eur. Polym. J. 1999, 35, 201–208. [Google Scholar] [CrossRef]
- Fajardo, A.; Silva, M.; Lopes, L.C.; Piai, J.; Rubira, A.; Muniz, E. Hydrogel Based on an Alginate–Ca2+/Chondroitin Sulfate Matrix as a Potential Colon-Specific Drug Delivery System. RSC Adv. 2012, 2, 11095–11103. [Google Scholar] [CrossRef]
- Liu, Q.; Li, Q.; Xu, S.; Zheng, Q.; Cao, X. Preparation and Properties of 3D Printed Alginate–Chitosan Polyion Complex Hydrogels for Tissue Engineering. Polymers 2018, 10, 664. [Google Scholar] [CrossRef] [PubMed]
- Pereira, L.; Sousa, A.; Coelho, H.; Amado, A.M.; Ribeiro-Claro, P.J.A. Use of FTIR, FT-Raman and 13C-NMR Spectroscopy for Identification of Some Seaweed Phycocolloids. Biomol. Eng. 2003, 20, 223–228. [Google Scholar] [CrossRef]
- Zhang, K.; Peschel, D.; Helm, J.; Groth, T.; Fischer, S. FT Raman Investigation of Novel Chitosan Sulfates Exhibiting Osteogenic Capacity. Carbohydr. Polym. 2011, 83, 60–65. [Google Scholar] [CrossRef]
- Bertelà, F.; Bellingeri, A.; Burratti, L.; Prosposito, P.; Di Vona, M.L.; Sgreccia, E.; Corsi, I.; Marsotto, M.; Iucci, G.; Battocchio, C.; et al. Hydrophilic silver nanoparticles for the treatment of water polluted by heavy metals. J. Phys. Conf. Ser. 2023, 2579, 012002. [Google Scholar] [CrossRef]
- Maharjan, S.; Liao, K.-S.; Wang, A.J.; Zhu, Z.; McElhenny, B.P.; Bao, J.; Curran, S.A. Sol-gel synthesis of stabilized silver nanoparticles in an organosiloxane matrix and its optical nonlinearity. Chem. Phys. 2020, 532, 110610. [Google Scholar] [CrossRef]
- Osorio-Echavarría, J.; Osorio-Echavarría, J.; Ossa-Orozco, C.P.; Natalia Andrea Gómez-Vanega, N.A. Synthesis of silver nanoparticles using white-rot fungus Anamorphous Bjerkandera sp. R1: Influence of silver nitrate concentration and fungus growth time. Sci. Rep. 2021, 11, 3842. [Google Scholar] [CrossRef] [PubMed]
- Mosier-Boss, P.A.; Becker, C.A.; Anderson, G.W.; Wiedemeier, B.J. Feasibility Studies of the NaBH4/H2O Hydrolysis to Generate Hydrogen Gas to Inflate Lighter than Air (LTA) Vehicles. Ind. Eng. Chem. Res. 2015, 54, 7706. [Google Scholar] [CrossRef]
- Minkina, V.G.; Shabunya, S.I.; Kalinin, V.I.; Martynenko, V.V.; Smirnova, A.L. Stability of alkaline aqueous solutions of sodium borohydride. Int. J. Hydrogen Energy 2012, 37, 3313. [Google Scholar] [CrossRef]
- àGontijo, L.A.P.; Raphael, E.; Ferrari, D.P.S.; Ferrari, J.L.; Lyon, J.P.; Schiavon, M.A. pH effect on the synthesis of different size silver nanoparticles evaluated by DLS and their size-dependent antimicrobial activity. Matéria 2020, 25, e-12845. [Google Scholar] [CrossRef]
- Riaz, S.; Ashraf, M.; Hussain, T.; Hussain, M.T.; Rehman, A.; Javid, A.; Iqbal, K.; Basit, A.; Aziz, H. Functional Finishing and Coloration of Textiles with Nanomaterials. Color. Technol. 2018, 134, 327–346. [Google Scholar] [CrossRef]
- Prosposito, P.; Burratti, L.; Venditti, I. Silver Nanoparticles as Colorimetric Sensors for Water Pollutants. Chemosensors 2020, 8, 26. [Google Scholar] [CrossRef]
- Arif, M.; Raza, H.; Akhter, T. UV-Vis spectroscopy in the characterization and applications of smart microgels and metal nanoparticle-decorated smart microgels: A critical review. RSC Adv. 2024, 14, 38120. [Google Scholar] [CrossRef] [PubMed]
- Oyarzún, M.P.; Tapia-Arellano, A.; Cabrera, P.; Jara-Guajardo, P.; Kogan, M.J. Plasmonic Nanoparticles as Optical Sensing Probes for the Detection of Alzheimer’s Disease. Sensors 2021, 21, 2067. [Google Scholar] [CrossRef]
- Singh, A.; Jha, S.; Srivastava, G.; Sarkar, P.; Gogoi, P. Silver Nanoparticles As Fluorescent Probes: New Approach For Bioimaging. Int. J. Sci. Technol. Res. 2013, 2, 153. [Google Scholar]
- Reddy, P.R.S.; Rao, K.M.; Rao, K.S.V.K.; Subha, M.C.S. Synthesis of Alginate-Based Silver Nanocomposite Hydrogels for Biomedical Applications. Macromol. Res. 2014, 22, 832–842. [Google Scholar] [CrossRef]
- Cha, H.-R.; Kim, Y.; Joo, W.H.; Lee, Y. Fabrication of Amino Acid-Based Silver Nanocomposite Hydrogels from PVA-Poly(Acrylamide-co-Acryloyl Phenylalanine) and Their Antimicrobial Studies. Bull. Korean Chem. Soc. 2012, 33, 3191–3195. [Google Scholar] [CrossRef]
- Xu, R.; Wang, D.; Zhang, J.; Li, Y. Shape-Dependent Catalytic Activity of Silver Nanoparticles for the Oxidation of Styrene. Chem. Asian J. 2006, 1, 888–893. [Google Scholar] [CrossRef]
- González, A.L.; Noguez, C.; Beránek, J.; Barnard, A.S. Size, Shape, Stability, and Color of Plasmonic Silver Nanoparticles. J. Phys. Chem. C 2014, 118, 9128–9136. [Google Scholar] [CrossRef]
- Loiseau, A.; Asila, V.; Boitel-Aullen, G.; Lam, M.; Salmain, M.; Boujday, S. Silver-Based Plasmonic Nanoparticles for and Their Use in Biosensing. Biosensors 2019, 9, 78. [Google Scholar] [CrossRef] [PubMed]
- Zielinska, A.; Skwarek, E.; Zaleska, A.; Gazda, M.; Hupka, J. Preparation of Silver Nanoparticles with Controlled Particle Size. Procedia Chem. 2009, 1, 1560–1566. [Google Scholar] [CrossRef]
- Dennis, J.; Bate, P.S.; Humphreys, F.J. Abnormal Grain Growth in Al–3.5Cu. Acta Mater. 2009, 57, 4539–4547. [Google Scholar] [CrossRef]
- Mohapatra, S.; Prasad, R.; Jain, J. Temperature Dependence of Abnormal Grain Growth in Pure Magnesium. Mater. Lett. 2021, 283, 128851. [Google Scholar] [CrossRef]
- Martini, A.; Ramasamy, U.S.; Len, M. Review of Viscosity Modifier Lubricant Additives. Tribol. Lett. 2018, 66, 58. [Google Scholar] [CrossRef]
- Smith, L.J.; Fiebig, K.M.; Schwalbe, H.; Dobson, C.M. The Concept of a Random Coil: Residual Structure in Peptides and Denatured Proteins. Fold. Des. 1996, 1, R95–R106. [Google Scholar] [CrossRef] [PubMed]
- Huang, E.; Tan, Z.-J. Modeling Coil–Globule–Helix Transition in Polymers by Self-Interacting Random Walks. Polymers 2023, 15, 3688. [Google Scholar] [CrossRef]
- Piguet, F.; Ouldali, H.; Discala, F.; Breton, M.-F.; Behrends, J.C.; Pelta, J.; Oukhaled, A. High Temperature Extends the Range of Size Discrimination of Nonionic Polymers by a Biological Nanopore. Sci. Rep. 2016, 6, 38675. [Google Scholar] [CrossRef] [PubMed]
- Vasile, C.; Pamfil, D.; Stoleru, E.; Baican, M. New Developments in Medical Applications of Hybrid Hydrogels Containing Natural Polymers. Molecules 2020, 25, 1539. [Google Scholar] [CrossRef] [PubMed]
- Chen, X.; Wu, T.; Bu, Y.; Yan, H.; Lin, Q. Fabrication and Biomedical Application of Alginate Composite Hydrogels in Bone Tissue Engineering: A Review. Int. J. Mol. Sci. 2024, 25, 7810. [Google Scholar] [CrossRef] [PubMed]
- Ren, Y.; Wang, Q.; Xu, W.; Yang, M.; Guo, W.; He, S.; Liu, W. Alginate-based hydrogels mediated biomedical applications: A review. Int. J. Biol. Macromol. 2024, 279, 135019. [Google Scholar] [CrossRef] [PubMed]
- Pangli, H.; Vatanpour, S.; Hortamani, S.; Jalili, R.; Ghahary, A. Incorporation of Silver Nanoparticles in Hydrogel Matrices for Controlling Wound Infection. J. Burn Care Res. 2021, 42, 785. [Google Scholar] [CrossRef] [PubMed]
- Huang, L.; Li, W.; Guo, M.; Huang, Z.; Chen, Y.; Dong, X.; Li, Y.; Zhu, L. Silver doped-silica nanoparticles reinforced poly (ethylene glycol) diacrylate/hyaluronic acid hydrogel dressings for synergistically accelerating bacterial-infected wound healing. Carbohydr. Polym. 2023, 304, 120450. [Google Scholar] [CrossRef]
Disclaimer/Publisher’s Note: The statements, opinions and data contained in all publications are solely those of the individual author(s) and contributor(s) and not of MDPI and/or the editor(s). MDPI and/or the editor(s) disclaim responsibility for any injury to people or property resulting from any ideas, methods, instructions or products referred to in the content. |
© 2025 by the authors. Licensee MDPI, Basel, Switzerland. This article is an open access article distributed under the terms and conditions of the Creative Commons Attribution (CC BY) license (https://creativecommons.org/licenses/by/4.0/).