Article

Structural Characterization of B-DNA d(CGTGAATTCACG)2 in Complex with the Specific Minor Groove Binding Fluorescent Marker Hoechst 33342

by
Hristina Sbirkova-Dimitrova
1,2,*,
Rusi Rusew
1,
Hristo Gerginov
1,
Annie Heroux
3 and
Boris L. Shivachev
1,*
1
Institute of Mineralogy and Crystallography “Acad. Ivan Kostov”, Bulgarian Academy of Sciences, Acad. G. Bonchev Str., Bl. 107, 1113 Sofia, Bulgaria
2
PERIMED-2, BG16RFPR002-1.014-0007, Central District, Vasil Aprilov Blvd. 15A, 4002 Plovdiv, Bulgaria
3
XRD2 Beamline, Elettra—Sincrotrone Trieste S.C.p.A., Basovizza, 34149 Trieste, Italy
*
Authors to whom correspondence should be addressed.
Crystals 2025, 15(1), 20; https://doi.org/10.3390/cryst15010020
Submission received: 6 December 2024 / Revised: 20 December 2024 / Accepted: 26 December 2024 / Published: 27 December 2024
(This article belongs to the Special Issue Nucleic Acid Crystallography Volume II)

Abstract

:
Recently, there have been numerous reports on the use of different fluorescent DNA stains for specific minor groove binding. The exploration of biological markers increases the safety of their use as diagnostic criteria. Single crystal analysis of DNA–ligand binding interactions is of essential importance to obtain the requirements for their usage in the pharmaceutical and medical industries. Dyes that bind to DNA, such as Hoechst 33342 or 4′,6-diamidino-2-phenylindole (DAPI), can be used not only for analytical use, but for medical purposes. DAPI and Hoechst 33342 are fluorescent dyes that bind to the minor groove of DNA, fluorescing brightly in the blue region with an emission maximum at approximately 461 nm when excited by ultraviolet light (~350 nm). This work focuses on the binding interactions of Hoechst 33342 with the specific DNA sequence d(CGTGAATTCACG)2. The structure of the complex was determined using single-crystal X-ray diffraction at a resolution of 1.9 Å in the space group P212121. The coordinates and structure factors are deposited in the RCSB Protein Data Bank (PDB) under entry 9FT8. The structure is nearly isomorphous with that of previously reported crystal structures of the oligonucleotide d(CGTGAATTCACG)2 alone (PDB ID: 5JU4) and with that in complexes with DAPI (5T4W). The adjustments in crystal interactions between the native DNA molecule and the DNA–DAPI complex are described. Hoechst 33342 selectively binded to the tight minor groove close to the midpoint of the B-DNA segment, adjacent to the A–T base pairs. It interacted with DNA through hydrogen bonding and van der Waals forces. The structural comparison revealed that Hoechst 33342 inserts itself in the minor groove in a strongly specific manner, displacing the ordered spine waters.

1. Introduction

Hoechst dyes are fluorescent stains that specifically bind to DNA. These dyes are bisbenzimidazole derivatives, classified as supravital stains, which bind to the minor groove of DNA with a preference for AT-rich regions [1,2]. Upon stimulation by ultraviolet light, they emit blue fluorescence. Hoechst dyes are commonly used for DNA staining in both fixed and living cells. Due to their remarkable affinity and specificity for DNA, these dyes act as targeting agents that can be linked to different molecules, enabling them to attach to DNA. These dyes deliver dependable and uniform results with low background interference. This makes them especially ideal for challenging applications such as super-resolution microscopy and live-cell imaging, where the precise and accurate visualization of DNA is of crucial importance.
The Hoechst dyes generally consist of Hoechst 33258, Hoechst 33342, and Hoechst 34580 [3]. Initially developed for the treatment of malaria and other protozoan diseases, these dyes proved to be ineffective as therapeutic agents. However, Latt (1973) [4] showed that these dyes could be of considerable value to the emerging field of flow cytometry. By applying the Hoechst dyes to cells in flow cytometry or fluorescence microscopy, scientists are able to detect and measure various stages of the cell cycle, including G1, S, and G2/M phases. This examination offers valuable insights into cell growth, the advancement of the cell cycle, and irregularities in the cell cycle. Nowadays, Hoechst dyes are indispensable tools in cellular and molecular biology
Stimulated by UV light, Hoechst dyes produce a wide range of blue light when they bind to DNA, and their fluorescence rises by about 30 times, providing a robust signal. This increase in fluorescence is due to decreased rotational relaxation and reduced hydration when they bind to DNA (ex/em 360/460 nm) [5]. Due to their emissions in the lower wavelengths, these stains are a strong candidate for use alongside various membrane stains and intracellular stains like Thiazole orange [6,7] and DAPI [8]. DNA staining helps scientists to visualize and measure DNA within cells and tissues and to thoroughly examine nuclear structure and chromatin arrangement. By examining DNA located in the nucleus, scientists can explore alterations in nuclear dimensions, form, and chromatin compaction, which are linked to different cellular activities and states.
Hoechst dyes do not intercalate, but rather bind selectively to the minor groove of DNA in areas rich in A–T sequences. This distinct binding method enables accurate and dependable DNA staining. Hoechst dyes are suitable for immunohistochemistry applications. Moreover, the attachment of Hoechst 33342 to DNA causes negligible cytotoxicity, safeguarding the survival of marked cells [5,9]. Hoechst 33342 is a dye characterized by the addition of an ethyl group, which increases its lipophilicity. This structural modification makes Hoechst 33342 significantly more cell-permeable than Hoechst 33258 and Hoechst 34580, allowing it to readily penetrate living cells [10]. As a result, it is the preferred choice for staining DNA in live-cell applications. It is the sole stain capable of accurately assessing DNA content [11]. In 1977, it was demonstrated that this dye could be utilized to analyze and categorize cells, and more significantly, it was proven that the dye did not harm the cells.
The focus of the present work was the co-crystallization of various DNA sequences with Hoechst 33342 and other fluorescent markers and ligands in order to compare their binding abilities. The use of reproducible crystallization conditions would greatly facilitate the process of preliminary analysis of the interactions of newly synthesized pharmaceuticals, biologically active substances, markers, etc. The attachment to DNA may lead to changes in conformation that could be triggered by non-covalent interactions, hydrophobic interactions, hydrogen bonding, weak van der Waals forces, etc. [12].

2. Materials and Methods

2.1. Materials

The dry oligonucleotide sequences were purchased from Eurofins MWG Genomics (Table 1). Hoechst 33342, DAPI, and all other markers and reagents used for the Fluorescent Intercalator Displacement (FID) analysis were purchased from Thermo Fisher Scientific, Sigma Aldrich (Merck), and Alfa Aesar and were used without further purification.

2.2. Fluorescent Intercalator Displacement (FID) Assay

For the fluorescence emission spectrum analysis of the DNA interaction [13,14], ethidium bromide (EtBr) and Hoechst 33342 were dissolved in water. The FID required the addition of EtBr to the preformed dsDNA, followed by the addition of Hoechst 33342 and the measurement of the displacement (change in intensity) signal. The excitation wavelength of the nonspecific fluorescent intercalator EtBr was 290 nm while the emission detection was set to 610 nm. The fluorescence was measured using 1-cm path length quartz minicells (0.35 mL). The dark counts (background) were subtracted, and the spectra were corrected for wavelength-dependent instrument sensitivity. Intensity spectra were collected using a Perkin Elmer LS50 (excitation and receiving slits set to 5 nm, and the integration time was 2.0 sec). The fluorescent experiments included three additional specific fluorescent dyes as a control: DAPI (excitation at 358 nm and emission at 461 nm) [15,16] and Berenil (excitation at 520 nm and emission at 600 nm) [17,18], both interacting with A–T domains, and Thiazole Orange (excitation at 470-488 nm and emission at 527 nm), interacting preferably with C–G domains [19,20].

2.3. Samples Crystallization

The crystallization screen for the macromolecules was based on MgCl2, Na/K cacodylate, spermine tetrachloride, MPD, H2O, vapor diffusion, and hanging drop [21] at RT (293K). The successful crystallization conditions contained sodium cacodylate (NaCaCo) (pH 6.9), alcohol (2-propanol or methylpentanediol (MPD)), cations (Mg2+, Ba2+), and polyamines (spermine). For the tested DNA sequences, the optimization of the crystallization conditions produced crystal growth only for the conditions featuring spermine. Dry (lyophilized) oligonucleotide sequences were dissolved to a 2 mM concentration and were annealed for 1 min at 75 °C before use in order to obtain double-stranded DNA (dsDNA). The crystallization conditions for the 12 bp DNA sequence (9FT8) consisted of 50 mM NaCaCo (pH 6.9), 20 mM MgCl2, 50% MPD, and 1.5 mM spermine. The ligand Hoechst 33342 (PDB ID HT1) was dissolved in the same solution to a concentration of 2 mM. Almost equivalent crystallization conditions were used for the same 12 bp DNA in our previous work, but with the addition of DAPI (5T4W) [22]. Crystals were grown by the “hanging drop” method by mixing 1.5 μL (2 mM) ligand and 1.5 μL DNA (2 mM) (3 μL total drop volume) at room temperature, equilibrated against 50% MPD reservoir. Crystallization plates were stored in temperature-controlled rooms (16–20 °C).

2.4. Single Crystal X-Ray Diffraction (SCXRD), Data Collection and Processing

Preliminary analysis on the diffracting power of the obtained macromolecular single crystals was performed on a Bruker D8 Venture diffractometer equipped with a IµS micro-focus sealed X-ray source (CuKα radiation, λ = 1.54056 Å) and a PHOTON II CPAD detector. After qualitative evaluation, the most prominent candidates were mounted on nylon loops, cooled in liquid nitrogen, and subsequently stored in a cryogenic dewar. Complete diffracting data were obtained on 1st August 2022 at Elettra Synchrotron Trieste with the XRD2 structural biology beamline using a MD2s Microdiffractometer and a Pilatus 6M detector. The beamline used a synchrotron light source produced by a superconducting wiggler. Wavelength (0.99Å) was selected using a cryogenically cooled dual-crystal Si monochromator. The beam was defined using a 100 μm aperture and further cleaned using a 200 μm capillary, while sample cooling was performed using an open-flow nitrogen cryostat at 100 K. Data processing was carried out using XDS [23] and XSCALE [24].

2.5. Macromolecules Structure Solution and Refinement

The phases were obtained by molecular replacement (MR) with Phaser [25,26]. Refinement of the structures involved several cycles of refinement using REFMAC5 [27] and Coot [28]. The ligand (XRB) was positioned from the FoFc difference map using the Coot interface. Visual analyses of the model and the electron-density maps were carried out using Coot. X3DNA [29] was used to carry out structural analysis and geometrical calculations of DNA parameters. USFC Chimera [30] and LigPlot+ [31] were used to prepare the figures. The coordinates and structure factors have been deposited in the Protein Data Bank (PDB) as entry 9FT8.

3. Results

We accomplished our aim to co-crystalize the DNA oligonucleotide d(CGTGAATTCACG)2 with Hoechst 33342 (HT1) to unveil the details of DAPI and HT1 DNA complex formation, including minor groove binding intercalation, displacing the ordered spine water.
Crystals with a good quality (0.1 × 0.05 × 0.05 mm3) suitable for single crystal X-ray analysis formed within two weeks (Figure 1). Efforts to collect single crystal data have been made for various crystals at Elettra Synchrotron Trieste on the MD2s beam line utilizing microdiffraction with an approximate spot size of 5 µm. It is important that the dataset that reached a resolution of 1.9 Å was from a crystal taken from the crystallization drop two weeks after it was first observed. Crystals of comparable or even larger dimensions that were allowed to “stabilize” for more than two weeks in the crystallization drop typically diffracted at resolutions up to 2.2 Å. Efforts to collect data using the Bruker D8 Venture diffractometer were also made on several crystals; however, the quality of the resulting diffraction data was not on par with that obtained from experiments at the Elettra Synchrotron.
The inclusion of Hoechst 33342 (HT1) in the crystallization conditions could have influenced the dynamics, growth, and formation of the crystal structures. The crystal structure of Hoechst 33342 complexes with the synthetic B-DNA oligonucleotide d(CGTGAATTCACG)2 has been determined through single crystal X-ray diffraction, achieving a resolution of 1.9 Å in the space group P212121. This structure closely resembles the previously documented crystal structure of the oligonucleotide d(CGTGAATTCACG)2 on its own. Table 2 provides the crystallographic data collection and refinement statistics parameters for 9FT8.

4. Discussion

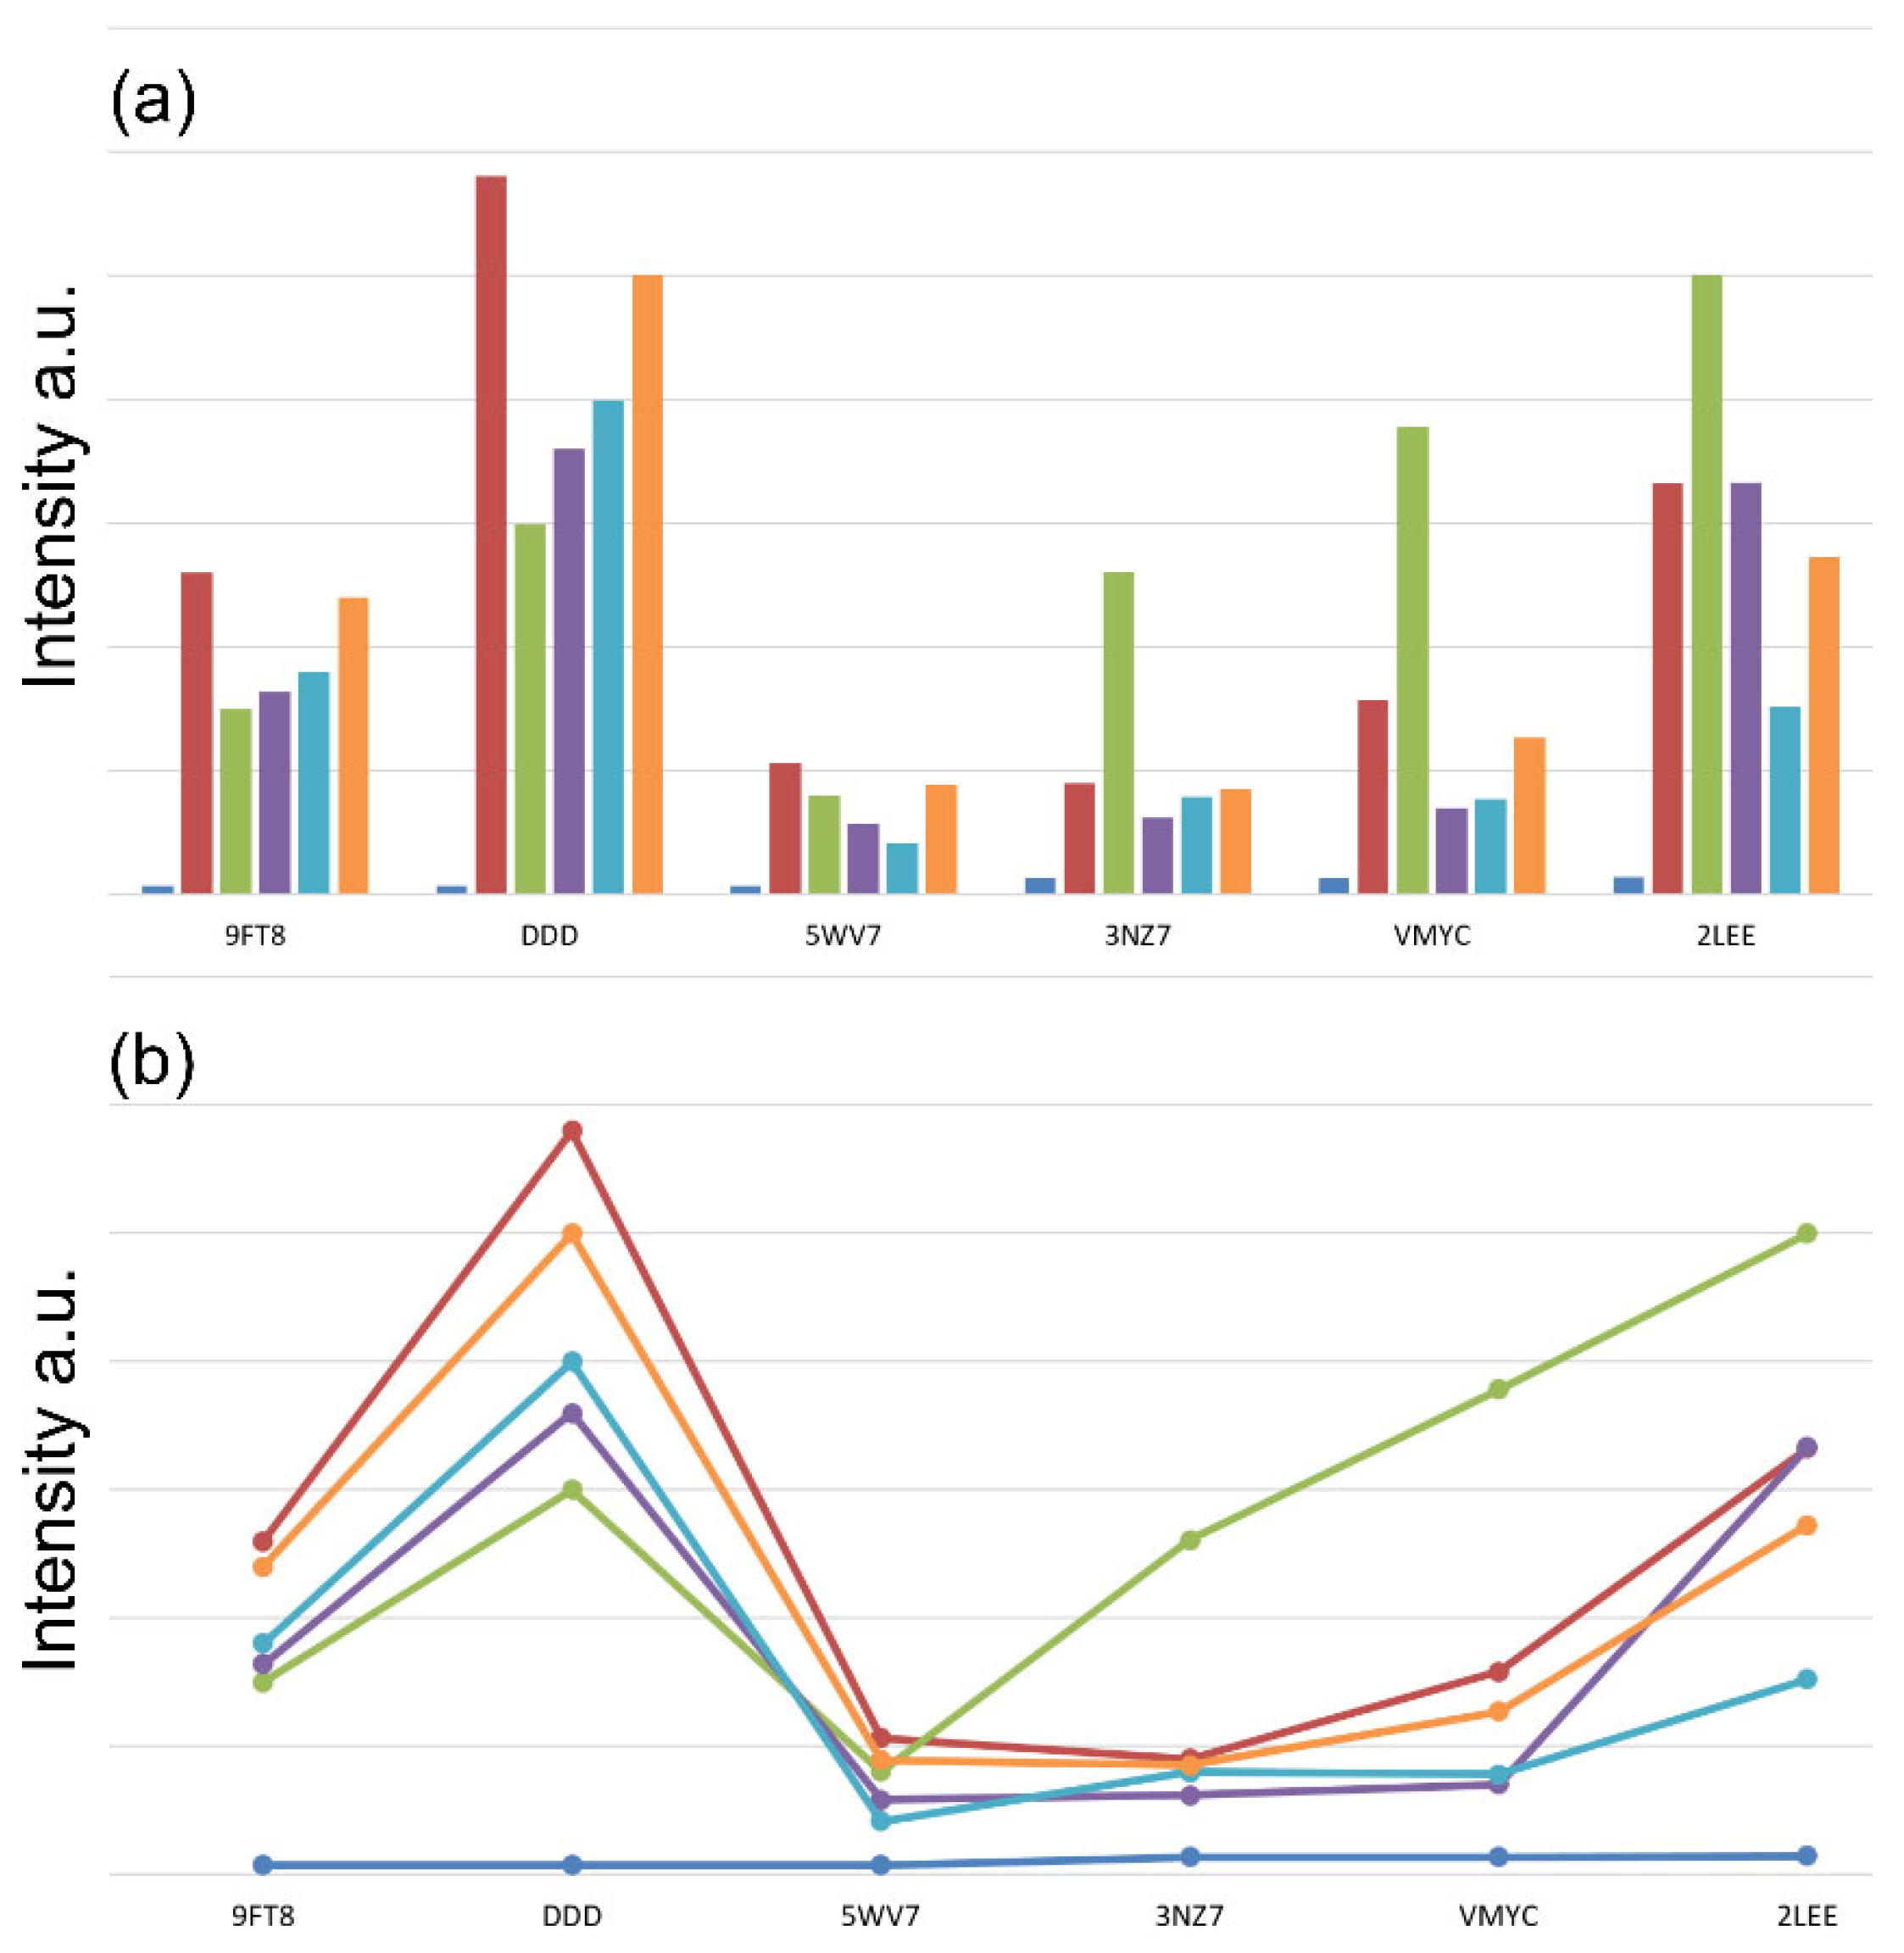
The fluorescent intercalator displacement approach was utilized to confirm the interaction between DNA and the ligand [13]. Fluorescence spectroscopy [32] is a potent nano-methodology that requires nanomolar amounts of DNA and is appropriate for analyzing the expected interaction. Therefore, to evaluate the interaction between DNA and the ligand, the FID assay was conducted. The FID measurements included a non-specific binding agent like EtBr, as well as a specific DNA ligand. The findings from the fluorescence experiments (Figure 2a) indicated that EtBr, acting as a nonspecific binder, led to a significant enhancement in fluorescence intensity [33] when compared to DNA on its own for all sequences examined (see Table 1 for any abbreviated sequences).
Upon adding HT1 into the solutions of 9FT8-EtBr, DDD-EtBr, and 5WV7-EtBr, the emission intensity values showed a decline. Likewise, variations in emission intensity due to differing degrees of interaction prominence were notable for the other ligands tested, including DAPI, Berenil, and TO, with the latter expectedly displaying the least reduction in intensity values. It appears that HT1, DAPI, and Berenil interact with DNA, diminishing the impact of the non-specific interaction of EtBr, which is characterized as a Fluorescent Intercalator Displacement. When HT1, DAPI, and Berenil were added to the solutions of 3NZ7-EtBr, VMYC-EtBr, and 2LEE-EtBr, their intensity values showed little to no change, or even an increase. In fact, the constructs 3NZ7 [34], VMYC, and 2LEE [35] are not self-complementary, unlike the other sequences. This likely influences the experimental conditions and also implies that the ligands assessed do not interact in the same way as ethidium bromide [36]. Hydrogen bonds, van der Waals forces, hydrophobic interactions, and electrostatic interactions are the four primary types of non-covalent interactions that significantly influence DNA–ligand interactions. When the intensity values show an increase, this may be attributed to the presence of ssDNA in the solutions or the manner in which the interaction occurs around the grooves [37,38].
Additional information that can be assessed from the FID experiment is the behavior of the two fluorescent markers HT1 and DAPI. It is seen from the intensity values (Figure 2b) that HT1 and DAPI interact in an analogous way with the different tested DNA sequences. It is evident that the interaction of HT1 appears to be stronger than that of DAPI, especially for the 9FT8 and DDD sequences.
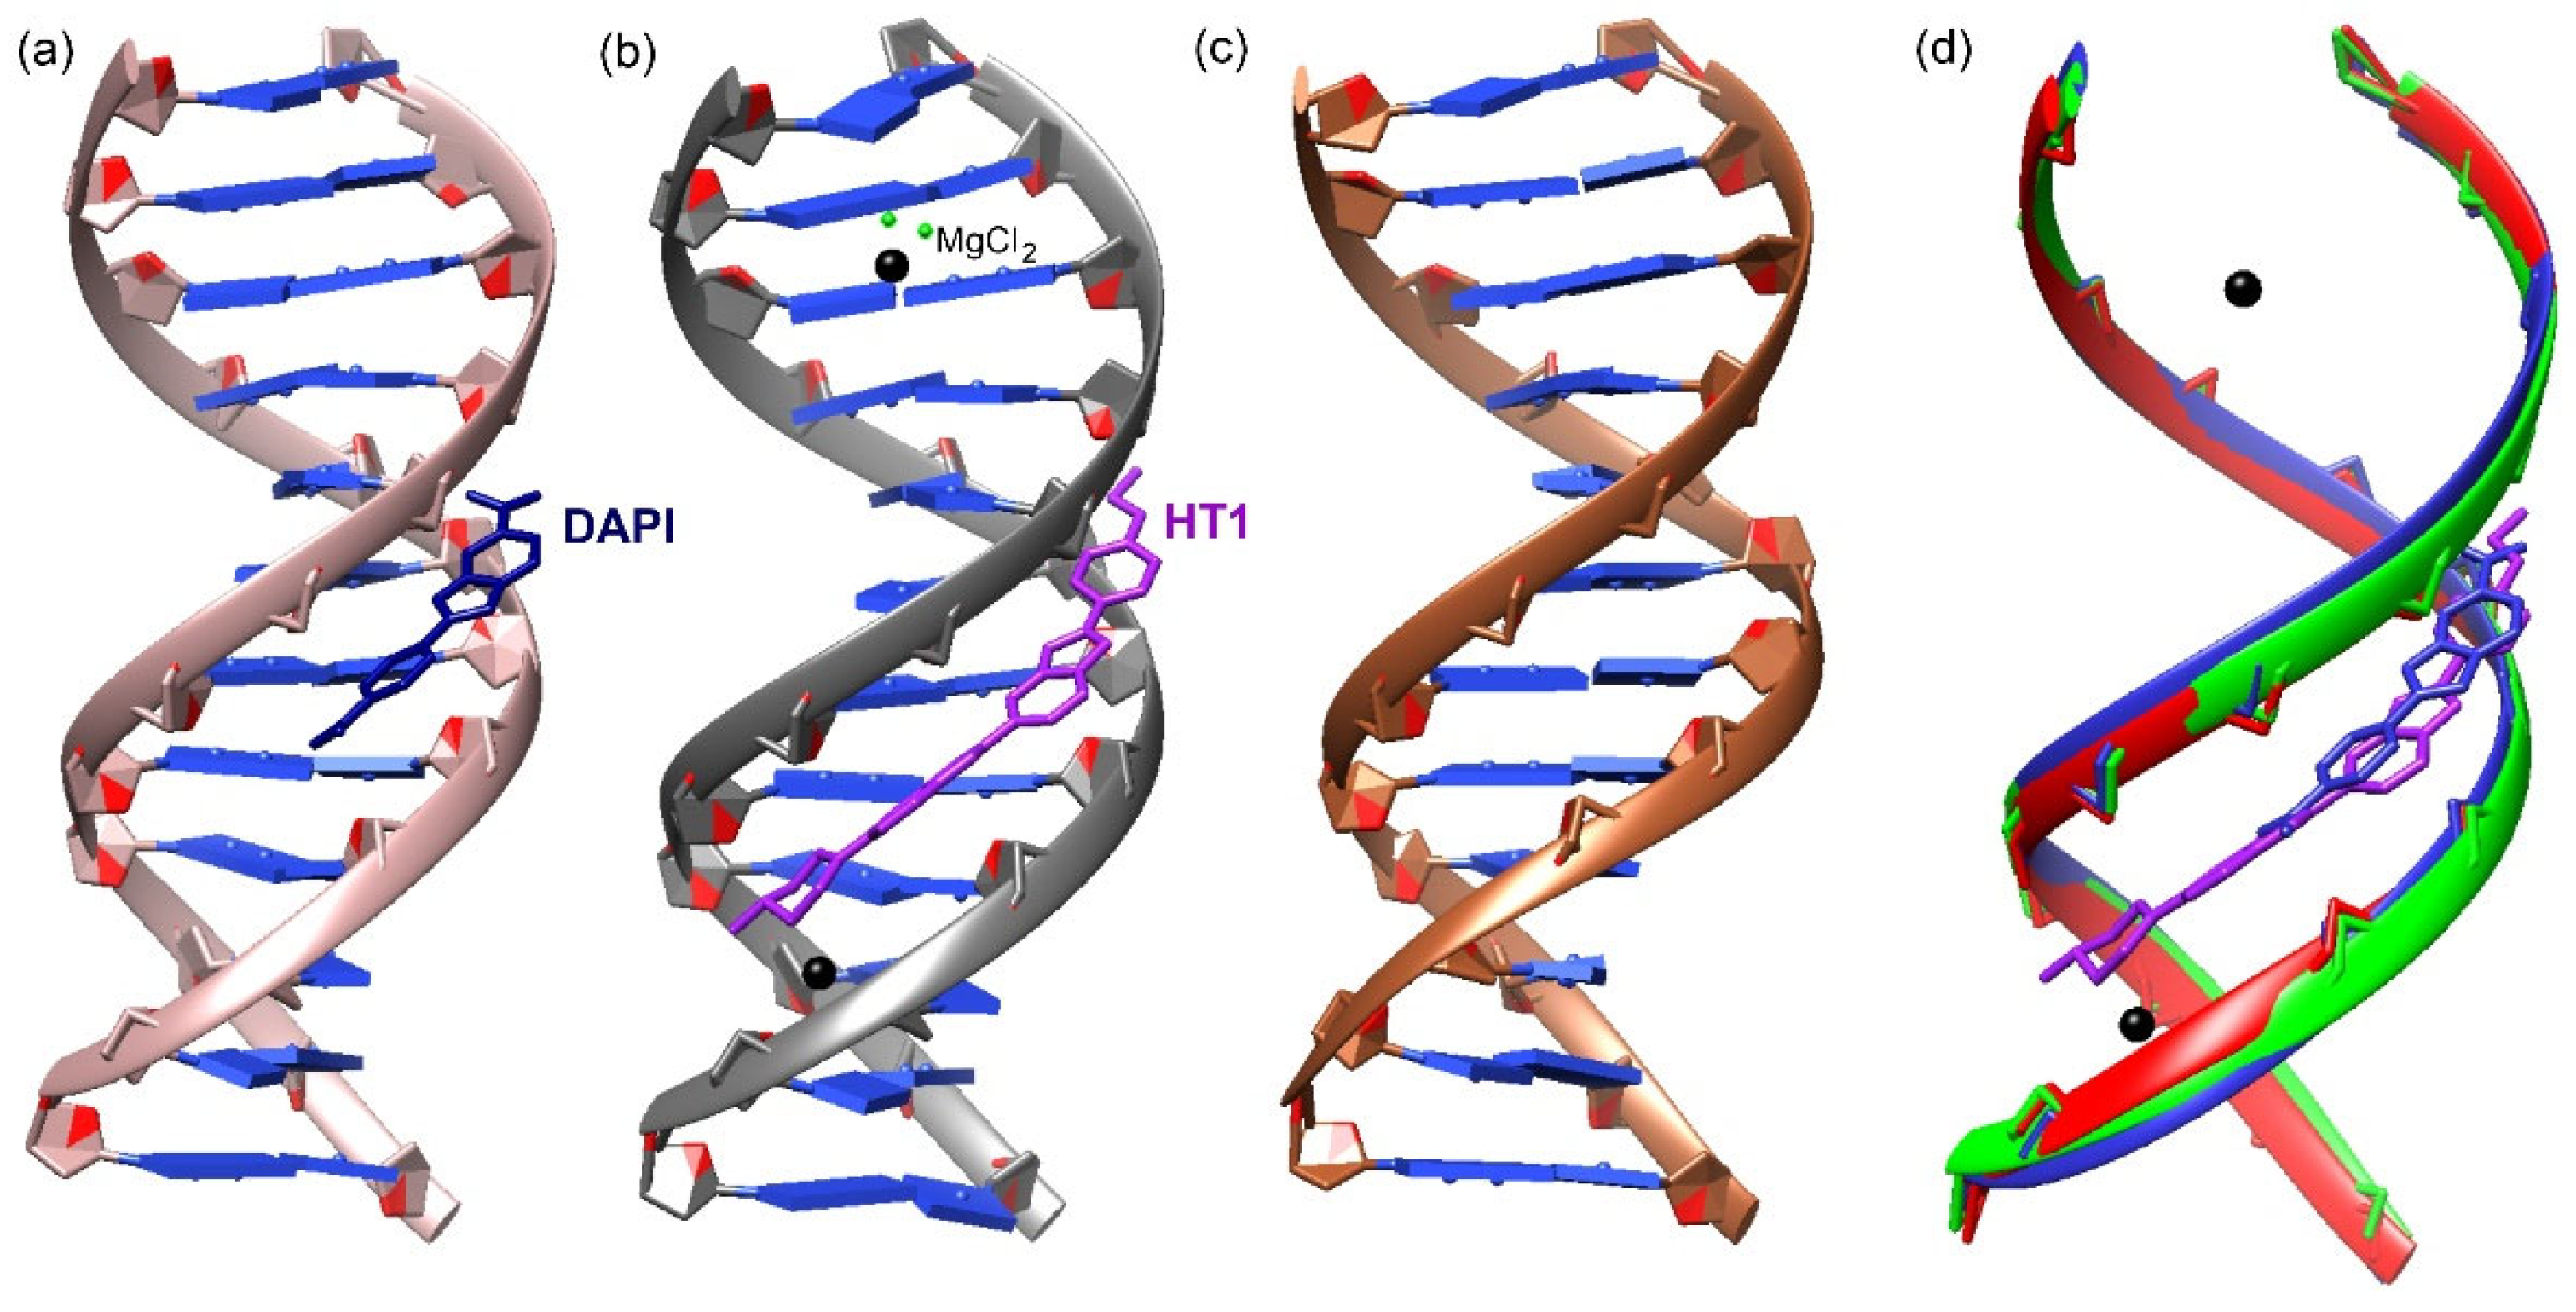
The asymmetric unit of PDB entry 9FT8 consists of two chemically equivalent self-complementary strands (each of 12 bases in length) forming an antiparallel B-type helix (Figure 3b). The hydrogen bond analysis of the double strand of d(CGTGAATTCACG)2 of 9FT8 confirms that the 9FT8 structure maintains the canonical Watson–Crick base pairing with localized distortions in certain AT-rich regions, potentially influenced by the binding of Hoechst 33342 in the minor groove (Table S1). These findings align with the expected properties of a B-DNA helix and highlight the specific adjustments induced by ligand interactions. The hydrogen bond interactions are essential for stabilizing the Watson–Crick base pairing and maintaining the overall B-DNA conformation. Hydrogen bonds conform to the expected canonical Watson–Crick base pairing scheme for all pairs. Strong (e.g., short) hydrogen bonds (2.7–3.0 Å) dominate and are indicative of stable interactions. C–G hydrogen bond lengths are consistent, ranging from 2.74 Å to 3.00 Å, reflecting strong guanine–cytosine interactions. As for A–T, some pairs (e.g., pair 6, A–T) show slightly elongated bonds (3.84 Å for N1---N3 and 3.14 Å for N6---O4), suggesting potential flexibility or minor distortions in these regions. Regarding pair 6 (A–T), the unusually long bond lengths (3.84 Å, 3.14 Å) may indicate localized structural adjustments, possibly due to ligand-induced distortions or dynamic effects. In pair 7 (T–A), moderate elongation was observed in one interaction (3.31 Å for O4---N6), suggesting flexibility in this region, though it remains within the range for stable hydrogen bonds.
In summary, the Hoechst 33342 ligand binds in the minor groove. It does not significantly disrupt hydrogen bonding between bases. Instead, minor adjustments in bond lengths (e.g., elongation in specific A–T pairs) may reflect localized groove deformation or water displacement.
The sequence d(CGTGAATTCACG)2, which was used for determining the current structure, consists of a dodecamer that crystallizes as B-type DNA and is recorded as 1D29 in PDB [39]. All the structures mentioned belong to the P212121 space group. The minor groove of the three structures exhibits characteristics of a double-stranded oligonucleotide with a central AT region flanked by C/G-rich areas. The overall secondary structures are similar for 9FT8, 1D29, and 5T4W (Figure 3d). The base-pair morphology values [40] for shear, stretch, stagger, buckle, opening, and propeller twist obtained using w3DNA [41] are shown in Table 3 and Table S2. Table 3 presents key structural features of base pairs in two DNA-ligand complexes: 9FT8 (Hoechst 33342-bound DNA) and 5T4W (DAPI-bound DNA). Both ligands bind in the minor groove but exhibit distinct effects on the DNA structure.
The comparison of the shear parameters for 9FT8 and 5T4W reveals that the values for 9FT8 were slightly higher in several pairs (e.g., Pair 1, C–G: 0.41 Å in 9FT8 vs. 0.05 Å in 5T4W). This indicates that Hoechst 33342 may induce greater lateral displacement of base pairs compared to DAPI. Stretch values were generally similar for both complexes, but localized differences exist (e.g., pair 5, A–T: 0 Å in 9FT8 vs. −0.38 Å in 5T4W). This suggests subtle ligand-specific effects on base pair separation along the short axis. Stagger differences were minor, with occasional variability (e.g., pair 2, G–C: −0.18 Å in 9FT8 vs. 0.07 Å in 5T4W). This is consistent with similar vertical displacement patterns for both complexes.
Significant differences in buckle values were observed, such as in pair 1, C–G: 6.53° (9FT8) vs. −8.49° (5T4W). This evidences that Hoechst 33342 binding induces greater out-of-plane tilting compared to DAPI. Propeller twist values showed pronounced variations, especially in AT-rich regions (e.g., pair 6, A–T: −17.17° in 9FT8 vs. −21.83° in 5T4W). This is a reflection of the geometrical differences in groove-specific distortions caused by the ligands. The opening values highlight contrasting effects on base pair stability (e.g., Pair 1, C-G: 0.7° in 9FT8 vs. −2.10° in 5T4W). DAPI seemed to stabilize base pairings more strongly in some regions, while Hoechst 33342 may have allowed slightly greater flexibility.
The AT-rich regions (pairs 5–10) showed the most significant ligand-induced changes. The differences in propeller twist and buckle suggest distinct binding preferences for Hoechst 33342 and DAPI, both of which interact with AT-rich minor grooves. The ligand-specific distortions reveal that Hoechst 33342 induced higher buckle values and fewer negative propeller twists in AT regions, likely due to its bulkier structure compared to DAPI. DAPI’s flatter profile resulted in more pronounced negative propeller twists, indicative of tighter binding. Regarding overall DNA stability, both ligands introduced localized conformational changes without disrupting the global B-DNA conformation, maintaining Watson–Crick base pairing.
Detailed parameters for each base pair in two DNA structures, 9FT8 and 1D29, are provided in Table S2. These parameters describe the fine structural properties of the DNA duplex and highlight the effects of ligand binding (in 9FT8) compared to the unliganded structure (1D29).
Shear measures the relative lateral displacement of base pairs along their long axis. Variations in shear are minor, generally below 0.5 Å, but some base pairs in 9FT8 showed deviations (e.g., Pair 1, C–G: 0.41 Å vs. −0.4 Å in 1D29), indicating potential effects from ligand binding. Stretch reflects the relative displacement of base pairs along their short axis. 9FT8 exhibited slightly higher stretch deviations in some base pairs (e.g., Pair 5, A–T: 0 Å vs. 0.68 Å in 1D29), suggesting the ligand may cause localized destabilization. Stagger captures vertical displacement between base pairs. The vertical displacement between base pair (stagger) values were low for most pairs, but subtle deviations (e.g., Pair 9, C–G: −0.06 Å in 9FT8 vs. −0.41 Å in 1D29) could indicate ligand-induced changes.
For buckle (the tilt of the base pairs out of plane), significant differences were observed (e.g., Pair 4, G–C: 11.96° in 9FT8 vs. 7.21° in 1D29), indicating the ligand’s influence on base pair geometry. Propeller twist showed consistent differences, particularly in AT-rich regions (e.g., Pair 6, A–T: −17.17° in 9FT8 vs. −18.58° in 1D29), consistent with minor groove binding. For base pair opening values (the degree of hydrogen bond breakage), 9FT8 showed slightly higher opening values (e.g., Pair 1, C–G: 0.7° vs. −6.69° in 1D29), suggesting ligand binding might reduce base pair stability.
The 9FT8 structure displayed notable differences in buckle, propeller twist, and opening parameters, especially in AT-rich regions (localized effect), supporting Hoechst 33342’s minor groove binding. Overall, both structures retained the typical characteristics of B-DNA, suggesting that ligand binding only induces localized conformational changes without disrupting the overall helix. The comparison highlights the subtle yet specific impact of Hoechst 33342 binding on DNA structure. Changes in buckle, propeller twist, and opening parameters align with its known preference for AT-rich minor groove binding.
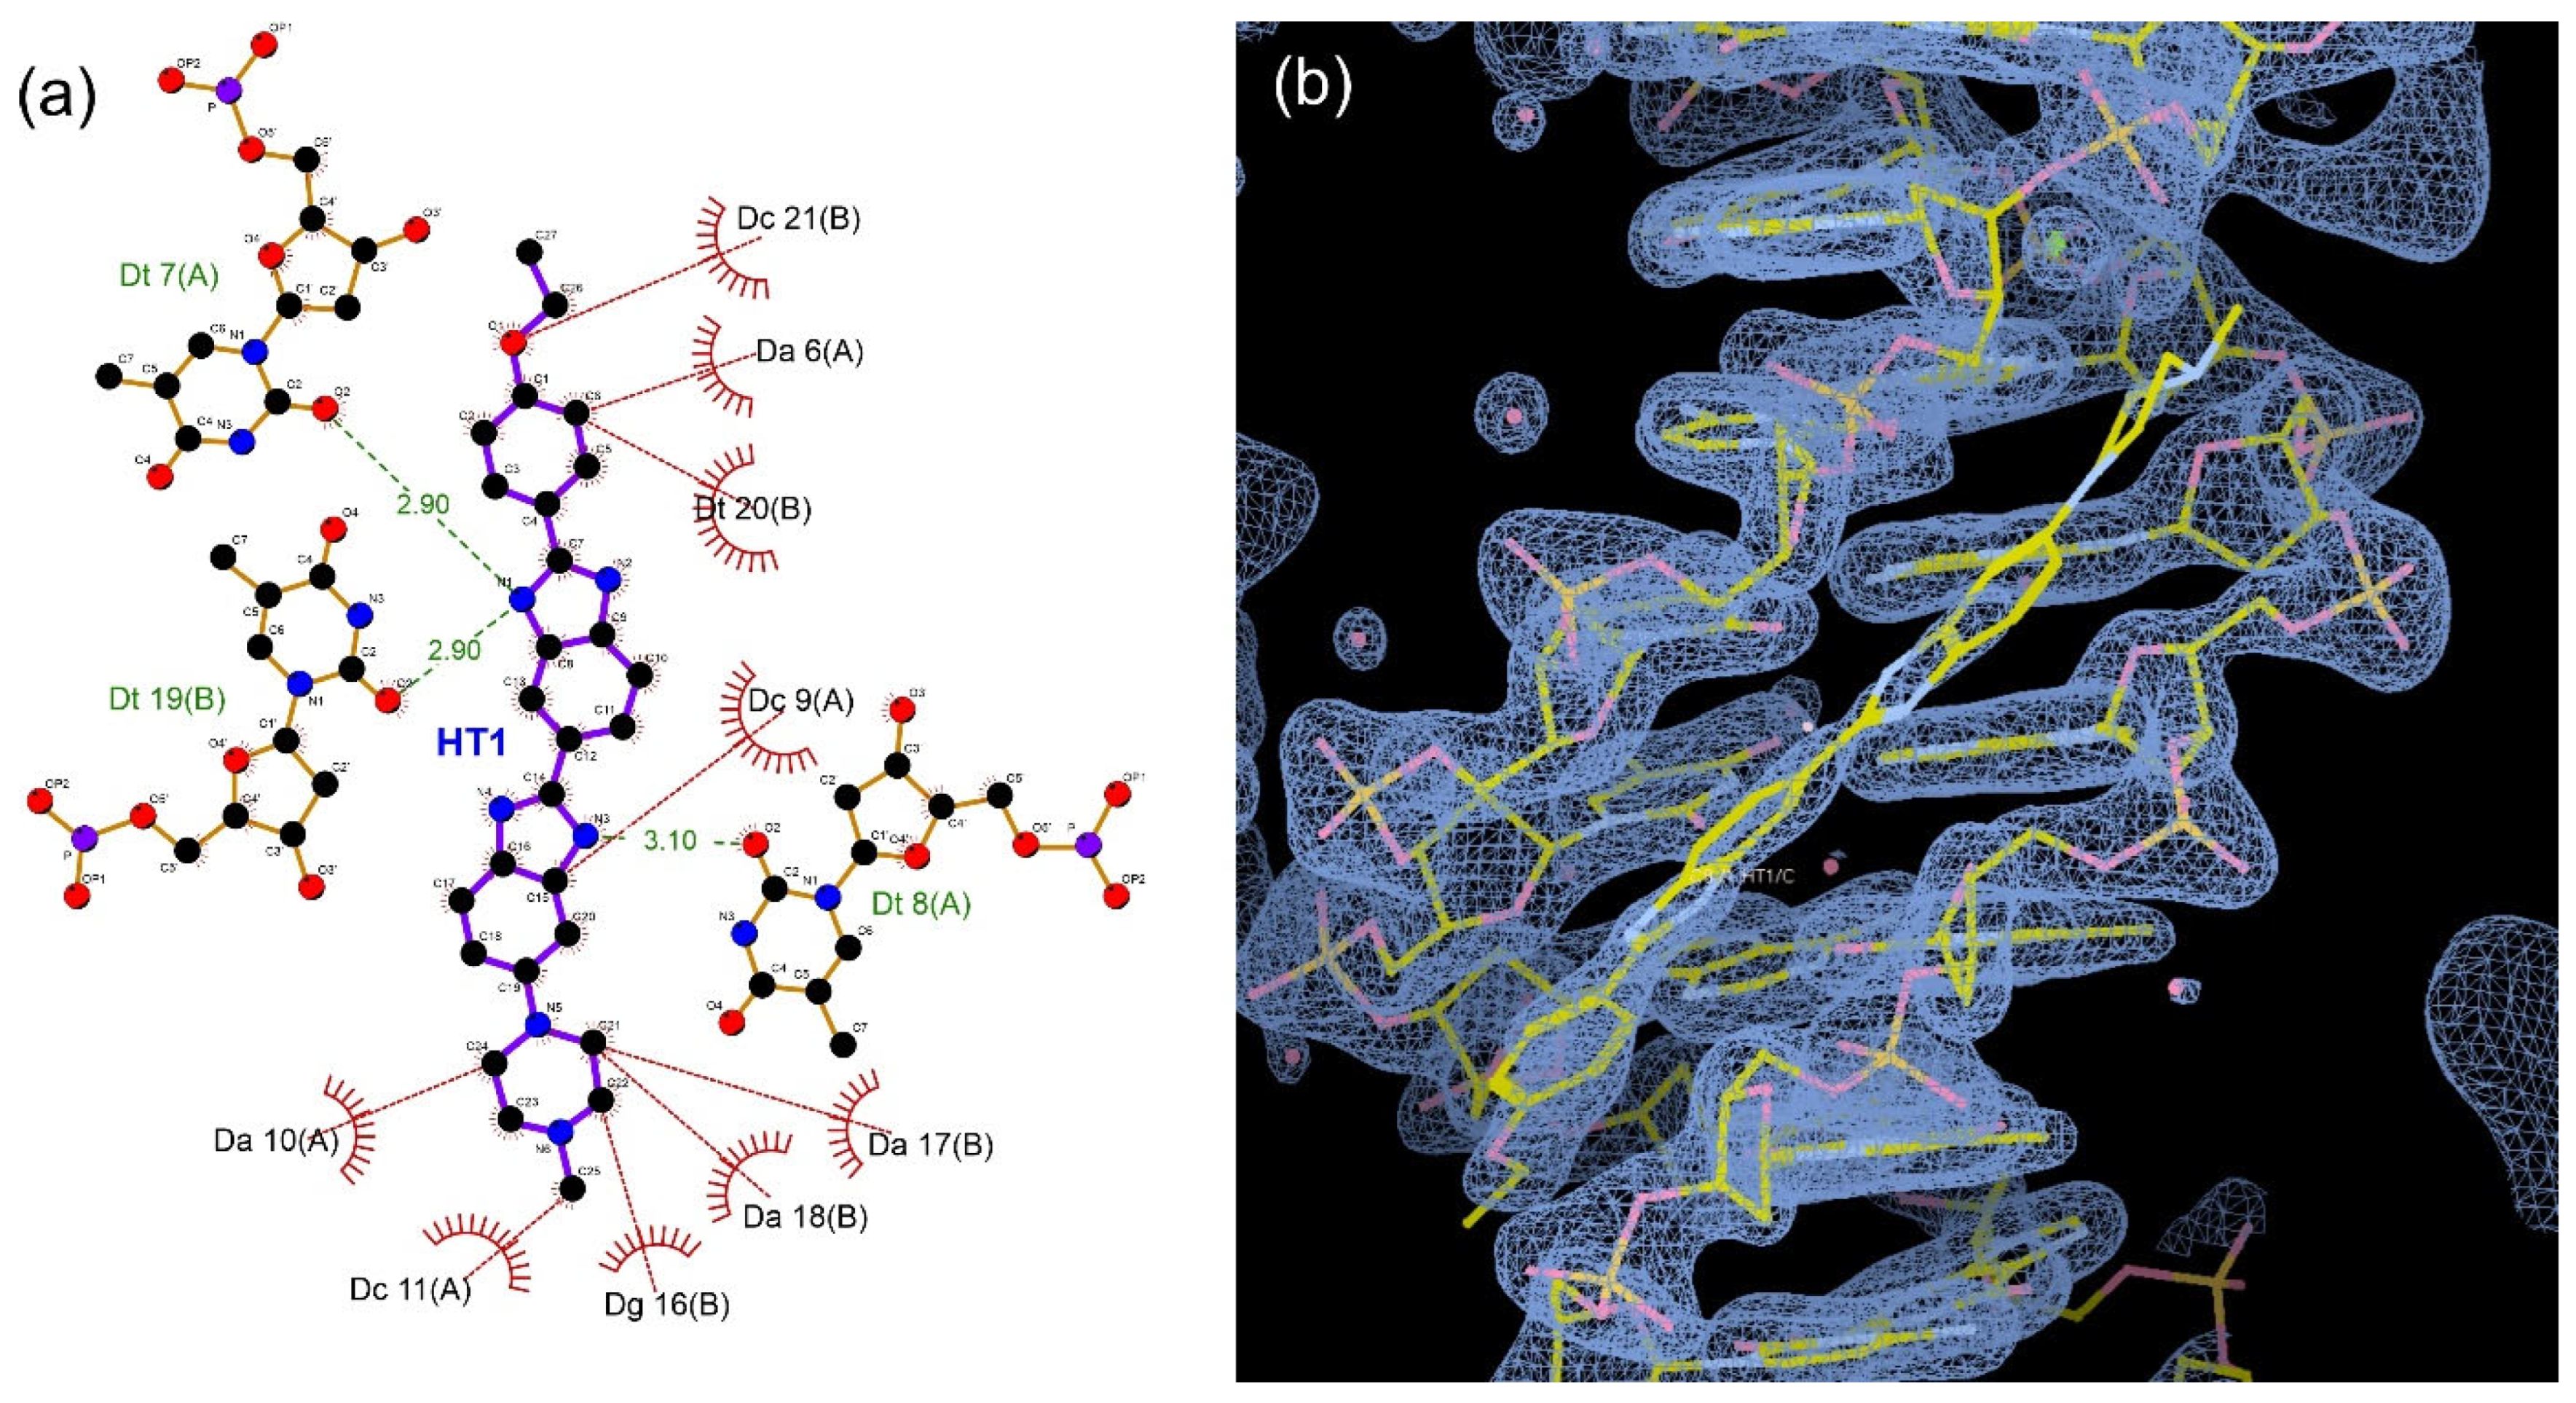
The A–T sections in the middle of the DNA strands are where HT1 interacts (Figure 4). It is apparent that the Hoechst 33342 positioning partially inflated to the DNA’s C–G region. Since the HT1 molecule is longer than the DAPI molecule and needs more space, this is actually to be expected. The hydrophobic characteristics of HT1 in the A–T region led to the displacement of water molecules. This hydrophobic interaction was enhanced by the nonpolar properties of both the upper and lower surfaces of the purine and pyrimidine rings. Additionally, since HT1 carries a positive charge, it may play a role in balancing the negative charge found in the DNA. It can be concluded from the experimental data that Hoechst 33342 and DAPI exhibit a comparatively stable interaction with the DNA molecule.

5. Conclusions

The crystal structure of the oligonucleotide sequence d(CGTGAATTCACG)2 with HT1 was solved at a resolution of 1.9 Å (PDB 9FT8). FID and single crystal analysis were used to confirm the interaction of Hoechst 33342 with DNA. The classical Watson–Crick and hydrophobic interactions triggered the HT1 binding with the B-DNA of 9FT8. The DNA displayed a typical B-DNA conformation, with structural characteristics at the CG-rich regions nearly matching the predicted values. The comparison of Hoechst 33342 and DAPI highlights the unique structural impacts of these ligands. While both binded preferentially in the minor groove of AT-rich DNA, their effects differed in terms of buckle, propeller twist, and base pair opening, reflecting their distinct molecular shapes and binding dynamics. Further analysis, such as interaction energy calculations, could provide deeper insights into their binding mechanisms.

Supplementary Materials

The following supporting information can be downloaded at: https://www.mdpi.com/article/10.3390/cryst15010020/s1, Table S1: X3DNA results for Detailed H-bond information values in 9FT8 DNA crystal structure; Table S2: X3DNA results for Base-Pair morphology: shear, stretch, stagger, buckle, opening and propeller twist values in 9FT8 and 1D29 DNA crystal structures.

Author Contributions

Conceptualization, H.S.-D., R.R. and B.L.S.; Formal analysis, H.S.-D. and A.H.; Visualization, H.S.-D., R.R. and B.L.S.; Investigation (single crystal), H.S.-D., A.H., R.R. and B.L.S.; Investigation (FID), R.R. and H.G.; methodology, H.S.-D., H.G., B.L.S. and R.R.; software, B.L.S.; writing—original draft, H.S.-D., H.G., B.L.S. and R.R.; Funding acquisition, H.S.-D. All authors have read and agreed to the published version of the manuscript.

Funding

This research was funded by the Bulgarian National Science Fund (BNSF), grant number KP-06-KOCT/5.

Data Availability Statement

Complete crystallographic data for the structure of 9FT8 reported in this paper have been deposited in the mmCIF format on the RCSB Protein Data Bank. These data can be obtained free of charge via https://www.rcsb.org/ (accessed on 27 June 2024).

Acknowledgments

We acknowledge Elettra Sincrotrone Trieste for providing access to its synchrotron radiation facilities under proposals 20195613, 20210594, and we thank Nicola Demitri, PhD, for assistance in using beamline XRD2. The authors acknowledge the technical support from the project BG16RFPR002-1.014-0007, PERIMED-2 (2024–2029).

Conflicts of Interest

The authors declare no conflicts of interest.

References

  1. Zhang, X.; Zhang, S.C.; Sun, D.; Hu, J.; Wali, A.; Pass, H.; Fernandez-Madrid, F.; Harbut, M.R.; Tang, N. New insight into the molecular mechanisms of the biological effects of DNA minor groove binders. PLoS ONE 2011, 6, e25822. [Google Scholar] [CrossRef] [PubMed]
  2. Sharga, B.M.; Chromiak, U.I.; Pylypiv, D.B.; Feketa, V.P. Molecular biology practicals. 2022. [Google Scholar]
  3. Bucevičius, J.; Lukinavičius, G.; Gerasimaitė, R. The use of hoechst dyes for DNA staining and beyond. Chemosensors 2018, 6, 18. [Google Scholar] [CrossRef]
  4. Latt, S.A. Microfluorometric detection of deoxyribonucleic acid replication in human metaphase chromosomes. Proc. Natl. Acad. Sci. USA 1973, 70, 3395–3399. [Google Scholar] [CrossRef] [PubMed]
  5. Purschke, M.; Rubio, N.; Held, K.D.; Redmond, R.W. Phototoxicity of Hoechst 33342 in time-lapse fluorescence microscopy. Photochem. Photobiol. Sci. 2010, 9, 1634–1639. [Google Scholar] [CrossRef] [PubMed]
  6. Charousset, C.; Grimberg, J.; Duranthon, L.D.; Bellaïche, L.; Petrover, D.; Kalra, K. The time for functional recovery after arthroscopic rotator cuff repair: Correlation with tendon healing controlled by computed tomography arthrography. Arthrosc. J. Arthrosc. Relat. Surg. 2008, 24, 25–33. [Google Scholar] [CrossRef]
  7. Suss, O.; Motiei, L.; Margulies, D. Broad applications of thiazole orange in fluorescent sensing of biomolecules and ions. Molecules 2021, 26, 2828. [Google Scholar] [CrossRef]
  8. Andrade, N.M.; Arismendi, N.L. DAPI staining and fluorescence microscopy techniques for phytoplasmas. In Phytoplasma: Methods and Protocols; Springer: Berlin/Heidelberg, Germany, 2013; pp. 115–121. [Google Scholar]
  9. Fuchs, H.; Jahn, K.; Hu, X.; Meister, R.; Binter, M.; Framme, C. Breaking a Dogma: High-Throughput Live-Cell Imaging in Real-Time with Hoechst 33342. Adv. Healthc. Mater. 2023, 12, 2300230. [Google Scholar] [CrossRef]
  10. Crowley, L.C.; Marfell, B.J.; Waterhouse, N.J. Analyzing cell death by nuclear staining with Hoechst 33342. Cold Spring Harb. Protoc. 2016, 2016, prot087205. [Google Scholar] [CrossRef]
  11. Shapiro, M.; Brumer, P. Principles of the Quantum Control of Molecular Processes; John Wiley & Sons: Hoboken, NJ, USA, 2003. [Google Scholar]
  12. Selvaraj, C.; Singh, S.K. Computational and experimental binding mechanism of DNA-drug interactions. Curr. Pharm. Des. 2018, 24, 3739–3757. [Google Scholar] [CrossRef]
  13. Tse, W.C.; Boger, D.L. A fluorescent intercalator displacement assay for establishing DNA binding selectivity and affinity. Acc. Chem. Res. 2004, 37, 61–69. [Google Scholar] [CrossRef]
  14. Sheng, Q.; Neaverson, J.C.; Mahmoud, T.; Stevenson, C.E.; Matthews, S.E.; Waller, Z.A. Identification of new DNA i-motif binding ligands through a fluorescent intercalator displacement assay. Org. Biomol. Chem. 2017, 15, 5669–5673. [Google Scholar] [CrossRef] [PubMed]
  15. Karg, T.J.; Golic, K.G. Photoconversion of DAPI and Hoechst dyes to green and red-emitting forms after exposure to UV excitation. Chromosoma 2018, 127, 235–245. [Google Scholar] [CrossRef] [PubMed]
  16. Jež, M.; Bas, T.; Veber, M.; Košir, A.; Dominko, T.; Page, R.; Rožman, P. The hazards of DAPI photoconversion: Effects of dye, mounting media and fixative, and how to minimize the problem. Histochem. Cell Biol. 2013, 139, 195–204. [Google Scholar] [CrossRef] [PubMed]
  17. Sbirkova-Dimitrova, H.; Rusew, R.; Kuvandjiev, N.; Heroux, A.; Doukov, T.; Shivachev, B.L. Structural Characterization of Alzheimer DNA Promoter Sequences from the Amyloid Precursor Gene in the Presence of Thioflavin T and Analogs. Crystals 2022, 12, 1717. [Google Scholar] [CrossRef]
  18. Sibirtsev, V.; Garabadzhiu, A. Spectral study of the interaction of DNA with benzothiazolyl-benz-α-chromene. Biochemistry 2007, 72, 901–909. [Google Scholar] [CrossRef]
  19. Ikeda, S.; Kubota, T.; Kino, K.; Okamoto, A. Sequence dependence of fluorescence emission and quenching of doubly thiazole orange labeled DNA: Effective design of a hybridization-sensitive probe. Bioconjugate Chem. 2008, 19, 1719–1725. [Google Scholar] [CrossRef]
  20. Lubitz, I.; Zikich, D.; Kotlyar, A. Specific high-affinity binding of thiazole orange to triplex and G-quadruplex DNA. Biochemistry 2010, 49, 3567–3574. [Google Scholar] [CrossRef]
  21. Giegé, R.; McPherson, A. Vapour diffusion methods. In International Tables for Crystallography, Vol. F; Springer: Berlin/Heidelberg, Germany, 2006; pp. 82–84. [Google Scholar]
  22. Sbirkova-Dimitrova, H.I.; Shivachev, B. Crystal structure of the DNA sequence d (CGTGAATTCACG)2 with DAPI. Acta Crystallogr. Sect. F Struct. Biol. Commun. 2017, 73, 500–504. [Google Scholar] [CrossRef]
  23. Kabsch, W. xds. Acta Crystallogr. Sect. D Biol. Crystallogr. 2010, 66, 125–132. [Google Scholar] [CrossRef]
  24. Kabsch, W. Automatic processing of rotation diffraction data from crystals of initially unknown symmetry and cell constants. J. Appl. Crystallogr. 1993, 26, 795–800. [Google Scholar] [CrossRef]
  25. McCoy, A.J. Solving structures of protein complexes by molecular replacement with Phaser. Acta Crystallogr. Sect. D Biol. Crystallogr. 2007, 63, 32–41. [Google Scholar] [CrossRef] [PubMed]
  26. McCoy, A.J.; Grosse-Kunstleve, R.W.; Adams, P.D.; Winn, M.D.; Storoni, L.C.; Read, R.J. Phaser crystallographic software. J. Appl. Crystallogr. 2007, 40, 658–674. [Google Scholar] [CrossRef] [PubMed]
  27. Murshudov, G.N.; Skubák, P.; Lebedev, A.A.; Pannu, N.S.; Steiner, R.A.; Nicholls, R.A.; Winn, M.D.; Long, F.; Vagin, A.A. REFMAC5 for the refinement of macromolecular crystal structures. Acta Crystallogr. Sect. D Biol. Crystallogr. 2011, 67, 355–367. [Google Scholar] [CrossRef] [PubMed]
  28. Emsley, P.; Lohkamp, B.; Scott, W.G.; Cowtan, K. Features and development of Coot. Acta Crystallogr. Sect. D Biol. Crystallogr. 2010, 66, 486–501. [Google Scholar] [CrossRef]
  29. Zheng, G.; Lu, X.-J.; Olson, W.K. Web 3DNA—A web server for the analysis, reconstruction, and visualization of three-dimensional nucleic-acid structures. Nucleic Acids Res. 2009, 37, W240–W246. [Google Scholar] [CrossRef]
  30. Pettersen, E.F.; Goddard, T.D.; Huang, C.C.; Couch, G.S.; Greenblatt, D.M.; Meng, E.C.; Ferrin, T.E. UCSF Chimera—A visualization system for exploratory research and analysis. J. Comput. Chem. 2004, 25, 1605–1612. [Google Scholar] [CrossRef]
  31. Wallace, A.C.; Laskowski, R.A.; Thornton, J.M. LIGPLOT: A program to generate schematic diagrams of protein-ligand interactions. Protein Eng. Des. Sel. 1995, 8, 127–134. [Google Scholar] [CrossRef]
  32. Kricka, L.J.; Fortina, P. Analytical ancestry:“Firsts” in fluorescent labeling of nucleosides, nucleotides, and nucleic acids. Clin. Chem. 2009, 55, 670–683. [Google Scholar] [CrossRef]
  33. Waring, M. Complex formation between ethidium bromide and nucleic acids. J. Mol. Biol. 1965, 13, 269–282. [Google Scholar] [CrossRef]
  34. Campbell, N.H.; Smith, D.L.; Reszka, A.P.; Neidle, S.; O’Hagan, D. Fluorine in medicinal chemistry: β-fluorination of peripheral pyrrolidines attached to acridine ligands affects their interactions with G-quadruplex DNA. Org. Biomol. Chem. 2011, 9, 1328–1331. [Google Scholar] [CrossRef]
  35. Trajkovski, M.; Webba da Silva, M.; Plavec, J. Unique structural features of interconverting monomeric and dimeric G-quadruplexes adopted by a sequence from the intron of the N-myc gene. J. Am. Chem. Soc. 2012, 134, 4132–4141. [Google Scholar] [CrossRef] [PubMed]
  36. Rahman, Y.; Afrin, S.; Husain, M.A.; Sarwar, T.; Ali, A.; Tabish, M. Unravelling the interaction of pirenzepine, a gastrointestinal disorder drug, with calf thymus DNA: An in vitro and molecular modelling study. Arch. Biochem. Biophys. 2017, 625, 1–12. [Google Scholar] [CrossRef] [PubMed]
  37. Afrin, S.; Rahman, Y.; Sarwar, T.; Husain, M.A.; Ali, A.; Tabish, M. Molecular spectroscopic and thermodynamic studies on the interaction of anti-platelet drug ticlopidine with calf thymus DNA. Spectrochim. Acta Part A Mol. Biomol. Spectrosc. 2017, 186, 66–75. [Google Scholar] [CrossRef]
  38. González-Ruiz, V.; Olives, A.I.; Martín, M.A.; Ribelles, P.; Ramos, M.T.; Menéndez, J.C. An overview of analytical techniques employed to evidence drug-DNA interactions. Applications to the design of genosensors. Biomed. Eng. Trends Res. Technol. 2011, 32, 215–219. [Google Scholar]
  39. Larsen, T.A.; Kopka, M.L.; Dickerson, R.E. Crystal structure analysis of the B-DNA dodecamer CGTGAATTCACG. Biochemistry 1991, 30, 4443–4449. [Google Scholar] [CrossRef]
  40. Manivelan, V.; Kavyashree, B.; Sadanandan, B.; Vaidya, S.; Acharya, K.K. Comparative Analysis of DNA Structural Parameters and the Corresponding Computational Tools to Differentiate Regulatory DNA Motifs and Promoters. bioRxiv 2024. bioRxiv: 2026.584893. [Google Scholar]
  41. Li, S.; Olson, W.K.; Lu, X.-J. Web 3DNA 2.0 for the analysis, visualization, and modeling of 3D nucleic acid structures. Nucleic Acids Res. 2019, 47, W26–W34. [Google Scholar] [CrossRef]
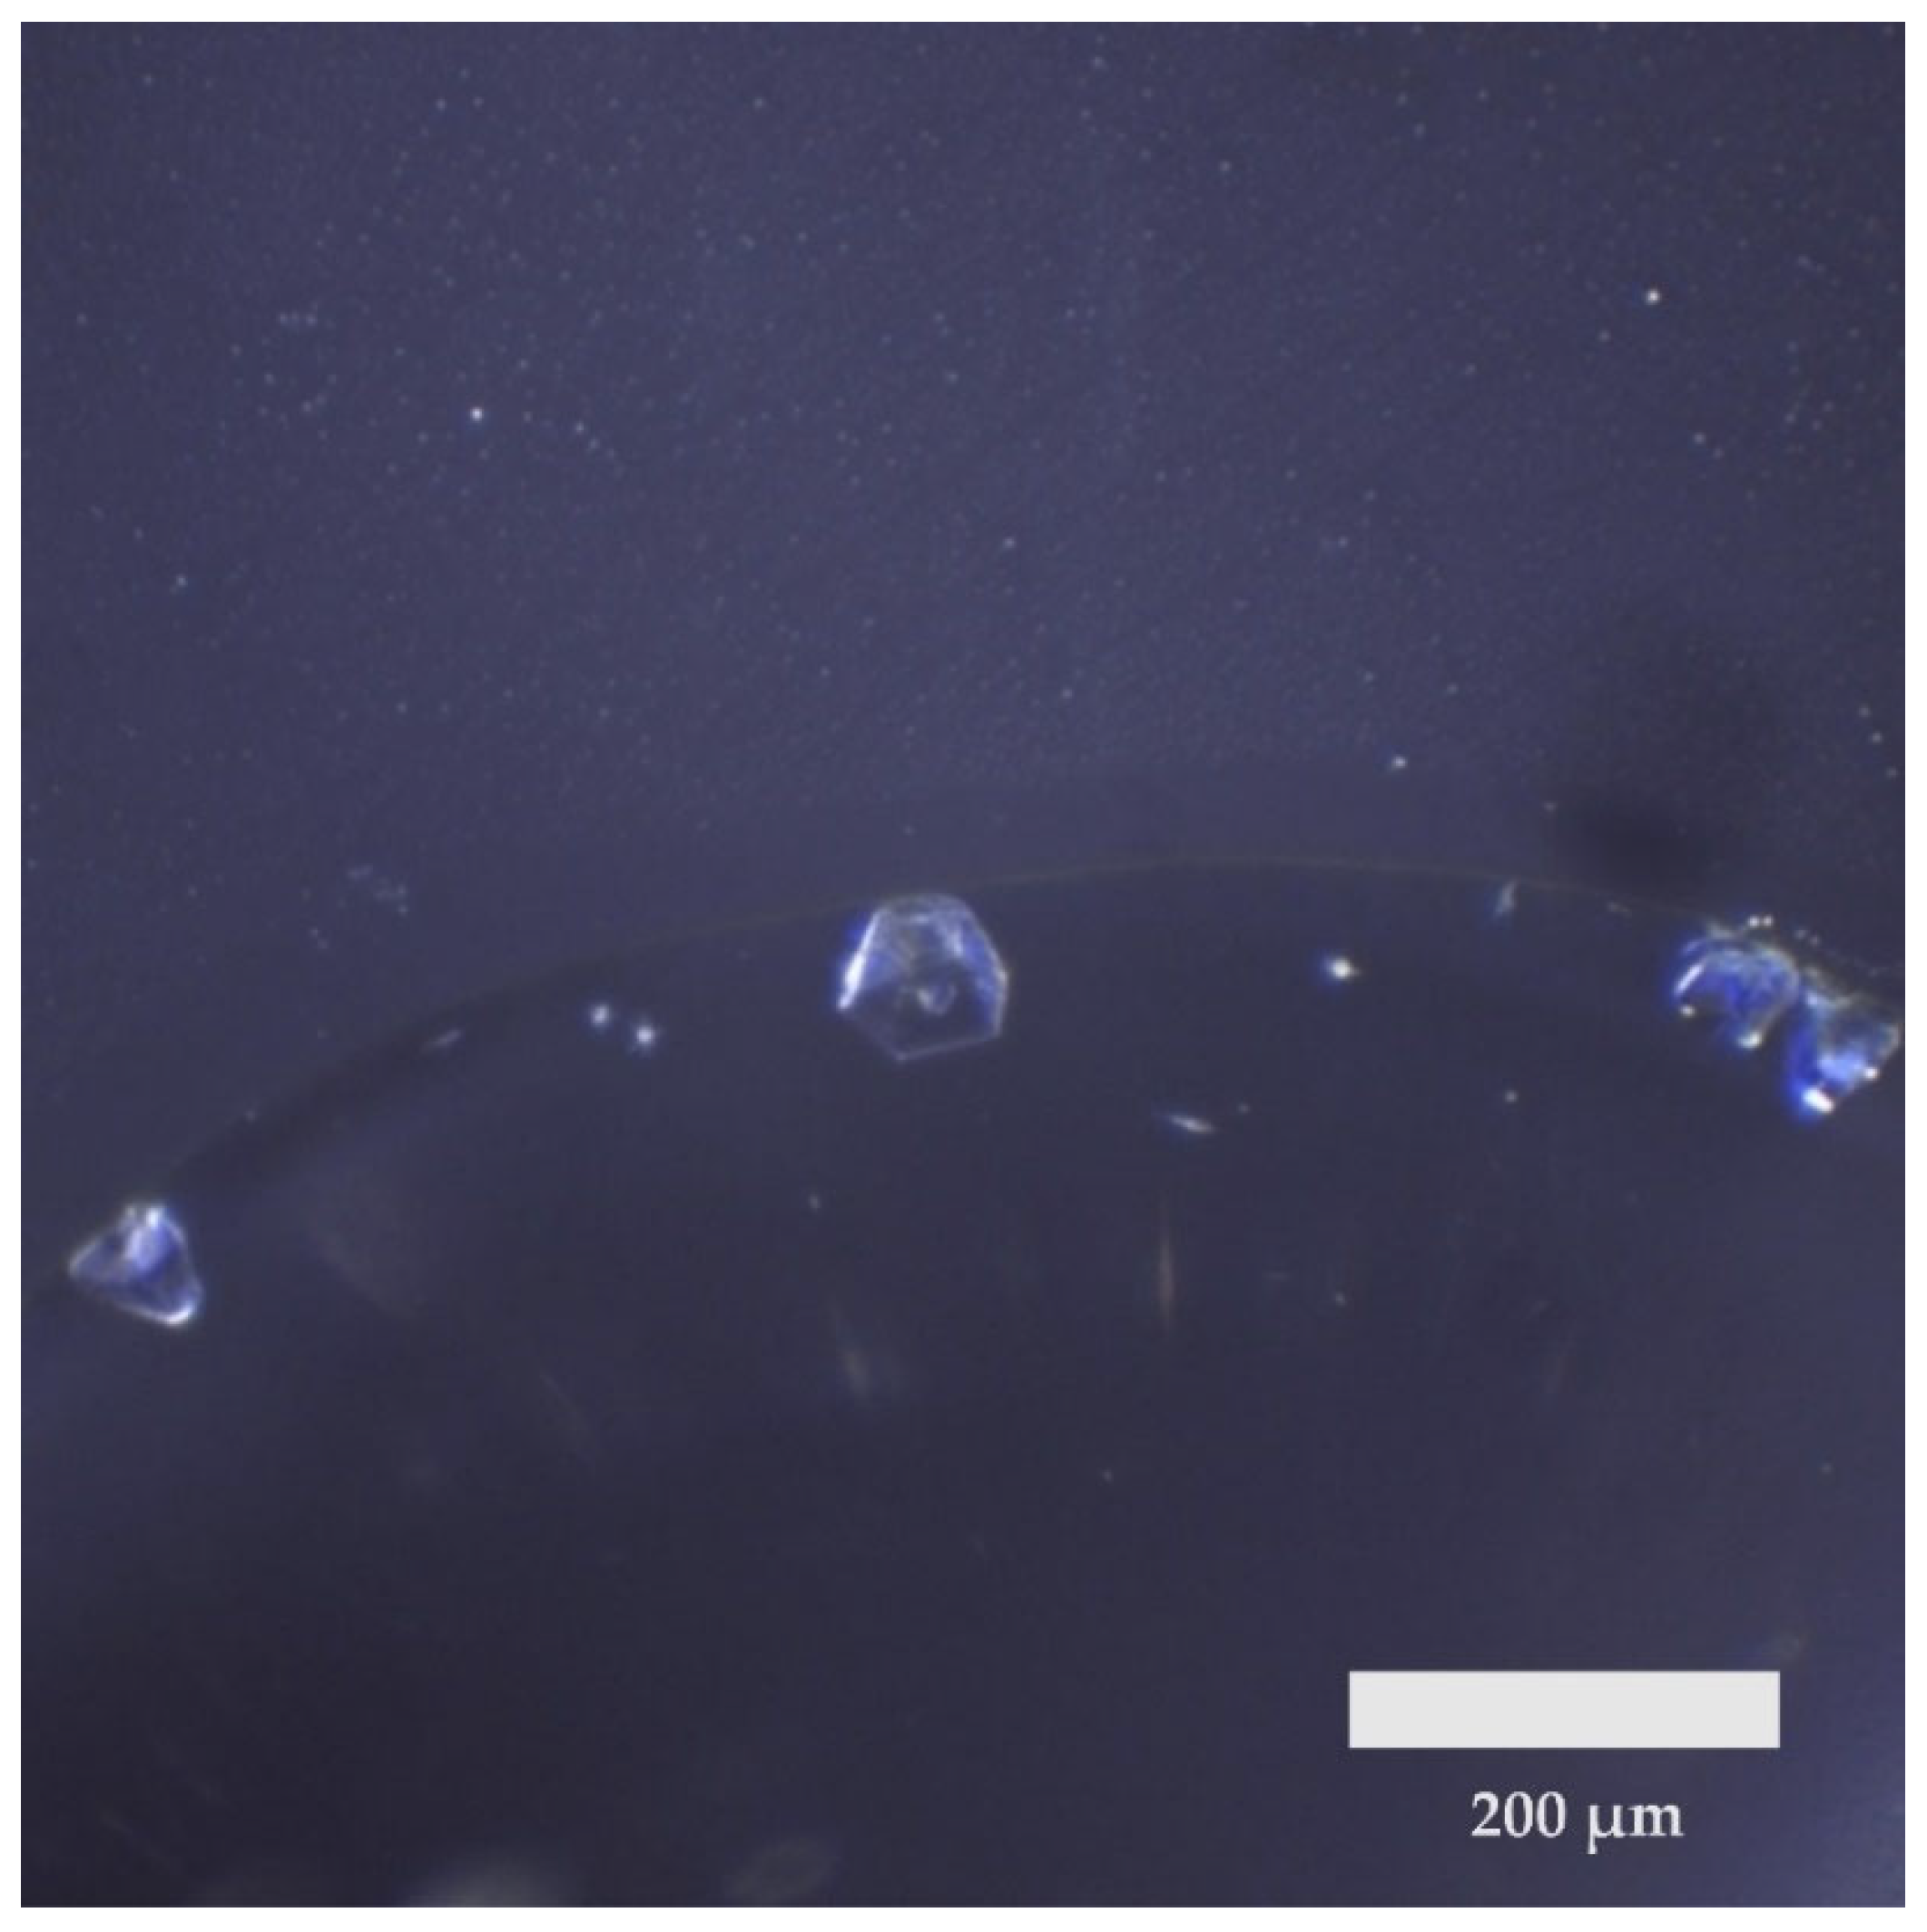
Figure 1. Observed crystals of 5′-CGTGAATTCACG-3′ complexed with Hoechst 33342.
Crystals 15 00020 g001
Figure 2. Fluorescent intercalator displacement data for 9FT8 (a) bar chart representation of intensity values of DNA-EtBr (dark red-brown), DNA-EtBr-HT1 (green), DNA-EtBr-DAPI (purple/violet), DNA-EtBr-Berenil (light blue) and DNA-EtBr-TO (orange) and (b) line chart representation of the same data to illustrating the trends across different sequences.; dark blue represents the intensity values of water-diluted DNA sequences tested alone, before the addition of EtBr.
Crystals 15 00020 g002
Figure 3. View of the asymmetric unit of (a) 5T4W including DAPI molecule, (b) view of the asymmetric unit of 9FT8 with Hoechst 33342, (c) 1D29 molecule without ligands, and (d) visualization of the superposed phosphate backbone and the ligands of 5T4W (blue), 9FT8 (in green), and 1D29 (in red).
Crystals 15 00020 g003
Figure 4. Observed interactions of HT1 with DNA. (a) Hydrogen boning interactions are shown as green dashed lines, while steric hindrance is shown as red dashed lines. (b) 2Fo—Fc electron density maps within 1.9 Å disclosing the HT1 molecule.
Crystals 15 00020 g004
Table 1. Main characteristics of some of the selected and tested oligonucleotide sequences.
NameSequence (5′->3′)MW (g/mol)GC-Content (%)Extinction Coefficient (mol.cm)Tm [°C]Bases
9FT85′-CGTGAATTCACG-3′364550131,4003612
DDD5′-CGCGAATTCGCG-3′364667110,7004012
5WV75′-CCGGGGTACCCCGG-3′367986112,2005814
3NZ75′-GGGGTTTTGGGG-3′342767104,5004012
VMYC5′-GGGAGGCGTGGGGGTG-GGACGGTGGGG-3′778782237,5005927
2LEE5′-TAGGGCGGAGGGAGGG-AA-3′545369166,3005019
Table 2. Data collection and refinement statistics for 9FT8.
PDB Code9FT8
Space groupP212121
Cell dimensions
a, b, c, Å24.59, 40.41, 65.03
α, β, γ, °90, 90, 90
Independent molecules1
Diffraction data
Wavelength, Å0.99
Resolution, Å1.90
Reflections5451
Completeness, %99.8
I/σ(I)4.36
Redundancy7.0 (5.9)
Rmerge %4.6 (25)
Refinement statistics
Reflections used5200
Resolution, Å1.90
R (Rfree) %21.9 (24.6)
No. of atoms542
DNA488
HT133
Average B fatcor, Å237.1
r.m.s.d.
Bond lengths, Å0.72
Bond angles, °1.60
Table 3. X3DNA results for base-pair morphology: shear, stretch, stagger, buckle, opening, and propeller twist values in 9FT8 and 5T4W DNA crystal structures.
PairShearStretchStaggerBucklePropellerOpening
9FT85T4W9FT85T4W9FT85T4W9FT85T4W9FT85T4W9FT85T4W
1C–G0.410.05−0.23−0.05−0.02−0.136.53−8.49−14.17−11.900.7−2.10
2G–C−0.3−0.04−0.2−0.23−0.180.07−5.511.25−9.89−18.61−3.6−3.28
3T–A−0.310.20−0.16−0.32−0.09−0.17−0.241.6−8.83−5.78−1.350.62
4G–C−0.37−0.45−0.18−0.34−0.16−0.1511.96−4.95−8.83−5.93−0.33.04
5A–T0−0.38−0.12−0.15−0.13−0.258.35−6.5−14.98−14.742.255.33
6A–T0.040.28−0.08−0.110.06−0.185.48−11.92−17.17−21.834.763.85
7T–A−0.040.12−0.120.010.150.15−2.030.88−19.44−22.164.239.28
8T–A−0.010.43−0.21−0.34−0.010.03−4.7711.26−15.4−14.961.025.61
9C–G0.310.18−0.06−0.16−0.14−0.39−10.3514.94−11.58−7.940.361.83
10A–T0.02−0.29−0.17−0.250.130.15.97−4.85−11.01−6.414.29−1.43
11C–G0.09−0.17−0.120.050.21−0.084.313.25−19.18−21.55−0.79−8.78
12G–C−0.40.12−0.2−0.12−0.01−0.1411.784.6319.06−6.21−4.49−6.65
Disclaimer/Publisher’s Note: The statements, opinions and data contained in all publications are solely those of the individual author(s) and contributor(s) and not of MDPI and/or the editor(s). MDPI and/or the editor(s) disclaim responsibility for any injury to people or property resulting from any ideas, methods, instructions or products referred to in the content.