Article

Electrochemical Study and Mechanical Properties of Ti-Zr Alloy for Biomedical Applications

by
Iosif Hulka
1,
Ion-Dragoș Uțu
2,
Santiago Brito-Garcia
3,
Amparo Verdu-Vazquez
4 and
Julia C. Mirza-Rosca
3,5,*
1
Research Institute for Renewable Energie, Politehnica University of Timişoara, G. Muzicescu 138, 300501 Timişoara, Romania
2
Department of Materials and Manufacturing Engineering, Faculty of Mechanical Engineering, Politehnica University of Timișoara, Blvd. Mihai Viteazu, 300222 Timișoara, Romania
3
Department of Mechanical Engineering, Las Palmas de Gran Canaria University, 35017 Tafira, Spain
4
Building Technology Department, Madrid Polytechnic University, 28040 Madrid, Spain
5
Materials Engineering and Welding Department, Transilvania University of Brasov, 500036 Brasov, Romania
*
Author to whom correspondence should be addressed.
Crystals 2024, 14(6), 493; https://doi.org/10.3390/cryst14060493
Submission received: 18 April 2024 / Revised: 17 May 2024 / Accepted: 20 May 2024 / Published: 23 May 2024
(This article belongs to the Special Issue Microstructure and Mechanical Behaviour of Structural Materials)

Abstract

:
In response to concerns of potential cytotoxicity and adverse tissue reactions caused by vanadium and aluminum in the currently used biomaterial Ti-6Al-4V, the Ti–20Zr alloy was evaluated in this study because it has been suggested as a candidate for human body implant material. The Ti-20Zr alloy was obtained by vacuum-melting, followed by heat treatment at 1000 °C for 1 h, and then air-cooled. Optical and scanning electron microscopy revealed that the sample had an α and β lamellar microstructure. Analysis showed that the mechanical properties, in terms of hardness measurements performed at low loads, were significantly different between the two phases. Thus, it was found out that the α phase is softer by about 30% compared to the β phase. The Electrochemical Impedance Spectroscopy technique (EIS) was employed to study the electrochemical behavior in simulated body fluid (SBF). The electrochemical behavior demonstrated that Ti-20Zr alloy exhibits excellent corrosion resistance due to the stable oxide layer formed on its surface. SEM and EDS investigations showed that the surface topography, after electrochemical studies, is characterized by a porous film with increased oxygen content, which might be suitable for the osteoinductive growth of bone.

1. Introduction

Dental implant treatments have gained popularity because they preserve the adjacent tooth structure and bone compared to other treatments; thus, this method has become an important option for replacing missing teeth [1]. To manufacture implants, many metallic alloys have been studied and employed. Among them, the most common are Co-Cr alloys, Co-Cr-Mo alloys, stainless steel, commercially pure Ti (cpTi), and Ti-based alloys. Titanium is used for the manufacturing of implants because it is biologically inert, has increased biocompatibility, and has good bonding with osteoblasts. Moreover, when exposed to the environment it can spontaneously develop a TiO2 oxide film on its surface [2,3] in the order of nanometers, which can absorb phosphate- and calcium-inducing proteins to form apatite, thus promoting osseointegration [4]. Nevertheless, the oxide film developed on its surface is very thin [5,6] and is prone to damage, which leads to the release of Ti ions [7]. Also, cpTi has low wear resistance, which affects the mechanical properties of the implant. In order to overcome some of its drawbacks, Ti is alloyed with a variety of elements to enhance its corrosion resistance, to improve its mechanical properties, and to lower its modulus of elasticity. Ti-based alloys are widely used as biomaterials in dentistry for manufacturing abutments, orthodontic wires, and prostheses [4]. Among them, probably one of the most popular materials used for implants is Ti-6Al-4V due to its advantages like good corrosion resistance and mechanical strength combined with a lower modulus of elasticity compared to cpTi. However, it has been reported that aluminum and vanadium ions can lead to neurological problems and adverse reactions in the human body over an extended period of time [8,9,10]. To further improve the mechanical properties and biocompatibility of Ti, Ti-xZr alloys have been developed [11]. These alloys are of interest since they have a lower Young’s modulus, increased hardness, and in some cases better biocompatibility compared to Ti-6Al-4V and cpTi. Like titanium, zirconium belongs to the IV group of the periodic table and is recognized as having similar chemical properties. Alloys with different concentrations of zirconium, such as Ti-10Zr, Ti-20, Ti-30Zr, and Ti-50Zr, have been studied in specific conditions for dental implant applications [12,13,14]. Researchers have conducted in vitro, animal, and clinical studies on commercial Roxolid alloys, which are Ti-based alloys with 13–17 wt.% Zr [15]. It was found out that the alloys possess increased biocompatibility compared to cpTi, proving that they are a great candidate for small-diameter implants. Alternate outcomes were revealed during the examination of the electrochemical behavior of the alloys with titanium and zirconium [16,17]. These studies showed that the alloy passivated more easily in Ringer solution compared to cpTi, having a more stable passive film than Ti [18,19]. The influence of Zr concentration on Ti-xZr alloys (x = 5%, 10%, 15%) was studied and it was concluded that the alloy presents no cytotoxic effect on osteoblastic cells [20], confirming its safe use for medical devices [21,22]. The authors of the present work also investigated the electrochemical behavior of the Ti-Zr alloy in Ringer’s solution, and it was found that the alloy has a superior corrosion resistance compared to cpTp [23]. Furthermore, Zr addition results in microstructural refinement without a significant reduction in ductility [24]. Considering these aspects, from the literature one can notice that Ti-Zr is of particular interest in dentistry; however, its performance can still be improved, and this can be achieved by changing the alloy’s Zr content to produce an alloy with a defect-free microstructure, improving osseointegration by passivation in different solutions, heat treatments, etc.
Thus, based on the literature and on the author’s background, the present paper aims to further study the Ti-20Zr alloy, manufactured by vacuum-melting followed by heat treatment and air-cooling. The microstructure and mechanical properties in terms of hardness, as well as in vitro studies performed in artificial extracellular fluids, were investigated. Studies were performed to find an adequate range for the stability of the heat-treated Ti-20Zr alloy and to quantify the resistance of the passive film developed on it. The present work is a basic research study to investigate the influence of heat treatment on this particular alloy and to gather pertinent information for the design of novel bio-medical material.

2. Materials and Methods

2.1. Ti-20Zr Alloy Preparation

The Ti-20Zr alloy was synthesized using a double-electron-beam melting furnace, namely, the EMO 80 model manufactured by ZIROM S.A. in Giurgiu, Romania. The sample was made from Ti and Zr, both of which had a bulk purity greater than 99.5%. The ingots were rolled over and remelted at least six times to prevent macroscopic defects caused by insufficient mixing. The sample was made as an ingot with a 20 mm diameter and 30 mm length. To prevent segregation, homogenization was utilized by subjecting the material to heat treatment in a tubular furnace at a temperature of 1000 °C with a heating rate of 10 °C per minute, followed by cooling in ambient air until the samples reached room temperature. From our experience, we have observed that if we use 1000 °C for heat treatment, we achieve homogenization within the material without changing the α-β phases. If we go much higher than the beta-transus temperature (980 °C), where homogenization in the β phase takes place, we notice the formation of an increased volume of non-equilibrium martensitic phases formed during cooling, such as α″, which make the material more fragile. Therefore, we wanted to maintain a balance between mechanical properties and corrosion resistance. Specimens were cut and were specifically prepared for each of the following tests: scanning electron microscopy (SEM), microhardness and electrochemical measurements.

2.2. Microscopic Observations

The metallographic preparation used to study the alloy consisted of (i) cutting the specimens, (ii) hot-mounting them in carbon-based resin, (iii) grinding the samples up to 2400-grit SiC paper, and subsequently (iv) polishing the surfaces using alpha alumina with a particle size of 0.1 μm until a highly reflective mirror-like appearance was achieved. The samples were previously ultrasonically cleaned with deionized water and then etched for 15 s in Kroll’s reagent, which contains 10 mL of hydrofluoric acid, 5 mL of nitric acid, and 85 mL of water. When etching Ti or Ti alloys with Kroll’s reagent, the colors of the β phase become dark brown. For microscopic observations, an Olympus PME 3-ADL metallographic microscope (Olympus, Tokyo, Japan) was employed. To investigate the microstructure before and after the electrochemical tests, elemental analysis was conducted using a Carl Zeiss Sigma 300 VP scanning electron microscope (FE-SEM) from Zeiss, Jena, Germany, which was equipped with an energy-dispersive X-ray spectrometer (EDS), from Zeiss, Jena, Germany. The SEM micrographs were acquired in high-vacuum mode with a cathode voltage of 15 kV and a working distance of approximately 10 mm. The sample was analyzed using a backscattered electron detector (BSD) (Zeiss, Jena, Germany) to identify the various phases present based on the Z contrast, and the secondary electron (SE) (Zeiss, Jena, Germany) was used to investigate the topography of the surface after the electrochemical tests. EDS was performed for chemical characterization by positioning the sample at eucentric height, which was at 10 mm working distance from the surface of the sample.

2.3. Microhardness and Indentation Depth

Vickers microhardness measurements were performed on the polished surface using a Remet HX-1000 hardness tester. The microhardness measurements were carried out tangentially to the surface and the indents were made at intervals of 0.5 mm along the diameter of the sample. A variety of weights, including 0.5, 1, 2, 3, 4, 5, 10, 20, 50, 100, and 200 g, were utilized, along with a dwell time of 15 s to study the hardness variation. Ten indents were taken for each load and the average value for each sample expressed as Vickers hardness (HV) was calculated. Moreover, based on the measurements, the corresponding indentation depth was calculated. Given the geometry of the Vickers indenter, the depth of the indentation can be estimated by employing the subsequent equation derived from the overarching Vickers equation:
δ = 1.854   ×   F 49   ×   H V
where δ is indentation depth [μm], F is applied load, and HV is hardness value.

2.4. Electrochemical Behavior

Under simulated physiological conditions, Ti-20Zr alloy’s electrochemical behavior was examined by open-circuit potential (OCP), cyclic voltammetry (CV), linear polarization (LP) and Electrochemical Impedance Spectroscopy (EIS). These techniques were performed using a BioLogic Essential SP-150 Potentiostat from Seyssinet-Pariset in France. The experimental solution utilized was a simulated body fluid (SBF) consisting of the following components (in grams per liter): NaCl-6.8; KCl-0.4; CaCl2-0.2; MgSO4.7H2O-0.2; NaH2PO4.H2O-0.15; NaHCO3-1.1; glucose-1.2. The electrochemical tests were conducted at a temperature of around 22 °C using a standard glass cell that held 80 cc of electrolyte. The working electrode’s potential was measured relative to a saturated calomel electrode (SSCE) immersed in a solution of NaCl. The measured potentials were recorded relative to the SSCE electrode, with a Pt gauze serving as the counter electrode. Before conducting the studies, each electrode was subjected to a voltage of −1 V (SSCE) for a duration of 10 min in order to reduce any oxides that may have formed on the surface of the sample. The cyclic voltammetry measurements were performed using a Biologic SP-150 (BioLogic Science Instruments, Seyssinet-Pariset, France) potentiostat/galvanostat. The potential range was from −1.5 V to 2 V with scan rates of 10, 50, 100, and 200 mV/s. Furthermore, the impedance data were collected at different potentials using the Biologic SP-150 module. Using an alternative voltage amplitude of 10 mV in the frequency range between 10−1 and 105 Hz, single sine wave records were made. The collected EIS data were analyzed, employing ZView 2 software by Scribner Associates, Inc., Southern Pines, NC, USA. The collected data were modeled with an advanced non-linear least squares Levenberg–Marquardt method, employing an analogous electrical circuit. Furthermore, by continually polarizing the electrodes and allowing the system to equilibrate for 600 s at each potential, impedance spectra in the range of −0.5 V to 1.5 V vs. SCE with a step of 0.2 V were recorded in order to characterize the oxide layer. For the linear polarization measurements (LP), the samples were polarized within a potential range of −1.5 V to 3.0 V with a scan rate of 1 mV/s.

3. Results and Discussions
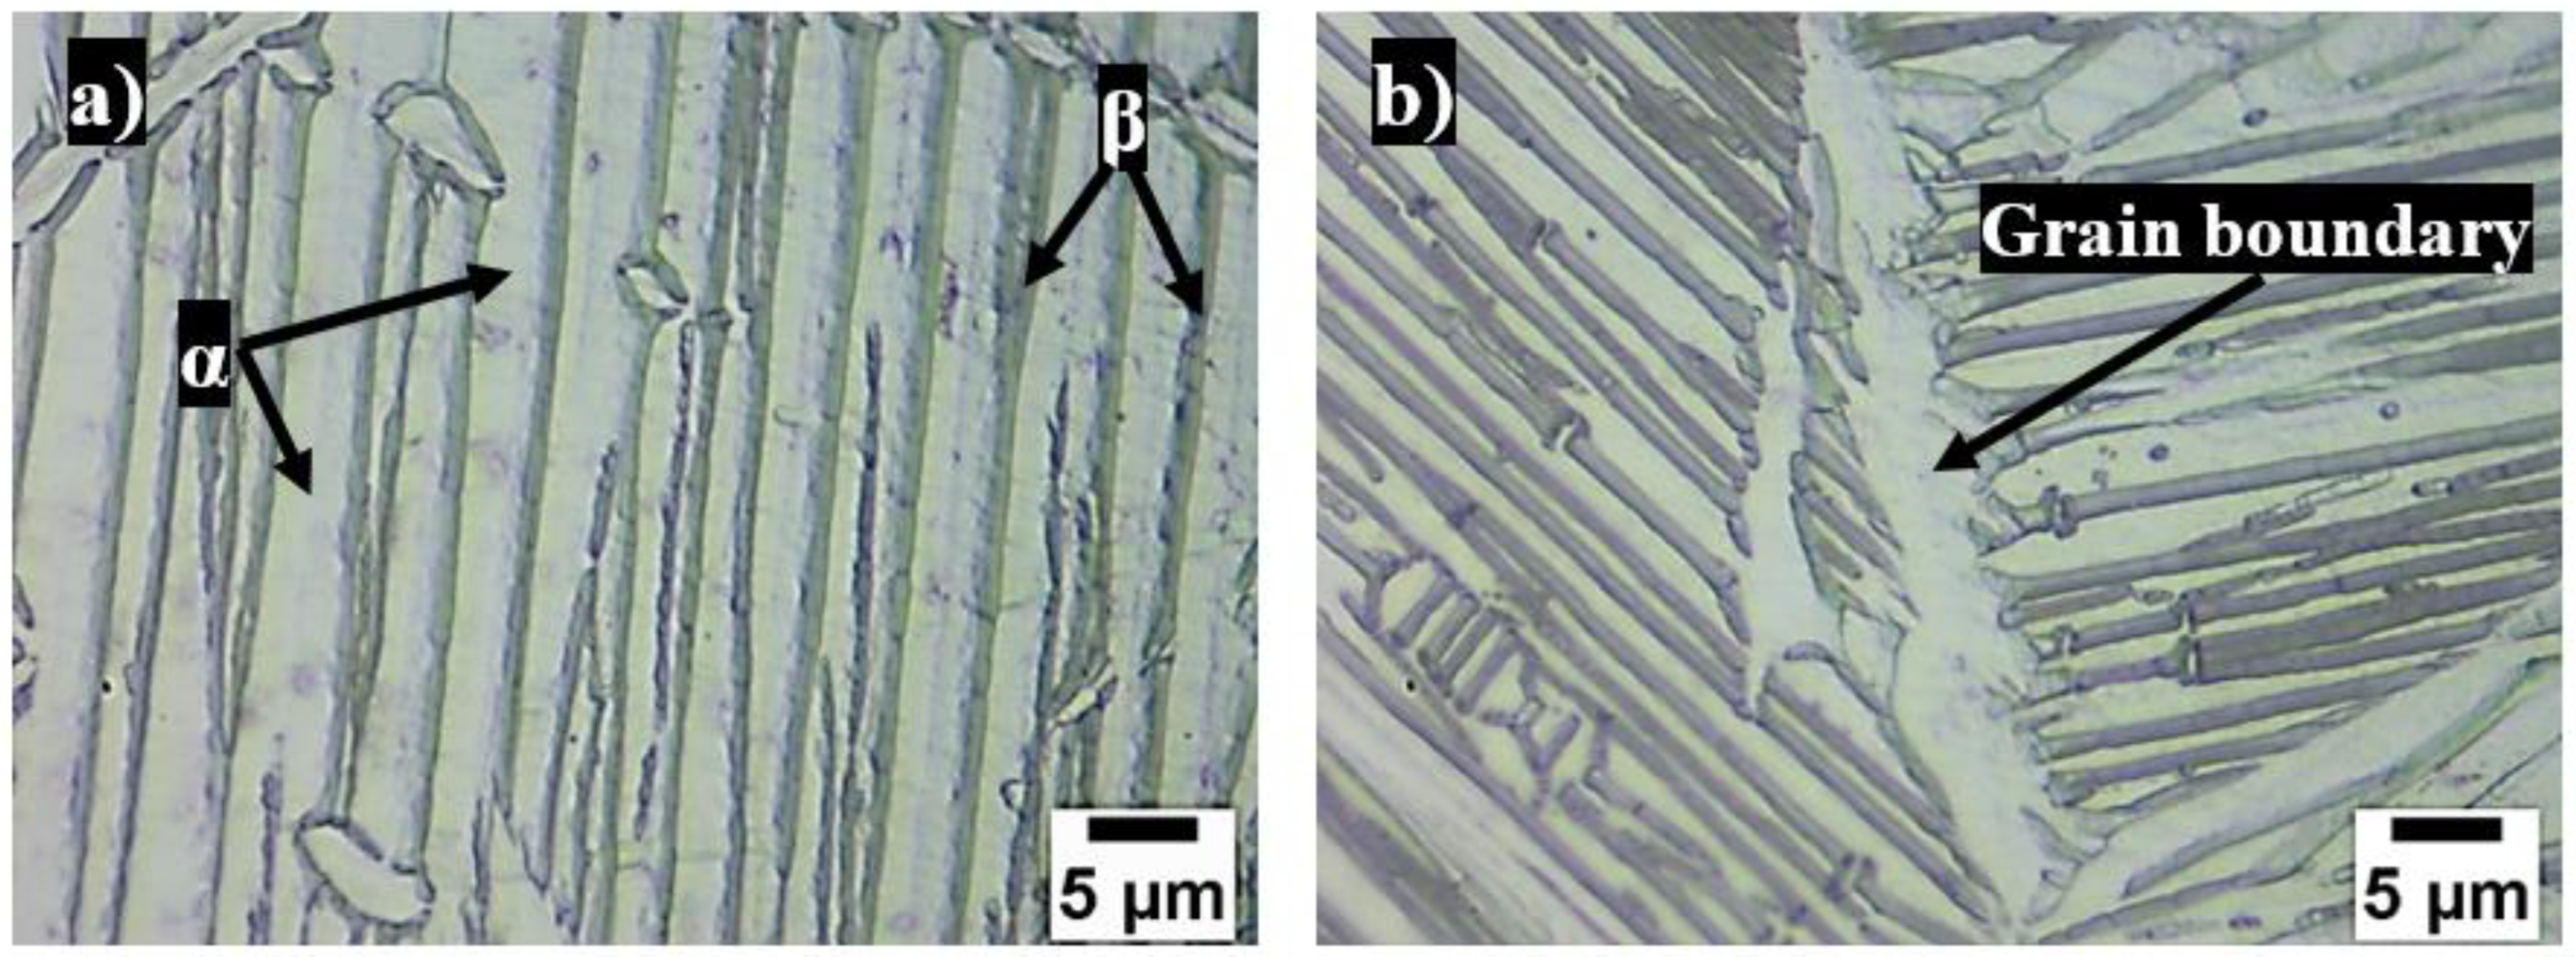
3.1. Microstructure

The microstructure of the analyzed alloy was significantly impacted by the manufacturing process and the heat treatment. In this study, after manufacturing, the alloy was held for 60 min at 1000 °C, above the β transus temperature (the temperature at which a change occurs from the α phase to the β phase), and afterward air-cooled till the sample reached room temperature. A standard procedure to prepare Ti alloys for metallographic investigations is to etch the samples after polishing with Kroll’s reagent [25]. The surface of the sample etched for 15 s was observed using a metallographic microscope, and the microstructure at two different magnifications is presented in Figure 1. The sample, air-cooled from the annealing temperature, produced fine-structured lamellar α and β phases due to the faster cooling, which was revealed by the reagent. This is because the β phase is colored preferentially compared to the α phase. One can observe that the microstructure reveals very clearly the α lamellar microstructure which forms due to solidification after homogenization in the β phase. Furthermore, the α phase was noticed at the grain boundaries, as presented in Figure 1b. Grain boundary α is an allotriomorph crystal structure generally located at the β grain boundaries [26] which form due to late crystallization. A similar microstructure was observed by Jose Moreno et al. when studying the microstructure and corrosion behavior of Ti-20Zr alloys in NaF-doped artificial saliva [27]. Thus, it is believed that the α’ phase is present as well in the microstructure since the acicular lamellas in the nearby grain boundaries are much finer compared to the ones observed in Figure 1a. This might be attributed to the heat treatment to which the sample was subjected, followed by air-cooling. The α’ phase is like the α phase, and it is difficult to identify it. However, Chávez et al. identified the α’ phase in Ti-30Zr alloys; it was obtained by arc-melting and formed due to the distortion of the α phase caused by a complete solid solution of Zr combined with fast cooling [28]. The needle microstructure is a typical α’ martensitic phase of Ti, which in our case is attributed to the substitutional Zr added to the alloy’s composition [20].
From the SEM images presented in Figure 2, it is evident that the Ti-20Zr alloy is a solid solution with small segregations. This is attributed to a homogeneous composition, to the similar physical properties of Ti and Zr, and to a high cooling rate, which inhibits the formation of segregations [12]. Moreover, the examined region exhibits areas of dark gray and lighter shades. SEM tests using a backscattered electron (BSD) detector reveal elements with higher atomic numbers, as they appear brighter in micrographs. The bright areas correlate to the regions with a high concentration of Zr. Zirconium (Zr) atoms possess a greater atomic number, resulting in a stronger scattering of electrons towards the detector compared to titanium (Ti) atoms. As a result, Zr atoms seem more luminous in the SEM micrographs. This is further corroborated by the EDX spectra, as the Zr peak has a greater intensity when obtained from the illuminated region (Figure 2b, labeled Area 1). These data are supported by the quantification as well.

3.2. Microhardness and Indentation Depth

The microhardness values recorded as measurements from the surface of the samples under different loads are summarized in Table 1. Considering our observations, we decided to divide the results into the functions of the effects of phase and load on the hardness values. It was noticed that the microhardness values varied when using loads up to 20 gf. It is assumed that the variation is caused by the fact that the indents were collected in soft and hard phases individually. Thus, these phases are ascribed to the α and β phases identified within the microstructure. For loads in the range of 0.5–20 gf, five measurements were performed in the soft phase and five measurements in the hard phase, and the calculated average values for each phase are listed in Table 1. According to the observations, the α phase is somewhat softer (about 30% lower) than the β phase. Comparable results were documented by Min et al. when investigating the mechanical characteristics of Ti-Mo-Fe and Ti-Mo alloys after heat treatment [29]. Starting with a 50 gf load, it was not possible to select the phases and the average microhardness value was obtained as the mean of ten indentations randomly performed on the surface of the sample. It was observed that with the starting load of 50 gf, there were no significant differences in the hardness values when using the same load. Thus, this is attributed to the fact that the load starts to press the indent in a way that makes it no longer possible to measure only one phase, but both simultaneously. Regarding the effect of load on the microhardness, in our study, the HV values generally increased with the applied load for indentation loads up to 20 gf. This is a distinctive feature for a low-load range of loads, and it was encountered in our previous study as well [30]. Generally, when a very low load is employed for measurements, the hardness decreases with the increase in the testing load, which is attributed to the indentation size effect (ISE). In contrast to the ISE, it might happen that the microhardness increases with the increasing load, a phenomenon known as reverse ISE [31]. Analyzing the data presented in Table 1, in our study a reserve ISE dominates the measurements when loads up to 20 gf are employed. On the other hand, by applying loads over 50 gf, one can notice that the hardness values approach a steady state at around 233 HV; thus, the hardness does not vary that much compared to the HV values obtained when using lower loads. However, there were some small differences depending on the hard or soft region where the tip of the intender was fixed and the indentation was performed. From the measurements, the applied load had a detrimental effect on the hardness values, especially when lower loads were employed in the study. According to the measurements, the Ti-20Zr alloy exhibits a hardness that is 1.2 times greater than that of commercially pure Ti, which confirms the superior mechanical strength of the alloy compared to cp-Ti [32,33,34]. The measured microhardness values were used to calculate the indentation depth (in μm) using the formula presented in the experimental part of this work. Analyzing the results presented in Table 1, one can notice that the indentation depth increases with the applied load.

3.3. Electrochemical Characterization

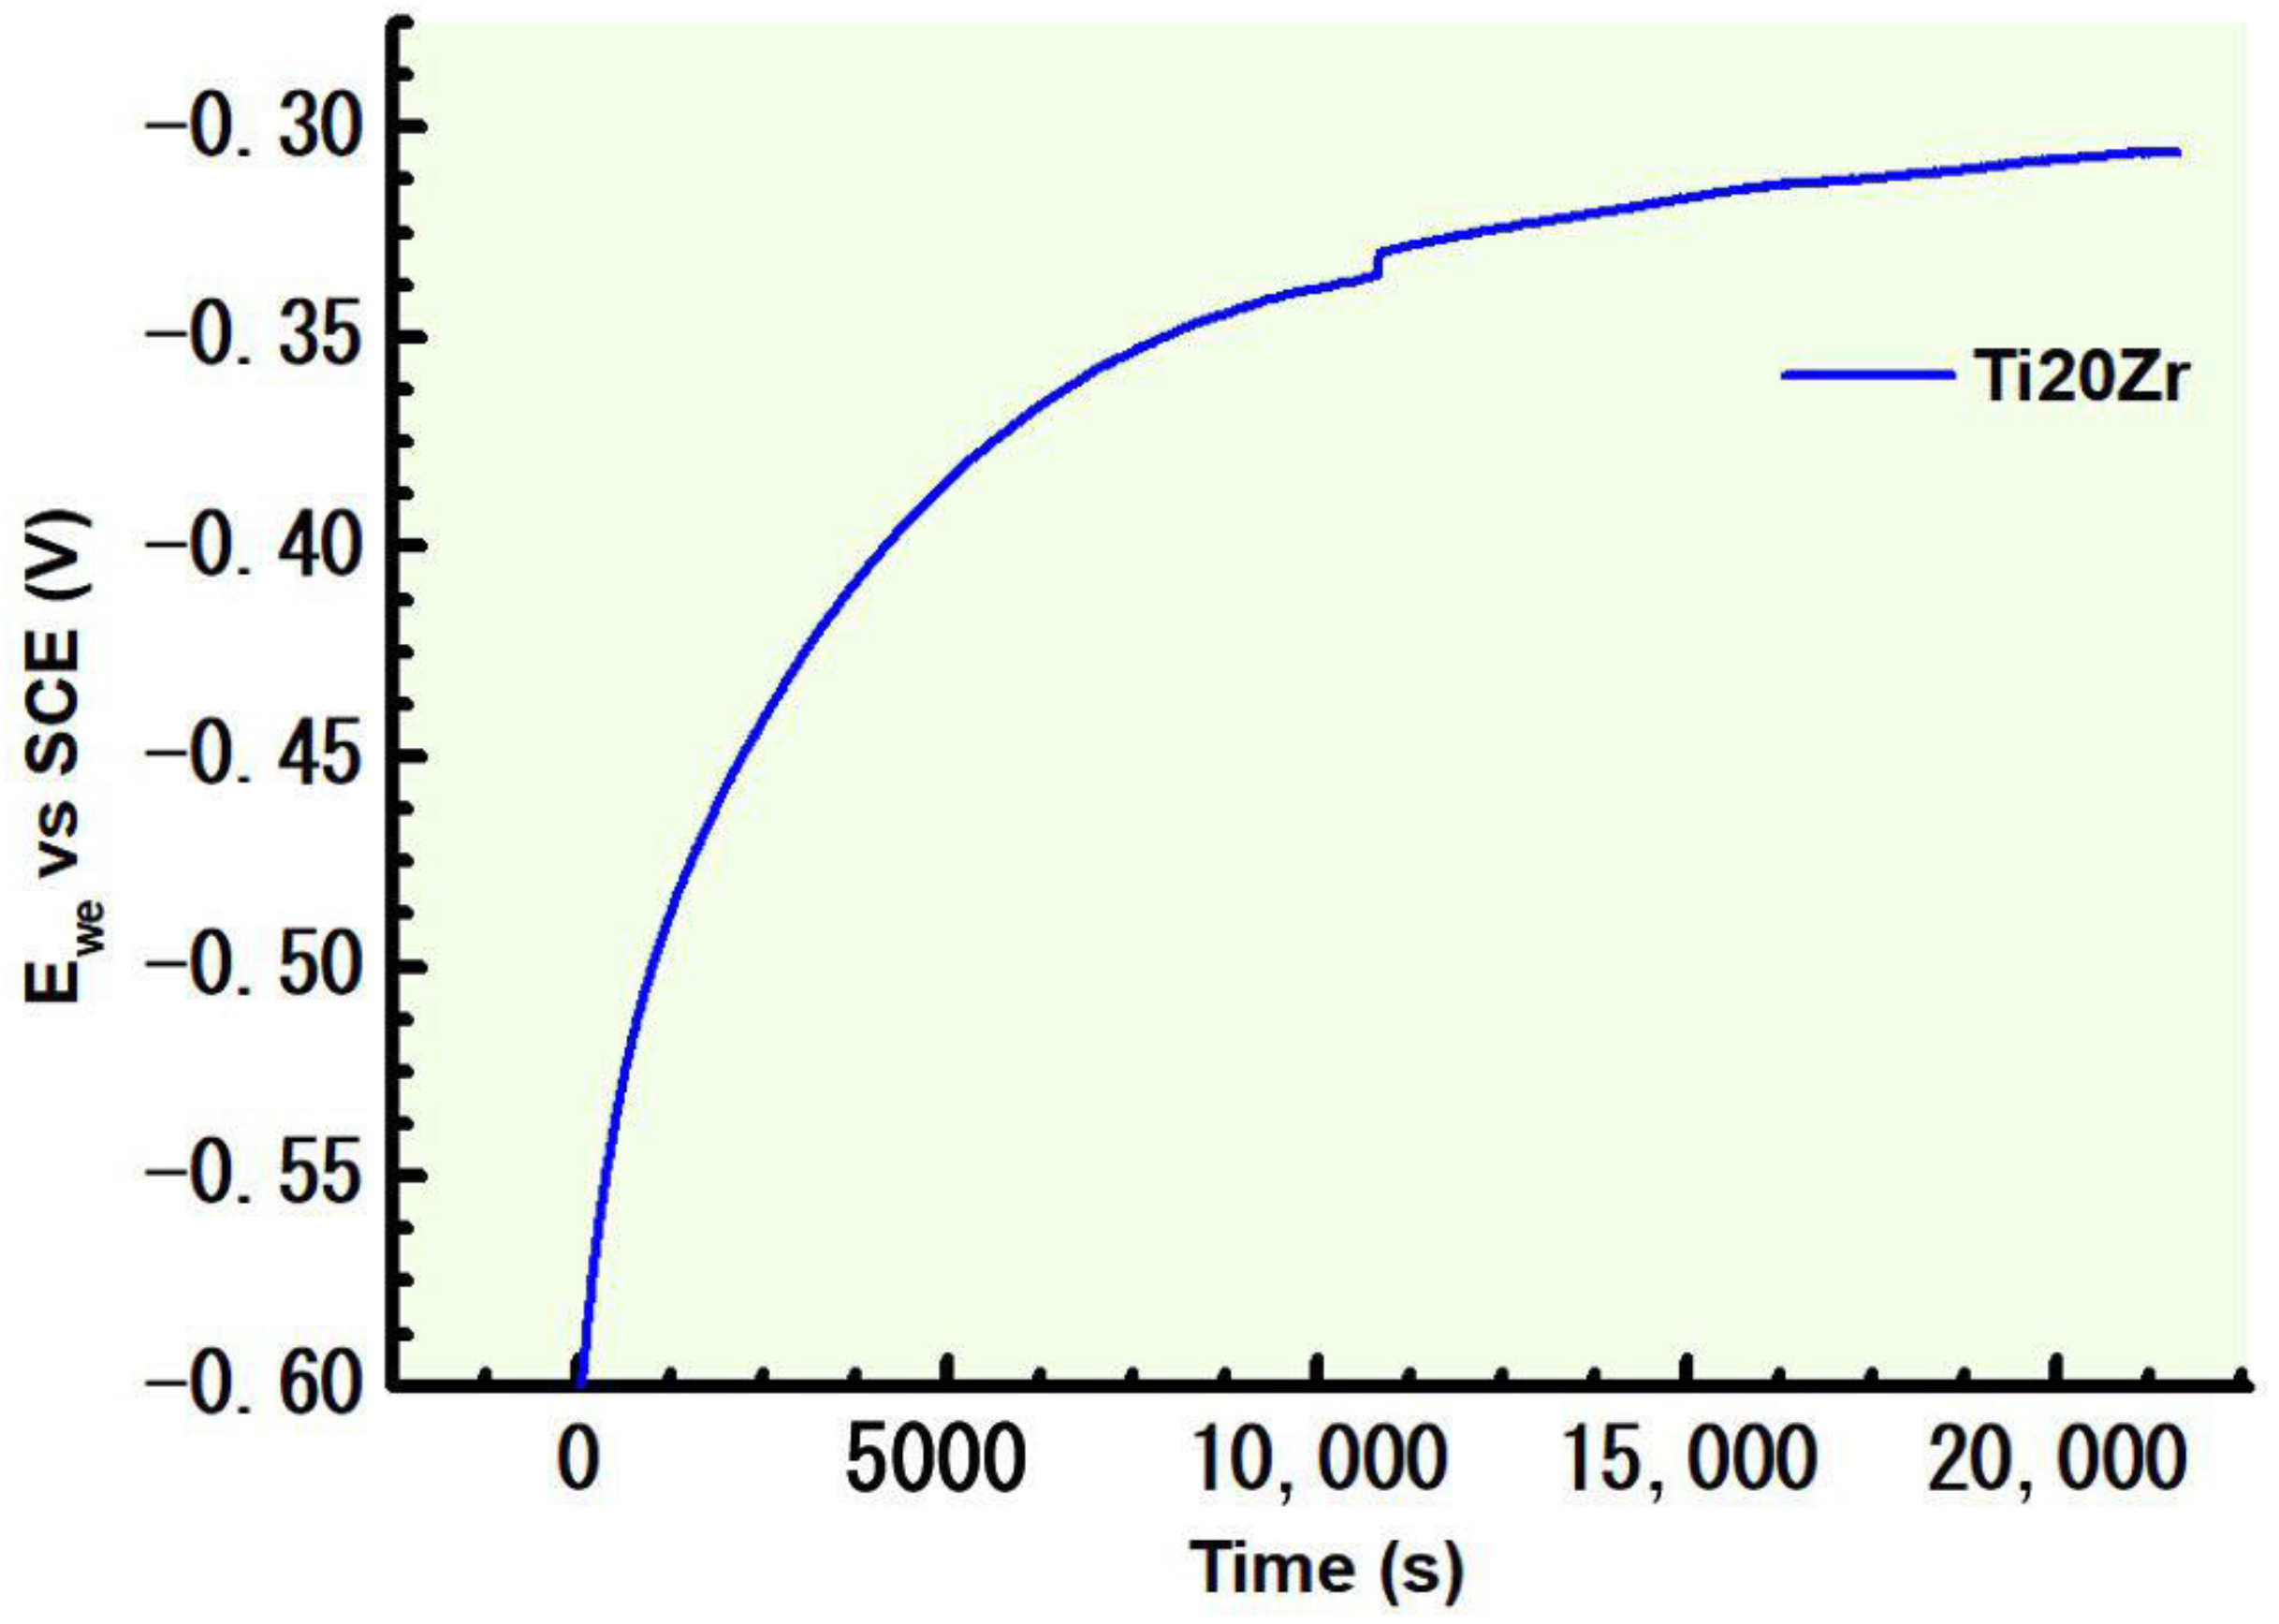
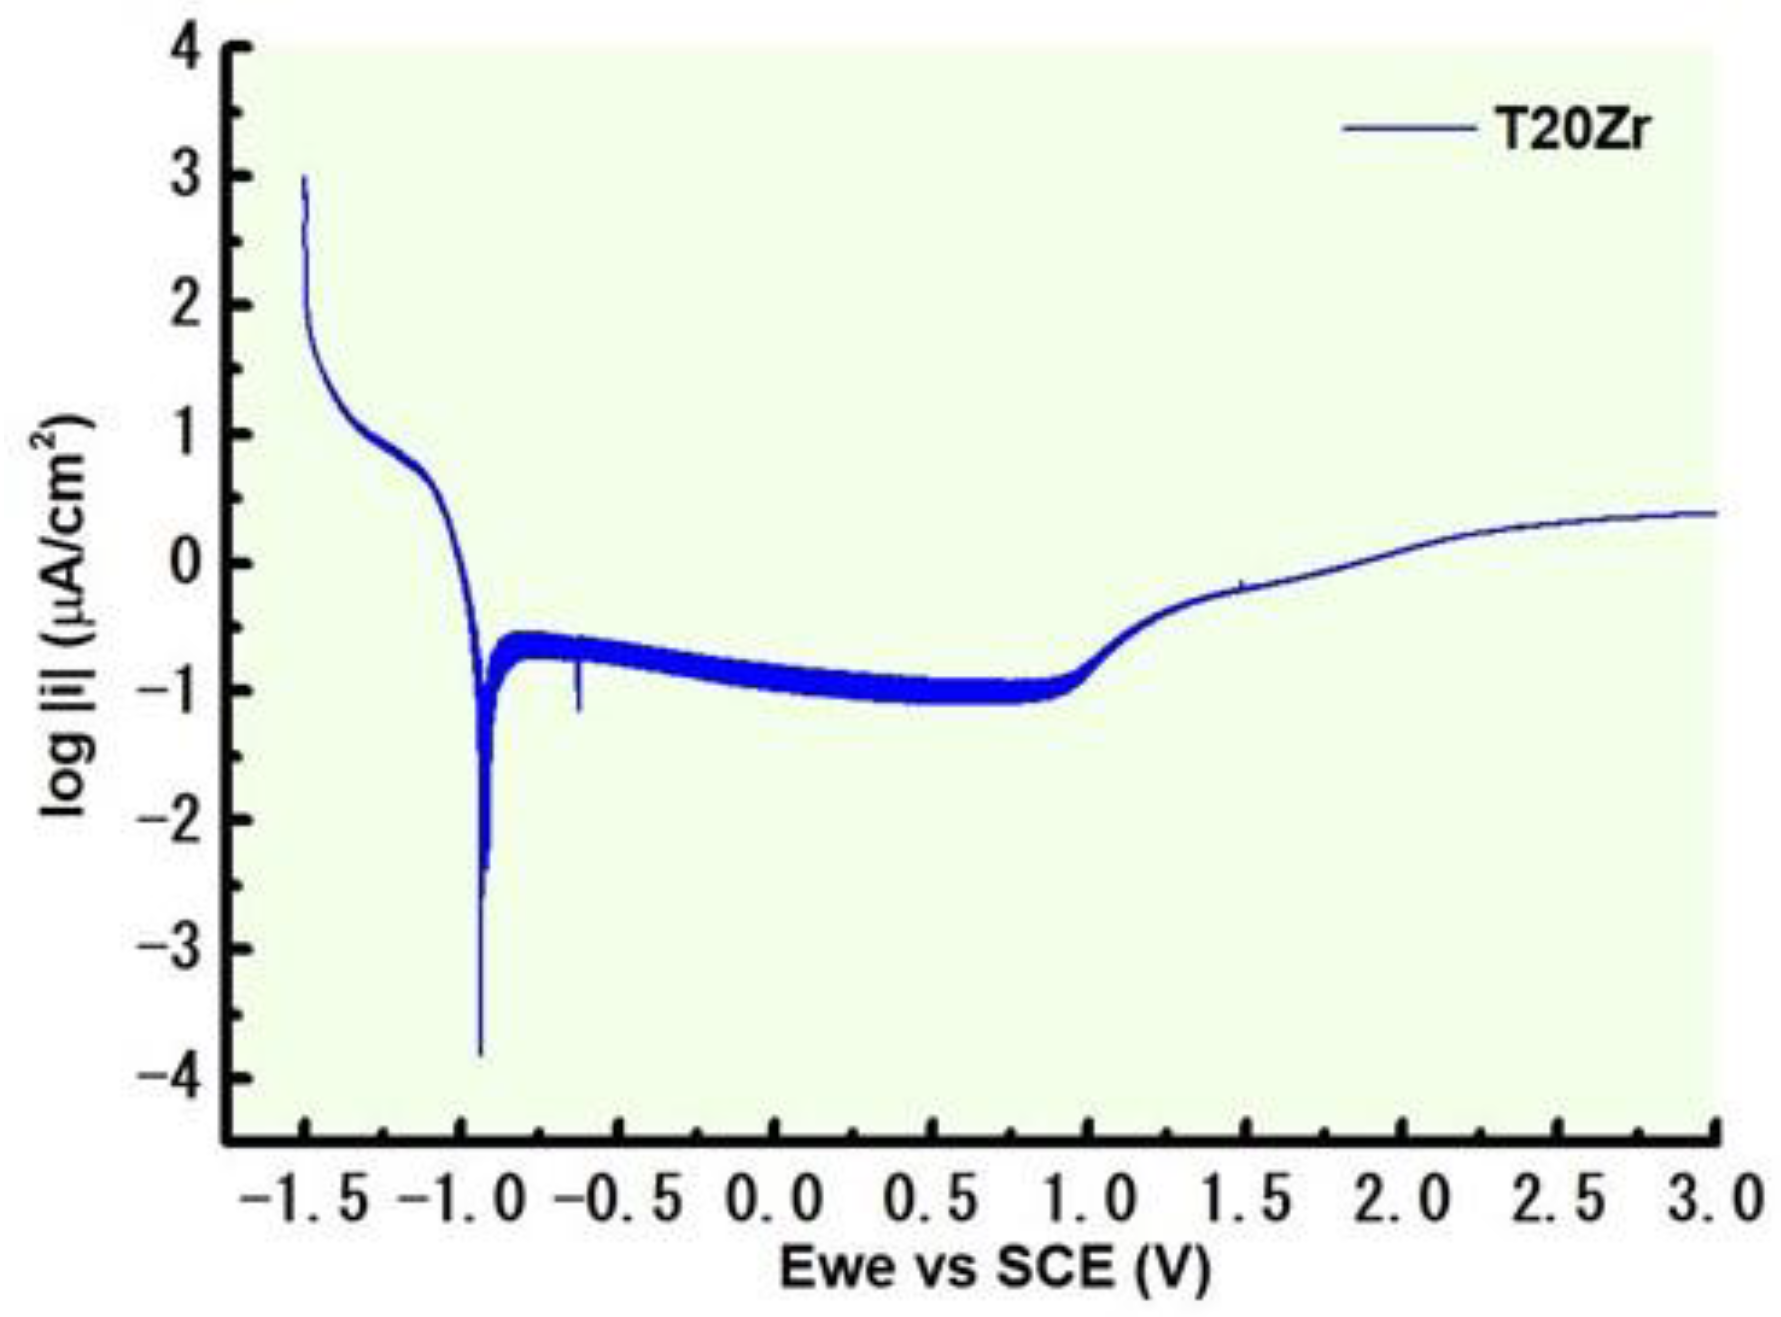
3.3.1. DC Electrochemical Test

Different tests were applied: open-circuit potential (OCP), cyclic voltammetry (CV), and linear polarization. The OCP goal (see Figure 3) is to measure the potential of the sample without affecting, in any way, the electrochemical reactions which take place on the surface of the alloy. It can be observed that after around 4 h, the potential tends towards a cvasi-steady-state value. To determine the potential ranges and kinetics of the various electrochemical reactions of metallic samples in SBF and to choose the most suitable conditions for the potentiostatic study of corrosion reactions, cyclic voltammograms (CVs) were performed on a Ti-20Zr sample at various potential sweep rates. Figure 4 depicts the CVs of Ti-20Zr in simulated body fluid recorded by the potential cycling of the working electrode at 10, 50, 100, and 200 mV/s between −1.50 and +1.50 V vs. SCE.
The CVs show the onset of the hydrogen evolution reaction at potentials below −1.5 V vs. SCE. An anodic current peak at about −1.25 V vs. SCE is observed during the positive-going scan due to the formation of a TiO2 film on the surface. On the other hand, when the potential excursion in the positive direction exceeds −0.5 V vs. SCE, the current is almost zero μA during the rest of the domain of potential, indicating that the passive layer growth on the surface of the sample is very stable and resistant to corrosion. A broad cathodic peak can be observed in the negative-going potential scan, involving the electroreduction of the passive film formed on the metallic surface.
The polarization curve for potentials from −1.5 V to 3 V vs. SCE is presented in Figure 5. According to earlier studies, the passivation behavior in the anodic branch of the polarization curve is seen, and is related to the protectiveness of the corrosion products. According to Zhang et al. [35], the formation of TiO2 and ZrO2 when the alloy contains the right amount of Zr can increase passivation capability, which in turn improves the alloy’s corrosion resistance. Even still, the alloy continues to dissolve as the anodic current density rises, with anodic potential reaching beyond 2 V vs. SCE. The kinetic of the cathodic reaction—oxygen reduction—is suggested by the slope of the polarization curve’s cathodic portion. Current density stability was observed in the anodic region of the polarization curve for potential values greater than approximately −0.75 V, which indicates complete passivation. The anodic portion of the polarization curve shows a significant plateau of passive current.

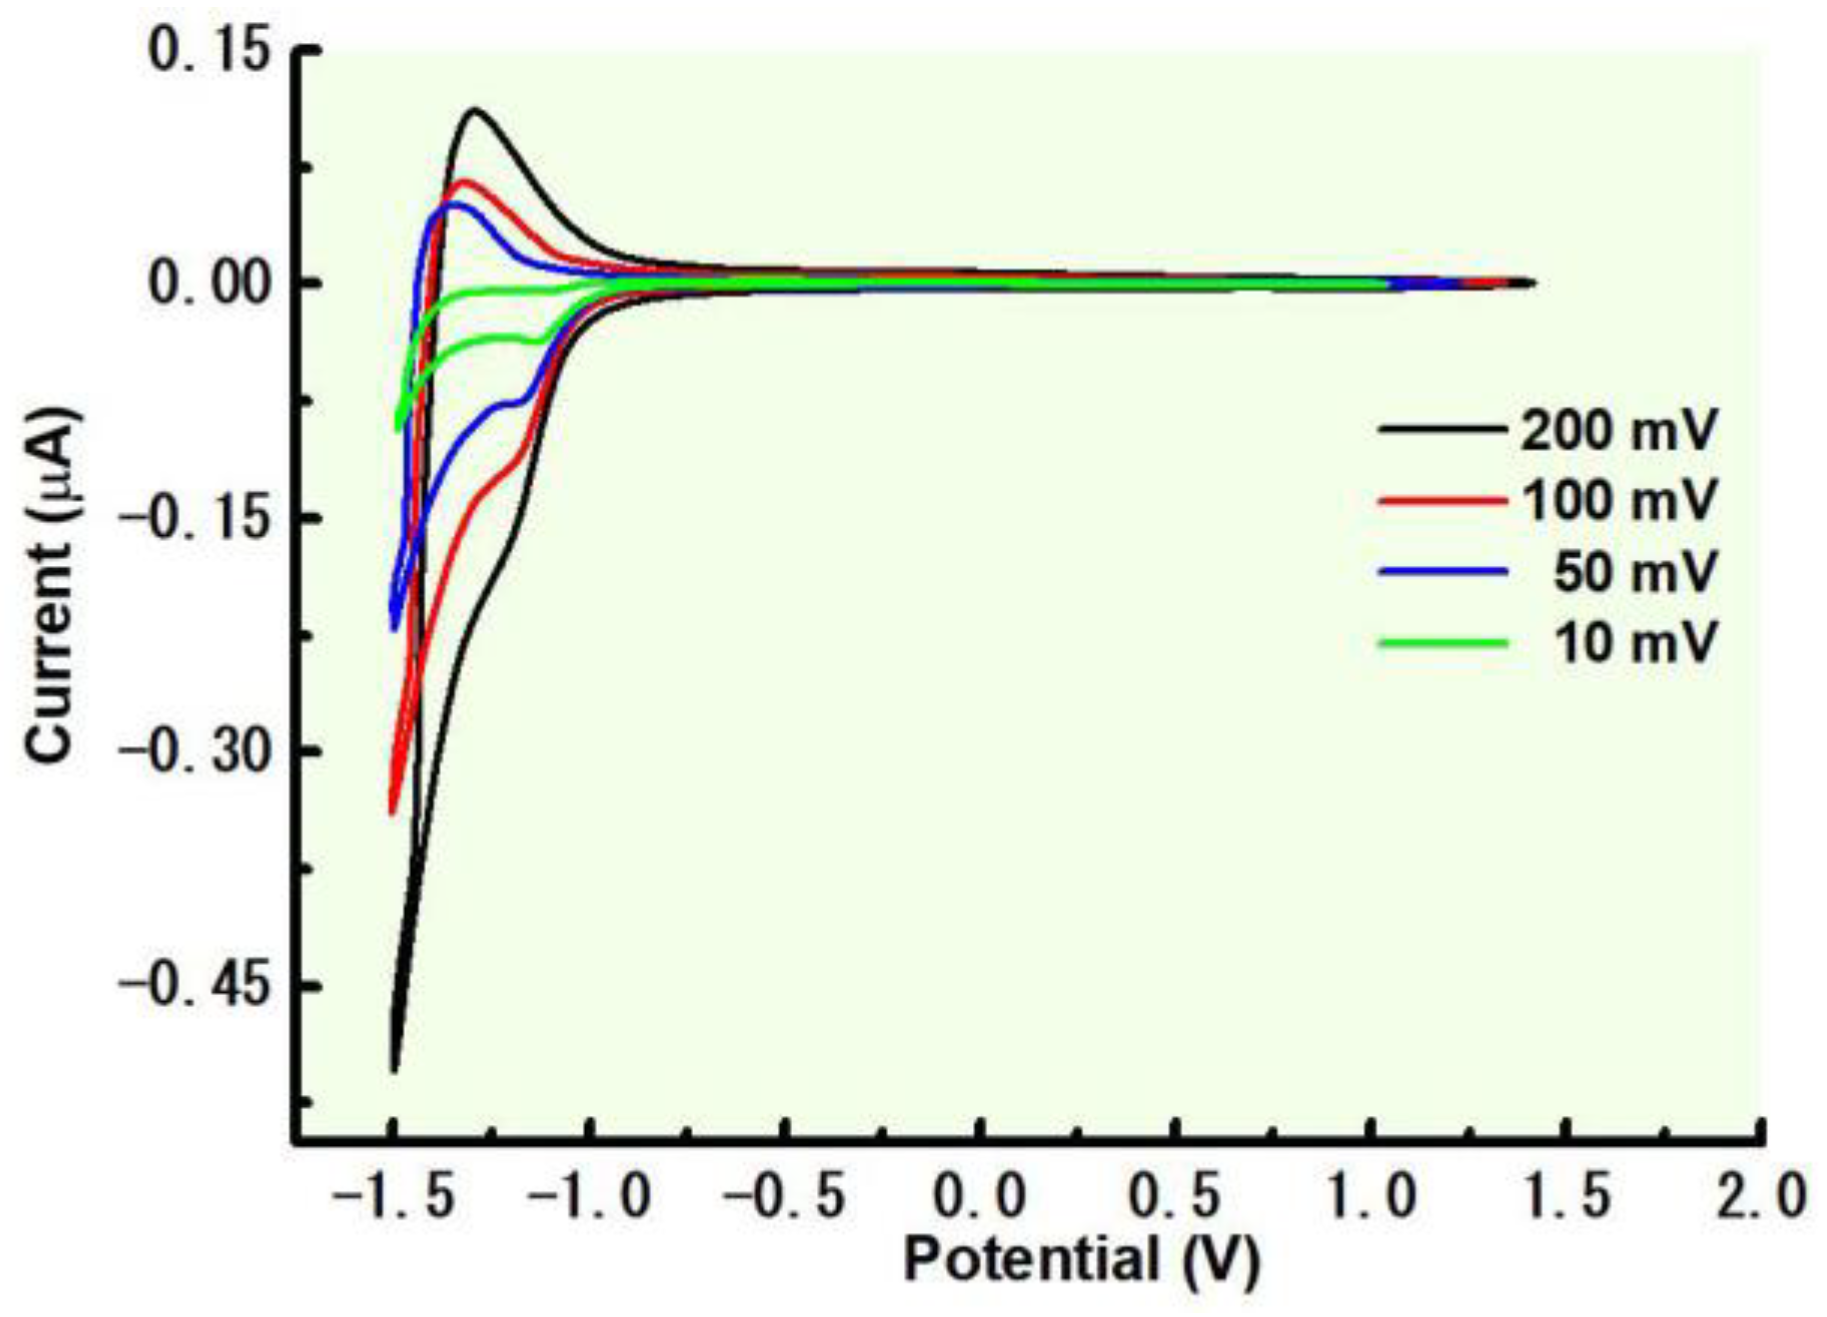
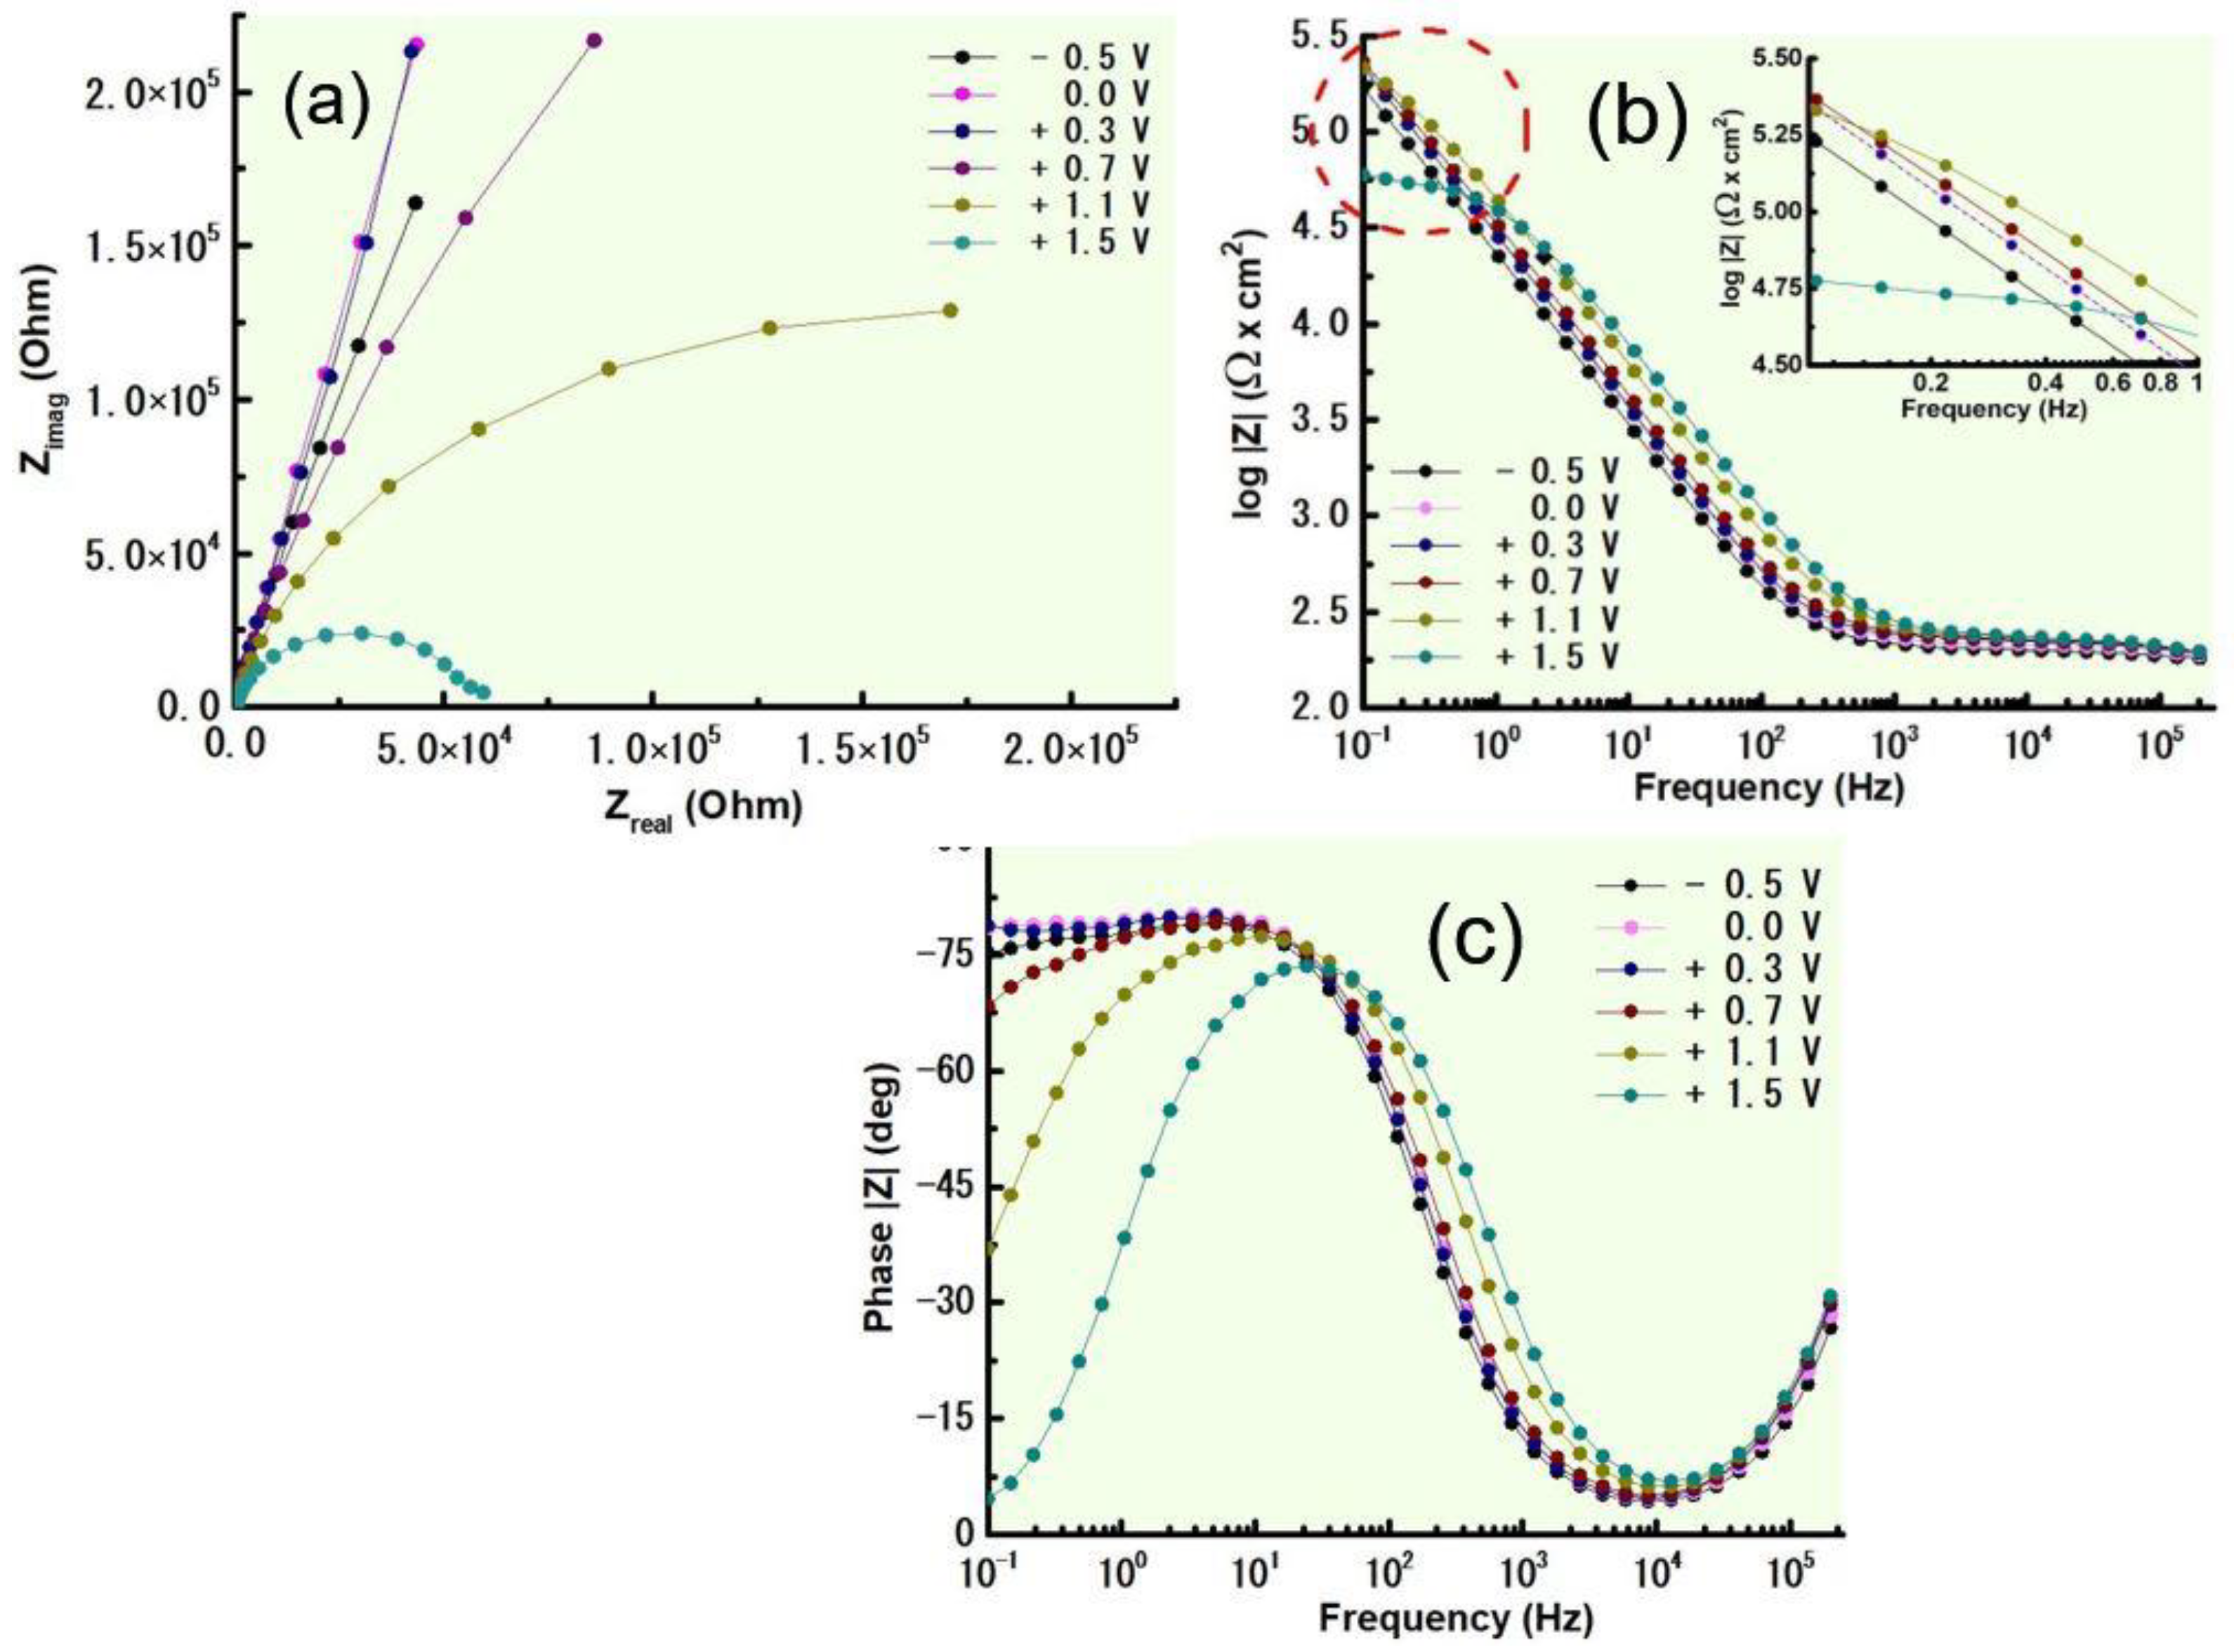
3.3.2. AC Electrochemical Test

Electrochemical Impedance Spectroscopy (EIS) is a potent analytical method employed to analyze the electrochemical processes that occur at the interface of a material immersed in an electrolyte solution. In the context of corrosion analysis, EIS is employed to understand the behavior of metals and alloys as they degrade due to electrochemical reactions. The Nyquist plot (Figure 6a) is a key graphical representation in Electrochemical Impedance Spectroscopy (EIS) analysis. It provides valuable insights into the electrochemical behavior of a system by displaying the impedance data in the complex plane. It can be observed that from −0.5 V to +0.3 V, the radius (and implicitly, the diameter) of the semi-circle is increasing. The diameter of the semi-circle represents the charge transfer resistance (Rct) of the system. A larger diameter indicates a higher charge transfer resistance, which is due to the formation of a protective film on the surface. The center of the semicircle is usually close to the real axis, indicating a negligible solution resistance (Rs). In the positive direction, starting at 0.3 V, the diameter of the semi-circle decreases, and at 1.5 V and lower frequencies, a sloping line or tail might be observed that deviates from the semi-circle. This is called the Warburg tail and is associated with mass transport limitations at the electrode surface, especially in systems involving diffusion-controlled reactions. The slope of the Warburg tail can provide information about the diffusion coefficient of the species involved. The growth of the passive film on the alloy’s surface increases the corrosion resistance, as seen in the Bode IZI diagrams (Figure 6b), where the impedance module shifts toward higher values as potential increases. An inherent characteristic of the initial formation of a passive film on the metal’s surface is shown by the corrosion potential of the Bode-phase diagrams (Figure 6c). The produced film thickens with increasing potential and exhibits a capacitive response, as evidenced by a phase angle near to 90 degrees throughout a broad frequency range. An increase in the capacity (C), which is associated with a rise in the total surface area, is linked to this occurrence.
The resulting experimental data were adapted to an analogous electrical circuit after the profiles of the impedance spectra were analyzed. A set of passive components (resistances, capacitances, inductors, and other types of distributed impedance) that exhibit corrosion-like behavior in the frequency range being studied is known as an equivalent circuit. Better results are obtained using the Constant Phase Element (CPE) introduced by Boukamp [36]; this is a versatile element in electrical equivalent circuits that can capture a wide range of electrochemical behaviors in impedance spectroscopy, especially those involving non-ideal capacitive, inductive, and resistive characteristics. Its parameter “n” allows for the continuous adjustment of the phase angle, enabling a more accurate representation of complex electrochemical systems. Because the value of n is closer to the unit and the surface is more uniform, the response of the real system is closer to the ideal. Therefore, when n equals zero, the CPE element behaves as a basic resistance and a capacitor with capacitance Y0 for n = 1. To fit the EIS experimental data, we used the circuit presented in Figure 7, similar to that used by Wang et al. [34], with the following elements:
-
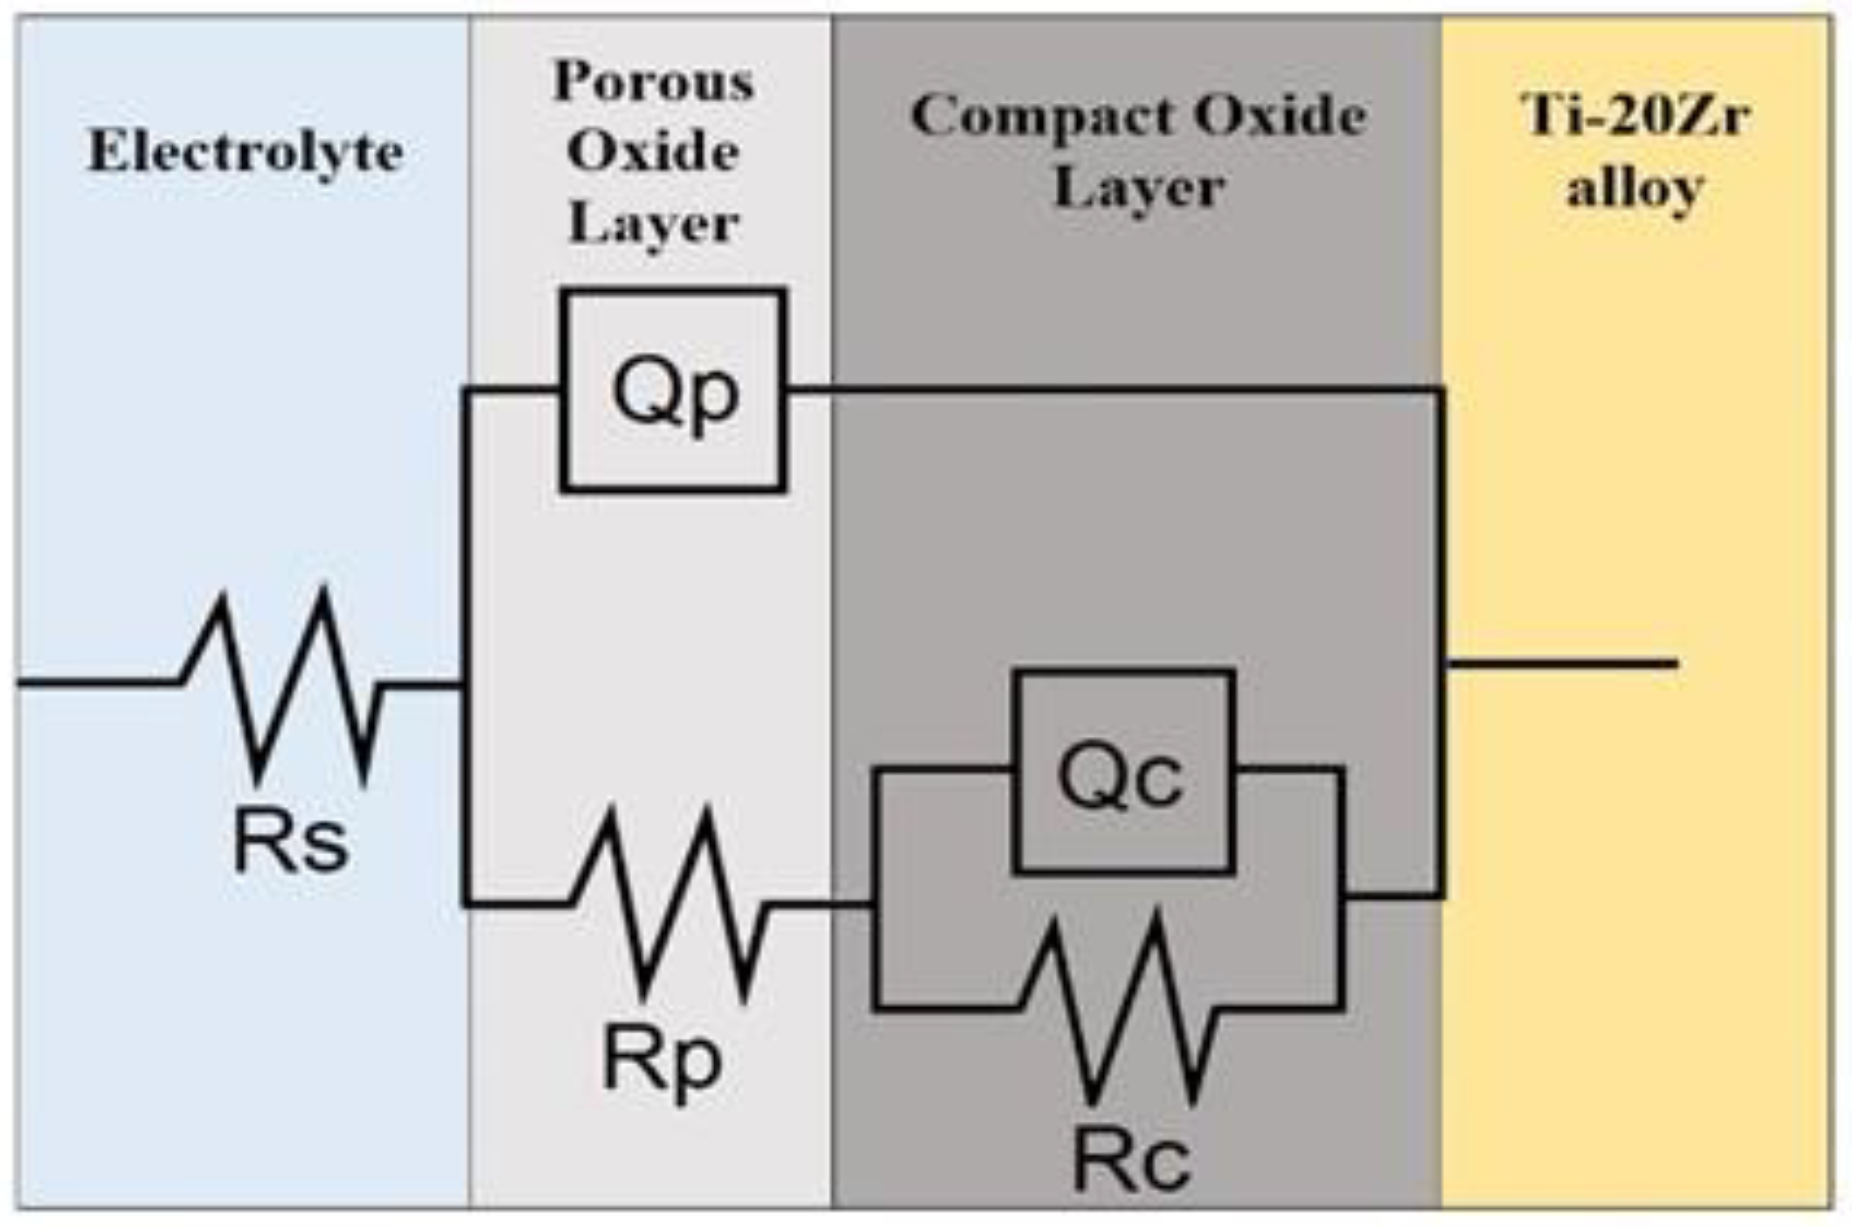
Rs: Solution resistance. The resistance due to the electrolyte solution through which the current passes.
-
Qp: CPE corresponding to the porous external passive layer, characterized by Yp0 and np.
-
Rp: Resistance attributed to the external porous layer.
-
Qc: CPE corresponding to the inner passive layer. characterized by Yc 0 and nc.
-
Rc: Polarization resistance of the alloy.
It can be observed from Table 2 that the corrosion resistance of the alloy across the potential range is more than double the reported values [13] in the absence of heat treatment.

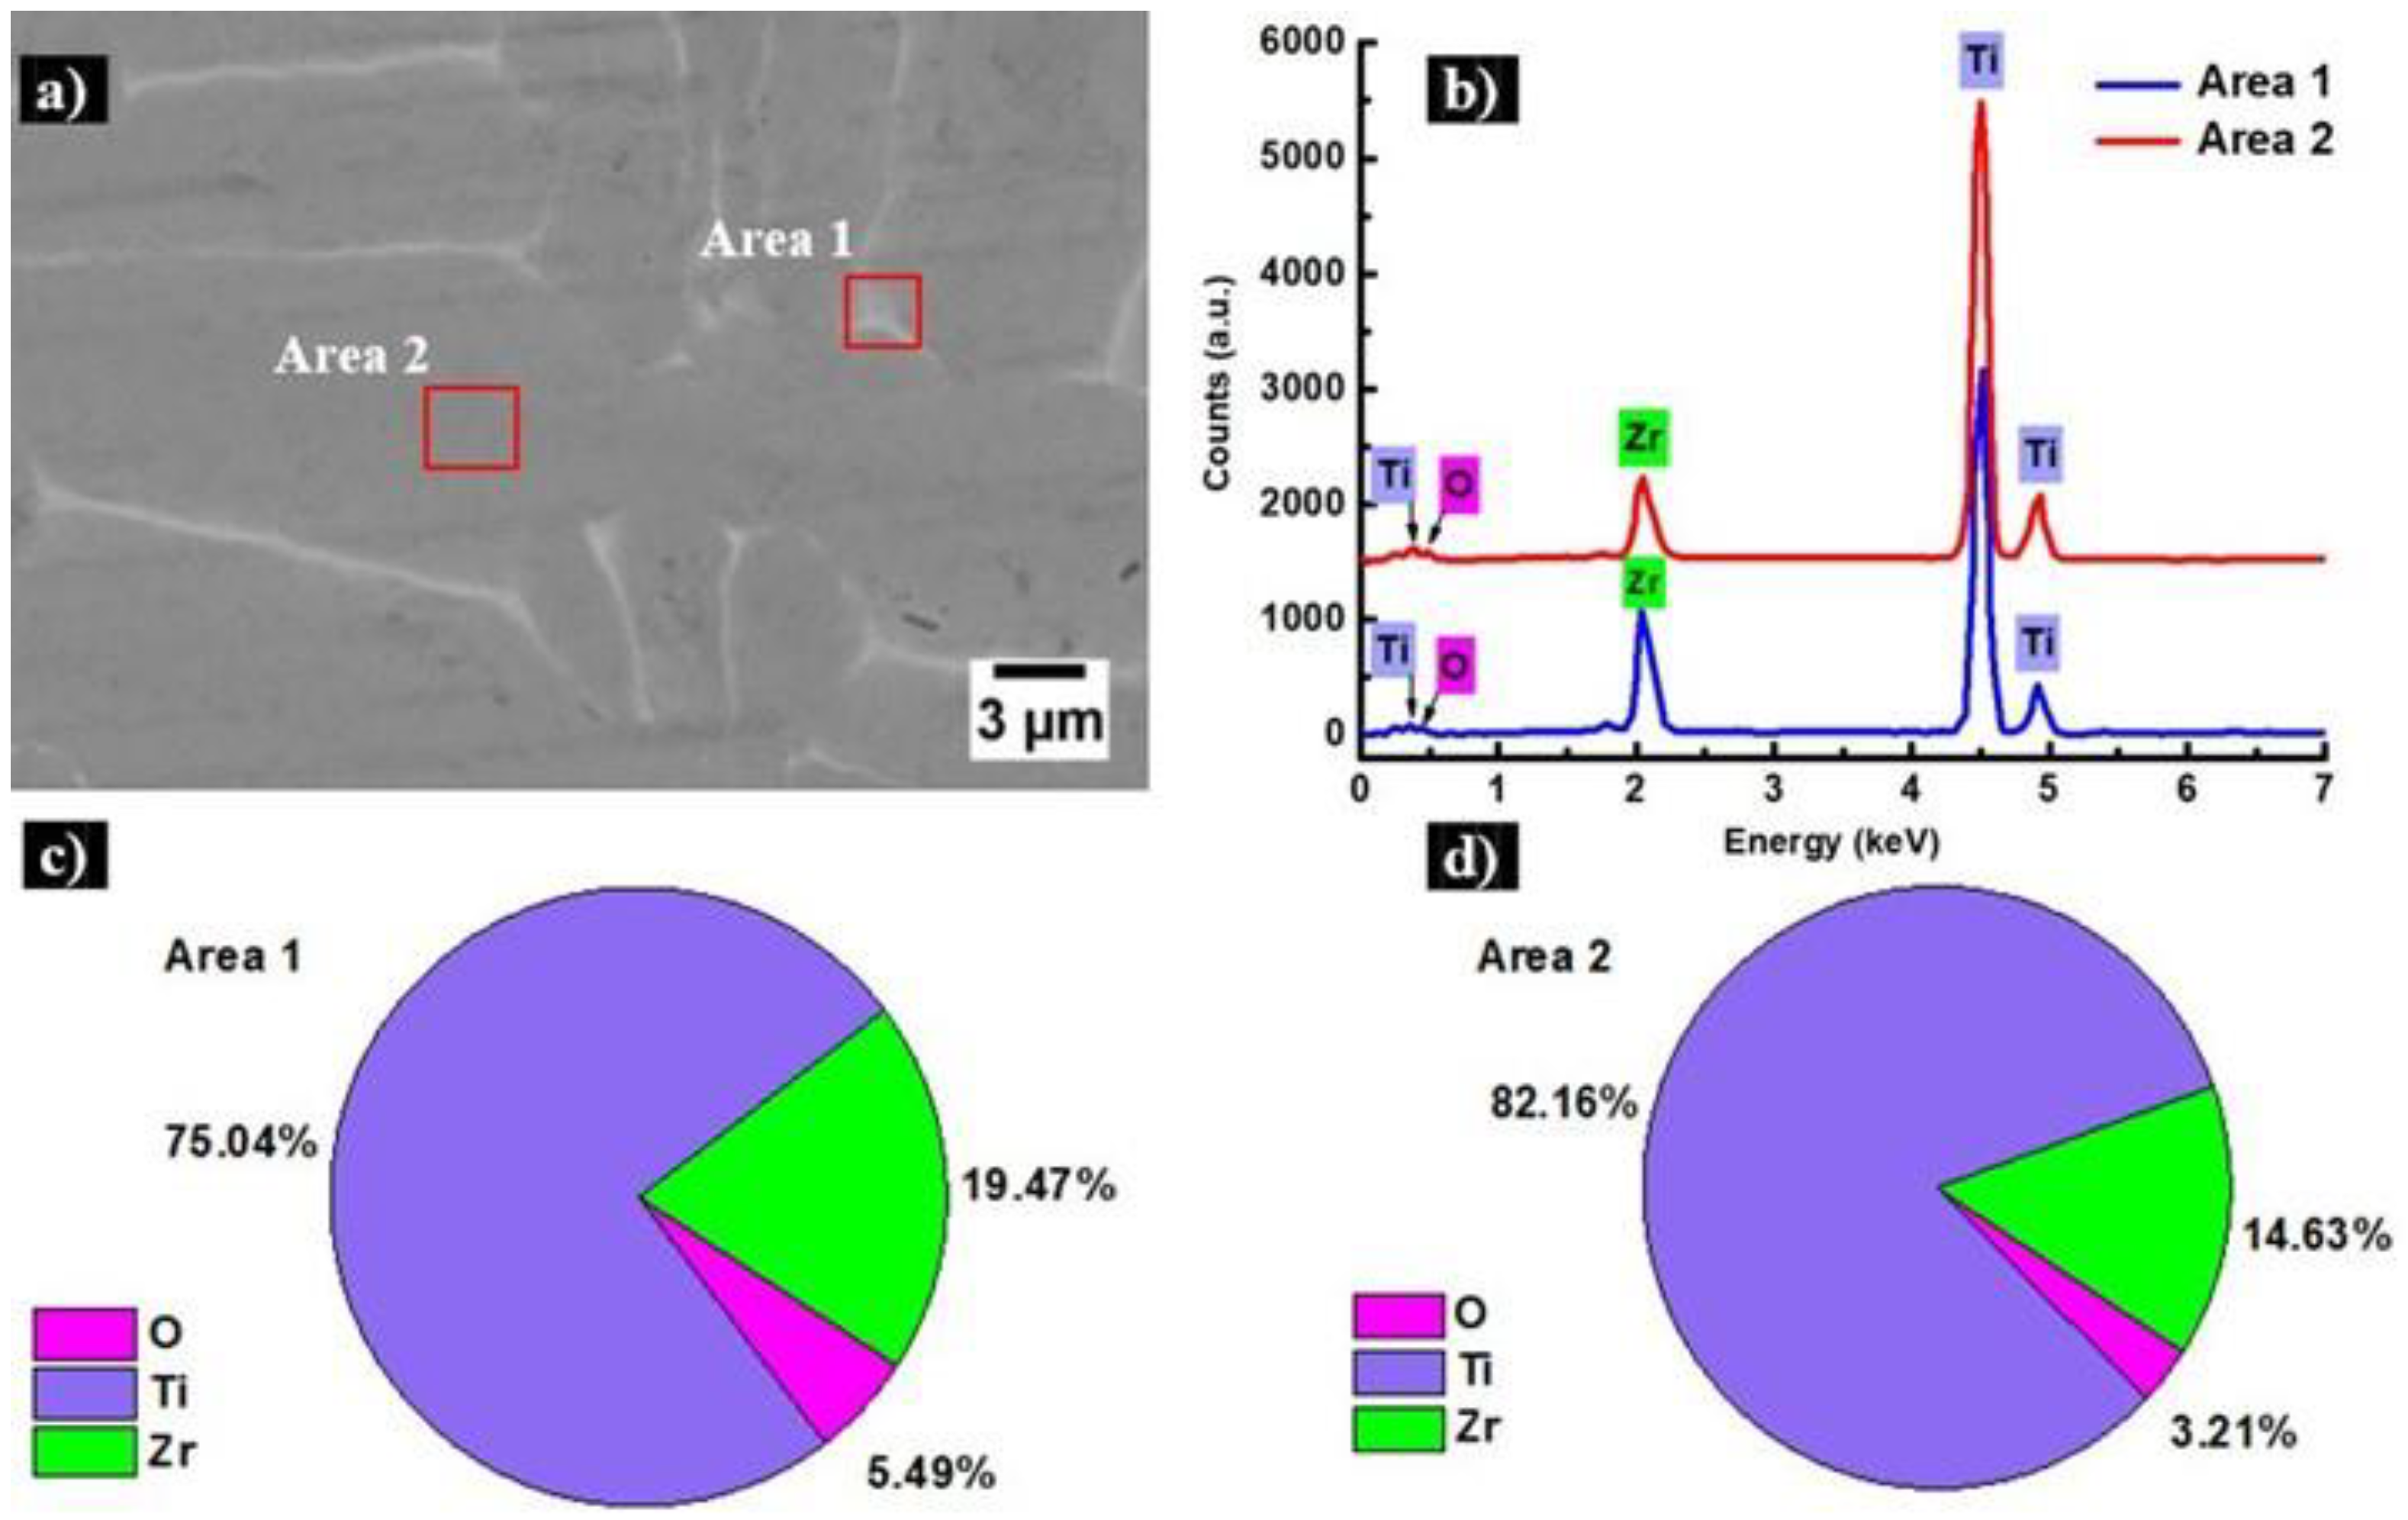
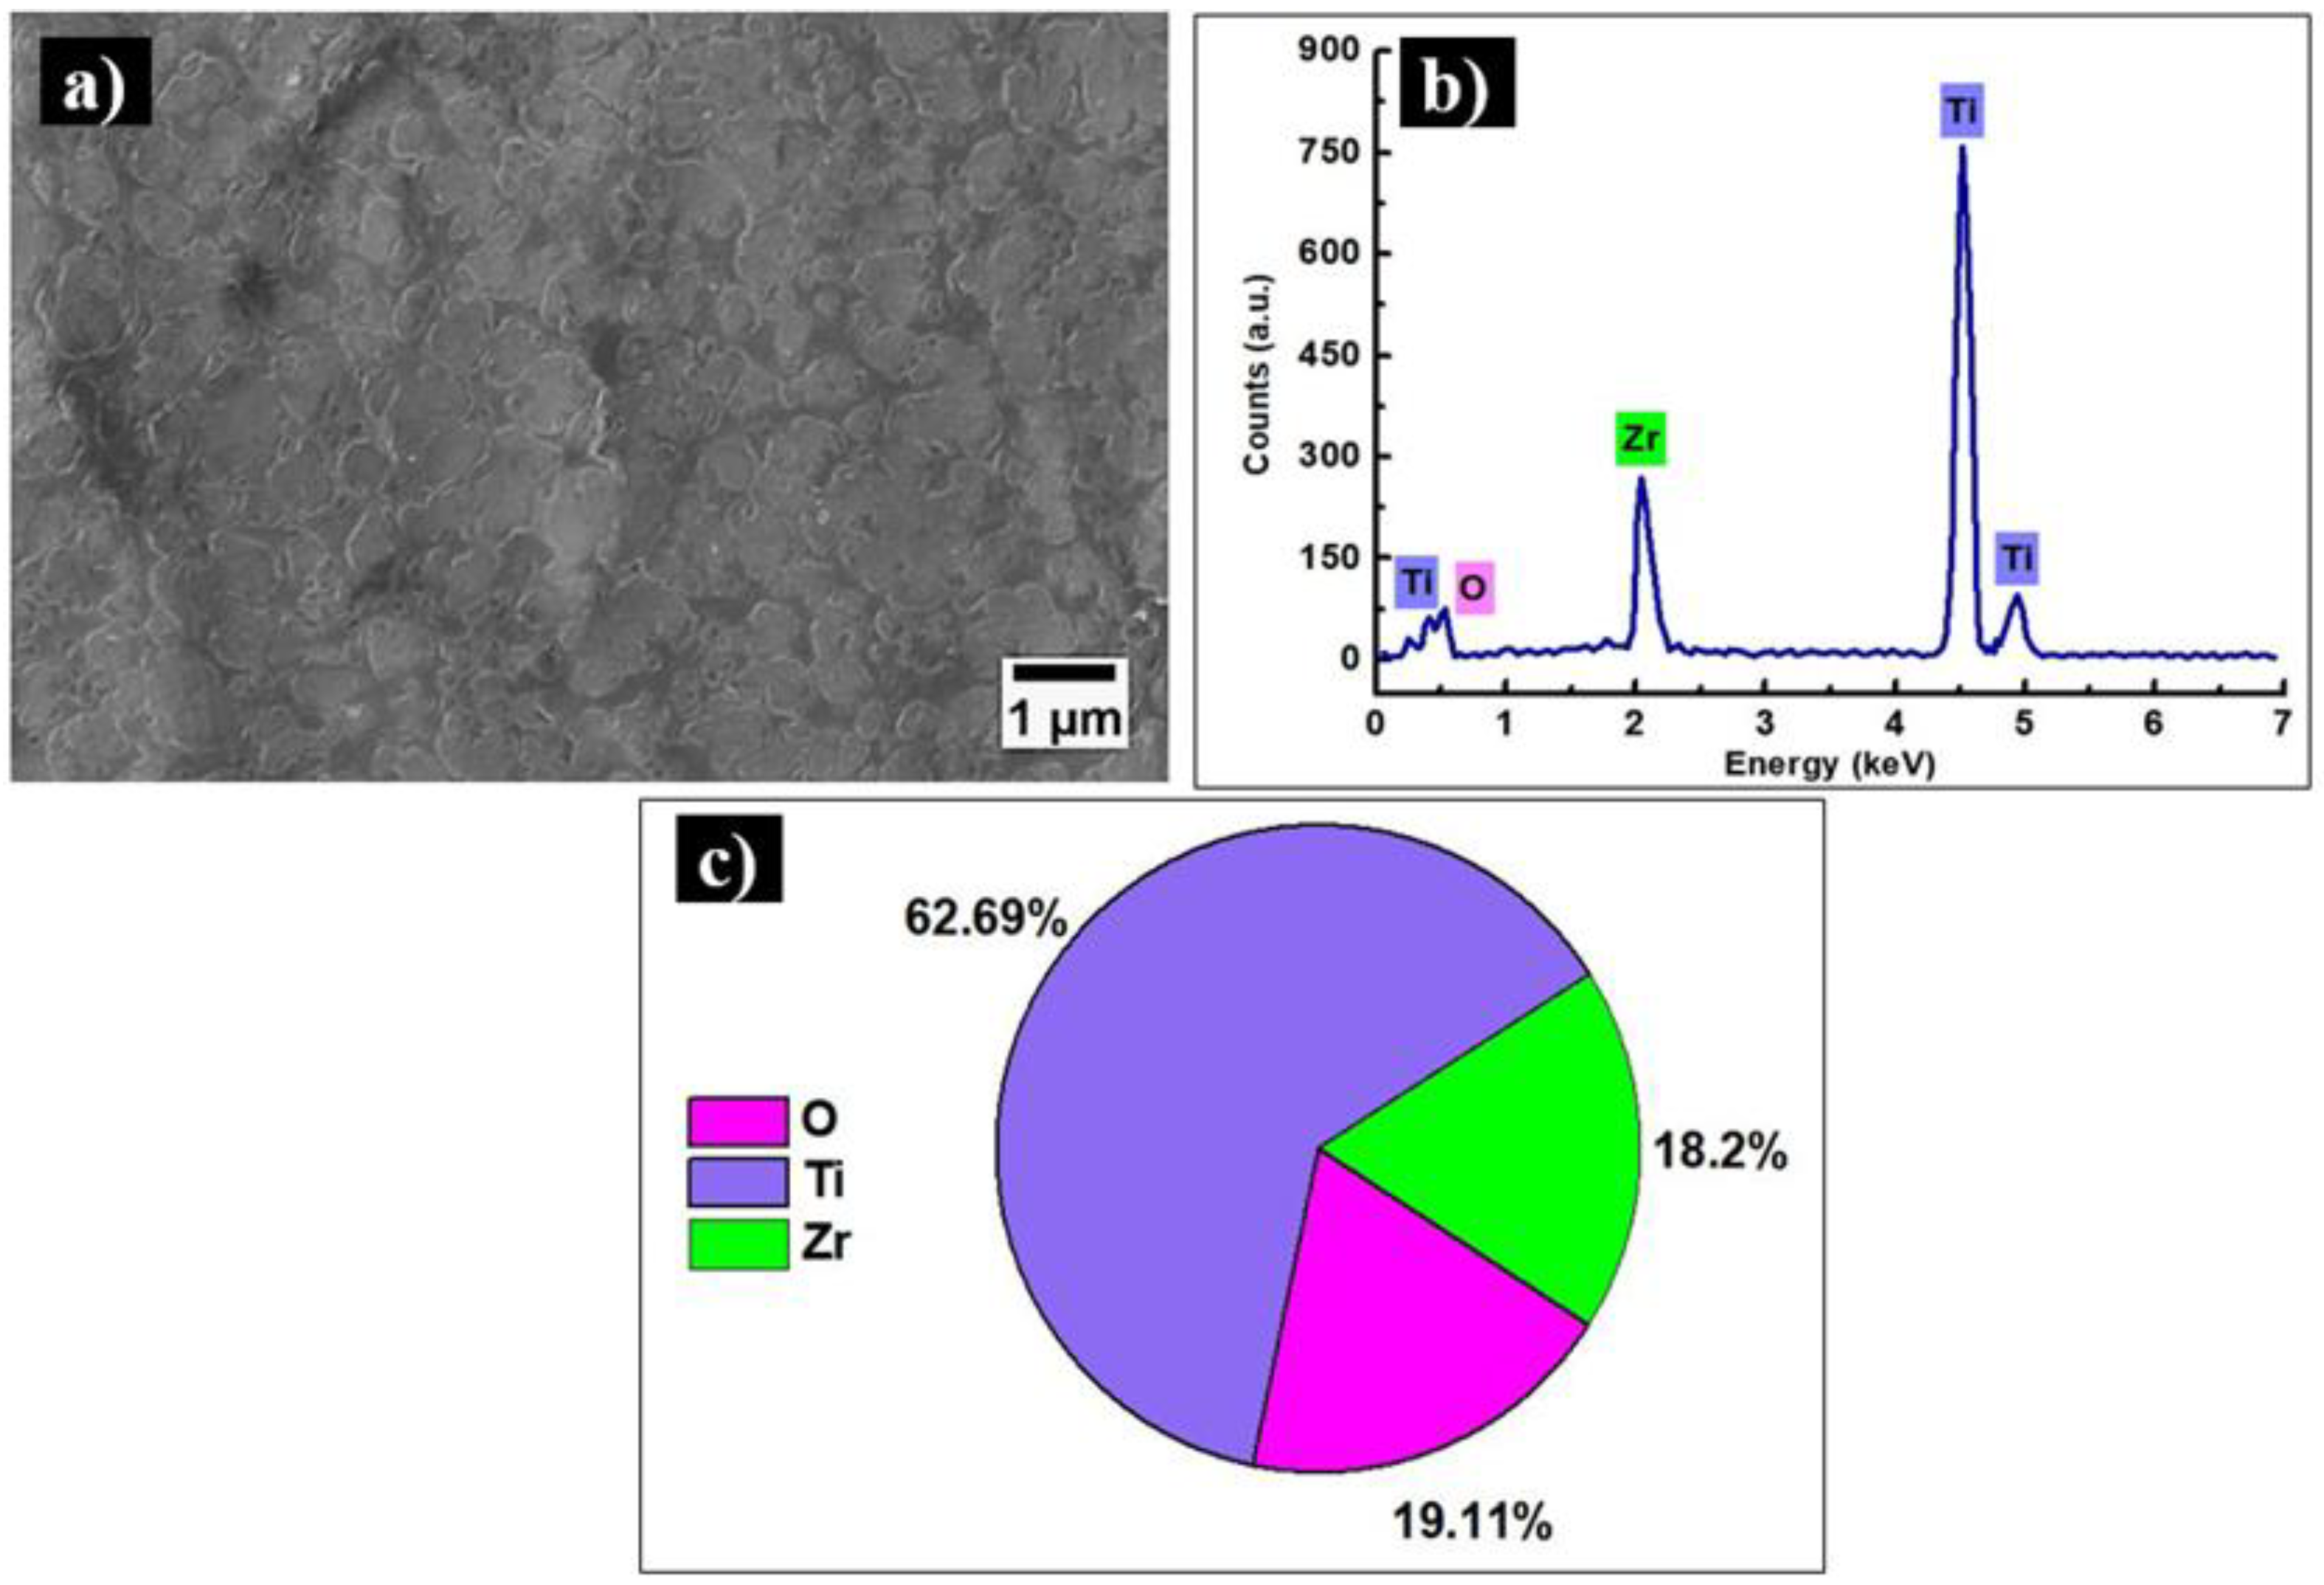
3.4. Scanning Electron Microscopy Observations after Corrosion Tests

Figure 5 shows the topographical surface of the Ti-20Zr alloy, illustrating the impact of simulated body fluid on the sample’s surface. One can see that the passive film has a porous microstructure (Figure 8a) that is suitable for osteoinduction. The EDS spectra (Figure 8b) and quantification (Figure 5c) show the presence of increased oxygen content which, according to the quantification, is about four times higher compared to the samples investigated before the electrochemical tests [23]. Altogether, these prove with the EIS results that the passive film formed on the sample’s surface is an oxide layer, which enhances the corrosion resistance of the alloy.

4. Conclusions

In the present study, the influence of heat treatment at 1000 °C, followed by air-cooling, on the microstructure, mechanical properties, and corrosion behavior of a Ti-20Zr dental alloy were investigated. From the obtained results, the following conclusions can be summarized:
-
The heat-treated Ti-20Zr alloy exhibited a fully lamellar α and β microstructure with α-rich grain boundaries. A fine needle-like microstructure was observed in the vicinity of the grain boundaries. The needle microstructure is a typical α’martensitic phase of Ti which is attributed to the substitutional Zr added to the alloy’s composition, as well as to the heat treatment followed by fast cooling in air.
-
In our study, a reversed ISE dominated the hardness measurements when loads up to 20 gf were employed; moreover, using a low range of loads, the α and β phases could be studied in more detail, and it was found out that the α phase is softer by about 30% in comparison to the β phase.
-
The Ti-20Zr alloy showed better mechanical properties in terms of hardness and estimated tensile strength than cp-Ti and pure Zr. The estimated tensile strength calculated based on the measured hardness values was around 825 MPa, indicating an increased value in comparison to the non-treated Ti-20Zr.
-
The heat treatment applied to Ti-20Zr increased the corrosion resistance across the potential range compared to Ti Cp.
-
Surface analysis by SEM and EDS methods showed that the surface topography is characterized by a porous external film, suitable for the osteoinductive growth of bone. The high concentration of oxygen, compared to the bulk material prior to testing, indicates the formation of a protective oxide layer which enhances the electrochemical properties of the alloy in simulated body fluid.

Author Contributions

Conceptualization, I.H. and J.C.M.-R.; methodology, I.H.; software, S.B.-G.; validation, I.-D.U. and J.C.M.-R.; formal analysis, I.-D.U. and A.V.-V.; investigation, I.H. and S.B.-G.; resources, I.-D.U.; data curation, J.C.M.-R., writing—original draft preparation, I.H.; writing—review and editing, I.H. and J.C.M.-R.; visualization, S.B.-G. and A.V.-V.; supervision, I.-D.U. All authors have read and agreed to the published version of the manuscript.

Funding

The research was supported by Gran Canaria Cabildo, project number CABINFR2019-07, and the Spanish Ministry of Universities and European Union Maria Zambrano, project number SI-1821.

Data Availability Statement

The original contributions presented in the study are included in the article, further inquiries can be directed to the corresponding author.

Conflicts of Interest

The authors declare no conflicts of interest.

References

  1. Elani, H.W.; Starr, J.R.; Da Silva, J.D.; Gallucci, G.O. Trends in Dental Implant Use in the U.S., 1999–2016, and Projections to 2026. J. Dent. Res. 2018, 97, 1424–1430. [Google Scholar] [CrossRef] [PubMed]
  2. Popa, M.V.; Vasilescu, E.; Drob, P.; Anghel, M.; Vasilescu, C.; Mirza-Rosca, I.; Lopez, A.S. Anodic passivity of some titanium base alloys in aggressive environments. Mater. Corros. 2002, 53, 51–55. [Google Scholar] [CrossRef]
  3. Kandaswamy, E.; Harsha, M.; Joshi, V.M. Titanium corrosion products from dental implants and their effect on cells and cytokine release: A review. J. Trace Elem. Med. Biol. 2024, 84, 127464. [Google Scholar] [CrossRef] [PubMed]
  4. Liu, X.; Chen, S.; Tsoi, J.K.; Matinlinna, J.P. Binary titanium alloys as dental implant materials—A review. Regen. Biomater. 2017, 4, 315–323. [Google Scholar] [CrossRef] [PubMed]
  5. Naji, F.A.A.; Murtaza, Q.; Niranjan, M. Challenges and opportunities in nano finishing of titanium alloys for biomedical applications: A review. Precis. Eng. 2024, 88, 81–99. [Google Scholar] [CrossRef]
  6. Vasilescu, E.; Drob, P.; Popa, M.; Anghel, M.; Lopez, A.S.; Mirza-Rosca, I. Characterisation of anodic oxide films formed on titanium and two ternary titanium alloys in hydrochloric acid solutions. Werkst. Und Korros. 2000, 51, 413–417. [Google Scholar] [CrossRef]
  7. Wachi, T.; Shuto, T.; Shinohara, Y.; Matono, Y.; Makihira, S. Release of titanium ions from an implant surface and their effect on cytokine production related to alveolar bone resorption. Toxicology 2015, 327, 1–9. [Google Scholar] [CrossRef]
  8. Brunette, D.M.; Tengvall, P.; Textor, M.; Thomsen, P. Titanium in Medicine; Springer: Berlin, Germany, 2001; ISBN 1868-1212. [Google Scholar]
  9. Exley, C.; Clarkson, E. Aluminium in human brain tissue from donors without neurodegenerative disease: A comparison with Alzheimer’s disease, multiple sclerosis and autism. Sci. Rep. 2020, 10, 7770. [Google Scholar] [CrossRef]
  10. Mirza, A.; King, A.; Troakes, C.; Exley, C. Aluminium in brain tissue in familial Alzheimer’s disease. J. Trace Elements Med. Biol. 2017, 40, 30–36. [Google Scholar] [CrossRef]
  11. Altuna, P.; Lucas-Taulé, E.; Gargallo-Albiol, J.; Figueras-Álvarez, O.; Hernández-Alfaro, F.; Nart, J. Clinical evidence on titanium–zirconium dental implants: A systematic review and meta-analysis. Int. J. Oral Maxillofac. Surg. 2016, 45, 842–850. [Google Scholar] [CrossRef]
  12. Bao, X.; Li, X.; Ding, J.; Liu, X.; Meng, M.; Zhang, T. Exploring the limits of mechanical properties of Ti-Zr binary alloys. Mater. Lett. 2022, 318, 132091. [Google Scholar] [CrossRef]
  13. Takahashi, M.; Kikuchi, M.; Okuno, O. Grindability of Dental Cast Ti-Zr Alloys. Mater. Trans. 2009, 50, 859–863. [Google Scholar] [CrossRef]
  14. Dima, C.; Agop-Forna, D.; Moldoveanu, S.B.; Forna, C.N. Influence of Ti-6Al-4V and Ti-15Zr Dental Implants on the Stress in Mandibular Bone A finite element analysis study. Mater. Plast. 2019, 56, 469–473. [Google Scholar] [CrossRef]
  15. Grandin, H.M.; Berner, S.; Dard, M. A Review of Titanium Zirconium (TiZr) Alloys for Use in Endosseous Dental Implants. Materials 2012, 5, 1348–1360. [Google Scholar] [CrossRef]
  16. Izquierdo, J.; Mareci, D.; Bolat, G.; Santana, J.J.; Rodríguez-Raposo, R.; Fernández-Mérida, L.C.; Burtan, L.; Trincă, L.C.; Souto, R.M. Improvement of the Corrosion Resistance of Biomedical Zr-Ti Alloys Using a Thermal Oxidation Treatment. Metals 2020, 10, 166. [Google Scholar] [CrossRef]
  17. Fukuo, M.; Kariya, S.; Umeda, J.; Kondoh, K.; Yoshiya, M. Strengthening Mechanisms of Powder Metallurgy Extruded CP Titanium Materials with Zirconium and Oxygen Solid Solution via Decomposition of ZrO2 Additives in Sintering. J. Jpn. Soc. Powder Powder Met. 2018, 65, 746–755. [Google Scholar] [CrossRef]
  18. Moreno, J.M.C.; Vasilescu, E.; Drob, P.; Osiceanu, P.; Vasilescu, C.; Drob, S.I.; Popa, M. Surface analysis and electrochemical behavior of Ti–20Zr alloy in simulated physiological fluids. Mater. Sci. Eng. B Solid-State Mater. Adv. Technol. 2013, 178, 1195–1204. [Google Scholar] [CrossRef]
  19. Zhou, H.; Hou, R.; Yang, J.; Sheng, Y.; Li, Z.; Chen, L.; Li, W.; Wang, X. Influence of Zirconium (Zr) on the microstructure, mechanical properties and corrosion behavior of biodegradable zinc-magnesium alloys. J. Alloys Compd. 2020, 840, 155792. [Google Scholar] [CrossRef]
  20. Correa, D.; Vicente, F.; Donato, T.; Arana-Chavez, V.; Buzalaf, M.; Grandini, C. The effect of the solute on the structure, selected mechanical properties, and biocompatibility of Ti–Zr system alloys for dental applications. Mater. Sci. Eng. C 2014, 34, 354–359. [Google Scholar] [CrossRef]
  21. Wang, B.; Ruan, W.; Liu, J.; Zhang, T.; Yang, H.; Ruan, J. Microstructure, mechanical properties, and preliminary biocompatibility evaluation of binary Ti–Zr alloys for dental application. J. Biomater. Appl. 2019, 33, 766–775. [Google Scholar] [CrossRef]
  22. Ou, P.; Hao, C.; Liu, J.; He, R.; Wang, B.; Ruan, J. Cytocompatibility of Ti-xZr alloys as dental implant materials. J. Mater. Sci. Mater. Med. 2021, 32, 50. [Google Scholar] [CrossRef] [PubMed]
  23. Florido-Suarez, N.; Hulka, I.; Mirza-Rosca, J.; Saceleanu, A. Stability Range of Ti-Zr Alloy for Dental Implants. Microsc. Microanal. 2022, 28, 1034–1039. [Google Scholar] [CrossRef]
  24. Issariyapat, A.; Huang, J.; Teramae, T.; Kariya, S.; Bahador, A.; Visuttipitukul, P.; Umeda, J.; Alhazaa, A.; Kondo, K. Microstructure refinement and strengthening mechanisms of additively manufactured Ti-Zr alloys prepared from pre-mixed feedstock. Addit. Manuf. 2023, 73, 103649. [Google Scholar] [CrossRef]
  25. ASM Handbook: Metallography and Microstructures; Voort, G.F.V. (Ed.) ASM International: Novelty, OH, USA, 1992; Volume 9. [Google Scholar]
  26. Salsi, E.; Chiumenti, M.; Cervera, M. Modeling of Microstructure Evolution of Ti6Al4V for Additive Manufacturing. Metals 2018, 8, 633. [Google Scholar] [CrossRef]
  27. Moreno, J.M.C.; Popa, M.; Ivanescu, S.; Vasilescu, C.; Drob, S.I.; Neacsu, E.I.; Popa, M.V. Microstructure, mechanical properties, and corrosion resistance of Ti-20Zr alloy in undoped and NaF doped artificial saliva. Met. Mater. Int. 2014, 20, 177–187. [Google Scholar] [CrossRef]
  28. Chávez, J.; Jimenez, O.; Diaz-Luna, J.; Bravo-Barcenas, D.; Alvarado-Hernández, F.; Flores, M.; Suárez-Martínez, R. Microstructure and corrosion characterization of a Ti-30Zr alloy with Ta additions processed by arc-melting for biomedical applications. Mater. Lett. 2021, 284, 129041. [Google Scholar] [CrossRef]
  29. Min, X.H.; Zhang, L.; Sekido, K.; Ohmura, T.; Emura, S.; Tsuchiya, K.; Tsuzaki, K. Strength evaluation of α and β phases by nanoindentation in Ti–15Mo alloys with Fe and Al addition. Mater. Sci. Technol. 2012, 28, 342–347. [Google Scholar] [CrossRef]
  30. Hulka, I.; Florido-Suarez, N.R.; Mirza-Rosca, J.C.; Saceleanu, A. Ti–Ta dental alloys and a way to improve gingival aesthethic in contact with the implant. Mater. Chem. Phys. 2022, 287, 126343. [Google Scholar] [CrossRef]
  31. Petrík, J.; Palfy, P. The Influence of the Load on the Hardness. Metrol. Meas. Syst. 2011, 18, 223–234. [Google Scholar] [CrossRef]
  32. Jiang, J.; Zhou, C.; Zhao, Y.; He, F.; Wang, X. Development and properties of dental Ti-Zr binary alloys. J. Mech. Behav. Biomed. Mater. 2020, 112, 104048. [Google Scholar] [CrossRef]
  33. Froes, F.H.; Qian, M. Titanium in Medical and Dental Applications; Elsevier: Amsterdam, The Netherlands, 2018; ISBN 9780128124567. [Google Scholar]
  34. Wang, X.; Zhan, W.; Gui, B. Effect of cerium nitrate and salicylic acid on the titanium-zirconium chemical conversion coating of 6061 aluminum alloy. Anti-Corros. Methods Mater. 2020, 67, 205–213. [Google Scholar] [CrossRef]
  35. Zhang, Y.; Davenport, A.J.; Burke, B.; Vyas, N.; Addison, O. Effect of Zr Addition on the Corrosion of Ti in Acidic and Reactive Oxygen Species (ROS)-Containing Environments. ACS Biomater. Sci. Eng. 2018, 4, 1103–1111. [Google Scholar] [CrossRef] [PubMed]
  36. Boukamp, B.A. A Nonlinear Least Squares Fit procedure for analysis of immittance data of electrochemical systems. Solid State Ionics 1986, 20, 31–44. [Google Scholar] [CrossRef]
Figure 1. Optical micrographs of Ti-20Zr alloy at 100× magnification: (a) lamellar structure and (b) grain boundary.
Crystals 14 00493 g001
Figure 2. Microstructure of Ti-20Zr sample: (a) high magnification micrograph collected using BSD detector at 3.000x; (b) EDX spectra with associated quantifications in wt% (c,d).
Crystals 14 00493 g002
Figure 3. Open-circuit potential of Ti20Zr during 6 h of immersion in SBF.
Crystals 14 00493 g003
Figure 4. Cyclic voltammetry spectra for Ti-20Zr tested in simulated body fluid.
Crystals 14 00493 g004
Figure 5. Polarization curve of Ti-20Zr tested in simulated body fluid.
Crystals 14 00493 g005
Figure 6. EIS data: (a) Nyquist diagram; (b) Bode log IZI; (c) Bode phase of Ti-20Zr alloy tested in simulated body fluid.
Crystals 14 00493 g006
Figure 7. The electrical circuit used to fit the experimental data.
Crystals 14 00493 g007
Figure 8. Microstructure of Ti-20Zr sample after corrosion test: (a) surface topography collected using SE detector at 10.000x; (b) associated EDX spectra; and (c) quantification in wt%.
Crystals 14 00493 g008
Table 1. Ti-20Zr microhardness values obtained with different loads and the corresponding indentation depths.
Soft and Hard Phases in Ti-20Zr
Load (gf)PhaseHardness (HV)Indentation Depth (µm)
0.5Soft37.20.7
Hard49.90.6
5Soft163.81.1
Hard288.50.8
10Soft193.91.4
Hard241.71.2
20Soft202.61.9
Hard299.11.6
50Average234.12.8
100Average228.74.1
200Average239.65.6
Table 2. Electrochemical parameters of equivalent circuits.
PotentialYp0
[S·cm−2·sn]
npRp
[Ω·cm2]
Yc0
[S·cm−2·sn]
npRc
[Ω·cm2]
χ2
−0.5 V4.1 × 10−90.95200.18.3 × 10−60.891.3 × 1069.7 × 10−4
0 V5.1 × 10−90.93213.96.5 × 10−60.912.8 × 1068.3 × 10−4
0.3 V5.9 × 10−90.92224.56.5 × 10−60.912.7 × 1069.0 × 10−4
0.7 V6.1× 10−90.92228.35.7 × 10−60.899.1 × 1069.3 × 10−4
1.1 V5.4× 10−90.932324.1 × 10−60.892.9 × 1066.6 × 10−4
1.5 V5.9× 10−90.92233.63.0 × 10−60.895.7 × 1065.1 × 10−4
Disclaimer/Publisher’s Note: The statements, opinions and data contained in all publications are solely those of the individual author(s) and contributor(s) and not of MDPI and/or the editor(s). MDPI and/or the editor(s) disclaim responsibility for any injury to people or property resulting from any ideas, methods, instructions or products referred to in the content.

