Article

Insights into Early Phases of Phycocyanin Crystal Formation via SONICC Spectroscopy

by
Eugenia Pechkova
1,
Paola Ghisellini
2,
Stefano Fiordoro
3,
Cristina Rando
2 and
Roberto Eggenhöffner
2,*
1
Laboratories of Biophysics and Nanotechnology, Department of Experimental Medicine (DIMES), University of Genova Medical School, Via A. Pastore, 3, 16132 Genova, Italy
2
Department of Surgical Sciences and Integrated Diagnostics (DISC), Genova University, Corso Europa 30, 16132 Genova, Italy
3
Department of Health Science (DISSAL), University of Genova Medical School, 16132 Genova, Italy
*
Author to whom correspondence should be addressed.
Crystals 2024, 14(5), 395; https://doi.org/10.3390/cryst14050395
Submission received: 28 March 2024 / Revised: 19 April 2024 / Accepted: 20 April 2024 / Published: 25 April 2024
(This article belongs to the Section Biomolecular Crystals)

Abstract

:
This research delves into the early nucleation stages of phycocyanin, a protein pivotal for its fluorescent properties and crystalline stability and holding considerable potential for biotechnological applications. The paper contrasts traditional crystallization methods with the innovative Langmuir–Blodgett nanotemplate approach, aiming to enhance molecular assembly and nucleation processes. The study employs Langmuir–Blodgett nanotemplates alongside second-order nonlinear imaging of chiral crystal (SONICC) spectroscopy. This combination is designed to orderly organize phycocyanin molecules and provide a sensitive visualization of early-stage crystal formation, capturing the intricate dynamics of protein crystallization. The experiments were conducted under controlled conditions, where surface pressure was maintained at 26 mN/m and barrier speed at 70 cm/min to optimize the monolayer formation at the air–water interface. The Langmuir–Blodgett method, compared to traditional vapor diffusion techniques, shows improvements in the uniformity and efficiency of nucleation. The sensitivity of SONICC spectroscopy significantly enhances the visualization of the nucleation process, revealing a more structured and uniform crystalline assembly in the early stages of formation. This method demonstrates a substantial improvement in nucleation dynamics, leading to a more orderly growth process and potentially larger, well-ordered crystals. Integrating Langmuir–Blodgett nanotemplates with SONICC spectroscopy offers a significant step in understanding protein crystallization processes with insights into the nucleation and growth of protein crystals and broad implications for refining crystallography methodologies of protein-based biomaterials, contributing to the advancement of structural biology and materials science.

1. Introduction

Protein X-ray crystallography will continue to be the most effective technique for obtaining the three-dimensional (3D) atomic structures of proteins in the near future [1]. Nonetheless, the main challenge remains in the formation of protein crystals and ensuring their quality, which encompasses factors like orderliness, diffraction intensity, and stability against radiation [2]. High-quality crystals are essential for determining the 3D atomic structures of proteins, which are crucial for molecular biology [3]. They offer significant insights into protein function, dynamics, and interactions within biological systems followed by important application [4].
Among the multitude of proteins, phycocyanin (PC), a light-harvesting phycobiliprotein largely found in cyanobacteria and red algae [5], has gained considerable attention due to its crucial function in photosynthesis and its promising applications in biotechnology and bioenergy conversion [6]. The unique properties of PC, including its fluorescent characteristics and ability to form stable crystals, make it an attractive candidate for various applications, ranging from therapeutic agents to components in bio-photovoltaic devices [7,8,9].
Understanding the initial stages of crystal formation is difficult due to their intricate and evolving characteristics. Conventional techniques have offered only restricted understanding of these early phases, mainly because of their limited resolution and the challenge of observing the ephemeral, transitional states of crystal nucleation and growth [10]. The investigation of the mechanisms involved in the crystallization of PC protein is conducted with the aim of understanding its significant characteristics, as previously described [11].
In the present work, we applied classical hanging drop (HD) and Langmuir−Blodgett (LB) nanotemplate crystallization methods for crystallization trials. The HD method involves placing a small droplet of protein solution mixed with a precipitant on the underside of a coverslip, which is then inverted over a reservoir containing the same precipitant. This setup creates a vapor pressure difference, encouraging solvent evaporation from the droplet and leading to protein supersaturation and nucleation. Specific steps include mixing a protein solution with a precipitant on a siliconized glass cover slide and inverting the slide over a reservoir filled with the precipitant solution.
In the past decade, the nanotemplate crystallization method has provided new opportunities to trigger and accelerate protein crystal growth, as well as originate crystals that are more ordered and radiation-stable ([12] and references therein). This study is crucial for establishing the effectiveness of LB methods in protein crystallization. Pechkova and Nicolini demonstrated that LB nanotemplate crystallization could trigger and accelerate protein crystal growth, leading to more ordered and radiation-stable crystals. This foundational work directly influences the current study’s methodology by providing a platform comparable to traditional hanging drop crystallization methods. Thus, the LB method offers a more controlled approach by spreading a protein monolayer at the air–water interface and subsequently transferring this organized layer onto a solid substrate. This method facilitates ordered molecular assembly, crucial for uniform crystal growth. Key steps include the spreading a defined volume of protein solution across a specially prepared air–water interface in a Langmuir trough; compressing the monolayer to achieve the desired surface pressure, optimized for phycocyanin at 26 mN/m, using a barrier; and transferring the monolayer onto solid substrates using either vertical or horizontal lifting techniques. The HD method was chosen since it has a standard widespread use in crystallization. However, its limitations in controlling nucleation prompted us to also utilize the LB nanotemplate method. The LB method was specifically selected for its ability to induce more ordered and potentially radiation-stable crystal formation due to the precise control it offers over protein assembly at the molecular level. The uniformity and repeatability of PC LB multilayer deposition have been confirmed by quartz crystal microbalance and atomic force microscopy.
We hereby propose the utilization of this ordered protein nanotemplate for the comparative study of the first steps of PC crystallization by second-order nonlinear imaging of chiral crystal (SONICC) spectroscopy [13,14,15]. The SONICC imaging was performed using an Integrated ROCK IMAGER 1000 (Formulatrix, Dubai, United Arab Emirates), equipped with ultrafast laser sources capable of delivering 100 fs pulses. This setup is optimized for second harmonic generation (SHG) detection.
Its advent has opened new avenues for probing the elusive early stages of PC crystal formation. The technique, distinguished by its sensitivity to chiral structures and capacity to detect nanoscale crystalline formations, has shown promise in bridging the gap in our understanding of protein crystallogenesis [16]. By leveraging the unique optical properties of chiral crystals, SONICC spectroscopy facilitates the visualization of nascent PC crystals, shedding light on the mechanisms underlying their formation and the factors influencing their growth dynamics. The insights garnered from SONICC spectroscopy extend beyond the realm of PC, offering potential breakthroughs in structural biology, materials science, and nanotechnology. The ability to monitor crystal formation in real time paves the way for optimizing crystallization conditions, enhancing the quality of crystal structures for X-ray crystallography and potentially unveiling novel biomaterials with tailored properties. Thus, the practical application of SONICC in detecting protein crystals can be regarded as strongly proven [15], including within optical sub-diffraction limits.
This paper discusses the advent of SONICC spectroscopy and its applications in probing elusive stages of crystal formation. The findings validate the use of SONICC for detailed observation of crystal growth dynamics, which complements the current study’s focus on comparing crystallization methods for PC.
In this context, our study aims to elucidate the early stages of PC crystal formation by PC LB nanotemplate through the lens of SONICC spectroscopy by investigating its application to the examination of LB nanofilms, offering novel insights into the assembly and functional potential of protein-based nanomaterials. Thus, a detailed exploration of how SONICC can contribute to understanding the intermolecular order of light-harvesting proteins in LB nanofilms, i.e., the hierarchical arrangement of protein molecules into functional biomaterials through mesoscale self-assembly. By integrating findings from our previous works with recent advancements in the field, we endeavor to construct a comprehensive description of PC crystallization considering the wide implications for further research.

2. Materials and Methods

2.1. Protein Sample Preparation

PC protein was extracted from elongated Thermosynechococcus cyanobacteria (T. elongatus); the purification and concentration protocol were performed as previously described in [17]. Thermosynechococcus elongate (T. elongated) cells were subjected to pretreatment using a microfluidizer to disrupt cell walls in a French pressure cell press (Model: M-110P, Microfluidics, Westwood, MA, USA) operated at a pressure of 20,000 psi to ensure efficient cell lysis while minimizing heat generation which could denature the protein. Eventually, a series of centrifugation steps aimed at separating the thylakoid membrane from the cell mixture was performed. The crucial ultracentrifugation step was used to isolate phytobiliproteins, particularly PC and allophycocyanin, from the supernatant. This process also ensured the removal of larger particles and cellular debris, which were allowed to settle at 50,000 g for one hour. To obtain the required protein concentration, the clarified supernatant was then subjected to a concentration process using Centricon® (Millipore, Burlington, Vt, USA) spin filters. These filters had a molecular weight cutoff of 100 kDa and were used to concentrate PC to 50 mg/mL in a buffer composed of 5 mM HEPES (SIGMA-Aldrich, St. Louis, MI, USA) with 20 mM MgCl2 (SIGMA-Aldrich, St. Louis, MI, USA) maintained at pH 7. This detailed purification process was critical to maintaining the functional integrity of the PC, making it suitable for further applications such as in the formation of LB nanofilms.

2.2. PC LB Nanofilms Deposition and Quality Monitoring

The process of depositing PC LB nanofilms is intricately detailed and meticulously performed. Initially, a volume ranging from 100 to 300 µL of PC protein solution is uniformly spread over the air–water interface within the confines of a Nima 611 LB trough, which boasts a significant surface area of 30 × 10 cm. This precise application is facilitated using a 100 µL Hamilton syringe (Hamilton—Reno, NV, USA). Following the distribution of the protein solution of 10 mg/mL, a Teflon barrier methodically compresses the monolayer until it reaches a surface pressure of 26 mN/m. Such pressure value was carefully chosen based on the unique characteristics of the PC, such as its size, nature, and solubility, ensuring the formation of a highly packed and orderly system. The choice of a pressure value to be applied during the LB process directly affects the packing density and arrangement of the molecules in the film. For instance, a too-low pressure might result in a loosely packed film with more defects, while a too-high pressure could cause the film to collapse. Therefore, the optimal pressure is usually determined experimentally for each specific system, and it is a balance between achieving a high packing density and avoiding film collapse or the creation of defects. It is also worth noting that the pressure is typically controlled and monitored using a surface pressure area (π-A) isotherm, which provides information about the molecular area and the phase transitions of the monolayer as shown in Figure 1a. The conditions under which the PC nanofilms are formed, including the sub-phase composition of a 5 mM HEPES buffer and a barrier speed of 70 cm/min, are derived from extensive characterization of films deposited on the gold plate of a quartz crystal microbalance (QCM). The transition of the protein monolayer onto a solid substrate is achieved through two distinct methods: the LB technique for a vertical lift suitable for QCM oscillator quartz slides, and the Langmuir–Schaefer method for a horizontal lift applicable to other substrates. Following the deposition, each layer of the PC LB multilayers is subjected to drying in a stream of gaseous nitrogen before the subsequent layer is added, ensuring the integrity and uniformity of the multilayered structure. These carefully constructed single and multilayered LB nanofilms are then applied to various substrates, including QCM oscillator quartz slides, atomic force microscopy (AFM) mica sample holders, and glass cover slides for protein crystallography. The overall quality of the PC LB films is rigorously monitored using QCM and AFM.

2.2.1. QCM Characterization

A QCMagic microbalance, manufactured by Elbatech in Marciana Marina, Italy, operating at a frequency of 5–6 MHz, was utilized to assess the quality of the deposited LB-MLs in terms of close packing [18]. We utilized conventional nanogravimetry AT-cut quartz slides with a frequency of 9.5 MHz and a diameter of 14 mm and gold electrodes with a diameter of 7 mm. The slides had a thickness of 330 microns and were held in a 2 HC6/U holder manufactured by ICM in Oklahoma City, OK, USA. The quartz slide could be readily attached and detached from its retaining spring contacts to provide surface changes, namely for the deposition of nanofilms. Frequency shifts were observed following the deposition of each LB layer, which was then dried using a gaseous nitrogen flow. The frequency resolution was ±0.05 Hz, the voltage accuracy linked to the quality factor was 0.8 mV, and the data gathering rate was 10 samples per second. The QCMagic program was utilized for the purposes of data storage and analysis. We have repeatedly carried out the experiment as specified in order to minimize the impact of random variables on the experimental outcomes.

2.2.2. AFM Characterization

The AFM was operated in a low thermal drift setting within a thermal cabinet, which enabled the attainment of a drift rate of less than 0.2 nm per minute. For low-force imaging, we employed either a frequency modulation mode with the probe operating at amplitudes below one one-billionth of a meter or utilized the probe’s ability to monitor thermal noise for surface profiling [19,20] Twenty layers of PC LB-MLs were applied to a mica surface using the LS version of the LB process and then dried under a nitrogen flux. The samples were partitioned into two cohorts: the initial cohort was subjected to incubation at a temperature of 20 °C, while the subsequent cohort was subjected to a temperature elevation of 150 °C for a duration of 10 min (within a pre-heated oven), followed by subsequent cooling to ambient temperature with the intention of augmenting long-range organization. The investigation of PC MLs was conducted in an ambient environment using a MultiMode microscope and Nanoscope IIIA controller (Bruker, Karlsruhe, Germany). An AFM was operated in tapping mode using a scanner capable of lateral displacements of up to 150 microns. The scanner underwent calibration using gratings with a resolution of 3 microns and a wavelength of 278 nm. The study utilized silicon probes (manufactured by Applied Nanostructures, Mountain View, CA, USA) with spring constants below 2 N/m. In the AFM studies, we utilized probe amplitudes ranging from 5 to 40 nm and fixed the set-point amplitude to be between 0.9 and 0.5 times the free probe amplitude. Scanning frequencies ranging from 0.6 to 0.8 Hz were utilized for regions of several microns on each side, while a scanning frequency of 1 Hz was employed for sub-micron imaging. The image processing and analysis were performed using the software program MountainsMap® (vers. 9.1.10246) developed by Digital Surf (Besançon, France).

2.3. Classical HD and LB Nanotemplate Crystallization

The crystallization screens, crystallization Linbro plates, siliconized glass slides, and vacuum grease were purchased from Hampton Research (Aliso Viejo, CA, USA). Vapor diffusion HD method: Five microliters of protein solution in the buffer were mixed with 5 µL of precipitant solution on a siliconized glass cover slide and equilibrated over the reservoir (1 mL) with the precipitant solution at controlled temperature (20 °C) and sealed on a crystallization plate (Linbro plate HR3-17, Hampton Research, Aliso Viejo, CA, USA) using vacuum grease (HR3-510, Hampton Research, Aliso Viejo, CA, USA). PC microcrystals were produced by classical HD vapor diffusion at a starting protein concentration of 50 mg/mL µ, using 75 mM HEPES pH 7, 20 mM MgCl2, 17% PEG 3350 as the precipitant. The same crystallization condition was used for LB nanotemplate crystallization. In this case, a 5 µL droplet of protein solution mixed with 5 µL of the precipitant was placed on the glass slide covered with LB thin-film nanotemplate. As in the classical HD method, the glass slide with the protein template and the drop of protein/precipitant solution was equilibrated over the reservoir (1 mL) with the precipitant solution at controlled temperature (20 °C) and sealed on the crystallization plate using vacuum grease. Both in the case of classical and LB nanotemplate method the droplets were constantly observed by means of optical microscopy and SONICC spectroscopy.

2.4. SONICC Instrumentation and Imaging Parameters

SONICC utilizes ultrafast laser sources with pulse duration of ~100 fs to achieve the high peak powers necessary for efficient SHG while maintaining low average powers to minimize sample perturbation. The technique involves scanning a focused laser beam across the sample, with SHG signals detected as the beam interacts with non-centrosymmetric crystals [14,15]. SHG microscopy is commonly employed to view proteins within organized structures, such tissues or biological membranes [21]. The coherent nature of SHG means that the detected signal originates solely from the focal volume, enhancing the technique’s ability to selectively detect protein crystals while minimizing background signals from scattering. This process is highly sensitive and selective for crystalline structures, making it ideal for distinguishing protein crystals from other materials in a sample [14,22]. Signals are collected using a dedicated filter centered at half the excitation wavelength. UV-TPEF signals, if applicable, are collected using a separate emission filter optimized for the protein fluorophore (e.g., emission range of 420–480 nm for tryptophan fluorescence). Signal intensity of protein crystals is influenced by several parameters, including crystal symmetry, size of protein and of the crystal itself, as well as secondary structure elements [16]. Imaging parameters such as laser power, scan speed, and pixel dwell time are optimized to achieve sufficient signal intensity while minimizing photodamage to the protein crystals [23,24]. SHG spectroscopy, in particular the SONICC (second order non-linear imaging of chiral crystals) instrument invented by G. Simpson [15]. The images were acquired with a SONICC-Integrated ROCK IMAGER 1000 by Formulatrix Dubai, United Arab Emirates. SONICC can identify nanocrystals of chiral molecules as small as 100 nm. When a chiral crystal is exposed to two 1024 nm photons in a strong field, frequency doubling occurs due to inherent polarization anisotropy, allowing a detector to measure the 512 nm photon output. Constructive interference arising from crystalline translational symmetry increases the probability of this occurring [15].

2.5. Data Acquisition and Analysis

SONICC technique utilizes dedicated software for image acquisition and analysis. Images are acquired for each well or imaging chamber, typically capturing both the SHG and UV-TPEF channels (if applicable) simultaneously. Software algorithms MountainsMap® (vers. 9.1.10246) can be employed to identify regions of interest based on signal intensity and morphology, facilitating the automated detection and classification of potential protein crystals. Despite the advanced automation, manual review remains an indispensable part of the process. This step ensures the quality and reliability of the automated detections by providing a necessary check to guard against false positives or negatives, particularly in complex crystallization scenarios. Thus, the acquired images are checked to confirm the presence and quality of crystals identified by the Rock Imager 3.5 and Rock Maker 3.17 software (Formulatrix Dubai, United Arab Emirates) implemented in the instrument. For SONICC imaging, the exposure time was 1000 ms and the power was 300 mW, as described by Dorner et al. [25]. These settings of exposure time and power were chosen to optimize the balance between image quality and sample integrity. These parameters are tailored to enhance the detection sensitivity while minimizing potential damage to the protein crystals, aligning with established practices for minimizing sample perturbation during laser exposure.

2.6. Positive Crystal Identification

Second harmonic generation (SHG) microscopy is a valuable technique in the field of structural biology for detecting protein crystals. SHG is a phenomenon that involves the conversion of light frequency to double its original value. This process occurs only in crystalline materials that do not include inversion centers. Based on theoretical models and actual evidence, it is anticipated that around 84% of the protein crystal structures that are now known may produce an SHG signal detectable with the existing SHG imaging equipment. Conversely, most salt crystals are symmetric and therefore generate no SHG signal. SHG limitation can be overcome using specific dyes that enhance the nonlinear optical response in protein crystals and demonstrate a substantial advancement in expanding the coverage of SHG microscopy for the identification of protein crystals [21,26]. On the other hand, UV-TPEF (ultraviolet two-photon excited fluorescence) creates images based on the fluorescence of UV-excited amino acids such as tryptophan. Combined with SONICC, UV-TPEF enables sensitive and selective detection of protein crystals, distinguishing them from other structures in the sample [27]. Since not all protein crystals form non-centrosymmetric structures, potentially leading to false negatives, as Dörner et al. mention, some protein crystals in high-symmetry classes may not produce any detectable SHG signal. Similarly, Simpson et al. discuss the inherent limitations of SHG in detecting certain crystal symmetries due to phase-matching conditions that can significantly influence SHG efficiency. While most salt crystals are centrosymmetric and thus do not generate SHG signals, there are exceptions. Some chiral salts or achiral salts under specific conditions may form non-centrosymmetric crystals that could produce SHG, posing challenges in distinguishing them from protein crystals. Simpson et al. recommend using complementary techniques, such as UV-TPEF, which provide contrast between protein and salt crystals based on their fluorescence properties. Utilizing UV-TPEF in conjunction with SHG can enhance the specificity of crystal detection. UV-TPEF can help confirm the proteic nature of the crystals by distinguishing intrinsic fluorescence from the protein itself or from fluorescent tags. The presence of a co-localized UV-TPEF signal may further support the identification of protein crystals, particularly for intrinsically fluorescent proteins. Conversely, salt crystals or precipitates will typically not generate a significant SHG signal and may appear as irregular structures in the image. Thus, the combination of SHG and UV-TPEF effectively distinguishes protein crystals from other particulate matter [13,25].

2.7. Image Processing Techniques

In the analysis of SONICC images, we employed specific image processing techniques, using ImageJ (vers. 1.54i) and GIMP software (vers. 2.10.34) to enhance the visualization of crystal nuclei and to facilitate accurate analysis. The following steps were taken to process the images:
-
Image filtering: Initially, we applied a Gaussian filter using ImageJ to reduce image noise and improve the visibility of crystal edges. This filter was adjusted to smooth out the noise without obscuring the fine details of the crystal structures.
-
Thresholding: To distinguish crystal nuclei from the background more clearly, we utilized an automatic thresholding technique in ImageJ, which helped to identify and isolate regions of interest based on intensity variations. The threshold levels were adjusted based on the histogram of pixel intensity to optimize the separation of crystal nuclei from the less relevant background.
-
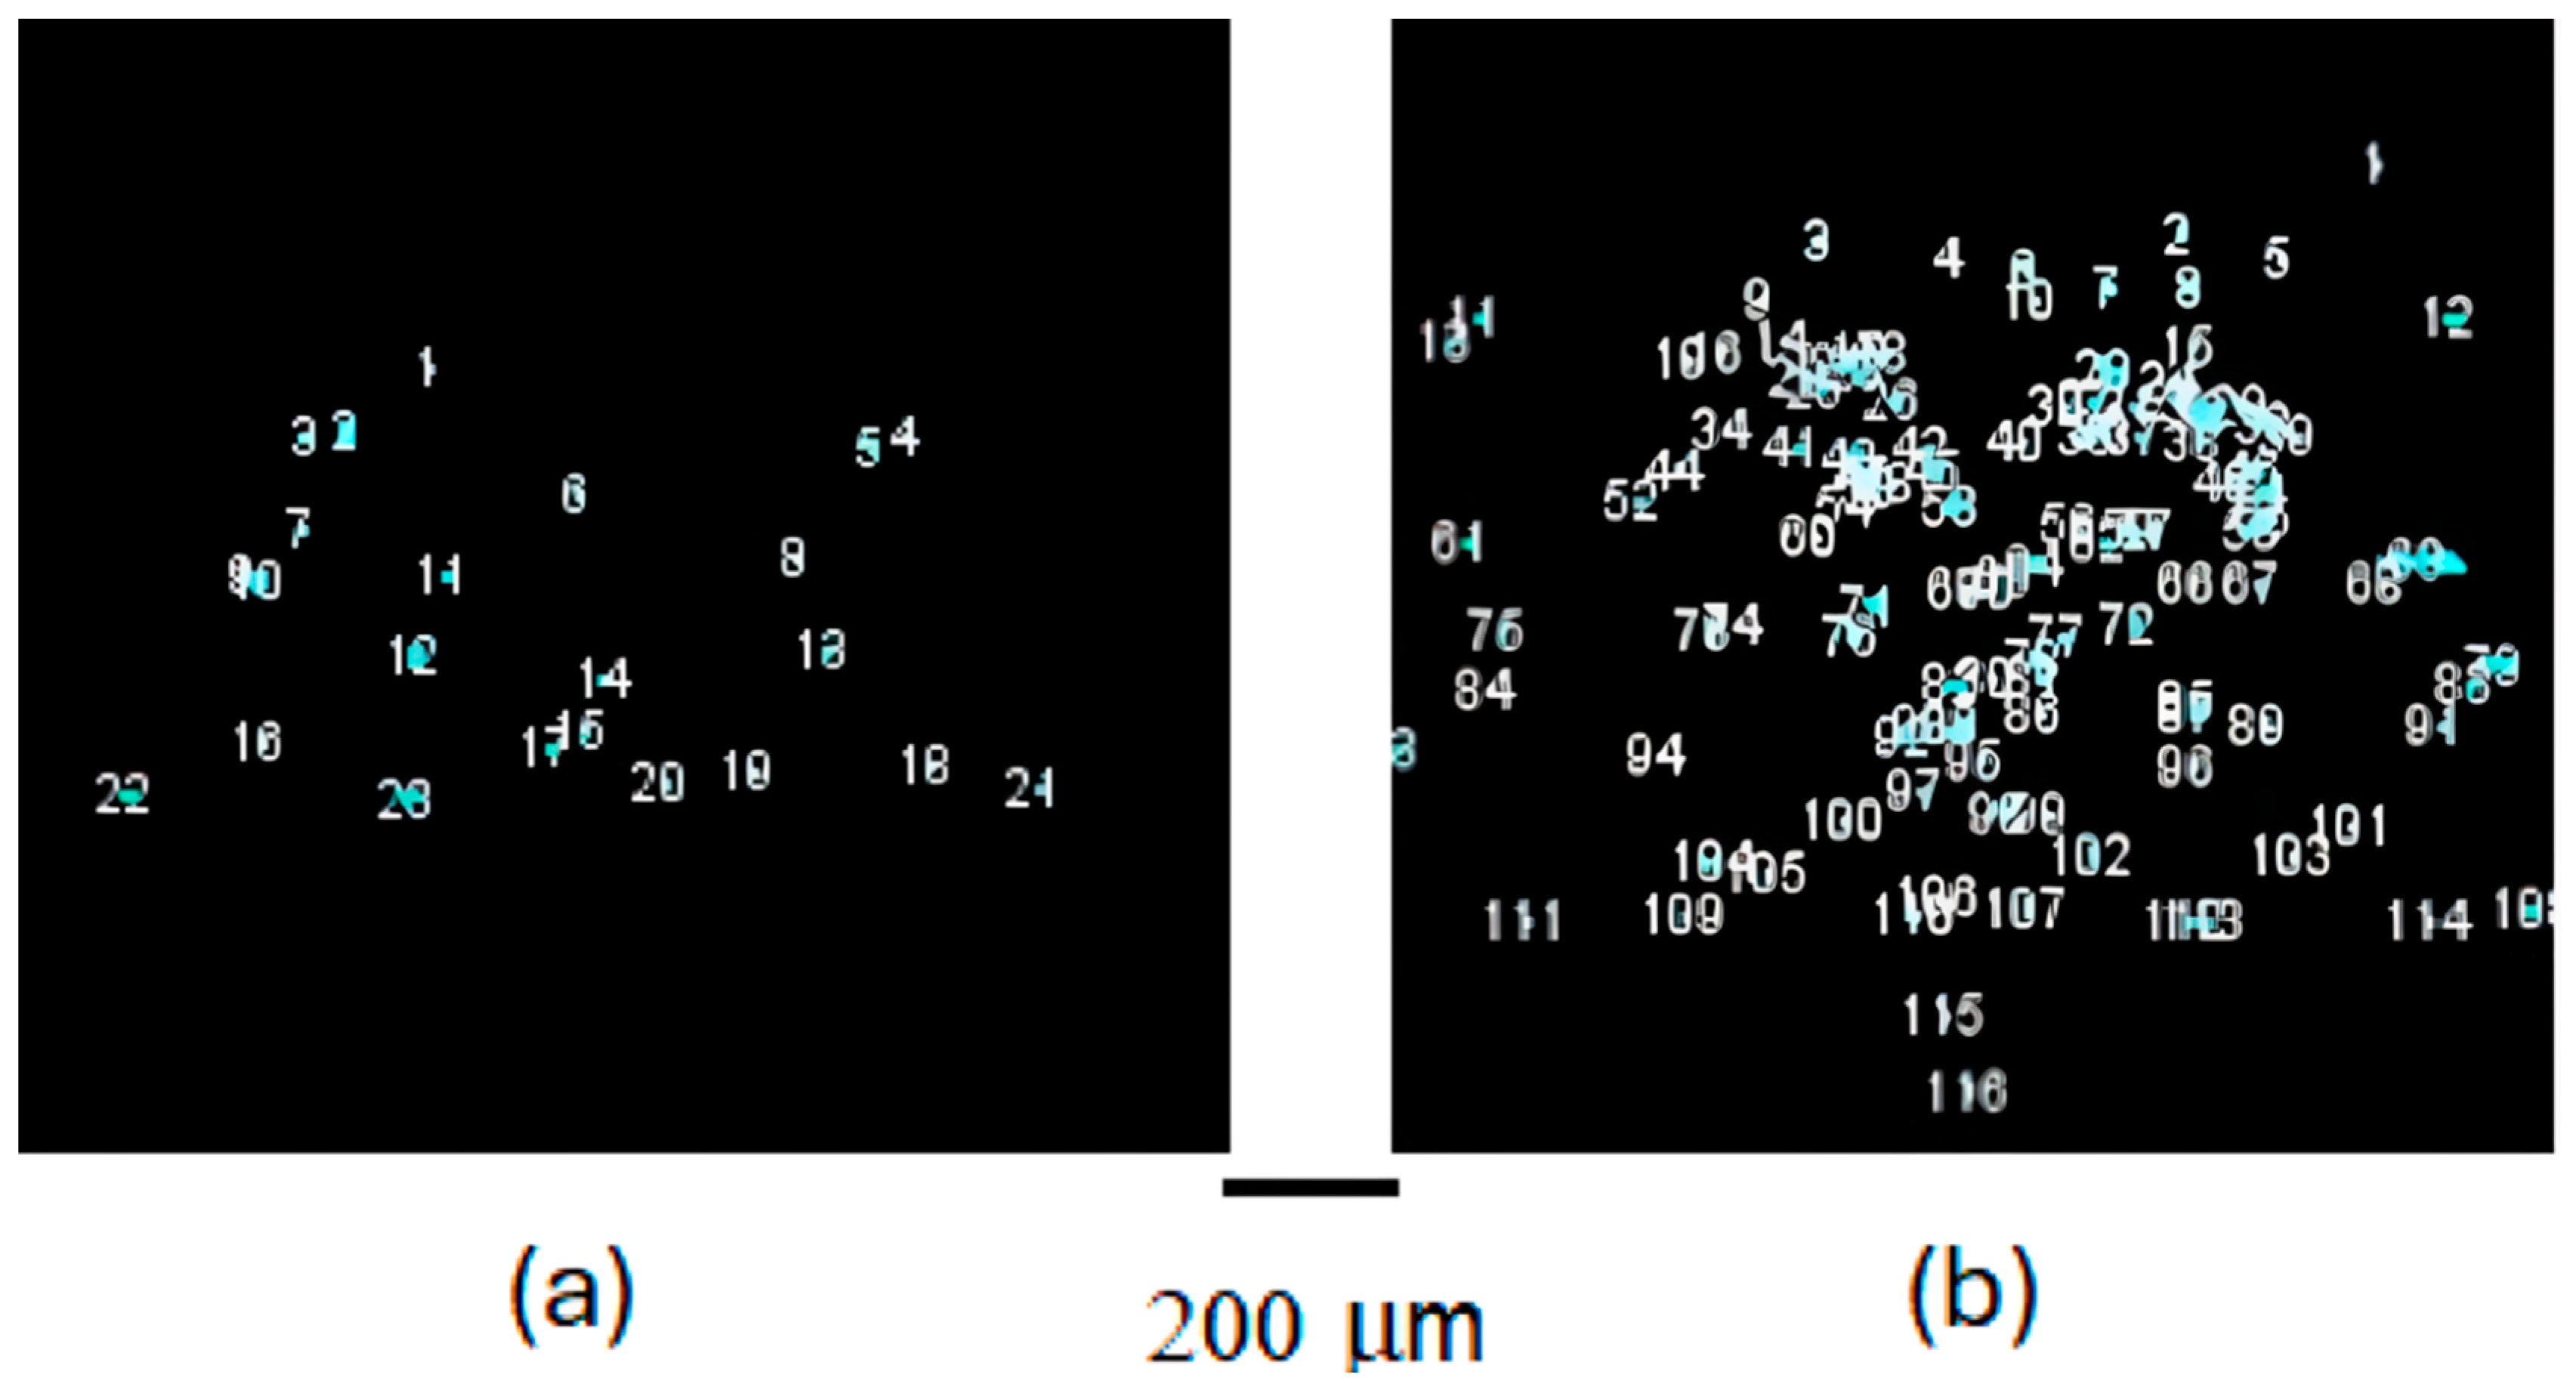
Segmentation: Following thresholding, segmentation was performed to delineate and quantify individual crystal nuclei with the ‘Watershed’ algorithm. This is particularly useful for separating overlapping objects or distinguishing features that have different intensity profiles but are close together in an image. After Watershed, we used ‘Analyze Particles’, another feature in ImageJ, which allowed us to select and analyze distinct segments based on size and circularity criteria. This step was crucial for quantitative analyses, such as counting nuclei and measuring their area and perimeter.
-
Contrast enhancement: Using GIMP, we further enhanced the contrast of the images to better visualize the boundaries and features of the crystal nuclei. This was particularly important for presenting the images in publications where clarity and detail are paramount.
-
Final adjustments: Last, minor adjustments were made to the brightness and contrast settings manually in GIMP to ensure that the images were suitable for both detailed analysis and presentation purposes without altering the fundamental data represented.
These image processing steps were critical for enhancing the visibility of crystal nuclei and were performed while ensuring that the integrity of the data was maintained throughout the process. Admittedly, all the above steps involve errors that are necessarily high, as indicated below.

3. Results

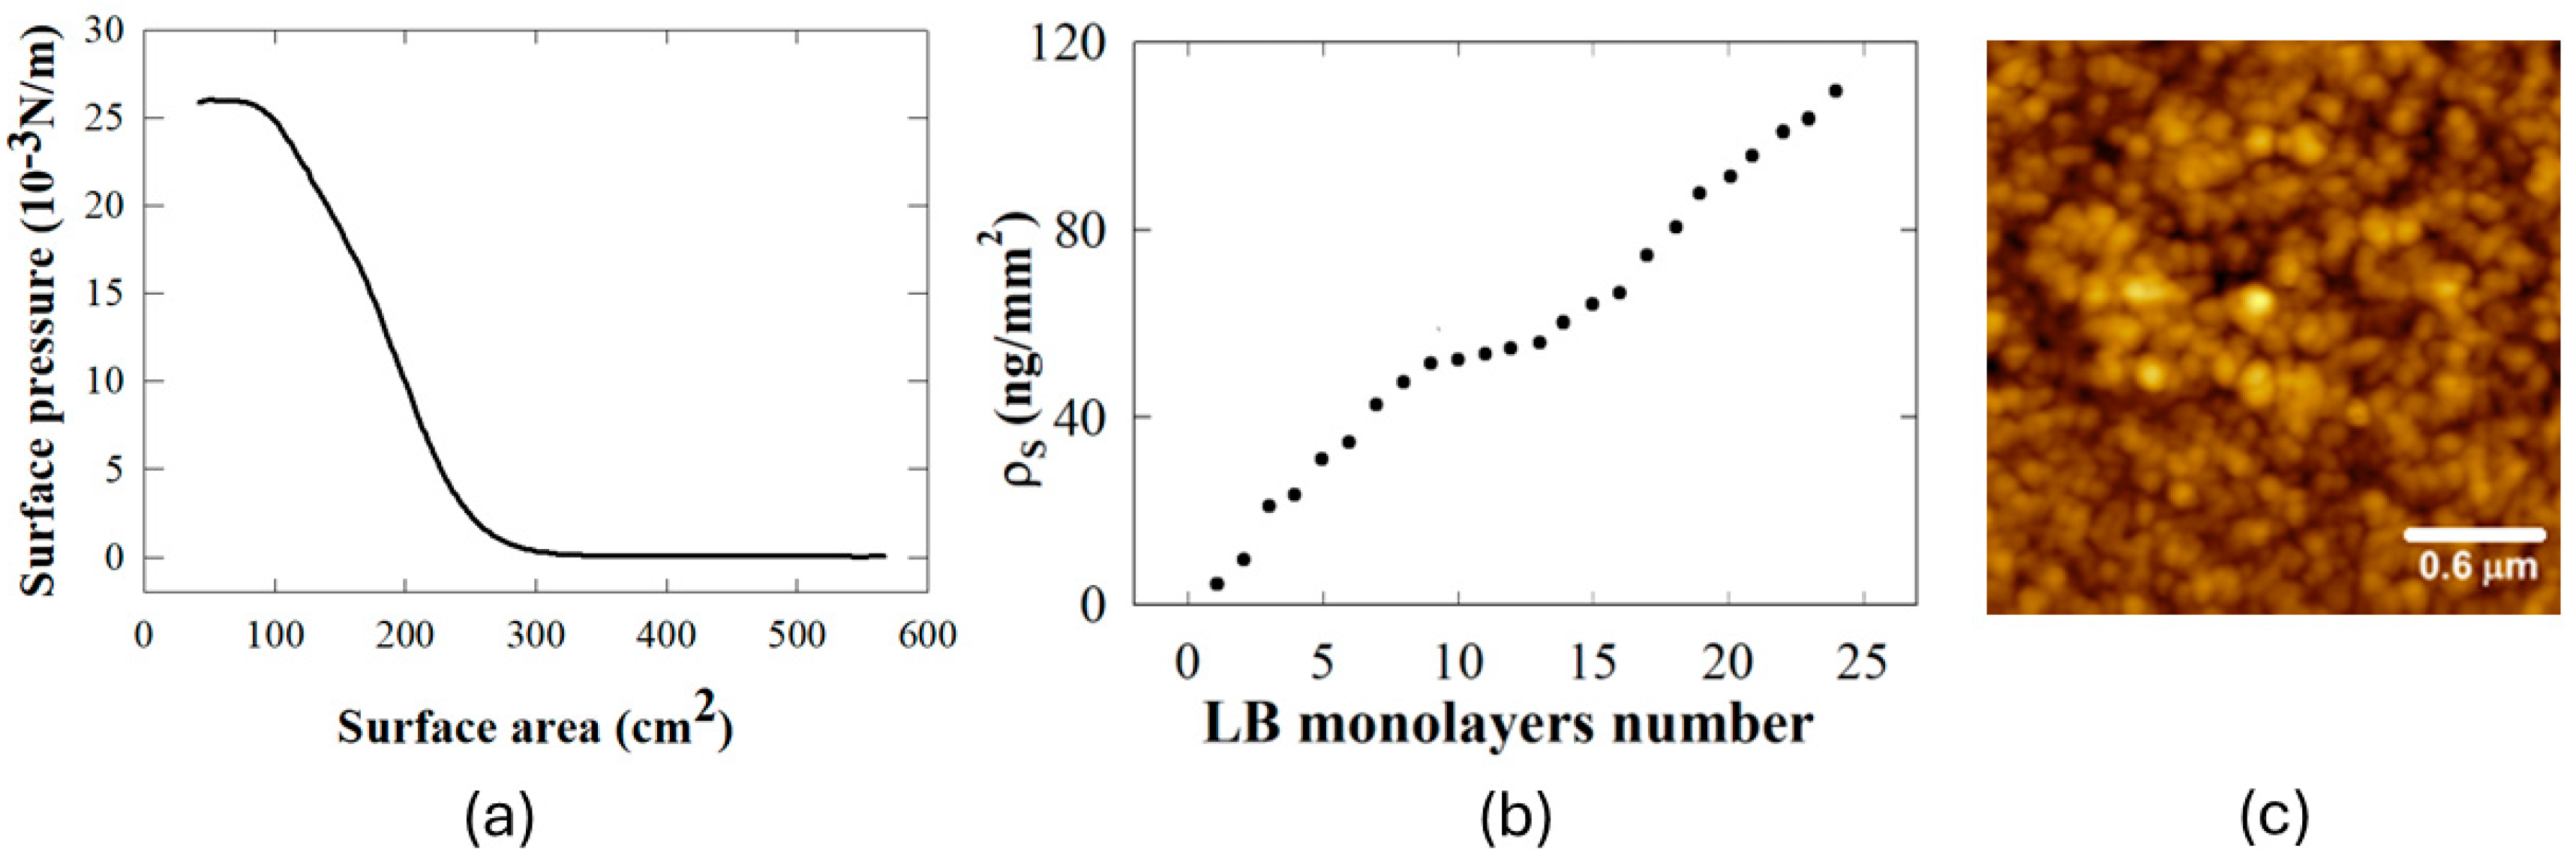
3.1. LB Monolayer Deposition, QCM, and AFM Characterization

The optimal conditions, namely barrier speed (70 cm/min) and surface pressure of deposition (26 mN/m), were identified and applied in LB monolayer depositions of the PC protein (MW 120 kDa). The curve (Figure 1a) shows a smooth, continuous increase in surface pressure as the surface area decreases, which is characteristic of a monolayer undergoing compression without collapse. The absence of abrupt changes in the slope suggests that there are no significant defects or collapses occurring up to the highest pressure displayed. LB nanofilm were characterized by QCM measurements during depositions, since QCM represents a convenient method to monitor the quality of the depositions. QCM utilizes the characteristics of piezoelectric quartz crystals to change their resonance frequency when a mass is either absorbed or removed from their surface. When a mass is adsorbed to (or desorbed from) a quartz crystal’s surface, QCM crystal’s piezoelectric capabilities cause a surface density mass increase (or decrease) that the classical Sauerbrey equation relates to a shift in the measured frequency, which decreases (or increases). In ideal conditions, the area covered by protein layer Δ s is also proportional to the frequency shift: Δ s = −K Δ f. For the quartz resonator used here, linear coefficient K was determined to be equal to 0.1319 ng/Hz mm2, based on the specifications of the quartz crystal. The experimental frequency shift of 22 Hz, measured at each monolayer deposition of PC, corresponds to a surface density of 2.9 ng/mm2 (Figure 1b). The surface density of protein molecules, according to the measured from QCM frequency shift, turned out to be 67 molecules/nm2. As a result, the deposited protein monolayers in the LB nanofilms are uniformly distributed and closely packed in hexameric form according to the geometric properties of a single PC protein molecule (PDB code 3L0F), which leads to an area of 70 nm2, very close to the experimental value. AFM images of PC LB layers are shown in Figure 1c. The AFM microscope was operated on a low thermal drift setting in a prototype of a thermal cabinet. It was designed with a temperature stability and drift rate lower than 0.2 nm per minute. Regarding low-force imaging, we used either frequency modulation mode with the probe operating at sub-nanometer amplitude, or we utilized the thermal noise measurement capabilities of the probe for surface profiling [19,20]. The scan rate and set-point amplitude were selected to prevent damage to the protein film and preserve its native morphology. The AFM image displays a granular surface with clusters of closely packed particles: across multiple samples, the AFM images revealed a high degree of uniformity in particle distribution, with no significant areas of aggregation or voids, underscoring the robustness of our LB deposition protocol. The dense and orderly arrangement of particles is pivotal for triggering and accelerating crystal formation.

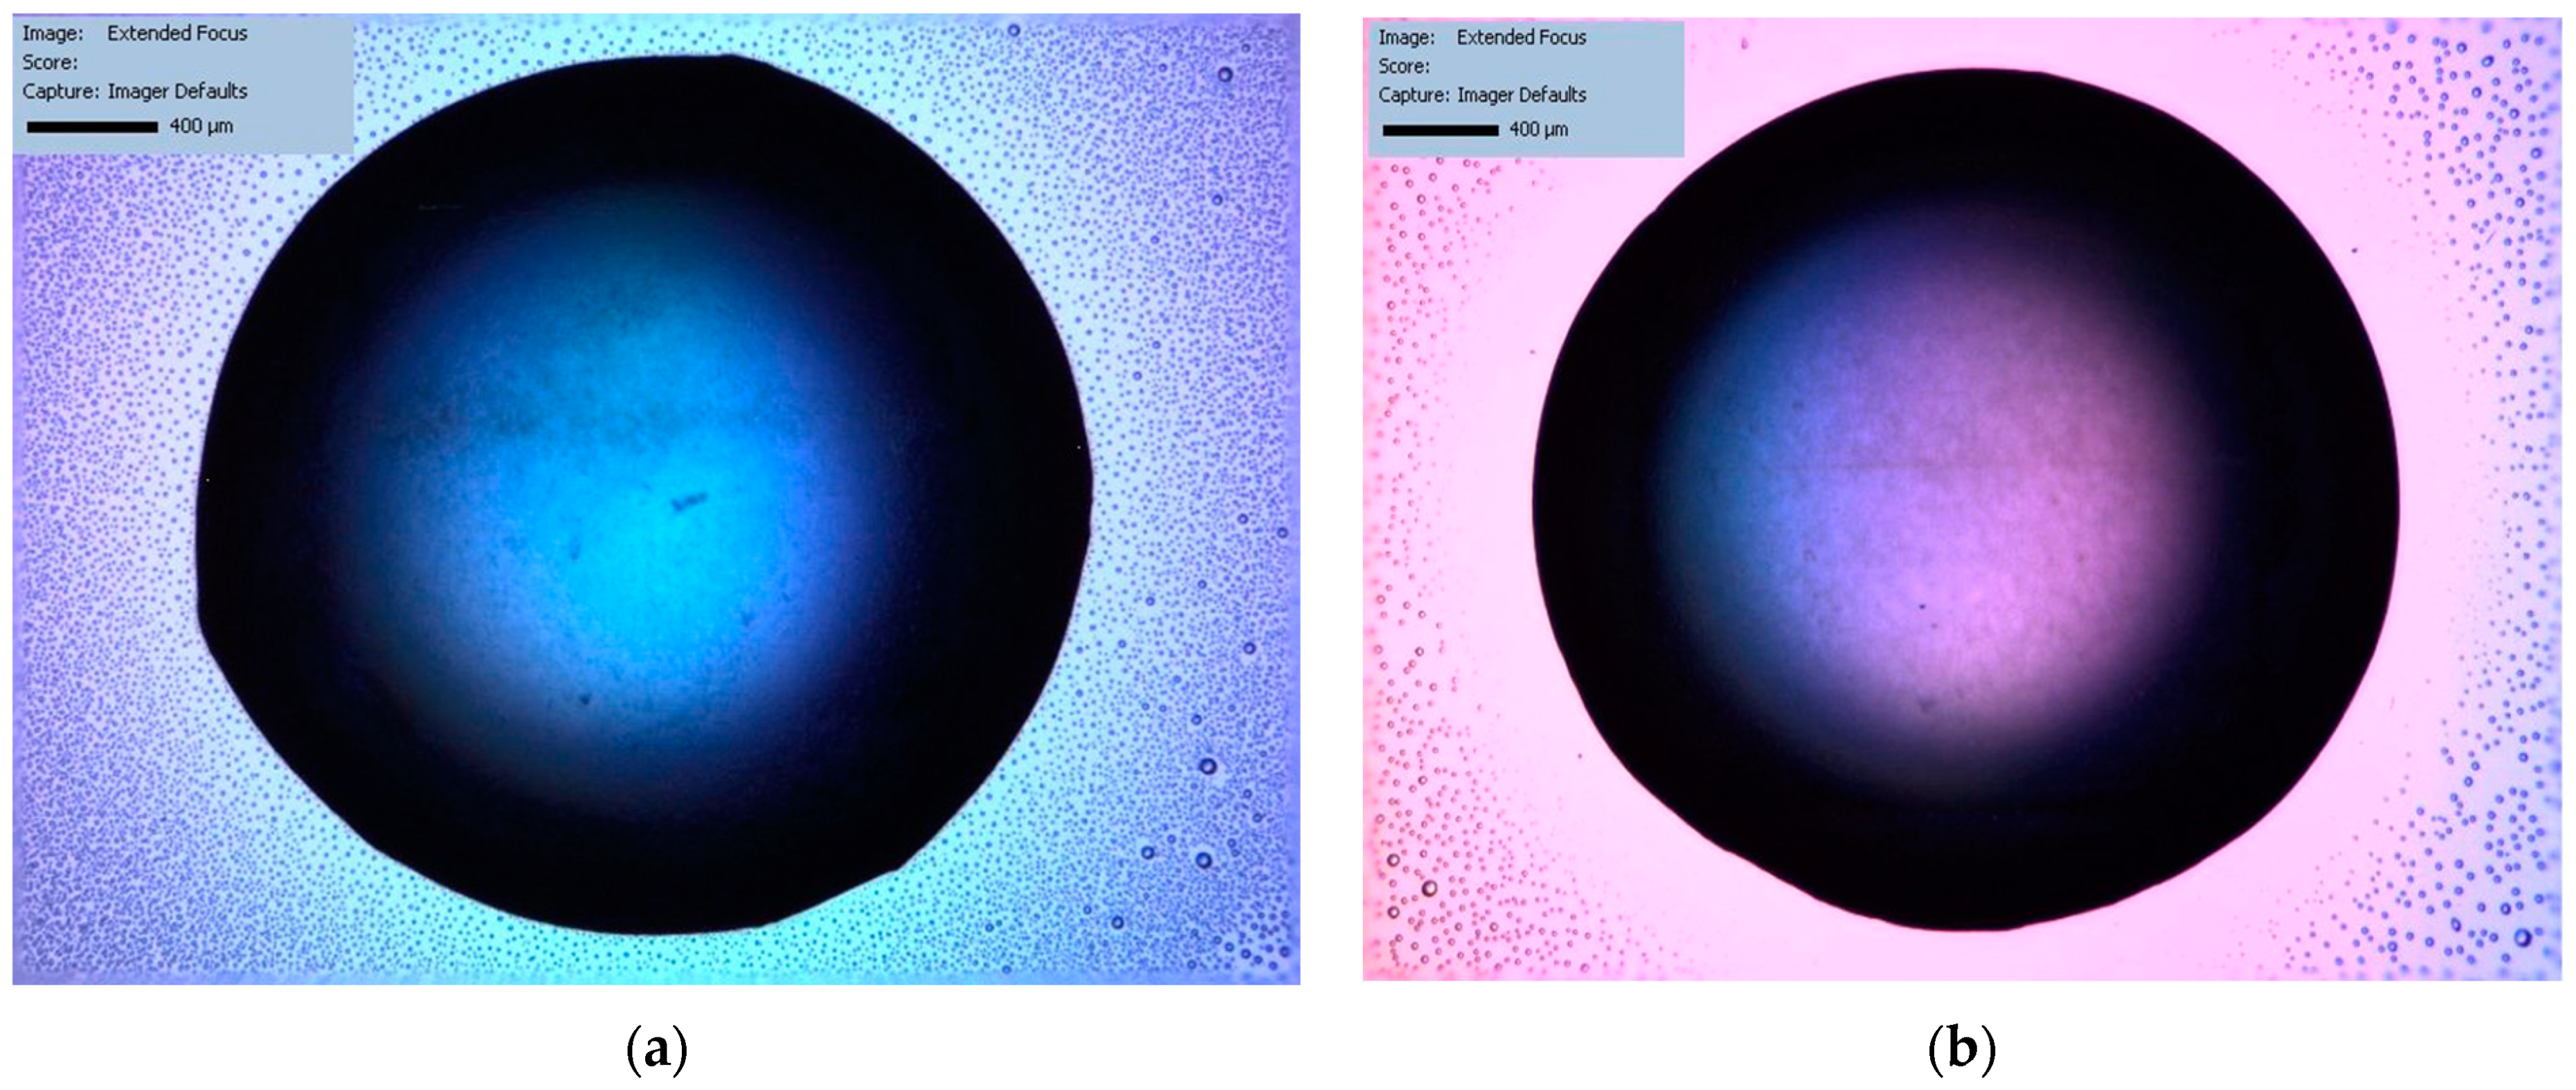
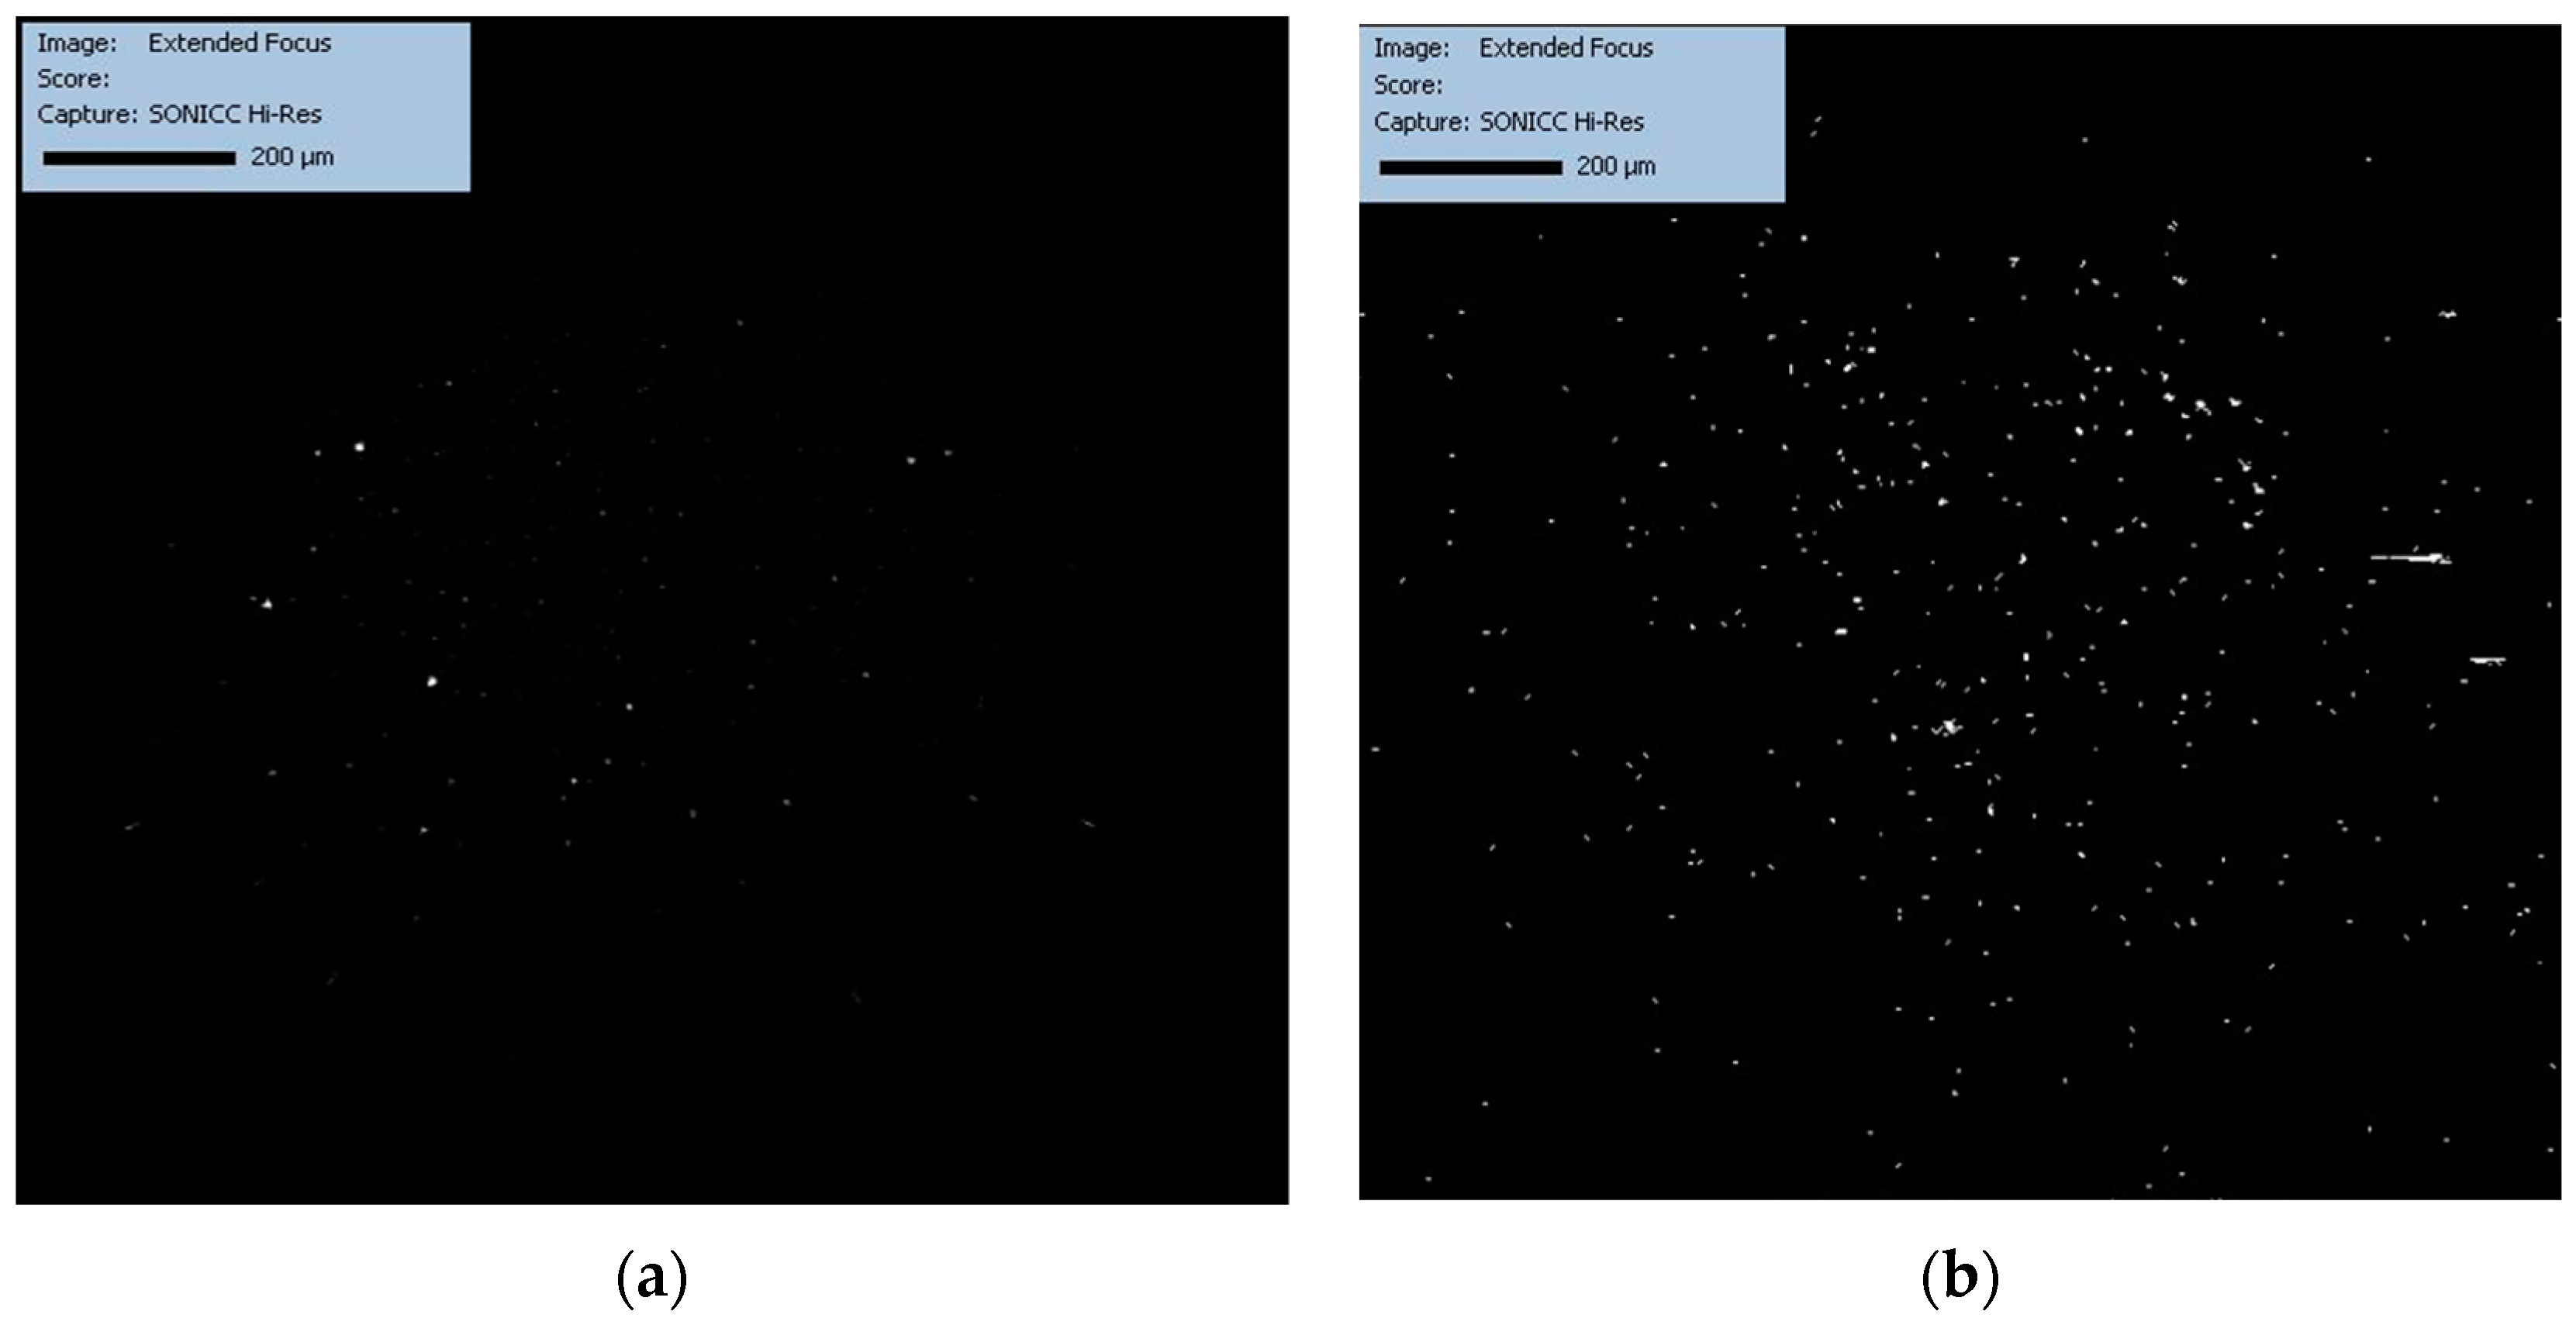
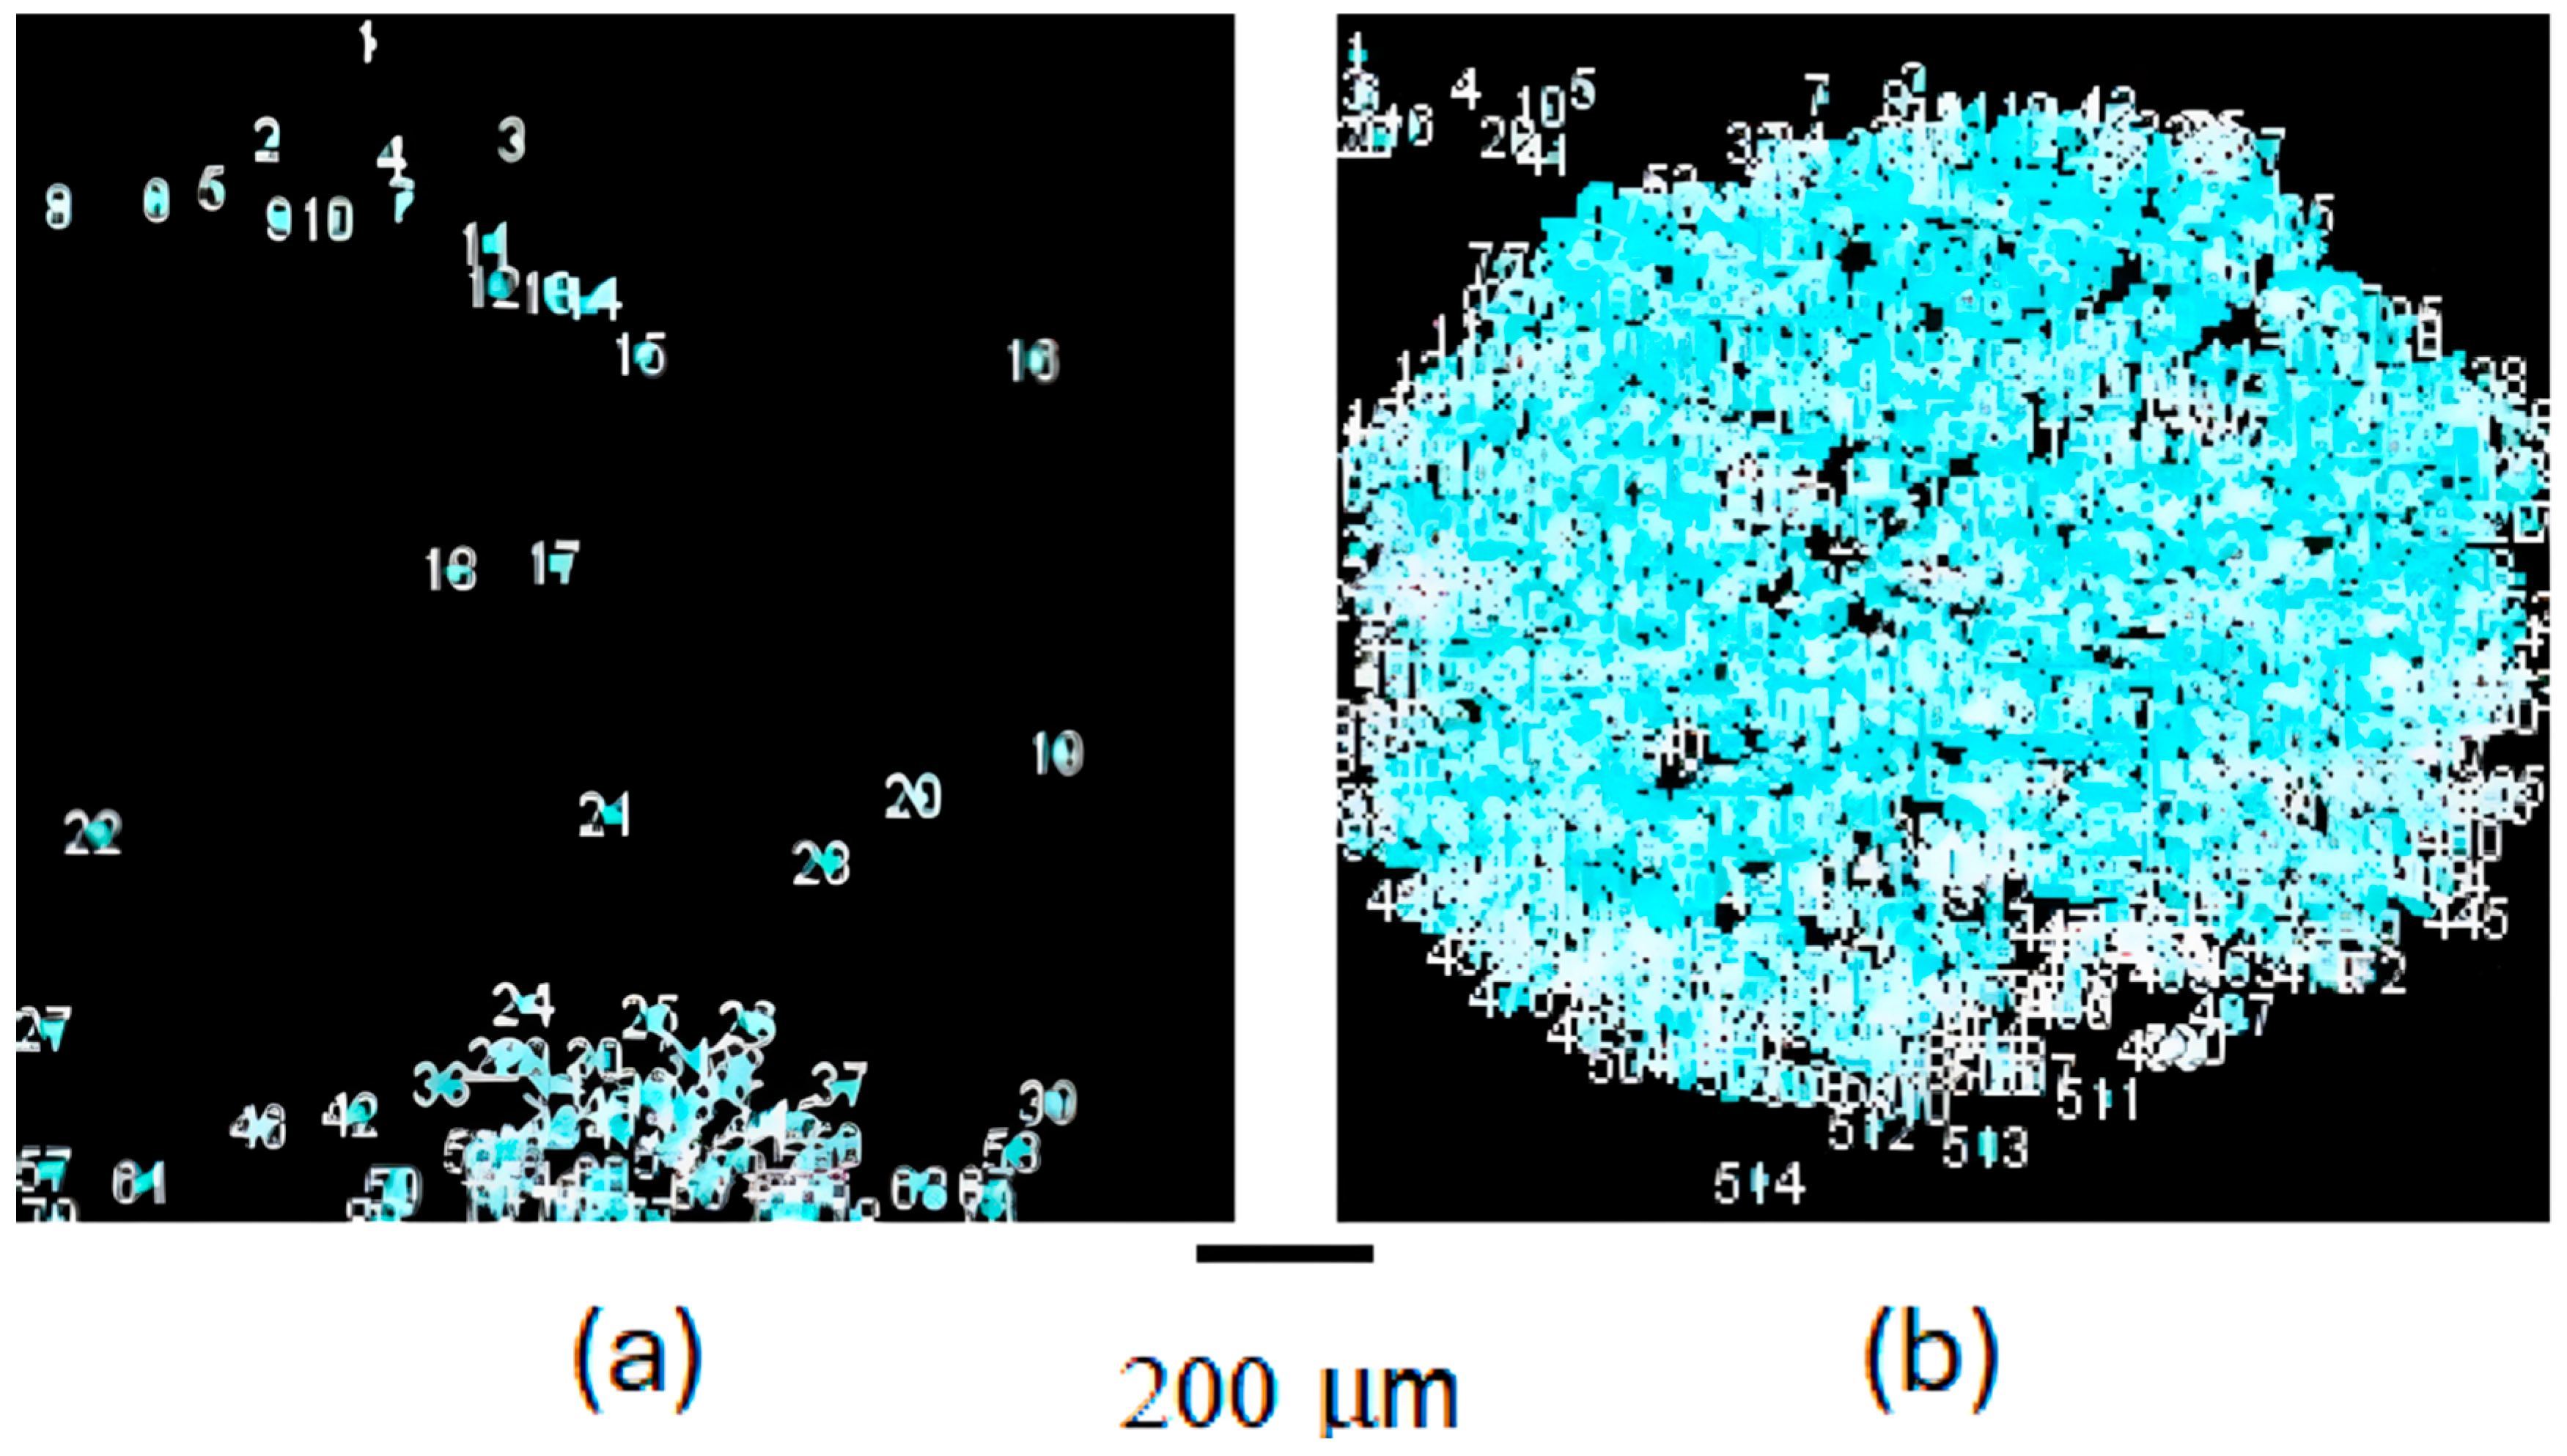
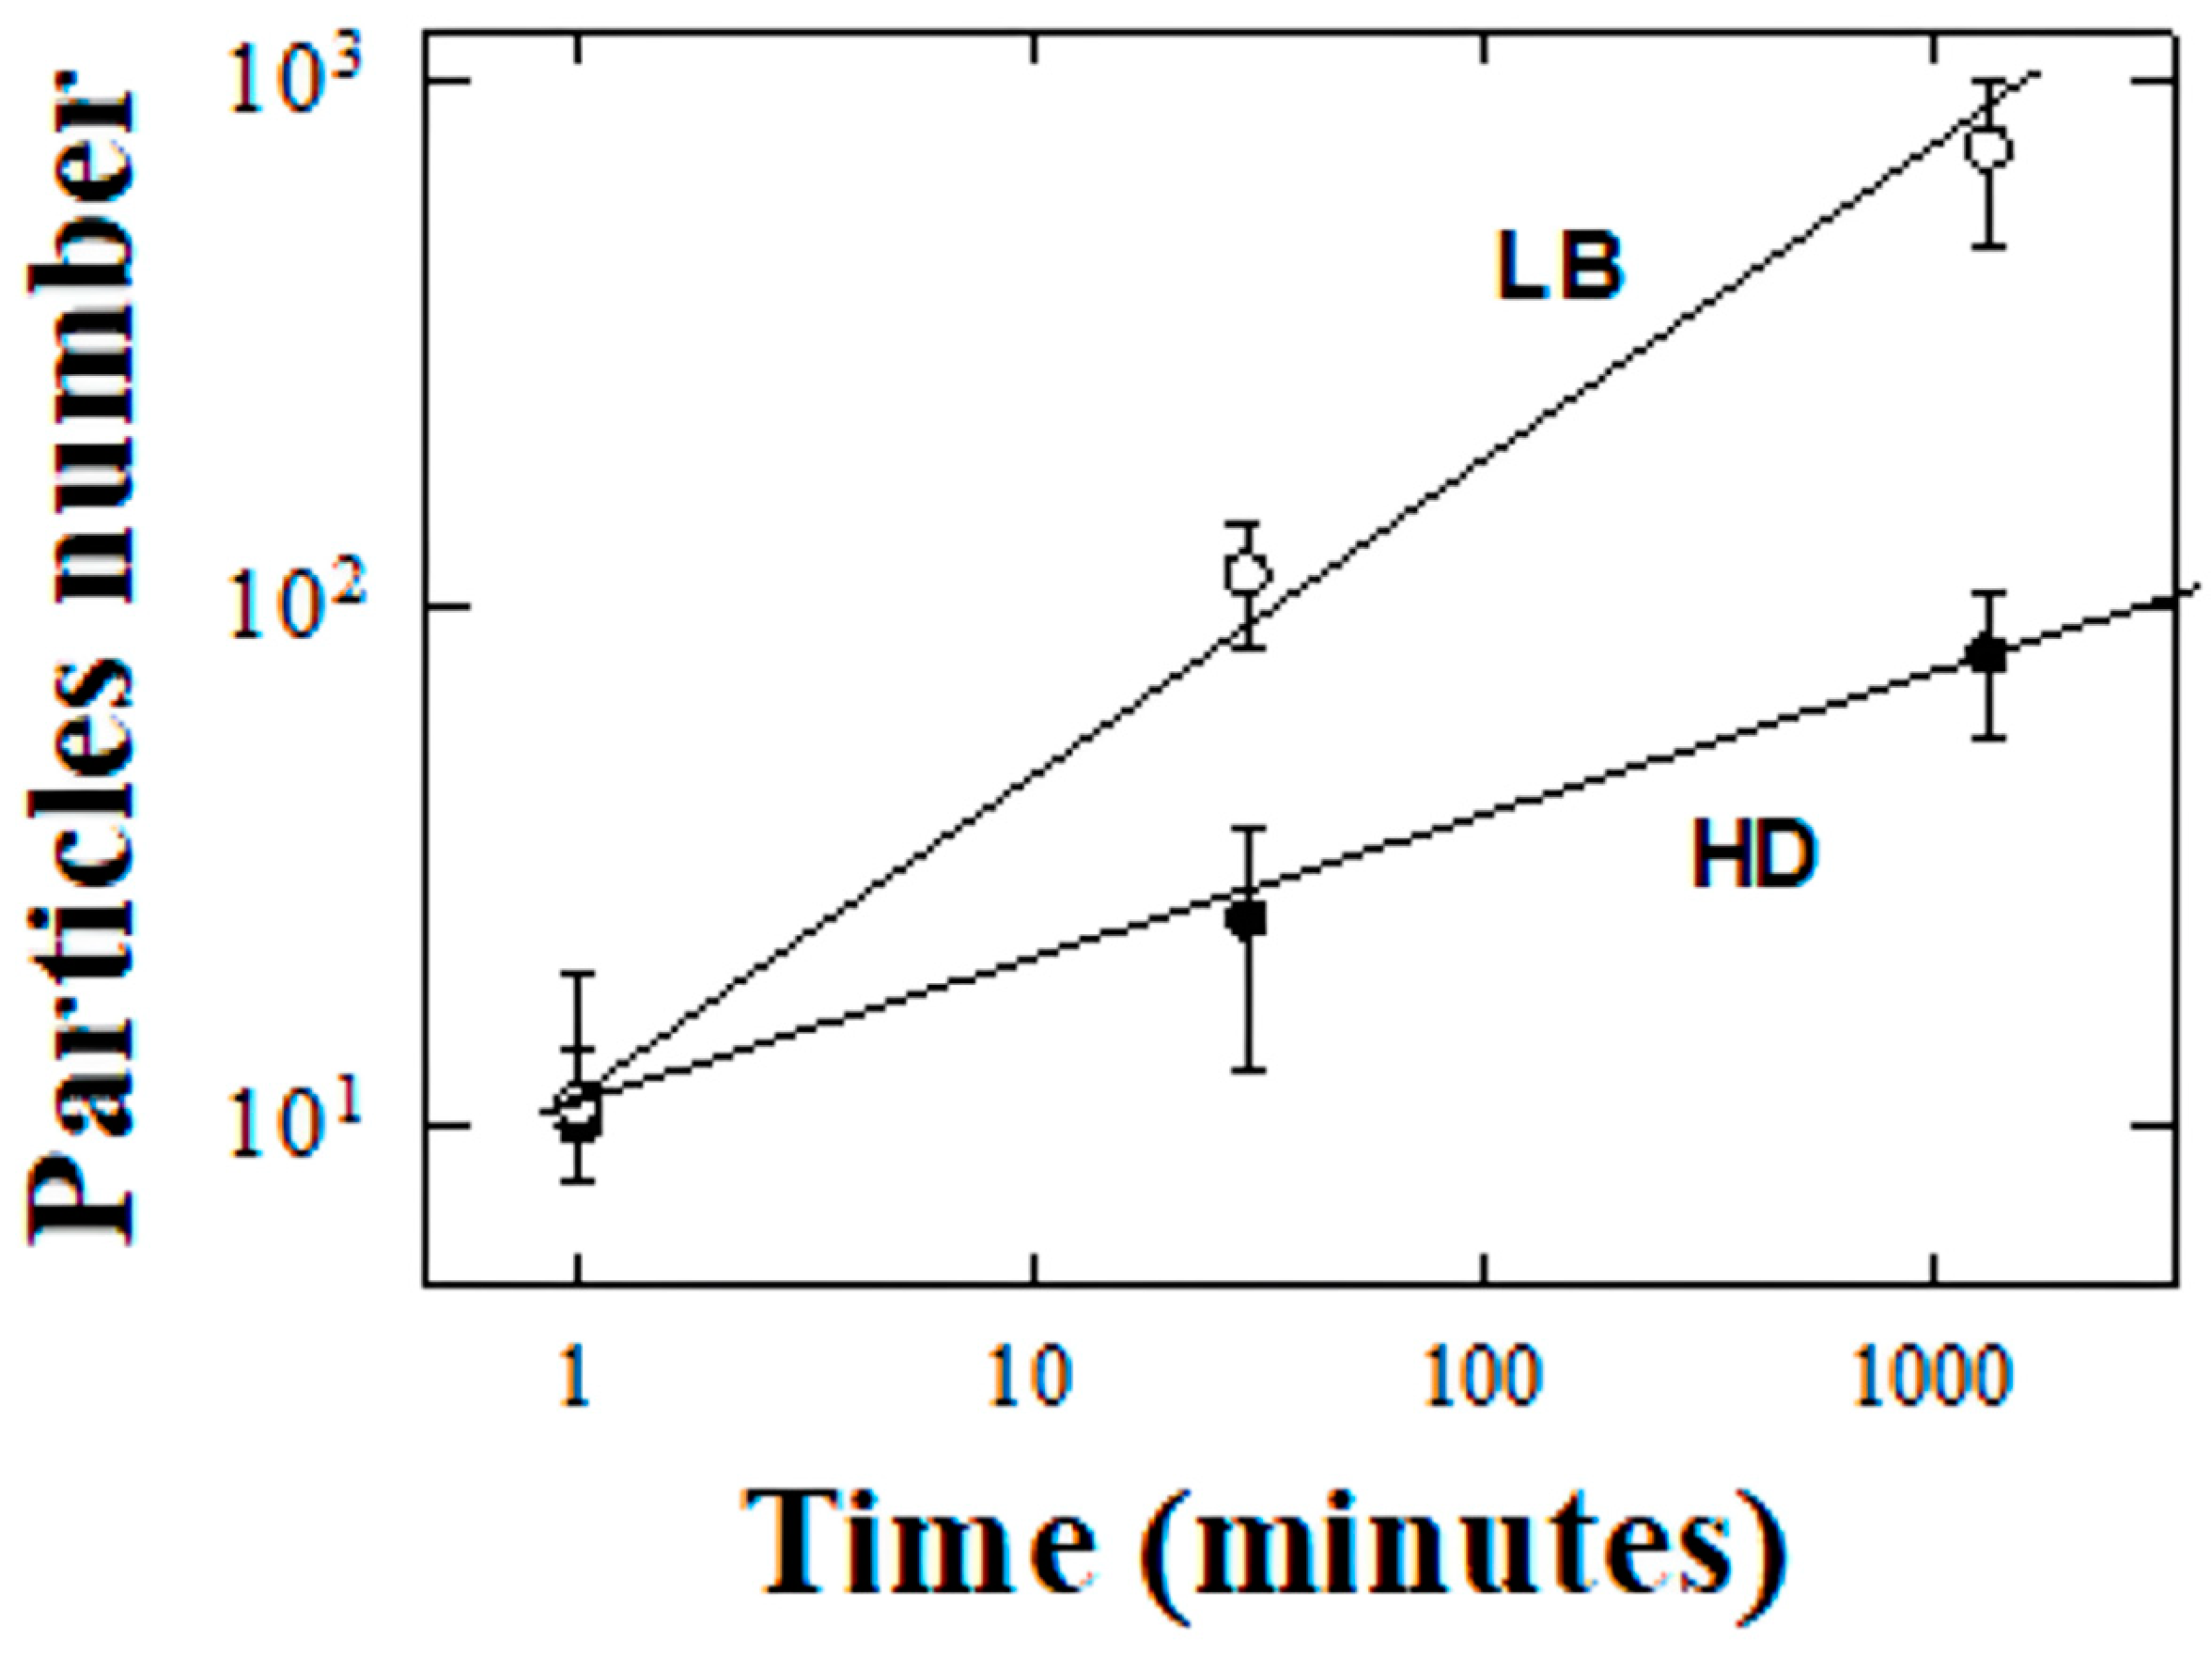
3.2. SONICC Experiments

Crystallization is a key technique in structural biology, essential for elucidating the three-dimensional structure of proteins, which in turn is critical for understanding their biological function. Utilizing SONICC technology to monitor the crystallization of PC protein offers a window into the intricate process of crystal growth, providing real-time data that are crucial for optimizing conditions to yield the high-quality crystals necessary for X-ray crystallography analysis. The monitoring is instrumental not just for capturing protein conformation but also for observing functional dynamics. In biotechnology, where protein stability is crucial, such insights from crystallization are invaluable. They guide the engineering of robust protein variants for various industrial applications and contribute to the development of effective protein-based therapeutics. Moreover, the advancements in SONICC imaging propel crystallographic studies into new domains, including challenging targets like membrane proteins, expanding our capability to explore complex biological systems and accelerating the pace of drug discovery. The images in Figure 2, Figure 3 and Figure 4 depict the time effects of the crystallization process of the PC protein, monitored using SONICC technology. Its crystallization is not only relevant for understanding its structure and function but also for applications in biotechnology due to its fluorescent properties and therapeutic potential. The classical HD vapor diffusion method (Figure 2a) and the LB nanotamplate technique (Figure 2b) are two distinct approaches to protein crystallization. The HD method is a simple and widely used technique in which a small droplet containing the protein, precipitant, and buffer is suspended over a reservoir containing a higher concentration of the precipitant. This setting creates a concentration gradient that causes the solvent to evaporate from the drop, leading to supersaturation and the nucleation of crystals. In contrast, the LB nanotemplate method involves the transfer of a monolayer of protein, which is spread at the air–water interface onto a solid substrate by controlled dipping, facilitating ordered assembly and triggering protein crystallization. As discussed above, SONICC is an advanced imaging method that utilizes the non-linear optical properties of chiral crystals to enhance the detection and imaging of protein crystals, which are often challenging to visualize under conventional light microscopy due to their size and transparency.
Figure 2a,b show the initial phase in the crystallization process of the PC protein with the classical HD and the LB methods: there is an absence of bright spots in the SONICC imaging, indicating that at the very initial stages of crystallization, nucleation has not yet occurred or the crystals formed are below the detectable size for SONICC. The color difference between Figure 2a,b is another illustration of variations in the early stages of crystallization using different techniques—vapor diffusion (HD) and the nanotemplate technique (LB), respectively. Figure 2a shows a blue coloration from the solution drop, while Figure 2b shows a pink-and-blue mixture of tones that is not consistent with the protein crystal nucleation processes, suggesting a background effect instead.
Figure 3a,b show the development of the crystallization processes with both HD and LB 30 min after the beginning of crystallization. The two figures show that there is an emergence of bright spots, especially notable in Figure 3b. This suggests that the structured environment provided by the LB nanotemplate might be conducive to more effective nucleation with the formation of crystal nuclei or microcrystals, potentially due to the ordered assembly at the interface promoting nucleation.
After 22 h (Figure 4a,b), a stark contrast is clearly visible. In Figure 4a (classical HD), the presence of scattered bright spots indicates crystal growth, yet the distribution and size suggest heterogeneous nucleation and possibly multiple crystallization events leading to smaller crystals. On the other hand, Figure 4b LB shows a dense and uniform field of bright spots, which could indicate a more uniform crystal growth, possibly larger and better-ordered crystals, which is consistent with the expected outcome of the LB method that tends to promote the ordered growth of protein crystals.
Our SONICC imaging data demonstrate variations in the crystallization patterns of PC proteins when using HD and LB methods. These patterns hint at method-dependent differences in the nucleation and growth stages of crystallization. Although our current data do not measure crystal size and uniformity directly, the observed trends suggest potential methodological impacts on the dynamics of crystal formation, which could be significant for structural analysis and biotechnological applications. The findings align with our study’s goals to examine alternative crystallization approaches and set the stage for future work to experimentally quantify the effects on crystal properties.

4. Discussion and Future Trends

In this study, differences observed in crystal growth patterns between the HD and LB methods suggest varying impacts on the structural properties of the resulting protein crystals. The crystal growth trends indicate that the LB method provides enhanced control over the crystallization environment. This control is hypothesized to potentially lead to improvements in crystal quality, which is crucial for applications in structural biology, where crystal defectiveness can significantly impact the resolution and quality of X-ray crystallography data. Moreover, the observed differences in growth patterns could imply that the LB method might be more suitable for material science applications, where consistent and predictable crystal properties are necessary for fabricating devices that rely on precise molecular arrangements of protein crystals. Future work should aim to quantitatively assess these aspects, particularly focusing on uniformity and defect rates in crystals produced by different methods. Such data would allow for a more definitive conclusion regarding the suitability of each crystallization technique for specific applications in structural biology and material science.
Figure 2a,b, shown in the Results section, compare the initial phases of PC protein crystallization using vapor diffusion method HD and nanotemplate technique LB, respectively, obtained using SONICC imaging spectroscopy. Both images depict the crystallization droplets shortly after the crystallization process has begun, providing insight into the very early stages of nucleation and crystal formation. ImageJ was applied to count particles in both figures, and, after background digital subtraction, yielded a very low number of light spots a few pixels wide concentrated in an area inside the circle of the drop (around 10 for both methods), suggesting that, at this early stage, nucleation has only started and crystals that have formed are around the lower limit of detectability of SONICC technique. Error in the numerical estimate is large in view of threshold selection in the software, comprising the zero particle value. Figure 2a displays a uniform bluish hue, which is regardless indicative of the presence of small protein crystals or pre-nucleation clusters. Figure 2b shows a combination of pinks with blue hues, a color variation suggesting that LB technique varied conditions from HD in the same early phase of crystallization, thus influencing the nucleation and growth of protein crystals. The above Figure 3a,b and Figure 4a,b were treated with GIMP imaging software to lighten the light spots from the SONICC technique. Figure 5a,b shows the results of the digital treatment of Figure 3, essentially to provide an enhanced view of the early crystallization stages, allowing for a clearer comparison of the initial nucleation and growth between the HD and LB methods.
In Figure 6, the software improvements of Figure 4a above are reported with the analysis by ImageJ on the images resulting from background removal with GIMP. ImageJ reports and numbers the identified particles surrounding them with a light blue circle. Figure 6a,b provide a more detailed analysis of the crystal growth over time, with Figure 6a highlighting the particles identified by ImageJ after the digital treatment of Figure 4a (HD method) and Figure 6b (LB method) with respect to Figure 4b. The software, for technical reasons arising from many particles analyses, cannot count more than actual large number of particles circled in Figure 6b, leaving many particles out of the count. They were manually counted, with a result of more than 200, and included in the following Figure 7. This analysis further emphasizes the difference in crystallization patterns between the HD and LB methods, with the LB method showing a higher degree of ordered and uniform crystal growth, particular evident in Figure 4b and Figure 6b when compared to Figure 4a and Figure 6a, respectively.
In our analysis of crystal growth models, we explore how the intrinsic properties of proteins, such as molecular structure and stability, influence crystallization kinetics of crystal formation and the suitability of the resulting crystals for structural biology and materials science applications. In Figure 7, the growth of particles over time for two different methods discussed above is analyzed, further illustrating the differences between the conventional HD and the LB crystallization methods. The number of particles, obtained as discussed in the Methods section and above, is plotted on a logarithmic scale against time, also on a logarithmic scale which emerged as the most effective representation. Figure 7 shows that the LB method results in a faster growth of particles over time compared to the HD method. Concerning a quantitative analysis and considering the large errors in the numerical analyses from ImageJ, the employment of a log–log representation to examine the empirical trends associated with traditional HD compared to the LB methods unveils a striking preference towards linear dependence: the linear regression upon the log-transformed variables elucidates a significantly high degree of model reliability, as evidenced by the coefficients of determination, with R2 values of 0.998 and 0.991 for the HD and LB preparations, respectively. The preference for the analytical finding was further confirmed by an investigation into a semi-logarithmic dependency—entailing the logarithm of particle counts versus time variable—which, however, culminated in substantially diminished values of the coefficients of determination: 0.847 for HD and 0.855 for LB. Such empirical evidence robustly advocates for the statistical predominance of the log-log relational framework, thereby positing a power law dynamic as the governing interplay between the variables in question, in stark contrast to an exponential correlation that would ostensibly prevail under a semi-logarithmic regime. In the literature, the crystallization process has been explored through various models, with power laws and exponential functions being prominent [28]. The choice between these models largely depends on the specific conditions of the system under study. The exponential growth is described by the equation N(t) = N0(1 − e−kt), where N(t) signifies the quantity of crystals at time t, N0 represents the initial concentration, and k denotes the rate constant. This model of growth is characterized by an initial rapid expansion phase, subsequently decelerating as the reactant is progressively depleted. Thus, the exponential growth models are typically associated with simpler, more controlled crystallization processes where the rate of transformation is directly proportional to the reactant concentration. This model is often applied in scenarios with well-defined conditions, where the initial rapid growth phase is followed by a slowdown as the reactant concentration is depleted. Conversely, power law dynamics are prevalent in more intricate dynamic systems, exemplified by the development of complex structures during the crystallization process in which substances aren’t evenly distributed or when clusters form in unique patterns. The dependency on time for such systems is articulated through the equation N(t) = k⋅tα, where k is a constant and α is the power law exponent, indicating the extent of time dependence. In scenarios where dendritic growth, non-homogeneous systems, aggregation dynamics, or fractal distributions dominate, a distinct power law trend is observable over time. In particular, it is useful in capturing the multi-scale and stochastic nature of crystallization processes [29], which are influenced by a multitude of environmental and physicochemical factors. It is critical to recognize that these models are simplifications, and the real-world behavior of crystallization can vary significantly, influenced by factors like material purity, external conditions, and the specific nature of the substances involved.
PC showcased an exceptional ability to crystallize under a wide variety of conditions, including a broad pH range and in the presence of numerous precipitants and additives. This versatility to form crystals of vastly different dimensions and morphologies, ranging from microscale crystals suitable for serial crystallography to larger crystals of several hundred micrometers [11], is highly compatible with present findings to follow a power law in its time dependence deposition as shown by the interpretation of SONICC experiments from both the HD and LB methods. The resulting complexity of this protein crystallization can have practical applications in designing biomedical delivery systems, for instance. The scale-invariant nature of power laws means that phycocyanin’s behavior remains consistent across different scales and conditions, simplifying the scaling up of production or application methods. Understanding phycocyanin’s power law behavior not only sheds light on its fundamental properties but also paves the way for innovative applications, taking advantage of its bioactive properties and predictable behavior. Further, our investigation into the crystallization dynamics of PC protein provides critical insights into the stability and formation of protein crystals, suggesting potential applications in precision drug delivery systems in which controlled release of therapeutic agents is achieved through tailored dissolution rates of the protein crystals.

5. Conclusions and Future Trends

This study provides a comprehensive insight into the early phases of PC crystal formation, with a particular focus on the application of LB nanotemplate and traditional hanging drop (HD) vapor diffusion methods, analyzed through SONICC spectroscopy. Our findings reveal that the LB nanotemplate method significantly enhances the nucleation process, leading to a more uniform and potentially efficient crystallization of PC compared to the conventional HD method. The uniformity and repeatability of PC LB multilayer deposition, as confirmed by quartz crystal microbalance and atomic force microscopy, underline the effectiveness of the LB nanotemplate in organizing PC molecules into functional crystalline arrays. The comparative analysis between the HD and LB methods, as visualized through SONICC spectroscopy, highlights the distinct advantages of utilizing LB nanotemplates for protein crystallization. The early stages of crystal formation, particularly nucleation, were markedly more pronounced in the LB method, suggesting that the organized structure of nanotemplates facilitates a conducive environment for crystal growth. Furthermore, the log–log analysis of particle growth over time demonstrates a power law dynamic in crystal formation, suggesting that the crystallization process under LB conditions follows a predictable and scalable model, making it particularly suitable for applications requiring high-quality protein crystals. Further, the promising outcomes of this study pave the way for several future research directions:
  • Optimization of LB nanotemplates: Further research can focus on optimizing the composition, surface pressure, and deposition conditions of LB nanotemplates to enhance the crystallization efficiency and quality of not only PC but also other protein molecules of interest in structural biology and material science.
  • Integration with advanced spectroscopy techniques: integrating SONICC with other advanced spectroscopy techniques, such as dynamic light scattering (DLS) and X-ray free electron laser (XFEL) crystallography, could provide a multi-dimensional understanding of protein crystallization processes, from nucleation to complete crystal growth.
  • Application in biomaterials development: The insights gained from the crystallization behavior of PC can be leveraged to design novel biomaterials with tailored properties, such as biocompatible photonic devices, biosensors, and drug delivery systems, exploiting the unique fluorescent and stable crystalline characteristics of PC.
  • Scalable production of protein crystals: considering the power law behavior of PC crystallization, future studies could explore the scalability of the LB method for industrial-scale production of protein crystals, essential for pharmaceutical and biotechnological applications.
  • Protein crystallization: exploring into the molecular mechanisms that govern protein crystallization within LB nanofilms could uncover further fundamental insights into protein–protein and protein–surface interactions.
By coupling the full potential of LB nanotemplates and SONICC spectroscopy, future research can significantly advance our understanding of protein crystallization, opening up developments of protein-based technologies and materials. To further elucidate the mechanisms underlying PC protein crystallization, future research should employ molecular dynamics simulations for detailed atomistic insights and X-ray crystallography to precisely define the structural organization, enhancing our understanding of their functional properties and guiding improvements in biotechnological applications.

Author Contributions

Conceptualization, E.P. and R.E.; methodology, P.G., S.F. and C.R.; software, E.P., S.F. and R.E.; validation, E.P., P.G., S.F., C.R. and R.E.; formal analysis, E.P. and R.E.; investigation, E.P., P.G., S.F., C.R. and R.E.; resources, E.P. and R.E.; data curation, E.P., P.G., S.F., C.R. and R.E.; writing—original draft preparation, E.P., P.G., S.F., C.R. and R.E.; writing—review and editing, E.P., P.G., S.F., C.R. and R.E.; visualization, E.P. and R.E.; supervision, E.P. and R.E. All authors have read and agreed to the published version of the manuscript.

Funding

This research received no external funding.

Data Availability Statement

Data are contained within the article.

Acknowledgments

The authors appreciate the help of group of Petra Fromme at Biodesign Center for Applied Structural Discovery, Arizona State University for the SONICC experiments and John Spence, Department of Physics, Arizona State University for LB instrumentation. We also would like to thank Raimund Fromme, ASU for his courtesy in supplying of phycocianin protein and Sergey Magonov, SPM Laboratories LLC, Tempe, AZ, USA for his collaboration in AFM measurements.

Conflicts of Interest

The authors declare no conflicts of interest.

References

  1. Cohen, A.E. A new era of synchrotron-enabled macromolecular crystallography. Nat. Methods 2021, 18, 433–434. [Google Scholar] [CrossRef] [PubMed]
  2. Borek, D.; Cymborowski, M.; Machius, M.; Minor, W.; Otwinowski, Z. Diffraction data analysis in the presence of radiation damage. Acta Crystallogr. Sect. D Struct. Biol. 2010, 66 Pt 4, 426–436. [Google Scholar] [CrossRef] [PubMed]
  3. Koizumi, H.; Suzuki, R.; Tachibana, M.; Tsukamoto, K.; Yoshizaki, I.; Fukuyama, S.; Suzuki, Y.; Uda, S.; Kojima, K. Importance of Determination of Crystal Quality in Protein Crystals when Performing High-Resolution Structural Analysis. Cryst. Growth Des. 2016, 16, 4905–4909. [Google Scholar] [CrossRef]
  4. Maveyraud, L.; Mourey, L. Protein X-ray Crystallography and Drug Discovery. Molecules 2020, 25, 1030. [Google Scholar] [CrossRef] [PubMed]
  5. Li, W.; Su, H.N.; Pu, Y.; Chen, J.; Liu, L.N.; Liu, Q.; Qin, S. Phycobiliproteins: Molecular structure, production, applications, and prospects. Biotechnol. Adv. 2019, 37, 340–353. [Google Scholar] [CrossRef] [PubMed]
  6. Pechkova, E. Light-harvesting proteins intermolecular order in the Langmuir-Blodgett (LB) nanofilms—Methods and applications. J. Phys. Conf. Ser. 2023, 2579, 012010. [Google Scholar] [CrossRef]
  7. Han, H.; Round, E.; Schubert, R.; Gül, Y.; Makroczyová, J.; Meza, D.; Heuser, P.; Aepfelbacher, M.; Barák, I.; Betzel, C.; et al. The XBI BioLab for life science experiments at the European XFEL. J. Appl. Crystallogr. 2021, 54, 7–21. [Google Scholar] [CrossRef] [PubMed]
  8. Pagels, F.; Guedes, A.C.; Amaro, H.M.; Kijjoa, A.; Vasconcelos, V. Phycobiliproteins from cyanobacteria: Chemistry and biotechnological applications. Biotechnol. Adv. 2019, 37, 422–443. [Google Scholar] [CrossRef] [PubMed]
  9. Hartmann, V.; Harris, D.; Bobrowski, T.; Ruff, A.; Frank, A.; Pomorski, T.G.; Rögner, M.; Schuhmann, W.; Adir, N.; Nowaczyk, M.M. Improved quantum efficiency in an engineered light harvesting/photosystem II super-complex for high current density biophotoanodes. J. Mater. Chem. A 2020, 8, 14463–14471. [Google Scholar] [CrossRef]
  10. Beck, C.; Grimaldo, M.; Roosen-Runge, F.; Maier, R.; Matsarskaia, O.; Braun, M.; Sohmen, B.; Czakkel, O.; Schweins, R.; Zhang, F.; et al. Following Protein Dynamics in Real Time during Crystallization. Cryst. Growth Des. 2019, 19, 7036–7045. [Google Scholar] [CrossRef]
  11. Sarrou, I.; Feiler, C.G.; Falke, S.; Peard, N.; Yefanov, O.; Chapman, H. C-phycocyanin as a highly attractive model system in protein crystallography: Unique crystallization properties and packing-diversity screening. Acta Crystallogr. Sect. D Struct. Biol. 2021, 77, 224–236. [Google Scholar] [CrossRef] [PubMed]
  12. Pechkova, E.; Nicolini, C. Langmuir-Blodgett nanotemplates for protein crystallography. Nat. Protoc. 2017, 12, 2570–2589. [Google Scholar] [CrossRef] [PubMed]
  13. Kissick, D.J.; Wanapun, D.; Simpson, G.J. Second-order nonlinear optical imaging of chiral crystals. Annu. Rev. Anal. Chem. 2011, 4, 419–437. [Google Scholar] [CrossRef] [PubMed]
  14. Haupert, L.M.; Simpson, G.J. Screening of protein crystallization trials by second order nonlinear optical imaging of chiral crystals (SONICC). Methods 2011, 55, 379–386. [Google Scholar] [CrossRef] [PubMed]
  15. Wampler, R.D.; Kissick, D.J.; Dehen, C.J.; Gualtieri, E.J.; Grey, J.L.; Wang, H.F.; Thompson, D.H.; Cheng, J.X.; Simpson, G.J. Selective detection of protein crystals by second harmonic microscopy. J. Am. Chem. Soc. 2008, 130, 14076–14077. [Google Scholar] [CrossRef] [PubMed]
  16. Haupert, L.M.; DeWalt, E.L.; Simpson, G.J. Modeling the SHG activities of diverse protein crystals. Acta Crystallogr. Sect. D Struct. Biol. 2012, 68 Pt 11, 1513–1521. [Google Scholar] [CrossRef] [PubMed]
  17. Fromme, R.; Ishchenko, A.; Metz, M.; Chowdhury, S.R.; Basu, S.; Boutet, S.; Fromme, P.; White, T.A.; Barty, A.; Spence, J.C.H.; et al. Serial femtosecond crystallography of soluble proteins in lipidic cubic phase. IUCrJ 2015, 2 Pt 5, 545–551. [Google Scholar] [CrossRef] [PubMed]
  18. Jiménez, Y.; Otero, M.; Arnau, A. QCM Data Analysis and Interpretation. In Piezoelectric Transducers and Applications; Arnau, A., Ed.; Springer: Berlin, Germany, 2008; pp. 331–398. [Google Scholar] [CrossRef]
  19. Koyfman, A.; Magonov, S.; Reich, N. Self-assembly of DNA arrays into multilayer sheets. Langmuir 2009, 25, 1091–1095. [Google Scholar] [CrossRef] [PubMed]
  20. Yermolenko, I.S.; Fuhrmann, A.; Magonov, S.N.; Lishko, V.K.; Oshkadyerov, S.P.; Ros, R.; Ugarova, T.P. Origin of the nonadhesive properties of fibrinogen matrices probed by force spectroscopy. Langmuir 2010, 26, 17269–17277. [Google Scholar] [CrossRef]
  21. Reeve, J.E.; Anderson, H.L.; Clays, K. Dyes for biological second harmonic generation imaging. Phys. Chem. Chem. Phys. 2010, 12, 13484–13498. [Google Scholar] [CrossRef]
  22. Closser, R.G.; Gualtieri, E.J.; Newman, J.A.; Simpson, G.J. Characterization of salt interferences in second-harmonic generation detection of protein crystals. J. Appl. Crystallogr. 2013, 46, 1903–1906. [Google Scholar] [CrossRef] [PubMed]
  23. Campagnola, P.J.; Millard, A.C.; Terasaki, M.; Hoppe, P.E.; Malone, C.J.; Mohler, W.A. Three-dimensional high-resolution second-harmonic generation imaging of endogenous structural proteins in biological tissues. Biophys. J. 2002, 82, 493–508. [Google Scholar] [CrossRef] [PubMed]
  24. Millard, A.C.; Campagnola, P.J.; Mohler, W.; Lewis, A.; Loew, L.M. [3] Second harmonic imaging microscopy. In Methods in Enzymology; Academic Press: Cambridge, MA, USA, 2003; Volume 361, pp. 47–69. [Google Scholar]
  25. Dörner, K.; Martin-Garcia, J.M.; Kupitz, C.; Gong, Z.; Mallet, T.C.; Chen, L.; Wachter, R.M.; Fromme, P. Characterization of Protein Nanocrystals Based on the Reversibility of Crystallization. Cryst. Growth Des. 2016, 16, 3838–3845. [Google Scholar] [CrossRef] [PubMed]
  26. Newman, J.; Scarborough, N.; Pogranichnyi, N.; Closser, R.; Simpson, G. Protein Crystal Staining for Second Harmonic Generation Imaging. Acta Crystallogr. Sect. A Found. Adv. 2014, 70, C1154. [Google Scholar] [CrossRef]
  27. Madden, J.T.; DeWalt, E.L.; Simpson, G.J. Two-photon excited UV fluorescence for protein crystal detection. Acta Crystallogr. Sect. D Struct. Biol. 2011, 67 Pt 10, 839–846. [Google Scholar] [CrossRef] [PubMed]
  28. Devos, C.; Van Gerven, T.; Kuhn, S. A Review of Experimental Methods for Nucleation Rate Determination in Large-Volume Batch and Microfluidic Crystallization. Cryst. Growth Des. 2021, 21, 2541–2565. [Google Scholar] [CrossRef]
  29. Kwon, J.S.-I.; Nayhouse, M.; Christofides, P.D. Multiscale, Multidomain Modeling and Parallel Computation: Application to Crystal Shape Evolution in Crystallization. Ind. Eng. Chem. Res. 2015, 54, 11903–11914. [Google Scholar] [CrossRef]
Figure 1. Deposition and characterization of LB films: (a) LB monolayer deposition process of PC to illustrate the control over the surface pressure. (b) Quantitative analysis of PC surface density ρS dependence on the number of LB layers as measured by QCM (c) High-resolution AFM image of PC LB nanofilms.
Crystals 14 00395 g001
Figure 2. The nascent phase of PC crystallization as captured by SONICC technology, comparing the classical HD method (a) and the LB technique (b).
Crystals 14 00395 g002
Figure 3. Crystallization progression as observed by SONICC 30 min post-initiation, with distinct differences between the HD (a) and LB (b) methods becoming apparent.
Crystals 14 00395 g003
Figure 4. The significant evolution in the crystallization process after 22 h is shown, revealing a stark contrast between the HD (a) and LB (b) methods.
Crystals 14 00395 g004
Figure 5. Enhanced visualization of early crystallization stages. This figure presents digitally processed images from SONICC spectroscopy, focusing on the crystallization process 30 min after initiation. The processing aims to highlight the emerging crystal nuclei, offering a clearer comparison between the HD method (a) and the LB technique (b). The enhanced images reveal the subtle onset of nucleation and initial crystal growth. Notably, (b) demonstrates the advantageous effect of the LB nanotemplate in facilitating a more orderly and effective nucleation process, as evidenced by the increased clarity and number of discernible bright spots, which represent the initial crystalline formations. The light blue circles identify the detection and counting of crystals by the ImageJ software.
Crystals 14 00395 g005
Figure 6. ImageJ-enhanced analysis of PC crystal growth over time, as visualized by SONICC spectroscopy analyzed through GIMP and ImageJ, which circles and numbers particles. (a) depicts the growth pattern and particle distribution achieved through the classical HD method, showing a less uniform and more scattered arrangement of crystals; (b), on the other hand, illustrates the results of the LB nanotemplate method, revealing a denser and more uniform field of crystalline particles, indicative of a more orderly and efficient nucleation and crystal growth process. This figure underscores the superior performance of the LB method in promoting organized crystal formation, potentially leading to high-quality protein crystals for structural biology and material science applications. The light blue circles identify the detection and counting of crystals by the ImageJ software.
Crystals 14 00395 g006
Figure 7. Comparative analysis of particle growth dynamics in PC crystallization using HD (black circles) and LB (white circles), plotted on a bi-logarithmic scale produced by ImageJ. The time-dependent increase in the number of crystalline particles is shown for both crystallization techniques, showcasing a more pronounced and rapid growth trajectory for the LB method compared to the conventional HD approach. The data points are fitted with best-fit lines to highlight the underlying power law relationship governing the crystallization process. The superior performance of the LB technique is evidenced by the steeper slope of its best-fit line, indicating a more efficient nucleation and growth process.
Crystals 14 00395 g007
Disclaimer/Publisher’s Note: The statements, opinions and data contained in all publications are solely those of the individual author(s) and contributor(s) and not of MDPI and/or the editor(s). MDPI and/or the editor(s) disclaim responsibility for any injury to people or property resulting from any ideas, methods, instructions or products referred to in the content.

