Article

The Thermophysical Properties of TcO2

1
School of Mechanical and Materials Engineering, Washington State University, Pullman, WA 99163, USA
2
Department of Materials Science and Engineering, Missouri University of Science and Technology, Rolla, MO 65409, USA
3
Pacific Northwest National Laboratory, Richland, WA 99352, USA
*
Author to whom correspondence should be addressed.
Crystals 2024, 14(3), 228; https://doi.org/10.3390/cryst14030228
Submission received: 29 January 2024 / Revised: 22 February 2024 / Accepted: 24 February 2024 / Published: 28 February 2024

Abstract

:
Technetium-99 is a highly radioactive isotope with a long half-life that is common in nuclear waste. It volatizes at a low temperature, which poses a significant challenge to the clean-up and containment processes. Due to difficulties in purifying technetium compounds, their thermophysical properties have not been measured or calculated. Here, first principle methods are used along with the quasi quasi-harmonic harmonic approximation to compute the Debye temperature, volumetric thermal expansion coefficient, bulk modulus, and heat capacity of rutile TcO2 for temperatures ranging from 0 to 1500 K and applied pressures ranging from 0 to 255 GPa. The computed atomic structures agree well with the results from diffraction measurements. The computed thermophysical properties are in the neighborhood of other rutile metal oxides and, in particular, are within approximately 10–13% of rutile ReO2, which is frequently used as a substitute for TcO2 in experimental studies.

1. Introduction

Technetium, Tc, is a transition metal element with no stable isotope that is a by-product of uranium fission. Of particular interest is 99Tc, a pure β-emitter, which has a half-life of 2.13 × 10⁵ years. Due to its electronic structure, 4d55s2, Tc is capable of forming a wide range of complex compounds, for example, as an oxide, it is known to assume multiple neutral polymorphs of Tc2O7, TcO2, and possibly Tc2O5 [1,2,3,4,5,6]. The pentavalent ionic species TcO4 has high mobility in subsurface soil [7], which makes the cleanup and containment of Tc from waste sources particularly important.
The current long-term containment plan for highly radioactive nuclear waste involves its vitrification, yet this radioactive isotope has a low retention during the conversion to glass [8,9,10,11]. This is attributed to the volatilization of Tc at low temperatures: Tc2O7, Tc(VII), boils at 311 °C, and TcO2, Tc(IV), sublimes at 900 °C [12]. In addition, glasses with high concentrations of Tc are known to precipitate crystalline Tc oxide and alkali pertechnetates, which significantly impact the structural stability of the glass [11,13]. The vitrification and retention of Tc depend upon many factors, including the melter feed chemistry, for example, waste composition and redox, as well as the processing parameters, for example, temperature, feed reaction kinetics, and glass melt bubbling. At this time, the local atomic structure of Tc in glass, the kinetics of crystallization, and the volatilization mechanisms are only partially understood [8,14,15].
Studying Tc compounds is challenging in part due to their highly radioactive nature. Isolating, purifying, and characterizing the crystalline phases is difficult, and for many phases, there is no reported information. First-principles methods have been used to examine the ground-state properties of several Tc oxide phases, including the atomic and electronic structure and the phonon density of states [5,16]. However, the thermophysical behavior at finite temperatures has yet to be reported. Here, first-principles methods are applied in conjunction with energy volume, E(V), and equations of state to predict the characteristics of rutile TcO2.

2. Methods

First-principles density functional theory [17,18] calculations are performed with the Quantum ESPRESSO 5.3.0 software package [19] using the provided projector augmented-wave type pseudopotentials generated from the Atomic code 10 April 2014 [20,21,22]. The exchange-correlation functional is treated in the modified Perdew–Burke–Ernzerhof type of generalized gradient approximation (PBEsol-GGA) [23,24,25], which is anticipated to be the best potential for this compound. The electronic wavefunction is expressed as a planewave summation truncated at an energy cutoff of 1088 eV, and the charge density is represented on a grid with an energy cutoff of 6122 eV. Brillouin zone integration is performed within the Monkhorst–Pack scheme [26] on an 8 × 8 × 8 k-point mesh. This approach results in the calculated forces being converged to better than 5 meV/Å.
The thermophysical properties of TcO2 are predicted from the first-principles calculations using the Gibbs2 software package, version 1.0, [27,28] to fit an E(V) equation of state. The Debye–Slater [29,30] and Debye–Grüneisen [31] models are used to approximate the phonon density of states. The Poisson’s ratio, ν, is approximated as 0.25. The well-established error due to the exchange-correlation potential being approximated as a local functional of the charge density is corrected using three empirical energy corrections [27,32]: a rigid correction directly proportional to the volume (PSHIFT), a rigid correction inversely proportional to the volume (APBAF), and a correction to the E(V) curvature (BPSCAL). For the third correction, the bulk modulus, B, is required. Since it has yet to be experimentally measured, a first-principles calculated B, 295.8 GPa, is used for the initial calculations. Ultimately, the physical parameters, ν and B, used in the energy correction are determined through an optimization process.

3. Results and Discussion

TcO2 has a distorted rutile structure, space group P21/c, with room temperature lattice parameters measuring a = 5.6891, b = 4.7546, c = 5.5195 Å, and β = 121.453° [5]. The calculated ground-state structure is shown in Figure 1a and has the lattice parameters a = 5.5909, b = 4.7608, c = 5.5057 Å, and β = 121.275°. The computed atomic positions are given in Table 1. The resulting unit cell volume is only 1.66% smaller than the reported experimental volume, which validates the theoretical approach used here.
The ground-state unit cell is hydrostatically expanded and compressed to sample the energy surface near the ground state. The resulting E(V) is fit to the Birch–Murnaghan isothermal equation of state [33]. The computed data and fitted curve are shown in Figure 1b.
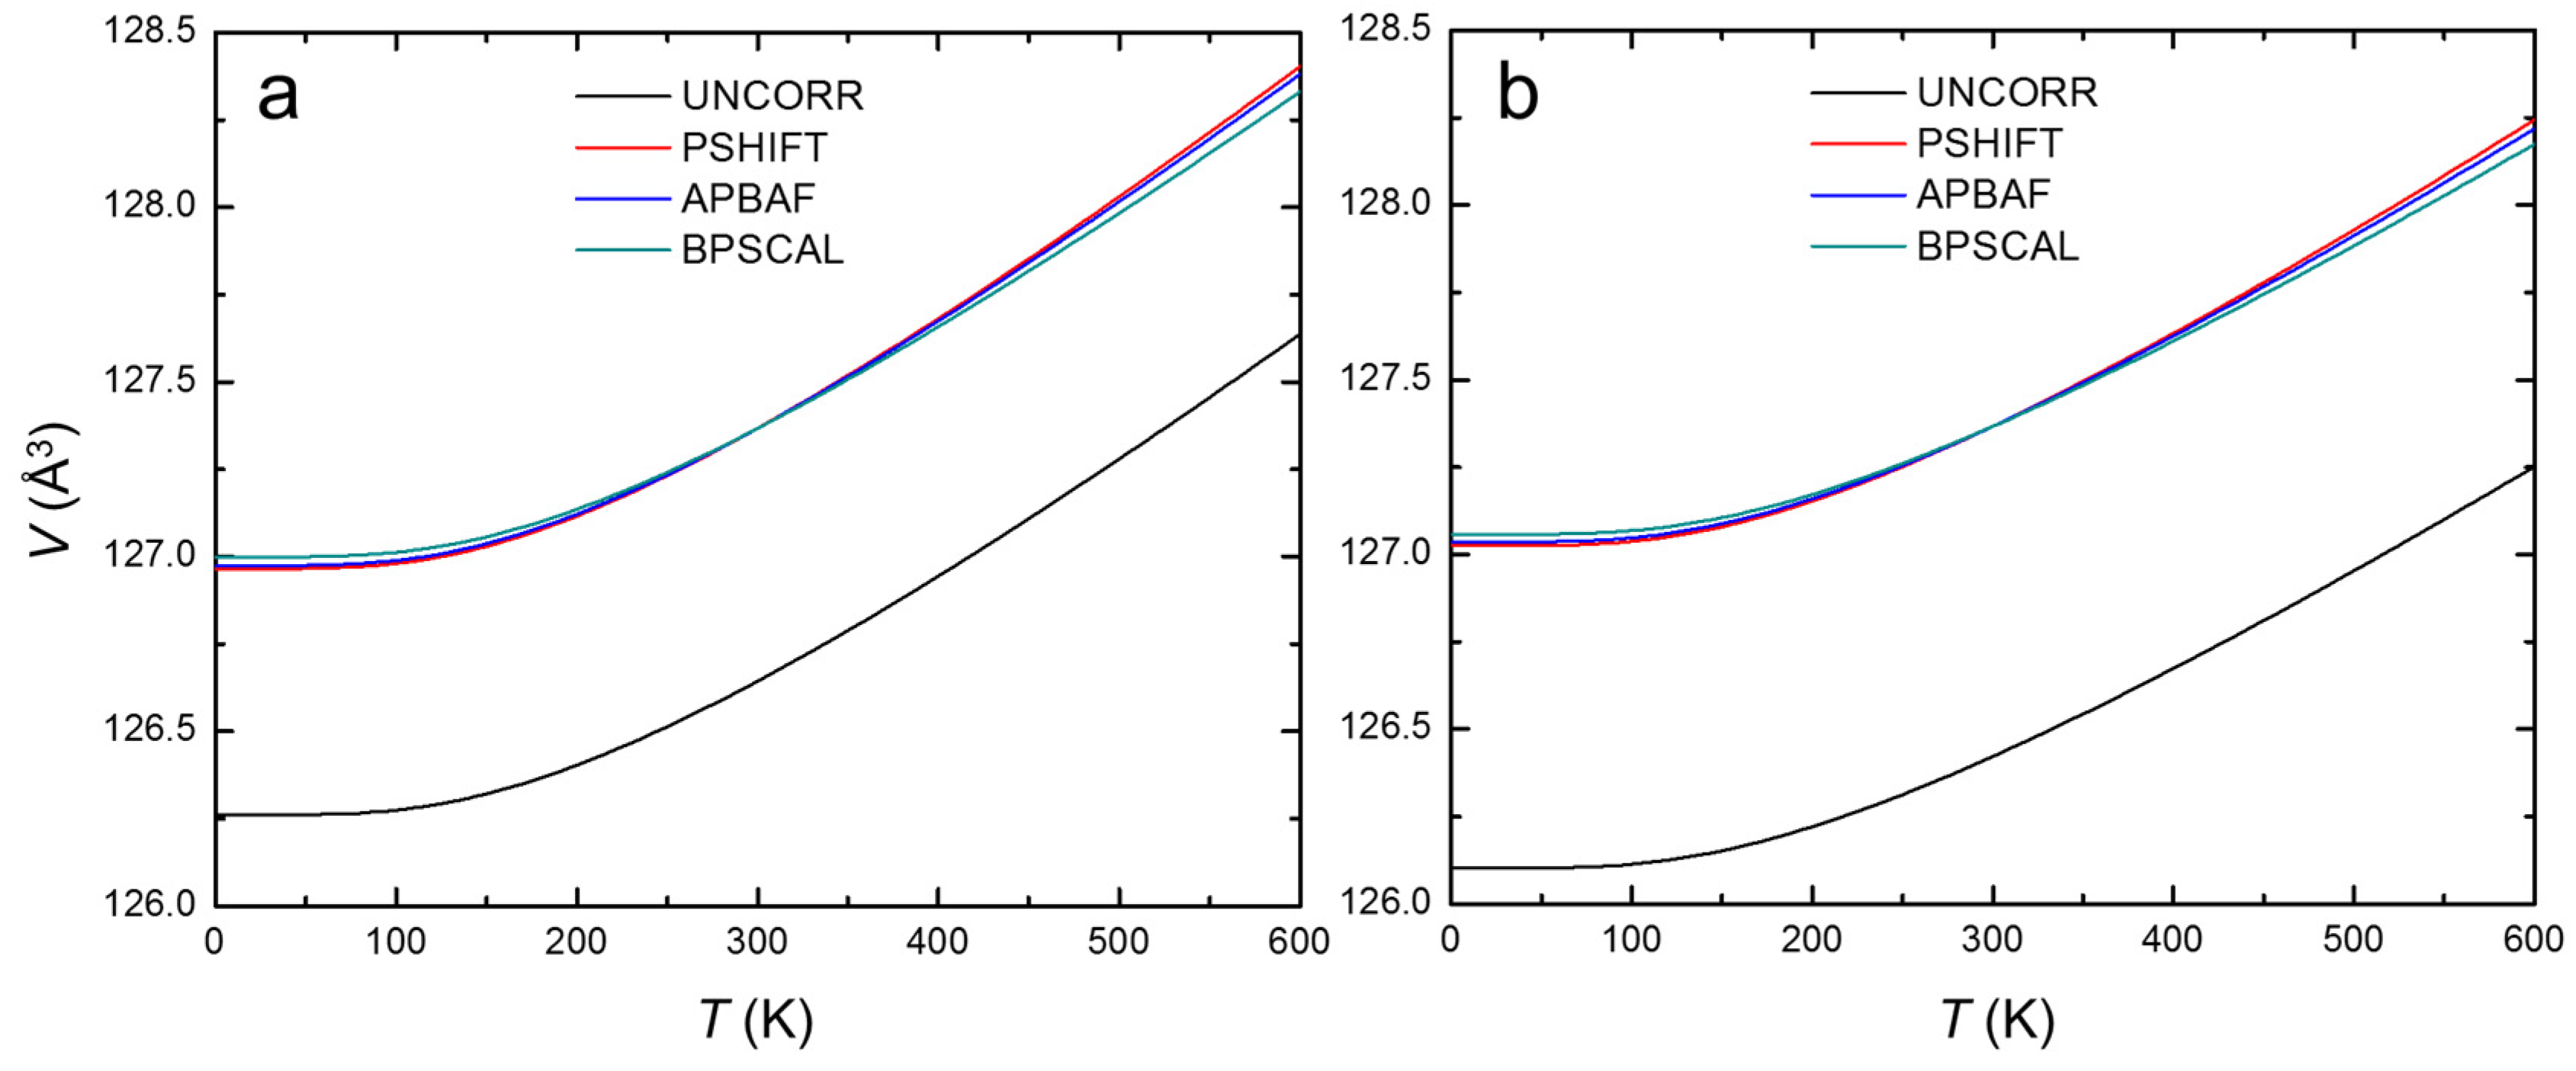
The Debye–Slater and Debye–Grüneisen thermal models without corrections are used to obtain the volume at an applied pressure of 0 GPa. At a temperature of 15 K, the volumes are 126.3 and 126.1 Å3 for the Debye–Slater and Debye–Grüneisen models, respectively; increasing the temperature to 298.15 K yields volumes of 126.6 and 126.4 Å3. The uncorrected volume as a function of temperature is given in Figure 2 and Table 2, labeled UNCORR.
Empirical energy corrections are used to force the computed volume at 298.15 K to match the experimentally reported volume, 127.4 Å3, as shown in Table 2. The corrections applied at 298.15 K substantially improve the accuracy of the calculated volume at 15 K, which confirms that the approach used here is reasonable. In particular, the Debye–Grüneisen model with the BPSCAL correction has a predicted volume of 127.1 Å3 at 15 K, which matches the experimentally determined volume to within the uncertainty of the method [5], suggesting that this approach will produce the most accurate results of the methods examined here.
The empirical energy corrections require experimental values for ν and B, neither of which are known. The volumes in Table 2 are determined by approximating, where ν = 0.25 and B = 295.8 GPa. It is possible to vary ν and B to find the values that yield the most accurate lattice volume. Table 3 shows the predicted lattice volume using the Debye–Grüneisen model and BPSCAL correction for a range of ν and B values. The parameter choices ν = 0.20 and B = 315 GPa yield a lattice volume of 127.120 Å3, ν = 0.20 and B = 320 GPa yields 127.126 Å3, and ν = 0.21, and B = 320 GPa yields 127.120 Å3, all of which are near the experimentally reported value 127.124 Å3 [5]. It is reasonable to conclude that the best choice for ν is between 0.20 and 0.21, and B is between 315 and 320 GPa. The Debye–Grüneisen model with the BPSCAL correction, using ν = 0.20 and B = 320 GPa, is used to predict the thermophysical properties of TcO2 at ambient conditions, as shown in Table 4.
The predicted Debye temperature of TcO2 at ambient conditions is 891.91 K. The Debye temperature is closely correlated to many physical properties, including specific heat, elastic constant, and melting point. The TcO2 Debye temperature is greater than that reported for the stable phase β-ReO2, 850 K, another group VII dioxide [34]. For the rutile structure ReO2, the calculated Debye temperature is 785 K [34]. Compared to other common oxides, the Debye temperature of TcO2 falls somewhere in between TiO2 (790 K) [35,36] and Al2O3 (950 K) [37].
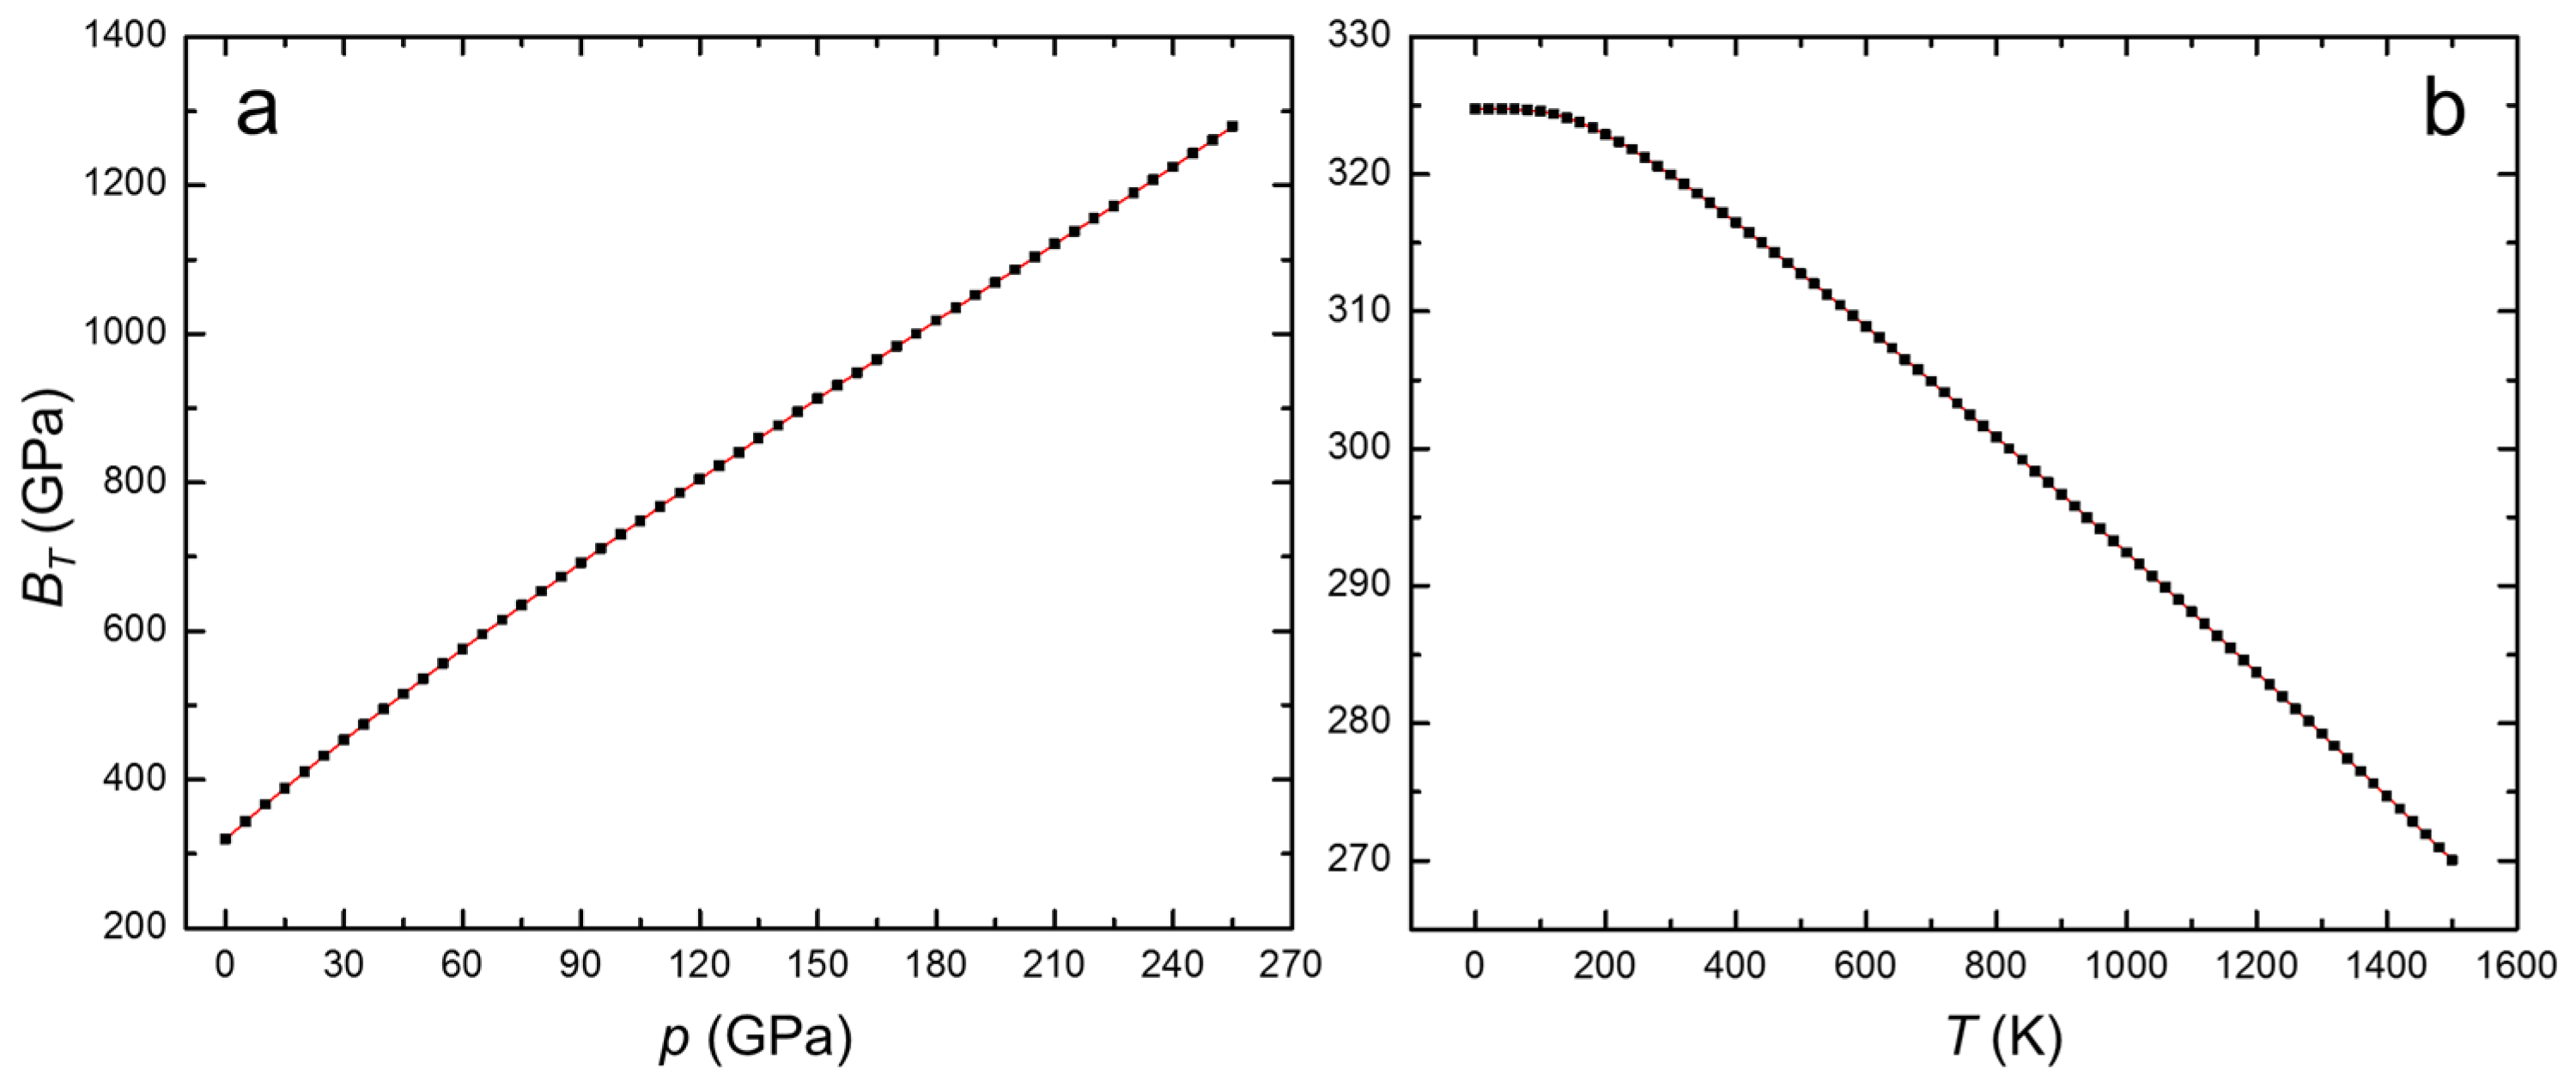
Figure 3 shows the predicted isothermal bulk modulus as a function of temperature and pressure. At ambient conditions, the calculated modulus, 320 GPa, is approximately that of β-ReO2, 322 GPa, but lower than the calculated rutile-phase ReO2, 353 GPa [34]. The high modulus reflects the relatively high bonding strength and density that are typical for most ceramic oxide materials. For comparison, the other rutile-type oxides, such as GeO2, MnO2, and SiO2, have bulk moduli of 270, 280, and 320 GPa, respectively [38,39].
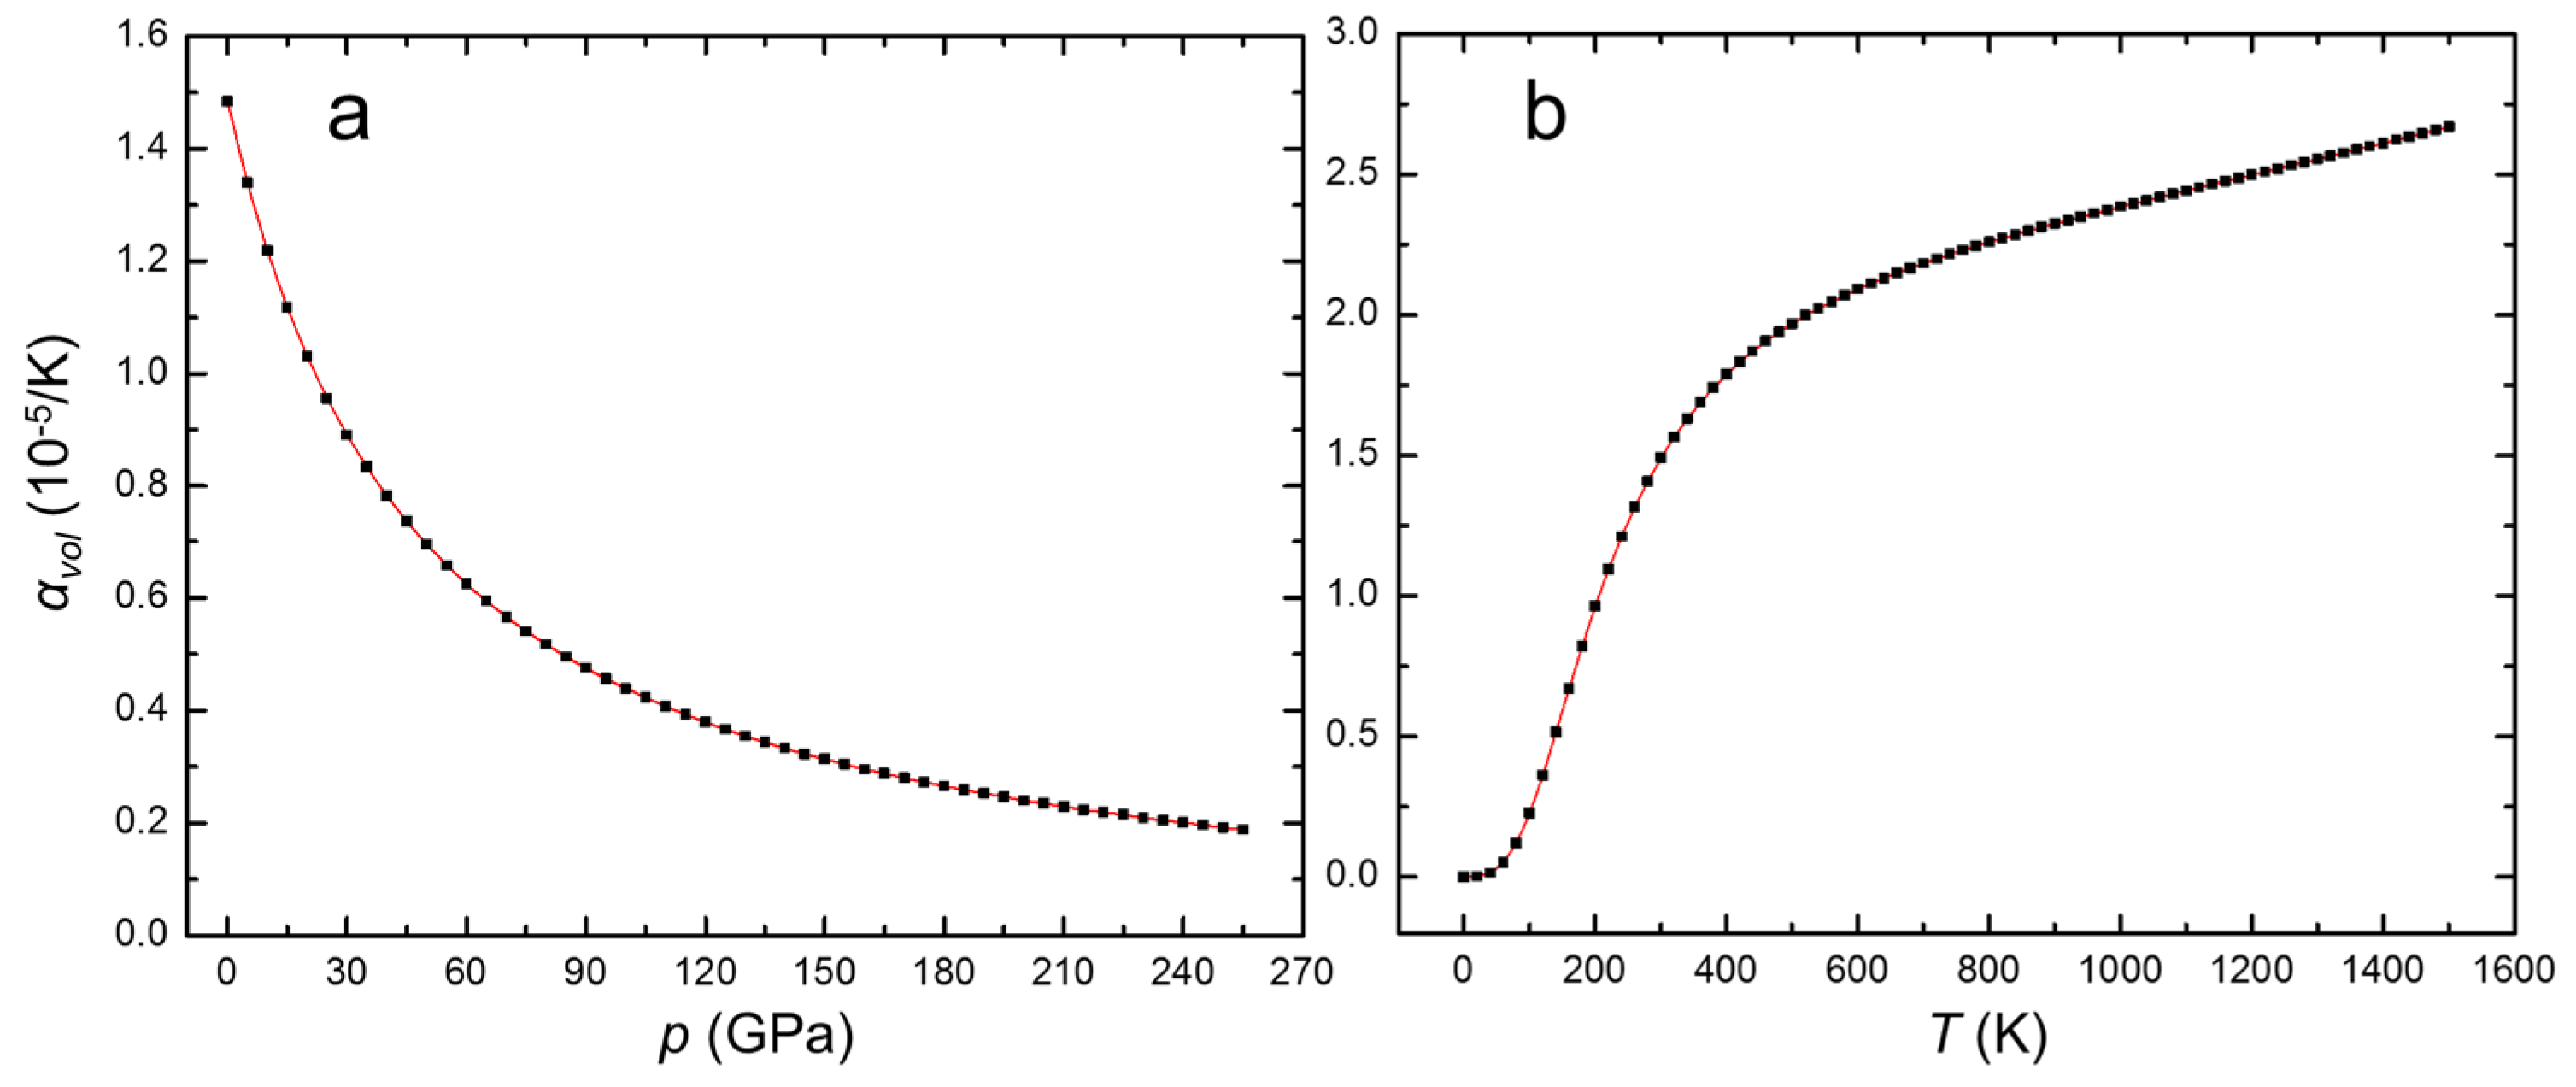
The predicted volumetric thermal expansion coefficient of TcO2 at ambient conditions is 1.484 × 10⁻⁵ K−1. The room temperature volumetric thermal expansion coefficients of other rutile-type oxides GeO2, SnO2 (cassiterite), SiO2 (stishovite), and MnO2 (pyrolusite) are 1.41 × 10⁻⁵ K−1, 1.42 × 10⁻⁵ K−1, 1.73 × 10⁻⁵ K−1, and 2.03 × 10⁻⁵ K−1, respectively [40,41,42]. Figure 4 shows the predicted pressure and temperature dependence of the volumetric thermal expansion. The temperature dependence has an S-shaped curve, which is common for many oxides.
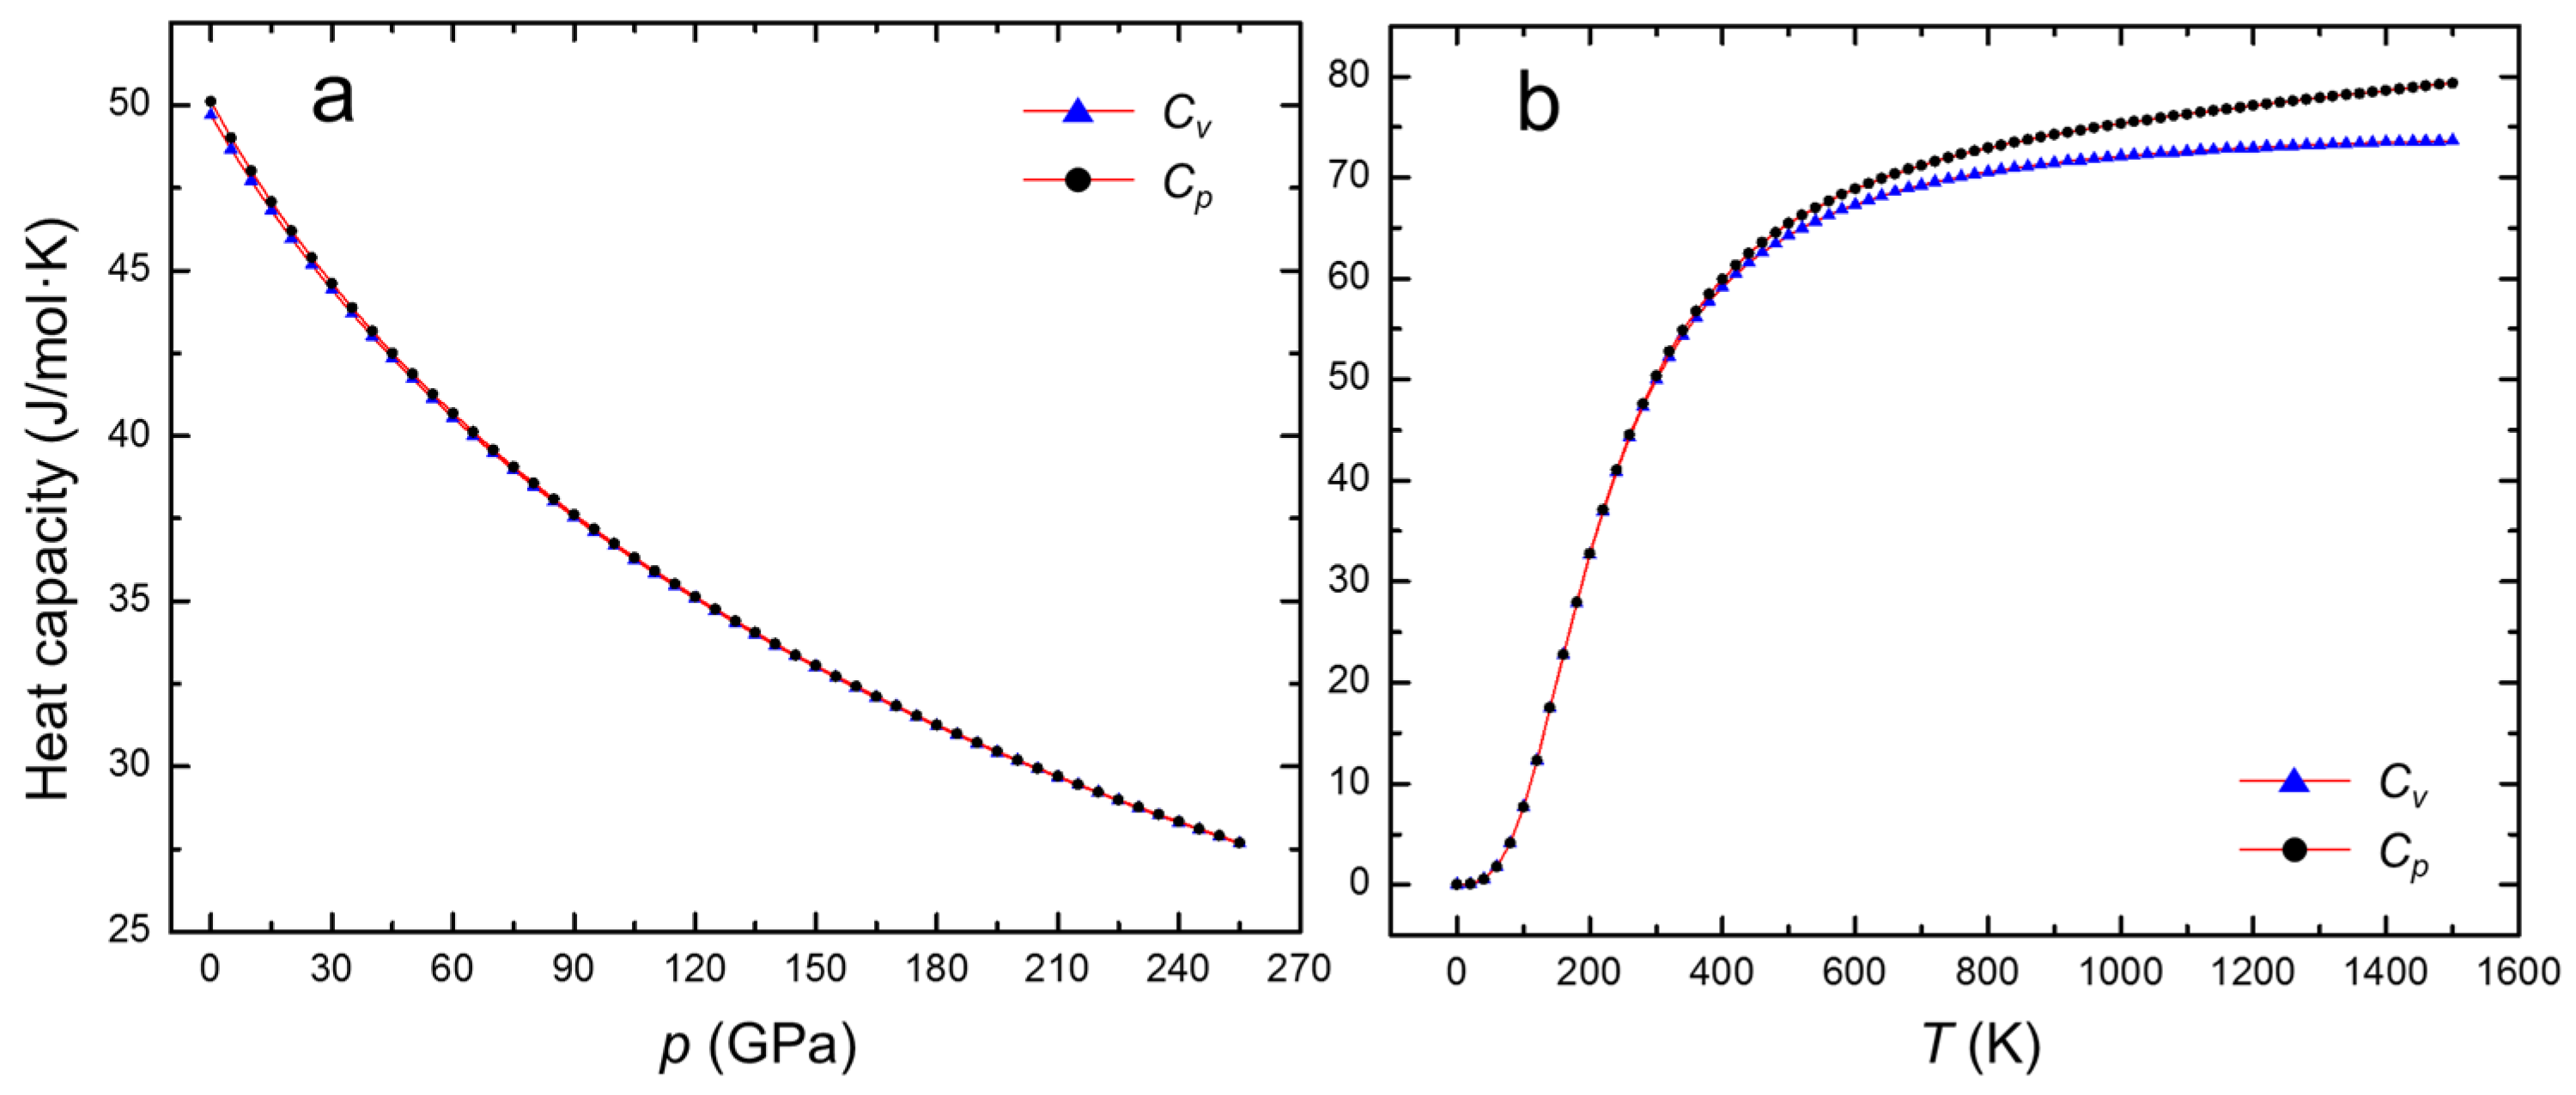
Figure 5 shows the computed heat capacities of TcO2 with respect to constant pressure (Cp) and volume (Cv) as a function of pressure or temperature. The values range from 0 J/mol·K at 0 K to 73.64 J/mol·K for Cv and 79.33 J/mol·K for Cp at 1500 K. Cv reaches the Dulong–Petit limit near 890 K, which coincides with the Debye temperature. Above this, Cv plateaus, but Cp continues to increase due to the volume expansion. The room temperature constant pressure heat capacity of 50.10 J/mol·K is approximately that of other oxides. It is slightly greater than CaO, 42.42 J/mol·K; SiO2, 44.42 J/mol·K; and BaO, 47.06 J/mol·K, and lower than GeO2, 51.95 J/mol·K; MnO2, 54.42 J/mol·K; TiO2, 55.10 J/mol·K; and ReO2, 56.60 J/mol·K [43,44].

4. Conclusions

First-principles data are used to predict the thermophysical properties of TcO2 using the Gibbs2 software version 1.0. The results indicate that TcO2 is a relatively stiff material with a bulk modulus of 320 GPa. The Poisson’s ratio is between 0.20 and 0.21. The Debye temperature of TcO2, 891.91 K, falls somewhere in between TiO2 (790 K) and Al2O3 (950 K). The volumetric thermal expansion coefficients of TcO2 at ambient conditions are 1.484 × 10⁻⁵/K, which is close to those of other rutile-type oxides, such as GeO2, SnO2, and SiO2. The room temperature constant pressure heat capacity of TcO2, 50.10 J/mol·K, is slightly higher than those of CaO, SiO2, and BaO but lower than those of GeO2, MnO2, TiO2, and ReO2. ReO2, which is sometimes used as a substitute for TcO2 in studies, has physical properties that are within 10 to 13% of those computed here. This difference is within the uncertainty arising from the approximations used in the calculations, suggesting that in many cases, using ReO2 may be a reasonable approximation for TcO2.

Author Contributions

H.Z.: computations, data analysis, writing—original draft preparation; J.L.: computations; J.S.M.: project administration, funding acquisition, writing—review and editing; S.P.B.: conceptualization, supervision, writing—review and editing, resources. All authors have read and agreed to the published version of the manuscript.

Funding

This research was performed using funding received from the U.S. Department of Energy (DOE) Offices of Nuclear Energy and Environmental Management through the Nuclear Energy University Program under the award DE-NE0008597, and the Office of River Protection award number 89304017CEM000001.

Data Availability Statement

Available within the body of the manuscript.

Acknowledgments

This research used resources from the Center for Institutional Research Computing at Washington State University.

Conflicts of Interest

The authors declare no conflicts of interest.

References

  1. Childs, B.C.; Braband, H.; Lawler, K.; Mast, D.S.; Bigler, L.; Stalder, U.; Forster, P.M.; Czerwinski, K.R.; Alberto, R.; Sattelberger, A.P.; et al. Ditechnetium heptoxide revisited: Solid-state, gas-phase, and theoretical studies. Inorg. Chem. 2016, 55, 10445–10452. [Google Scholar] [CrossRef] [PubMed]
  2. Chotkowski, M.; Wrzosek, B.; Grden, M. Intermediate oxidation states of technetium in concentrated sulfuric acid solutions. J. Electroanal. Chem. 2018, 814, 83–90. [Google Scholar] [CrossRef]
  3. Lawler, K.V.; Childs, B.; Czerwinski, K.R.; Sattelberger, A.P.; Poineau, F.; Forster, P.M. Unraveling the mystery of “tech red”—A volatile technetium oxide. Chem. Commun. 2018, 54, 1261–1264. [Google Scholar] [CrossRef] [PubMed]
  4. Lawler, K.V.; Childs, B.C.; Mast, D.S.; Czerwinski, K.R.; Sattelberger, A.P.; Poineau, F.; Forster, P.M. Molecular and electronic structures of M2O7(M = Mn, Tc, Re). Inorg. Chem. 2017, 56, 2448–2458. [Google Scholar] [CrossRef] [PubMed]
  5. Rodriguez, E.E.; Poineau, F.; Llobet, A.; Sattelberger, A.P.; Bhattacharjee, J.; Waghmare, U.V.; Hartmann, T.; Cheetham, A.K. Structural studies of TcO2 by neutron powder diffraction and first-principles calculations. J. Am. Chem. Soc. 2007, 129, 10244–10248. [Google Scholar] [CrossRef]
  6. Schwochau, K. Technetium: Chemistry and Radiopharmaceutical Applications; Wiley-VCH Verlag GmbH: Weinheim, Germany, 2000. [Google Scholar]
  7. Kim, D.; Kruger, A.A. Volatile species of technetium and rhenium during waste vitrification. J. Non-Cryst. Solids 2018, 481, 41–50. [Google Scholar] [CrossRef]
  8. Darab, J.G.; Smith, P.A. Chemistry of technetium and rhenium species during low-level radioactive waste vitrification. Chem. Mater. 1996, 8, 1004–1021. [Google Scholar] [CrossRef]
  9. Kim, D.S.; Bagaasen, L.M.; Crum, J.V.; Fluegel, A.; Gallegos, A.; Martinez, B.; Matyas, J.; Meyer, P.A.; Paulsen, D.; Riley, B.J.; et al. Investigation of Tc Migration Mechanism during Bulk Vitrification Process Using Re Surrogate; PNNL-16267; Pacific Northwest National Laboratory: Richland, WA, USA, 2006. [Google Scholar]
  10. Langowski, M.H.; Darab, J.G.; Smith, P.A. Volatility Literature of Chlorine, Iodine, Cesium, Strontium, Technetium, and Rhenium; Technetium and Rhenium Volatility Testing; PNNL-11052; Pacific Northwest National Laboratory: Richland, WA, USA, 1996. [Google Scholar]
  11. Soderquist, C.Z.; Schweiger, M.J.; Kim, D.-S.; Lukens, W.W.; McCloy, J.S. Redox-dependent solubility of technetium in low activity waste glass. J. Nucl. Mater. 2014, 449, 173–180. [Google Scholar] [CrossRef]
  12. Pegg, I.L. Behavior of technetium in nuclear waste vitrification processes. J. Radioanal. Nucl. Chem. 2015, 305, 287–292. [Google Scholar] [CrossRef]
  13. Soderquist, C.Z.; Buck, E.C.; McCloy, J.S.; Schweiger, M.J.; Kruger, A.A. Formation of technetium salts in Hanford low-activity waste glass. J. Am. Ceram. Soc. 2016, 99, 3924–3931. [Google Scholar] [CrossRef]
  14. Reynolds, E.; Zhang, Z.; Avdeev, M.; Thorogood, G.J.; Poineau, F.; Czerwinski, K.R.; Kimpton, J.A.; Kennedy, B.J. Thermal expansion behavior in TcO2. Toward breaking the Tc−Tc bond. Inorg. Chem. 2017, 56, 9219–9224. [Google Scholar] [CrossRef]
  15. Weaver, J.; Soderquist, C.Z.; Washton, N.M.; Lipton, A.S.; Gassman, P.L.; Lukens, W.W.; Kruger, A.A.; Wall, N.A.; McCloy, J.S. Chemical trends in solid alkali pertechnetates. Inorg. Chem. 2017, 56, 2533–2544. [Google Scholar] [CrossRef]
  16. Sa, B.; Miao, N.; Sun, Z.; Wu, B. Polyhedral transformation and phase transition in TcO2. RSC Adv. 2015, 5, 1690–1696. [Google Scholar] [CrossRef]
  17. Hohenberg, P.; Kohn, W. Inhomogeneous electron gas. Phys. Rev. 1964, 136, B864–B871. [Google Scholar] [CrossRef]
  18. Kohn, W.; Sham, L.J. Self-consistent equations including exchange and correlation effects. Phys. Rev. 1965, 140, A1133–A1138. [Google Scholar] [CrossRef]
  19. Giannozzi, P.; Baroni, S.; Bonini, N.; Calandra, M.; Car, R.; Cavazzoni, C.; Ceresoli, D.; Chiarotti, G.L.; Cococcioni, M.; Dabo, I.; et al. QUANTUM ESPRESSO: A modular and open-source software project for quantum simulations of materials. J. Phys. Cond. Matter 2009, 21, 395502. [Google Scholar] [CrossRef] [PubMed]
  20. Blöchl, P.E. Projector augmented-wave method. Phys. Rev. B 1994, 50, 17953–17979. [Google Scholar] [CrossRef] [PubMed]
  21. Kucukbenli, E.; Monni, M.; Adetunji, B.I.; Ge, X.; Adebayo, G.A.; Marzari, N.; De Gironcoli, S.; Dal Corso, A. Projector augmented-wave and all-electron calculations across the periodic table: A comparison of structural and energetic properties. arXiv 2014, arXiv:1404.3015v1. [Google Scholar]
  22. Kresse, G.; Joubert, D. From ultrasoft pseudopotentials to the projector augmented-wave method. Phys. Rev. B 1999, 59, 1758–1775. [Google Scholar] [CrossRef]
  23. Nakayama, M.; Ohshima, H.; Nogami, M.; Martin, M. A concerted migration mechanism of mixed oxide ion and electron conduction in reduced ceria studied by first-principles density functional theory. Phys. Chem. Chem. Phys. 2012, 14, 6079–6084. [Google Scholar] [CrossRef]
  24. Perdew, J.P.; Burke, K.; Ernzerhof, M. Generalized gradient approximation made simple. Phys. Rev. Lett. 1996, 77, 3865–3868. [Google Scholar] [CrossRef]
  25. Perdew, J.P.; Ruzsinszky, A.; Csonka, G.I.; Vydrov, O.A.; Scuseria, G.E.; Constantin, L.A.; Zhou, X.; Burke, K. Restoring the density-gradient expansion for exchange in solids and surfaces. Phys. Rev. Lett. 2008, 100, 136406. [Google Scholar] [CrossRef] [PubMed]
  26. Monkhorst, H.J.; Pack, J.D. Special points for Brillouin-zone integrations. Phys. Rev. B 1976, 13, 5188–5192. [Google Scholar] [CrossRef]
  27. Otero-de-la-Roza, A.; Abbasi-Pérez, D.; Luaña, V. Gibbs2: A new version of the quasiharmonic model code. II. Models for solid-state thermodynamics, features and implementation. Comp. Phys. Commun. 2011, 182, 2232–2248. [Google Scholar] [CrossRef]
  28. Otero-de-la-Roza, A.; Luaña, V. Gibbs2: A new version of the quasi-harmonic model code. I. Robust treatment of the static data. Comp. Phys. Commun. 2011, 182, 1708–1720. [Google Scholar] [CrossRef]
  29. Debye, P. Zur Theorie der spezifischen Wärmen. Ann. Phys. 1912, 344, 789–839. [Google Scholar] [CrossRef]
  30. Slater, J.C. Introduction to Chemical Physics; McGraw-Hill: New York, NY, USA, 1939. [Google Scholar]
  31. Moruzzi, V.L.; Janak, J.F.; Schwarz, K. Calculated thermal properties of metals. Phys. Rev. B 1988, 37, 790–799. [Google Scholar] [CrossRef] [PubMed]
  32. Otero-de-la-Roza, A.; Luaña, V. Treatment of first-principles data for predictive quasiharmonic thermodynamics of solids: The case of MgO. Phys. Rev. B 2011, 84, 024109. [Google Scholar] [CrossRef]
  33. Birch, F. Finite elastic strain of cubic crystals. Phys. Rev. 1947, 71, 809–824. [Google Scholar] [CrossRef]
  34. Li, Y.-L.; Zeng, Z. Structural, elastic and electronic properties of ReO2. Chin. Phys. Lett. 2008, 25, 4086–4089. [Google Scholar] [CrossRef]
  35. Caravaca, M.A.; Miño, J.C.; Pérez, V.J.; Casali, R.A.; Ponce, C.A. Ab initio study of the elastic properties of single and polycrystal TiO2, ZrO2 and HfO2 in the cotunnite structure. J. Phys. Condens. Matter 2008, 21, 015501. [Google Scholar] [CrossRef] [PubMed]
  36. Wu, A.Y.; Sladek, R.J. Elastic Debye temperatures in tetragonal crystals: Their determination and use. Phys. Rev. B 1982, 25, 5230–5233. [Google Scholar] [CrossRef]
  37. Langenberg, E.; Ferreiro-Vila, E.; Leborán, V.; Fumega, A.O.; Pardo, V.; Rivadulla, F. Analysis of the temperature dependence of the thermal conductivity of insulating single crystal oxides. APL Mater. 2016, 4, 104815. [Google Scholar] [CrossRef]
  38. Liu, X.; Wang, H.; Wang, W.; Fu, Z. A simple bulk modulus model for crystal materials based on the bond valence model. Phys. Chem. Chem. Phys. 2017, 19, 22177–22189. [Google Scholar] [CrossRef] [PubMed]
  39. Xu, B.; Wang, Q.; Tian, Y. Bulk modulus for polar covalent crystals. Sci. Rep. 2013, 3, 3068. [Google Scholar] [CrossRef] [PubMed]
  40. Hermet, P.; Lignie, A.; Fraysse, G.; Armand, P.; Papet, P. Thermodynamic properties of the α-quartz-type and rutile-type GeO2 from first-principles calculations. Phys. Chem. Chem. Phys. 2013, 15, 15943–15948. [Google Scholar] [CrossRef] [PubMed]
  41. Kirchner, H.P. Thermal expansion anisotropy of oxides and oxide solid solutions. J. Am. Ceram. Soc. 1969, 52, 379–386. [Google Scholar] [CrossRef]
  42. Rao, K.V.K.; Naidu, S.V.N.; Iyengar, L. Precision lattice parameters and the coefficients of thermal expansion of hexagonal germanium dioxide. J. Appl. Cryst. 1973, 6, 136–138. [Google Scholar] [CrossRef]
  43. Leitner, J.; Chuchvalec, P.; Sedmidubský, D.; Strejc, A.; Abrman, P. Estimation of heat capacities of solid mixed oxides. Thermochim. Acta 2003, 395, 27–46. [Google Scholar] [CrossRef]
  44. Leitner, J.; Sedmidubský, D.; Chuchvalec, P. Prediction of heat capacities of solid binary oxides from group contribution method. Ceram.-Silikáty 2002, 46, 29–32. [Google Scholar]
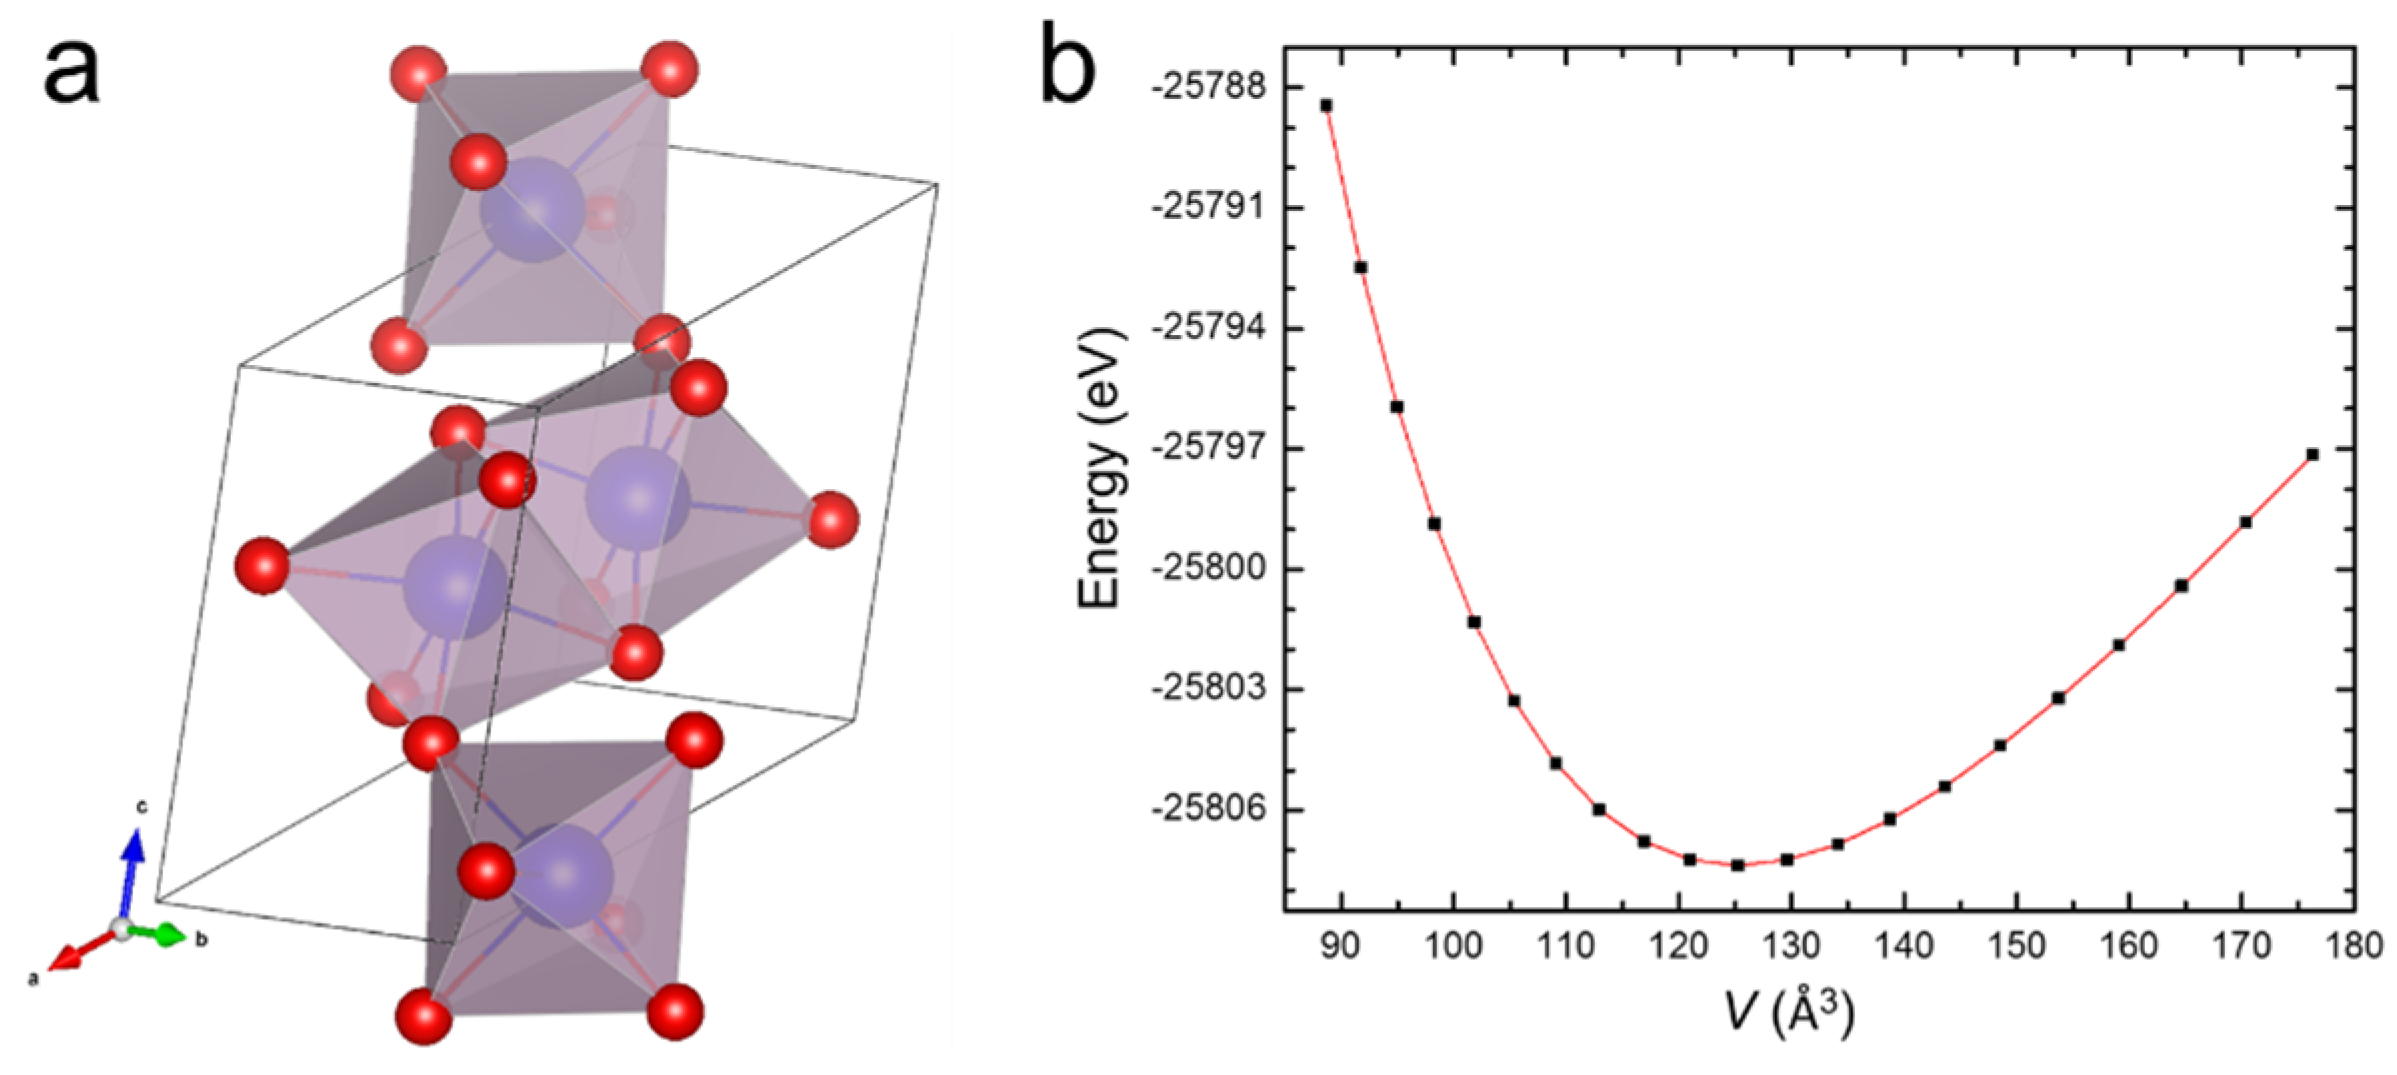
Figure 1. (a) The unit cell of TcO2. The blue balls represent Tc, and the red balls represent O. The lattice vectors and atomic positions are presented in Table 1. (b) The computed E(V) curve of TcO2 and the fitted Birch–Murnaghan isothermal equation of state. The dots are the DFT computed values and the line is the fitted Birch–Murnaghan equation of state.
Crystals 14 00228 g001
Figure 2. The volume of TcO2 as a function of temperature for the (a) Debye–Slater and (b) Debye–Grüneisen models. The results are shown for both with (higher curves) and without (lower curves) the empirical energy corrections. See online for color.
Crystals 14 00228 g002
Figure 3. The isothermal bulk modulus of TcO2 as a function of (a) pressure at a constant temperature of 298.15 K and (b) temperature at a constant pressure of 0 GPa. The dots are the computed values and the line is the fitted function.
Crystals 14 00228 g003
Figure 4. The volumetric thermal expansion coefficient of TcO2 as a function of (a) pressure at a constant temperature of 298.15 K and (b) temperature at a constant pressure of 0 GPa. The dots are the computed values and the line is the fitted function.
Crystals 14 00228 g004
Figure 5. The constant pressure (Cp) and constant volume (Cv) heat capacities of TcO2 as a function of (a) pressure at a constant temperature of 298.15 K and (b) temperature at a constant pressure of 0 GPa. The dots are the computed values and the line is the fitted function.
Crystals 14 00228 g005
Table 1. The calculated TcO2 lattice vectors in units of Å and atomic fractional coordinates. Each atom has a multiplicity of 4, obeying the symmetry of space group P21/c.
Crystal Parameter i ^ j ^ k ^
a15.5910.0000.000
a20.0004.7610.000
a3−2.8580.0004.706
Tc0.265350.004590.98489
O10.107060.192530.19506
O20.391020.712590.26659
Table 2. The calculated TcO2 unit cell volume in units of Å3 at temperatures of 15 and 298.15 K at an applied pressure of 0 GPa. The values are reported to three decimal places to facilitate comparison of results.
Debye–SlaterDebye–GrüneisenLiterature [5]
UNCORRPSHIFTAPBAFBPSCALUNCORRPSHIFTAPBAFBPSCAL
15 K126.261126.965126.975126.999126.102127.025127.036127.057127.124
298.15 K126.639127.362127.362127.362126.418127.362127.362127.362127.362
Table 3. The calculated TcO2 unit cell volume in units of Å3 at a temperature of 15 K and applied pressure of 0 GPa using the Debye–Grüneisen model and the BPSCAL empirical energy correction. The volumes are calculated for Poisson’s ratio values ranging between 0.20 and 0.30 and bulk modulus values ranging between 280 and 320 GPa. The values are reported to three decimal places to facilitate comparison of results. The experimentally determined volume is 127.124 Å3 [5].
280285290295300305310315320
0.20127.068127.077127.085127.092127.100127.107127.113127.120127.126
0.21127.061127.070127.078127.085127.093127.100127.107127.114127.120
0.22127.054127.062127.070127.078127.086127.093127.100127.107127.113
0.23127.046127.055127.063127.071127.079127.086127.093127.100127.107
0.24127.038127.047127.055127.063127.071127.079127.086127.093127.100
0.25127.030127.039127.047127.056127.064127.071127.079127.086127.093
0.26127.021127.030127.039127.048127.056127.063127.0709127.078127.085
0.27127.012127.022127.031127.039127.047127.055127.063127.070127.077
0.28127.003127.013127.022127.031127.039127.047127.055127.062127.069
0.29126.994127.003127.013127.021127.030127.038127.046127.054127.061
0.30126.984126.994127.003127.012127.021127.029127.037127.045127.052
Table 4. The thermophysical properties of TcO2 at ambient conditions computed using the Debye–Grüneisen model and the BPSCAL empirical energy correction with ν = 0.20 and B = 320 GPa.
Thermophysical Properties, Symbol, UnitValue
Gibbs free energy, G, kJ/mol−6.225 × 105
Debye temperature, ΘD, K891.91
Volumetric thermal expansion coefficient, αvol, 10−5/K1.484
Isothermal bulk modulus, BT, GPa320
Adiabatic bulk modulus, BS, GPa322.59
Grüneisen parameter, γ1.832
Constant pressure heat capacity, Cp, J/mol·K50.103
Constant volume heat capacity, Cv, J/mol·K49.700
Thermal pressure, pth, GPa2.991
Vibrational contribution to the Helmholtz free energy, Fvib, KJ/mol21.762
Entropy, S, J/mol·K32.256
Disclaimer/Publisher’s Note: The statements, opinions and data contained in all publications are solely those of the individual author(s) and contributor(s) and not of MDPI and/or the editor(s). MDPI and/or the editor(s) disclaim responsibility for any injury to people or property resulting from any ideas, methods, instructions or products referred to in the content.