Article

Effect of Si Gradient Pattern on the Microstructure and Properties of Laminated Electrical Steel Composites Prepared by Hot-Press Sintering

1
School of Engineering Technology, Nanchang Vocational University, Nanchang 330500, China
2
State Key Laboratory of Performance Monitoring Protecting of Rail Transit Infrastructure, East China Jiaotong University, Nanchang 330013, China
*
Author to whom correspondence should be addressed.
Crystals 2024, 14(12), 1023; https://doi.org/10.3390/cryst14121023
Submission received: 10 November 2024 / Revised: 22 November 2024 / Accepted: 25 November 2024 / Published: 26 November 2024
(This article belongs to the Section Crystalline Metals and Alloys)

Abstract

:
In this study, electrical steel laminated composites with positive Si gradient (PO-G), counter Si gradient (CO-G), and cross Si gradient (CR-G) were fabricated by hot-press sintering, cold rolling and annealing. The microstructure evolution during processing, as well as the magnetic and mechanical properties were investigated. The results indicate that the microstructure of the high-silicon layer and medium-silicon layer in the hot-pressed composites featured columnar grains throughout the thickness. The microstructure of the low-silicon layer in the hot-pressed CO-G sample consisted of equiaxed grains. However, a mixed structure dominated by columnar grains with some equiaxed grains was observed in the inner low-silicon layer of the PO-G and CR-G samples. Following cold rolling, the thickness ratio of each layer remained largely unchanged. After annealing, the microstructure of each layer transformed into columnar grains. The average grain size of the high-silicon layer, medium-silicon layer, and low-silicon layers in the three composites were approximately 20–23 μm, 33–38 μm, and 42–49 μm, respectively. Compared with the CO-G and CR-G samples, the annealed PO-G composite exhibited lower core loss at 400–1000 Hz and superior tensile strength. Furthermore, the core loss of the three composites was greater than that of the initial medium-silicon and high-silicon materials. This can be attributed to the increased hysteresis loss due to the existence of multi-layer interface.

1. Introduction

In the power and new energy industries, steel materials, such as electrical steel, stainless steel, and high-strength steel, are widely used in infrastructure construction and equipment manufacturing [1,2,3]. Among them, non-oriented electrical steels (NOES) with superior magnetic properties are primarily utilized as the cores of motors and generators to facilitate the conversion between mechanical energy and electrical energy [4,5]. The Si content plays a pivotal role in the magnetic properties of NOES. As the Si content increases, the resistance of the NOES rises, leading to a reduction in eddy current loss and total core loss at high frequencies [6,7]. Consequently, high-silicon steel, particularly Fe-6.5 wt% Si, exhibits superior magnetic properties [8,9,10]. However, the presence of ordered phases like B2 and DO3 in the Fe-6.5 wt% Si alloy results in high hardness and brittleness [11,12], making it challenging to prepare using conventional rolling methods. In previous studies, various innovative techniques have been explored to produce Fe-6.5 wt% Si sheets, including chemical vapor deposition (CVD), hot dipping and diffusion annealing, and magnetron sputtering [13,14,15]. At present, the commercial production of high-silicon steel based on the technology described above still faces challenges.
Recently, the concept of gradient silicon steel has emerged as a promising approach to achieving a balance between the magnetic and mechanical properties of electrical steel [16,17]. Indeed, extensive work on the preparation, microstructure, and properties of Si-gradient electrical steel has been carried out. Hiratani et al. [17] employed the CVD siliconizing process to create Si-gradient steel sheets and found that the core loss of a Si-gradient steel plate is lower than that of conventional Fe-6.5 wt% Si steel at high frequency, whereas the opposite occurs at low frequency. Yu et al. [18] produced gradient FeSi alloys by PVD (physical vapor deposition) technique combined with annealing and reported that the gradient distribution of Si not only decreases core loss but also enhances mechanical properties compared to alloys with a homogeneous Si distribution. Wu et al. [19] found that the high-silicon alloy coating displayed a strong influence on the magnetic performance of gradient silicon steel produced by cathodic arc plasma deposition. A commonality among these studies is that the silicon distribution in the gradient silicon steel gradually decreases from the surface to the center. However, the effect of other silicon gradient patterns on the microstructure and properties of electrical steel has not been well understood.
In this work, Si-gradient NOES were successfully prepared through a combination of high-vacuum hot-pressing bounding, cold rolling, and subsequent annealing. To explore the impact of silicon distribution on the properties of the NOES, three distinct silicon gradient distributions were designed: positive-gradient, inverse-gradient, and cross-gradient. The microstructure evolution during the preparation of the silicon gradient steel composite was characterized. Furthermore, the effect of silicon distribution on the magnetic and mechanical properties of Si-gradient steel was analyzed.

2. Materials and Methods

2.1. Material and Processing

Three kinds of commercial non-oriented electrical steel with varying silicon contents and thicknesses (0.50 mm—0.70% Si, 0.35 mm—2.6% Si, and 0.10 mm—4.7% Si) were used as the initial materials. Samples with dimensions of 55 mm (rolling direction) × 45 mm (transverse direction) were cut form the initial sheets. The samples were named as low-silicon, medium-silicon, and high-silicon material based on the silicon content. The surface of these samples was cleaned by pickling and acetone before being alternately stacked to form laminates. Each type of electrical steel was used twice in the stack. Three distinct silicon content distributions were adopted across the thickness of the stacked laminates. (A) Positive-gradient (PO-G) had high silicon content in the surface layer and low silicon content in the central layer. (B) Counter-gradient (CO-G) had low silicon content in the surface layer and high silicon content in the central layer. (C) Cross-gradient (CR-G) had alternating silicon content throughout the thickness. Figure 1a provides the stacking diagram of different gradient silicon steel. The stacked laminates were then subjected to hot-press sintering in a high-vacuum hot-pressing furnace. The hot-pressing temperature was set to 1200 °C for 2 h with a heating rate of 10 °C/min. The hot-pressing pressure was aimed at 5 T, with 1 T below 500 °C and 3 T below 800 °C. After that, the hot-pressed laminated composites were cold rolled to 0.20 mm. Finally, recrystallization annealing was carried out at 1050 °C for 6 min in a pure N2 atmosphere. The schematic diagram of the processing routes of Si-gradient electrical steel composites is shown in Figure 1b.

2.2. Characterization of Microstructure and Properties

The microstructures of the various materials were observed using an optical microscope after mechanical polishing and etching with 4% nitric acid alcohol. The element distributions in the composites were characterized by a Zeiss Gemini 300 scanning electron microscope (Carl Zeiss AG, Oberkochen, and Germany) equipped with Ultim max 170 energy dispersive spectroscopy (EDS). In addition, the microstructures were further analyzed by an electron backscatter diffraction (EBSD) system. The EBSD detection area was the RD–ND cross-section. Prior to the test, the samples were mechanically polished and then electrolytically polished using a 14% perchloric acid/alcohol solution. The orientation distribution functions (ODFs) based on EBSD data were represented by Bunge notation. The magnetic induction (B50) and core loss (P10/100, P10/400 and P10/1000) of the initial materials and the final annealed sheets were tested by MATS-3100 M along the rolling direction. The sample for the magnetic properties test is a rectangle 110 × 30 mm2 in size. The tension tests were conducted on a Shimadzu TRViewX (Shimadzu Corporation, Kyoto, Japan) universal testing machine using bone-shaped samples with a gauge dimension of 50 × 10 × 1 mm3.

3. Results and Discussion

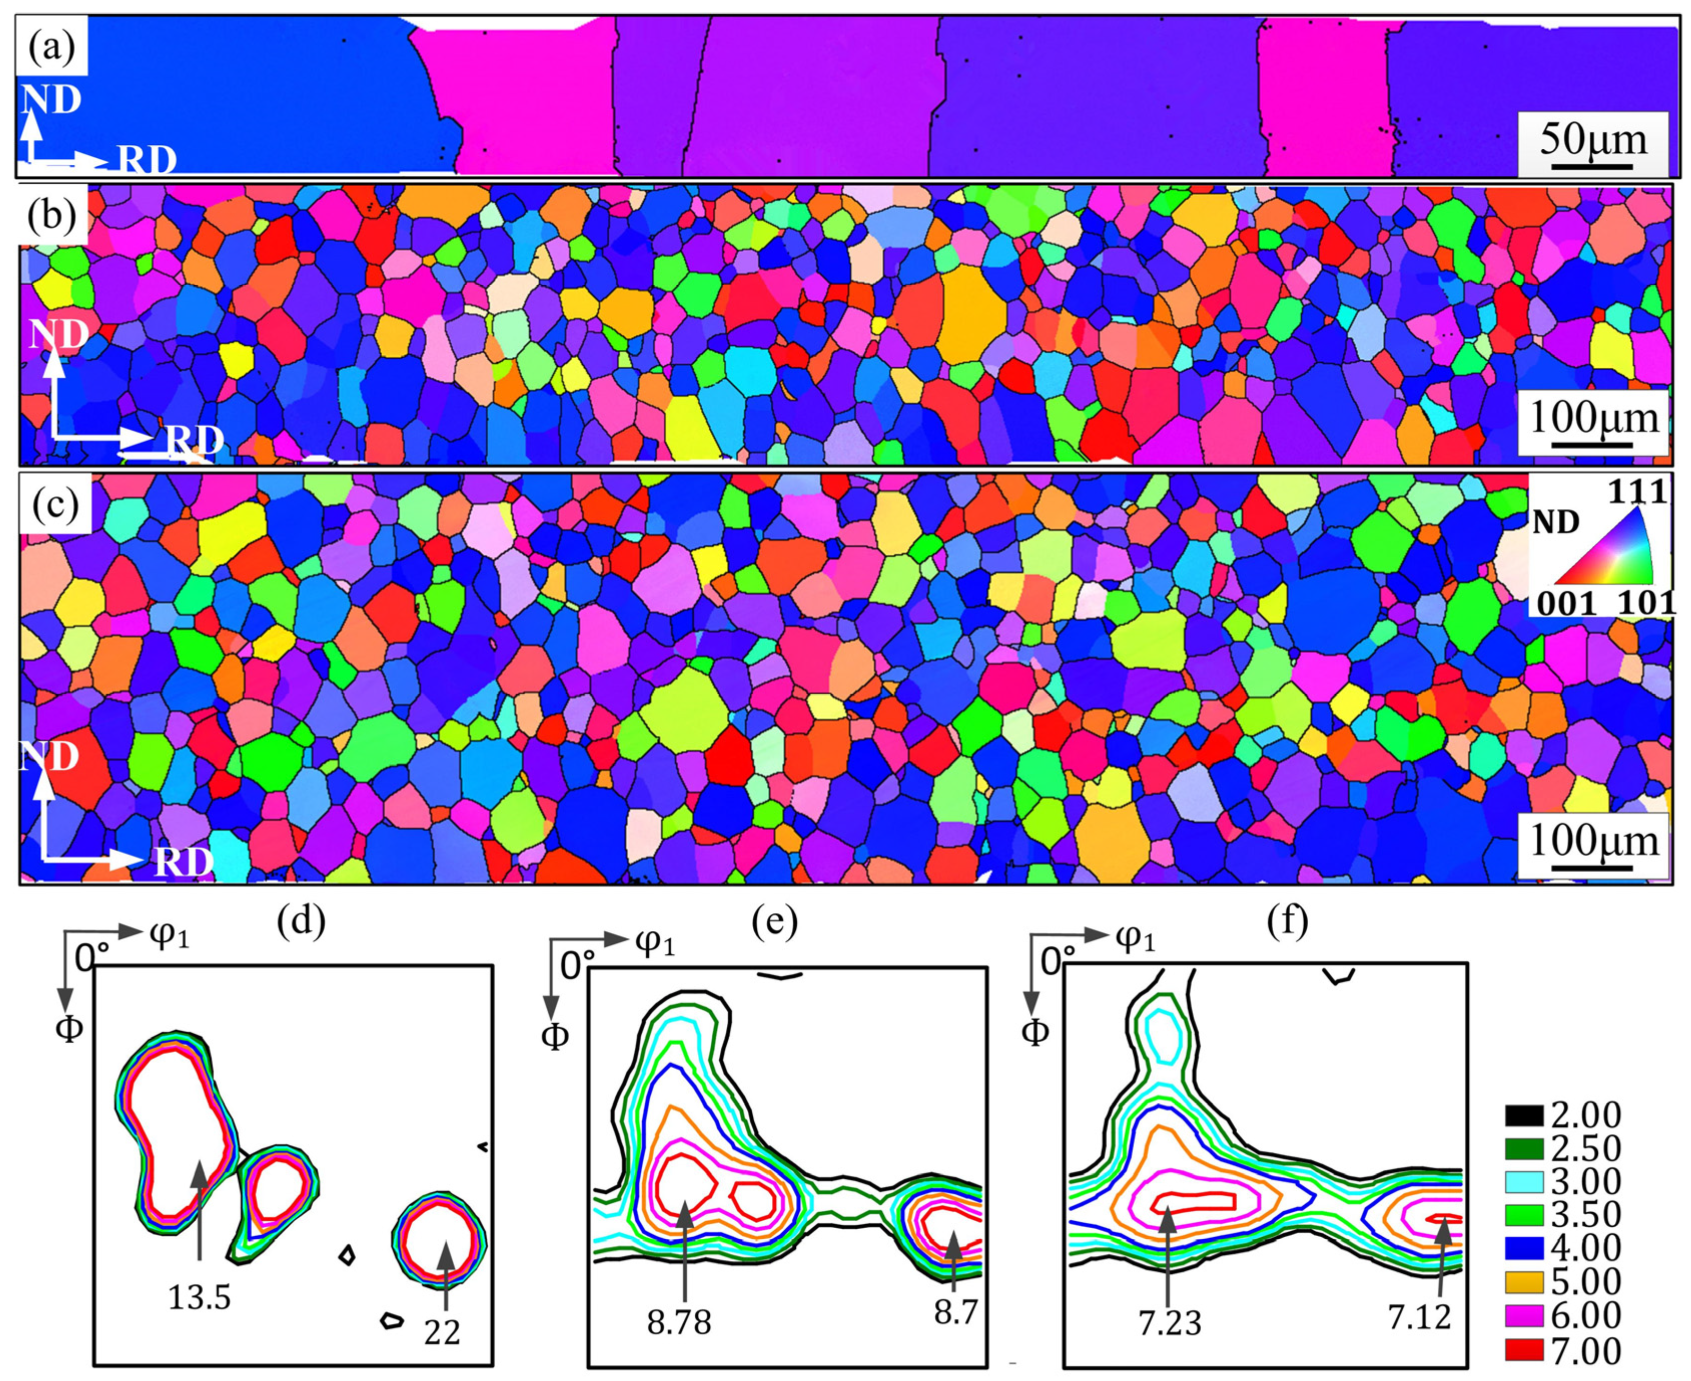
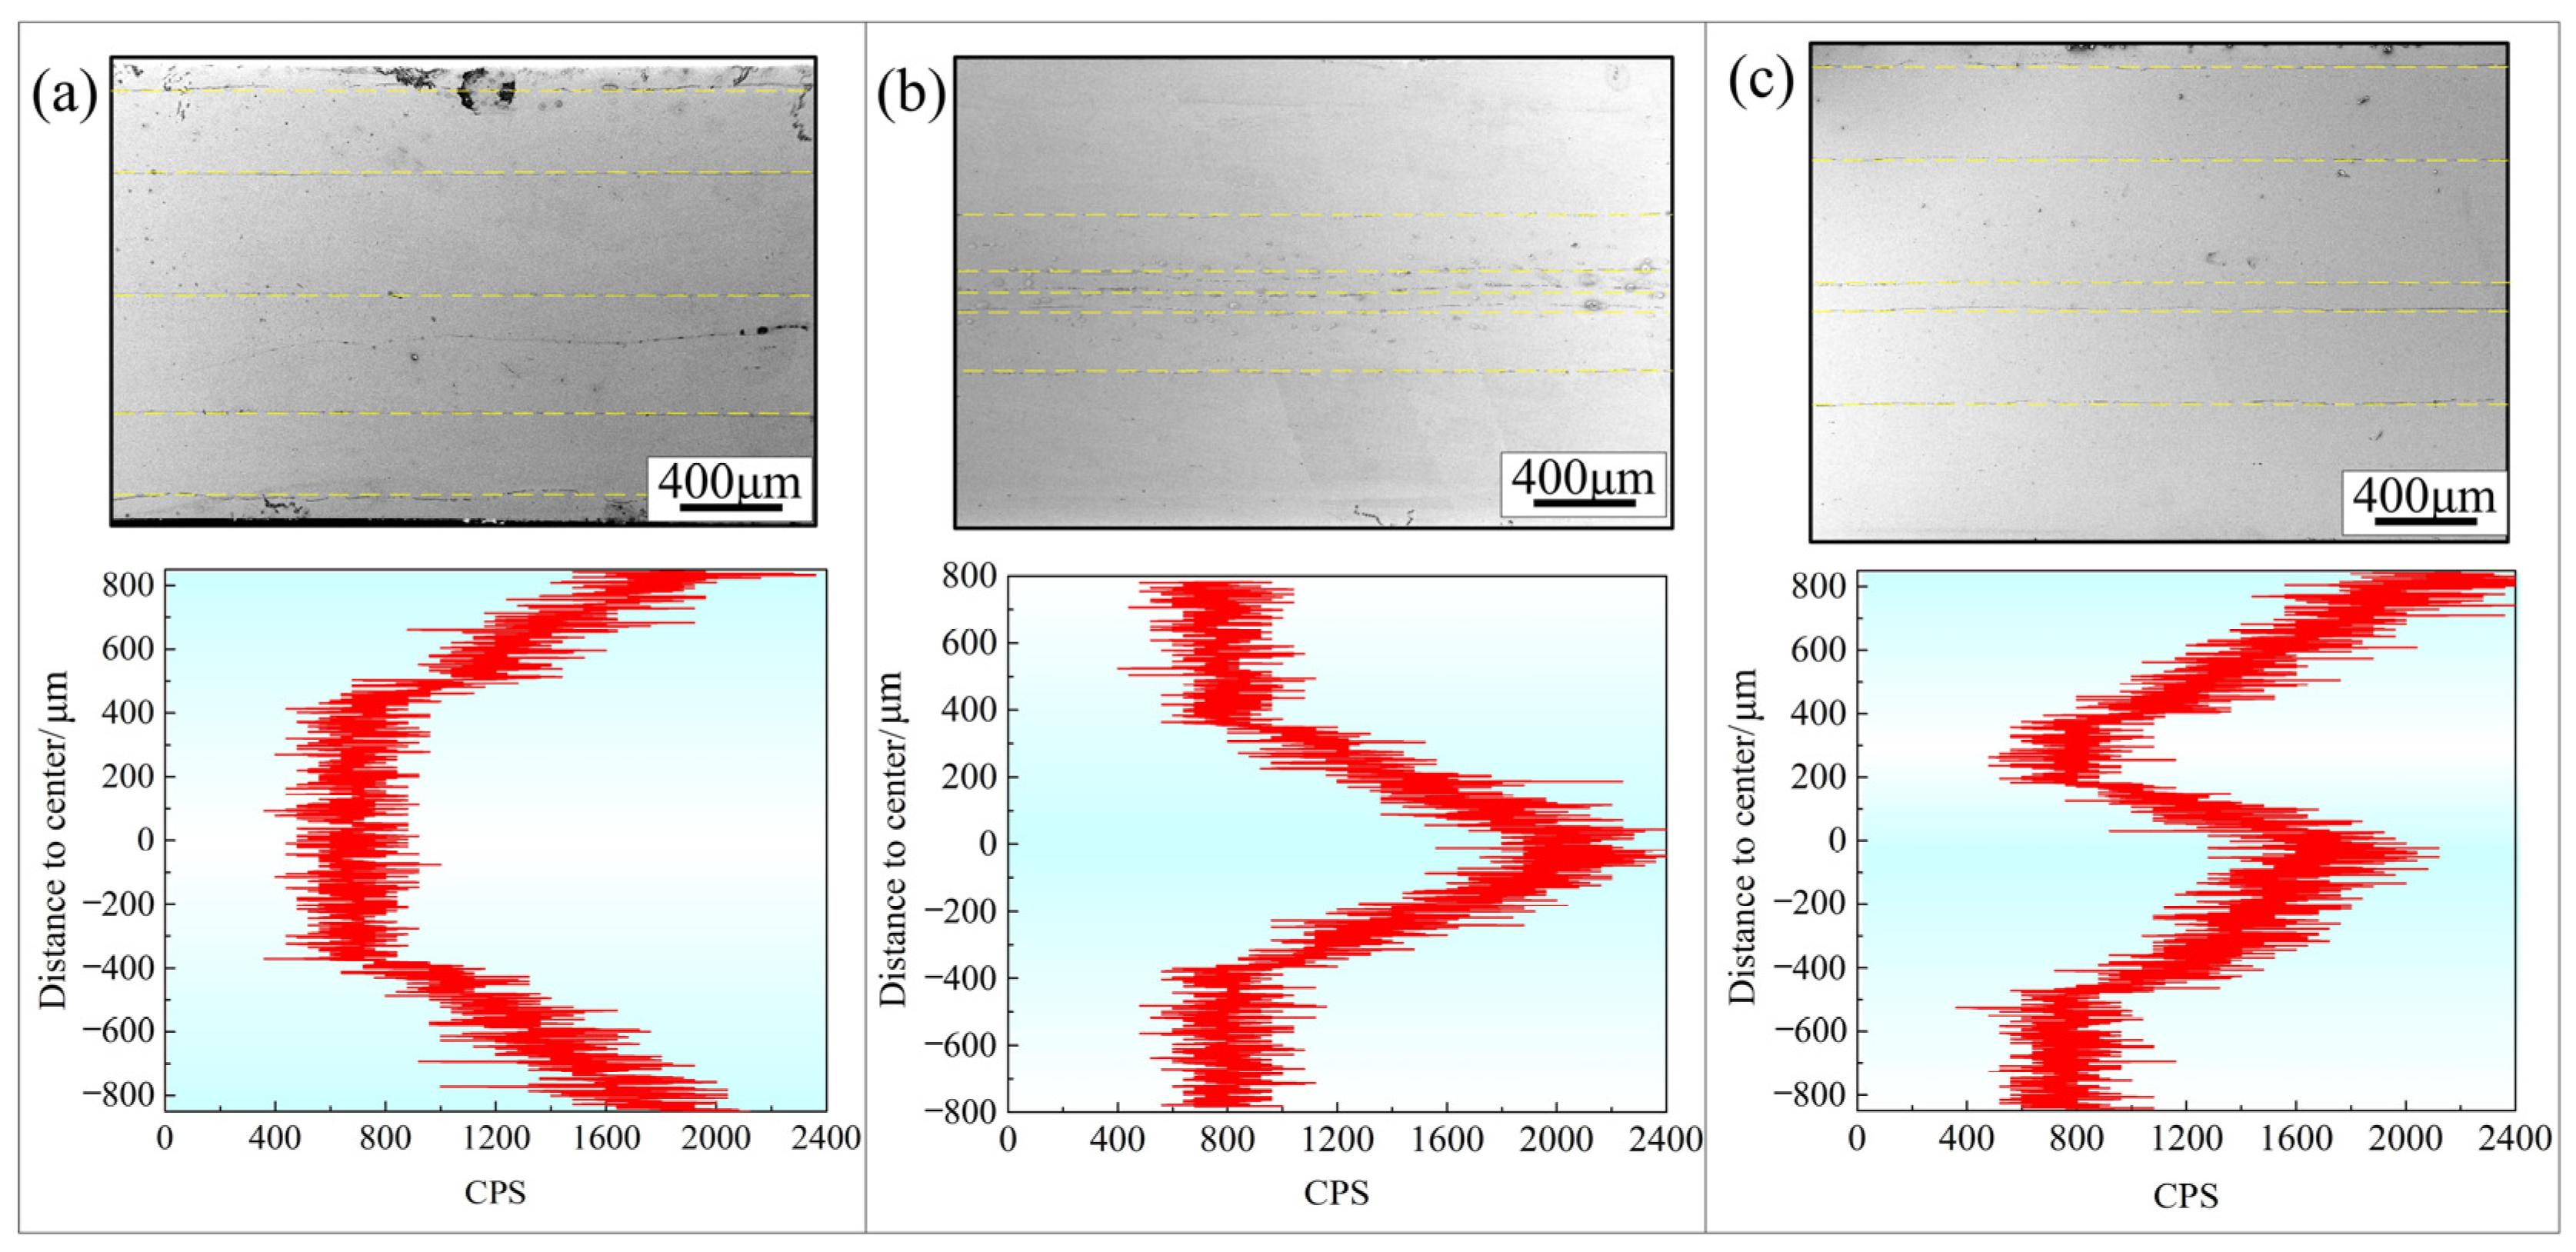
3.1. Microstructures and Properties of the Initial Materials and Hot-Pressed Bands

Figure 2 illustrates the initial microstructures of the non-oriented electrical steels with varying silicon contents. The high-silicon material exhibits columnar grains throughout the thickness. The average grain size is approximately 118 μm. The crystal orientation is characterized by strong near {111}<uvw> and {114}<841> components. In contrast, the microstructures of the medium-silicon and low-silicon materials are composed of uniform equiaxed grains, with average sizes of 38 μm and 37 μm, respectively. At this point, the types and intensities of texture in these two sheets are similar, both exhibiting a strong γ- fiber texture (<111>//ND) and a weak α*-fiber texture ({11 h}<1,2,1/h>). The peak of the texture is located at {111}<112>. This is a typical recrystallization texture observed in non-oriented electrical steel produced by the conventional process.
The magnetic properties of the three initial materials are shown in Table 1. As the silicon content increased, both the magnetic induction and core loss values decreased gradually. The decrease of core loss in the high-silicon material is the combined effect of the increase in resistivity caused by the addition of silicon and the decrease of eddy current loss resulting from the reduction in thickness [8,20]. The decrease of B50 is associated with the decrease in saturation magnetic induction due to the addition of silicon and the enhancement of the {111} <uvw> texture components [5]. The mechanical properties of the three initial materials are presented in Figure 3. The low-silicon steel exhibited the lowest tensile strength (approximately 364 MPa), but it possessed the best elongation (~36%). The medium-silicon steel displayed an increase tensile strength to 487 MPa, but this was accompanied by a decrease in elongation to 28%. In contrast, the high-silicon steel exhibited virtually no plasticity, showing a distinct brittle fracture with a fracture strength of approximately 492 MPa. The value is higher than both the low- and medium-silicon steels. The differences in mechanical properties among these materials are primarily attributed to the silicon content. Silicon is a well-known solid solution strengthener in steel, and as its content increases, the strength of the material also increases. However, in high-silicon steel, excessive silicon promotes the formation of ordered phases, such as B2 and DO3 [11], which significantly deteriorate the plasticity of the material.

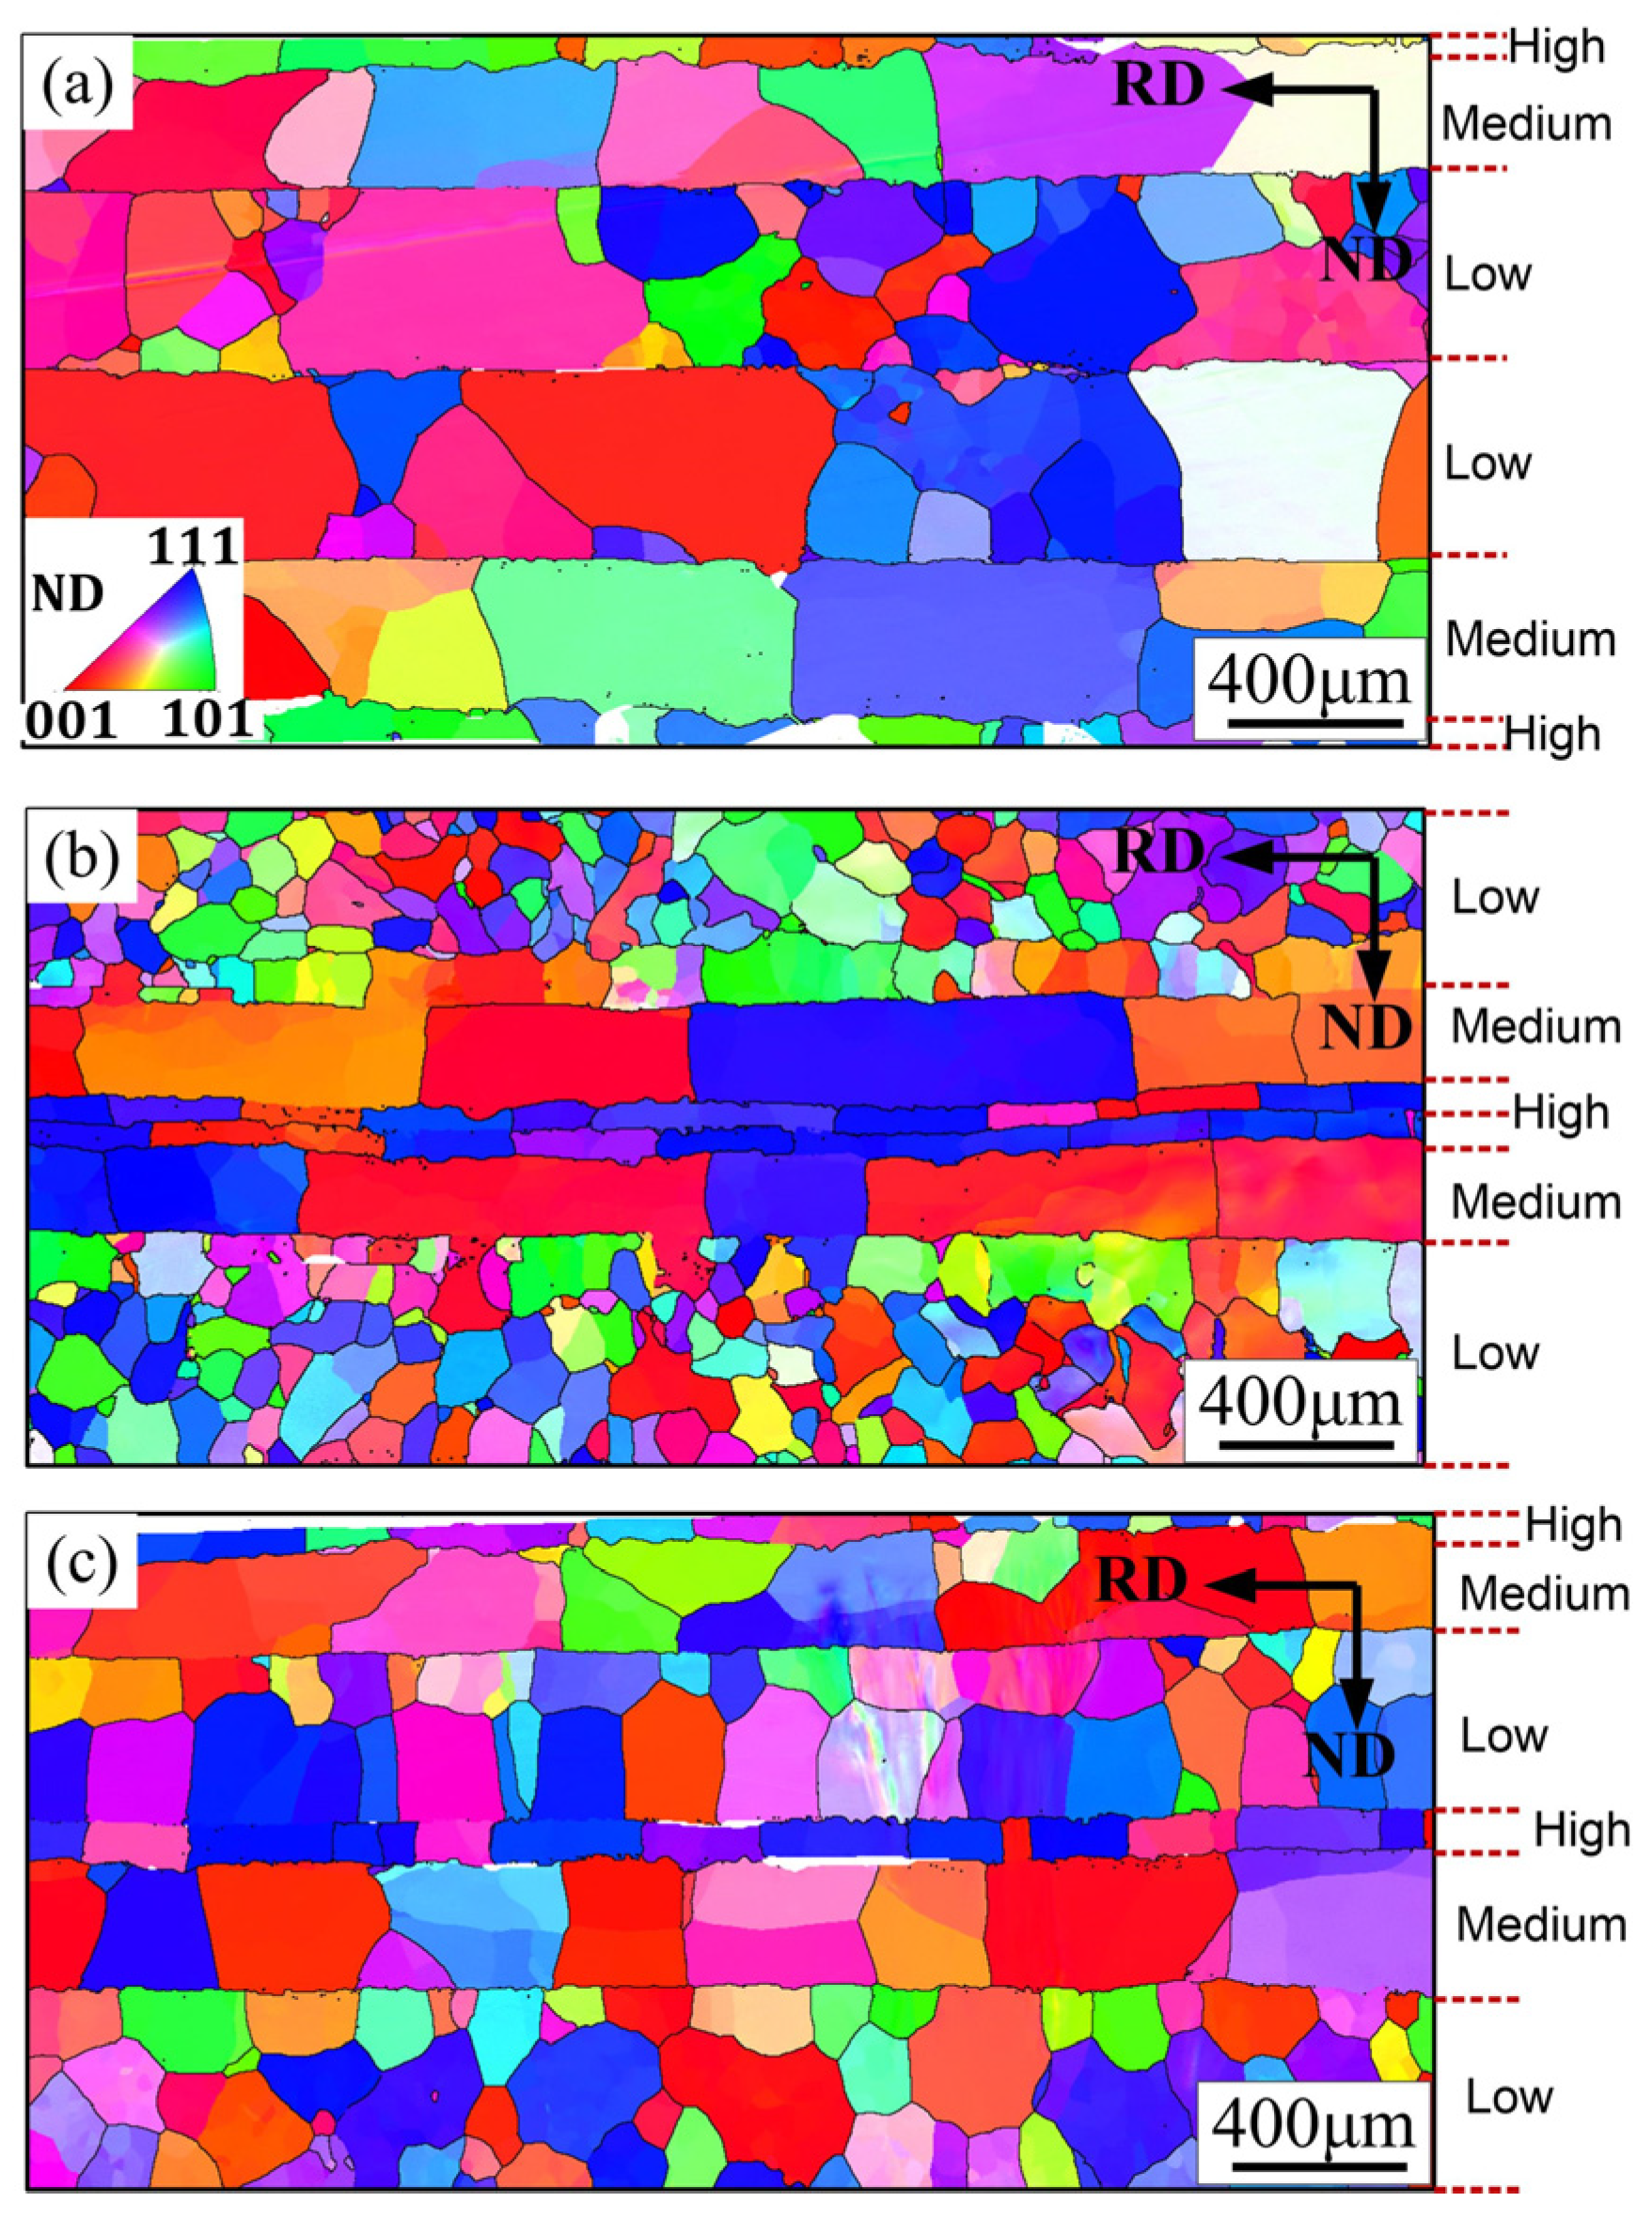
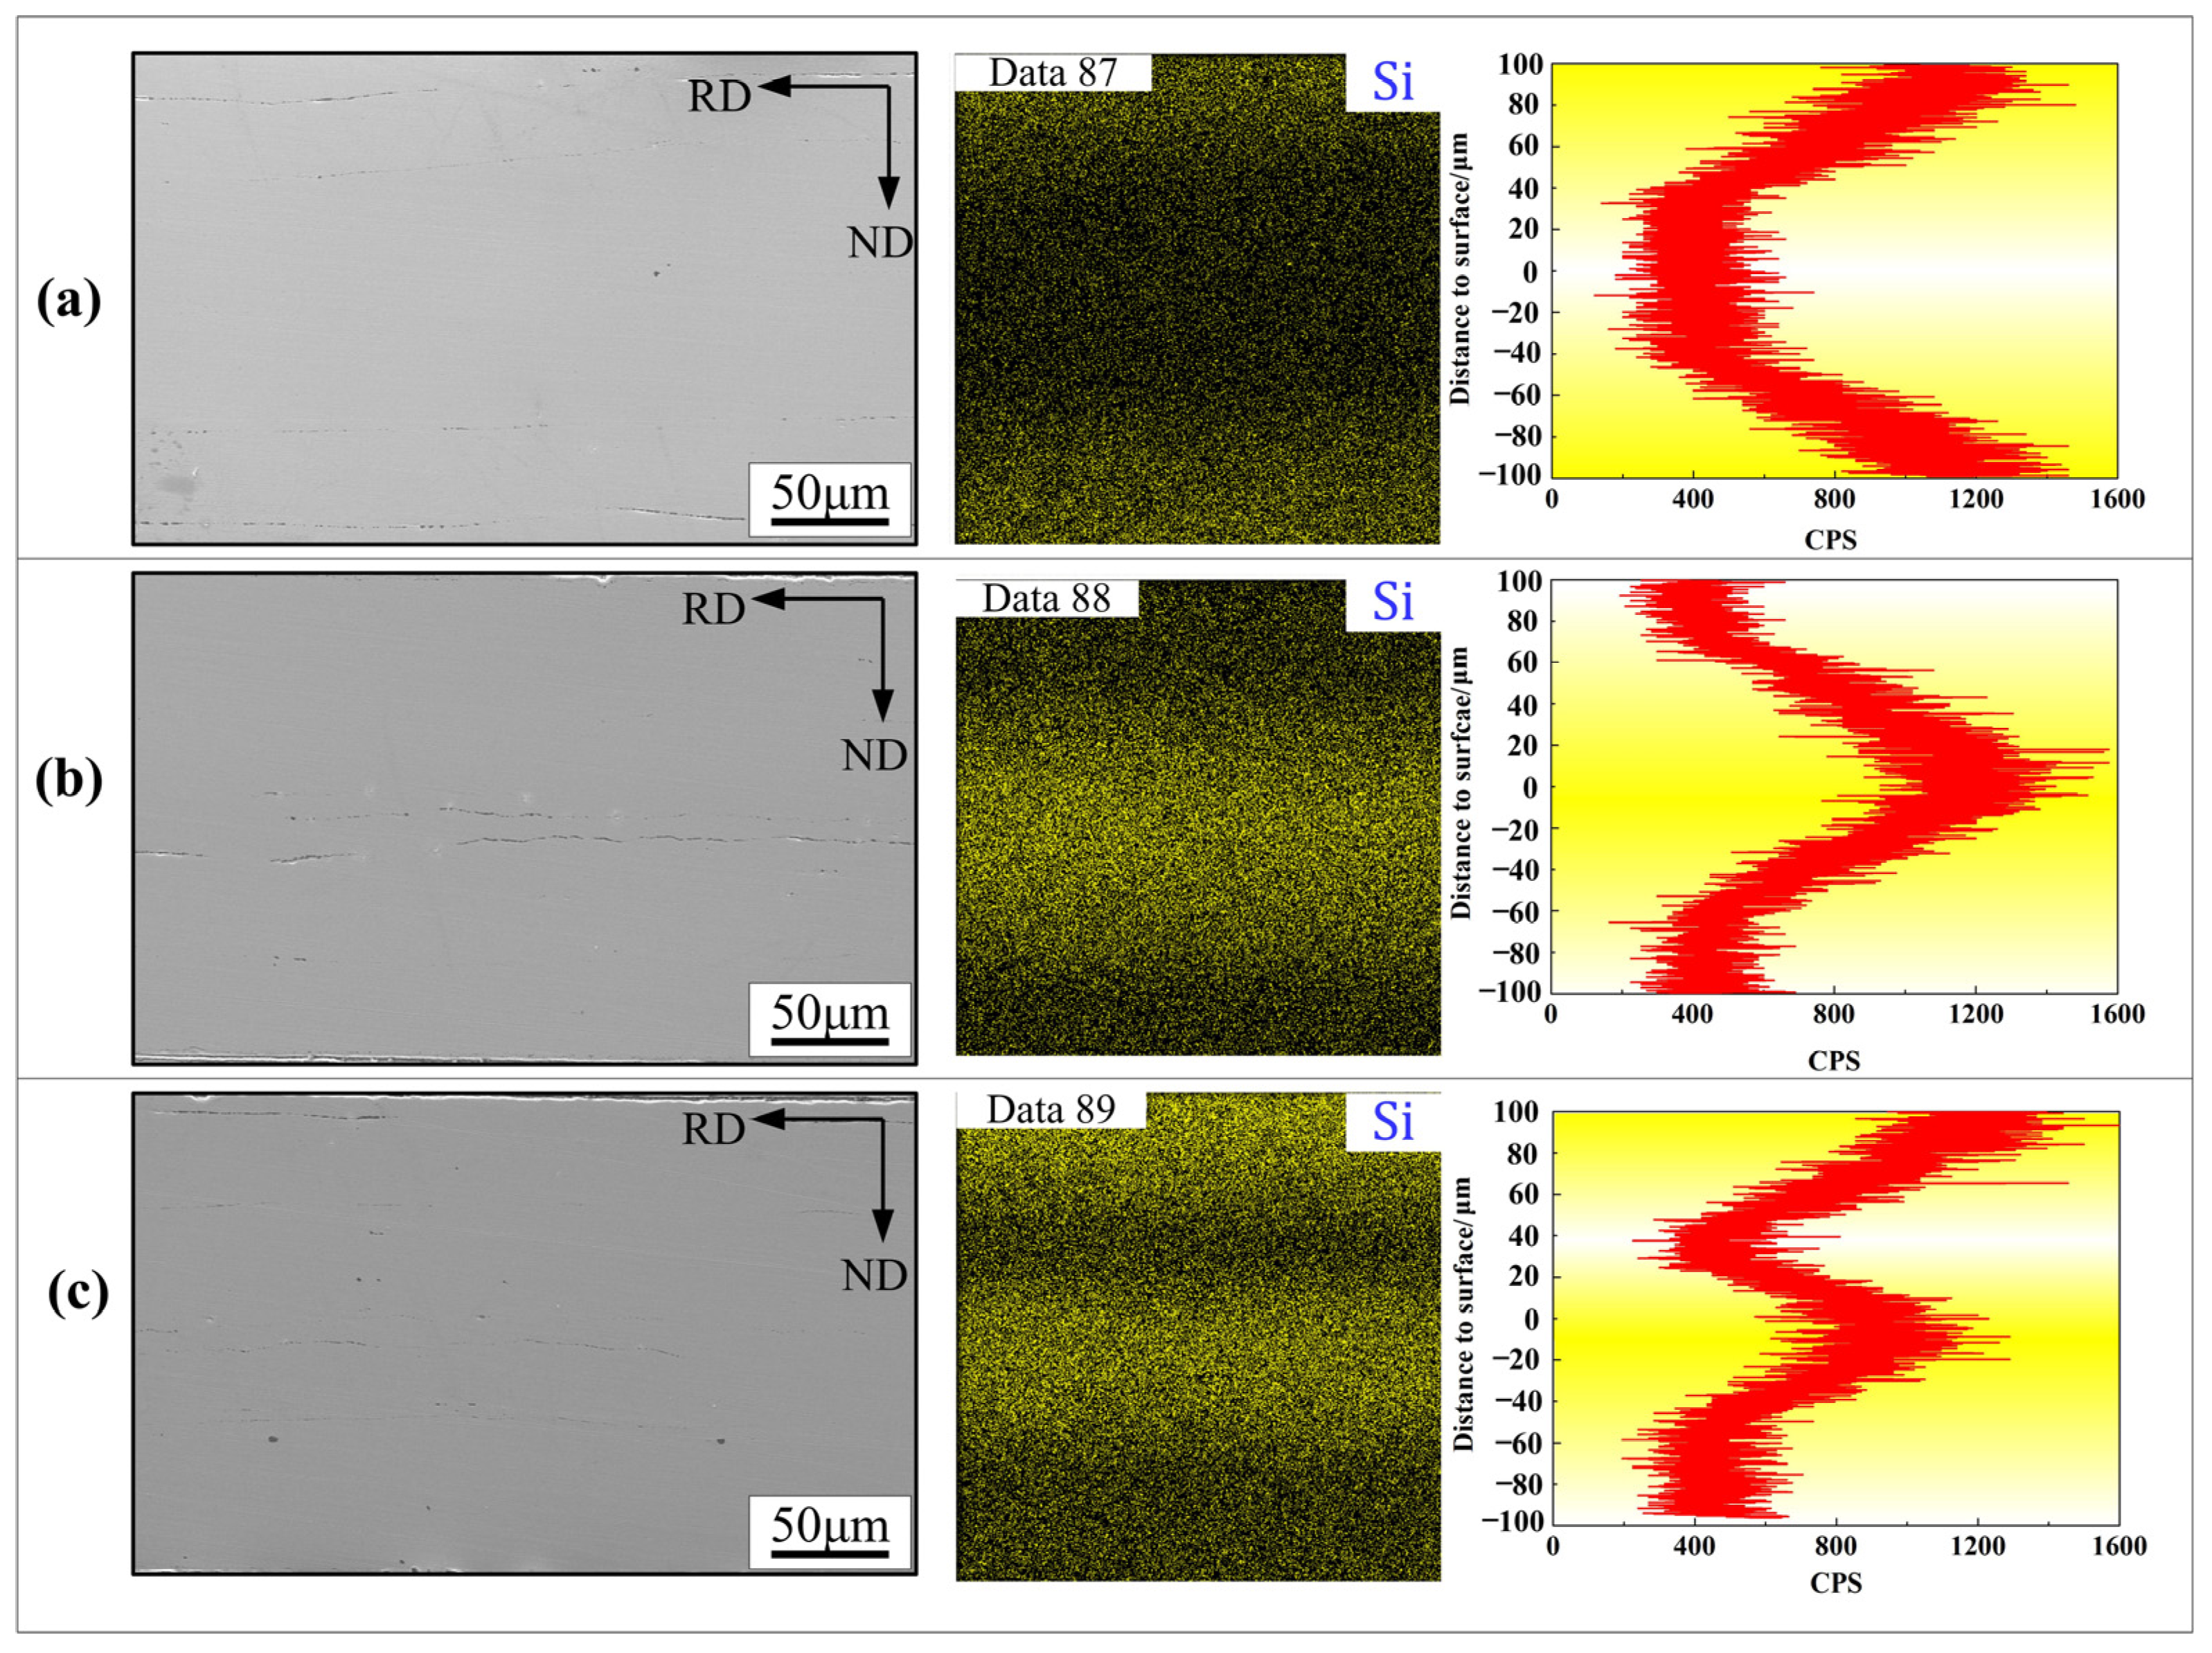
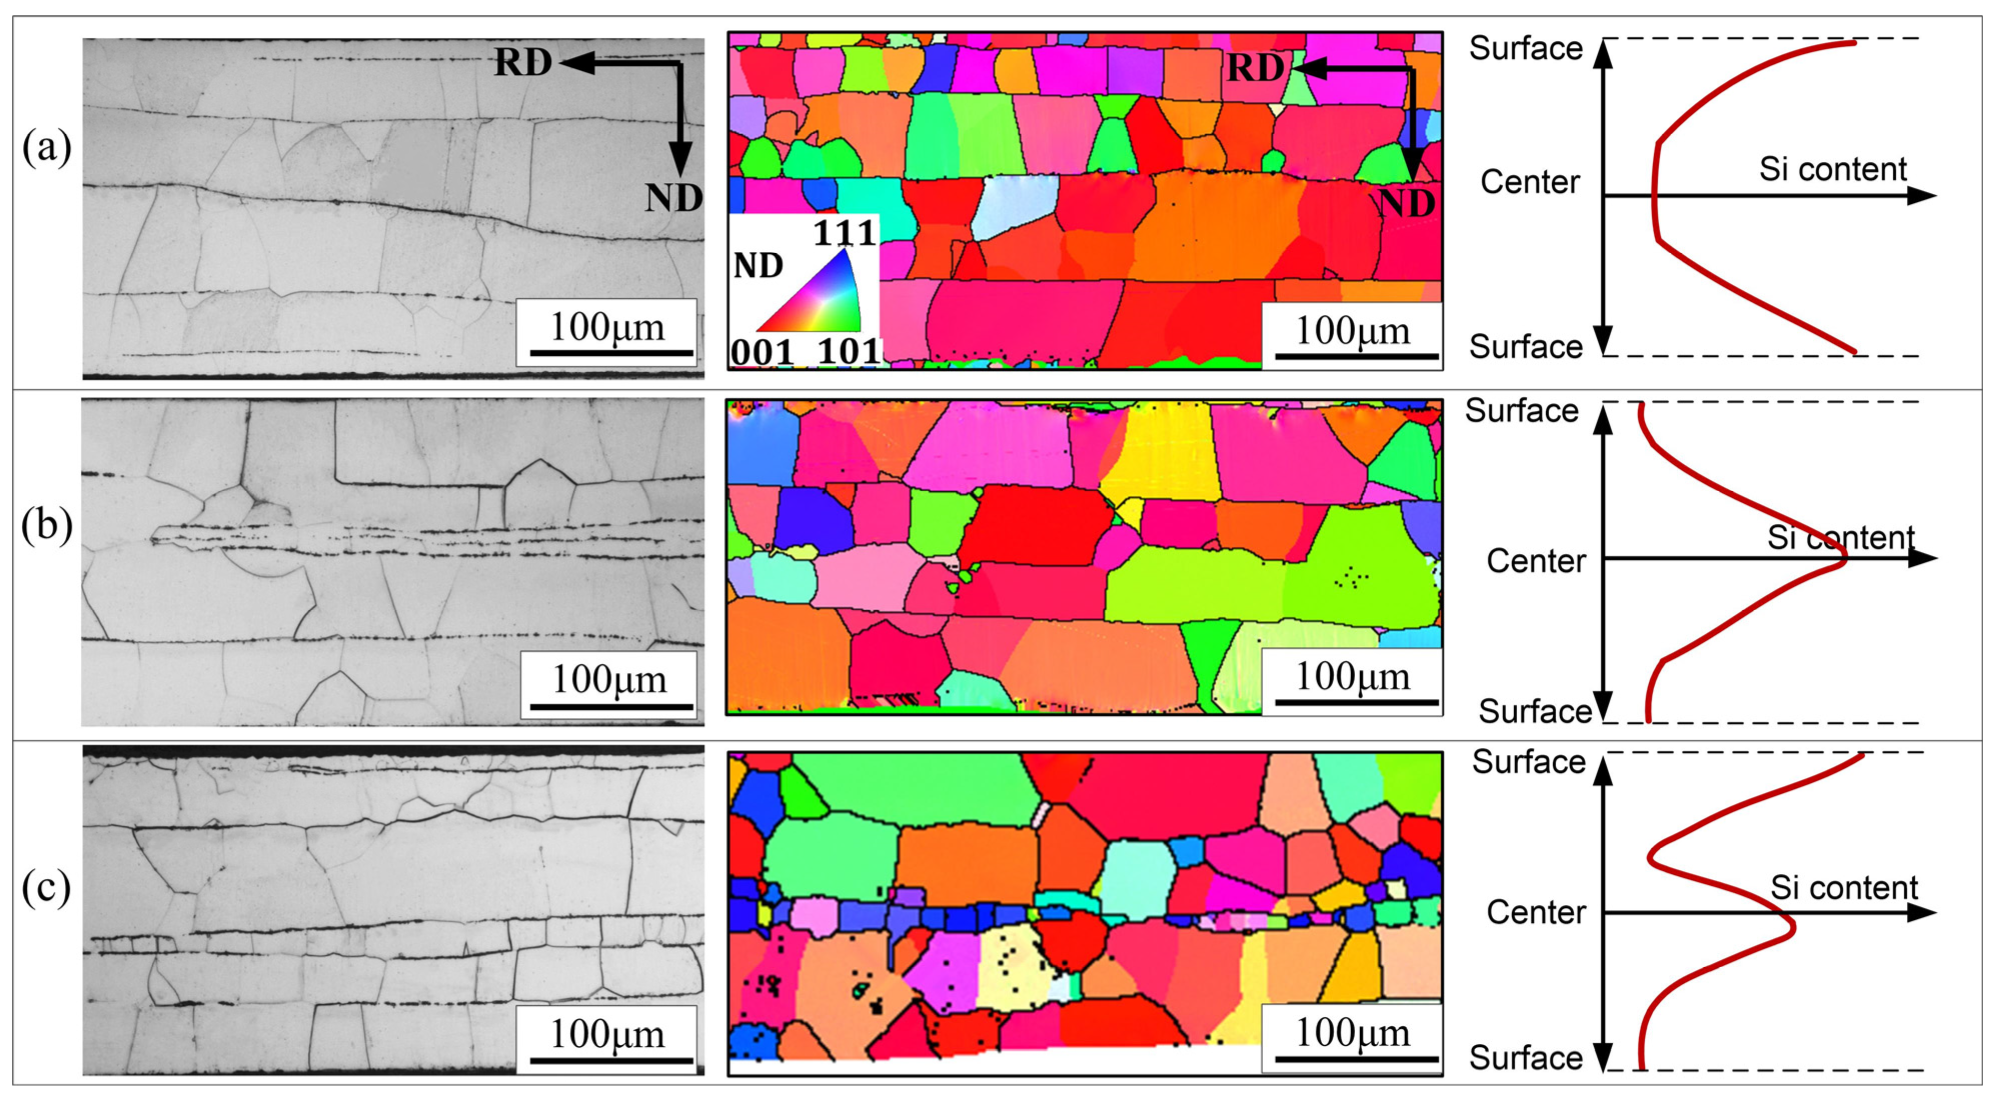
3.2. Microstructure Evolution During Rolling and Annealing of the Hot-Pressed Si-Gradient Steel

After stacking and hot-pressing, the initial sheets were combined to form gradient silicon steel laminated composites with a thickness of ~1.8 mm. This indicates that slight deformation occurred during the hot-pressing process. The morphology and silicon distribution in terms of thickness for the different composites are illustrated in Figure 4. It can be observed that these samples exhibit distinct layered structures. Following hot-pressing diffusion, the silicon distribution in the different samples exhibited the designed positive-gradient, counter-gradient, and cross-gradient distributions. It is noted that when the low-silicon layer was stacked adjacent to the medium-silicon layer, the degree of silicon diffusion was relatively low. However, when it was stacked in contact with the high-silicon layer, the silicon diffusion was more intense, resulting in a pronounced gradient. This is primarily attributed to the fact that a larger silicon concentration difference between adjacent layers results in a stronger driving force for diffusion.
The microstructures of the hot-pressed composites are shown in Figure 5. In the PO-G sample (Figure 5a), the microstructure of the high-silicon layer was similar to its initial state. However, significant changes were observed in the internal medium-silicon and low-silicon layers. In the medium-silicon layer, the grains underwent a transformation from their initial equiaxed shapes to columnar grains throughout the thickness. This transformation was accompanied by an increase in the average grain size to approximately 135 μm. In the central low-silicon layer, the microstructure was characterized by dominated columnar grains and some coarse equiaxed grains. The average grain size was about 129 μm. The formation of columnar grains may be related to the strain-induced boundary migration (SIBM) growth behavior under interlaminar stress [21,22]. During the deformation of laminated composites, the strain will be concentrated near the interfaces to form a strain gradient along the thickness [23]. As a result, a difference in the deformation stored energy will develop between adjacent grains along the thickness direction of each layer, thereby inducing the SIBM growth of grains and resulting in the formation of columnar grains.
In the COG sample (Figure 5b), the situation was significantly different. The microstructure of the surface low-silicon layer retained equiaxed morphology, with only grains near the interface with the medium-silicon layer exhibiting a columnar shape. This may be due to the lack of growth kinetics caused by less strain gradient at the surface layer and a low silicon content. The average grain size in this layer was ~76 μm. Meanwhile, the internal medium-silicon and high-silicon layers featured coarse columnar grains that traversed the entire thickness. In the CRG sample (Figure 5c), except for the surface low-silicon layer, the microstructures of all the layers were composed of columnar grains. Thus, the stacking method had a significant influence on the grain shape and size of the hot-pressed Si gradient composites, particularly in the low-silicon layers.
Figure 6 shows the cold-rolled microstructure of different hot-pressed composites. After rolling with a reduction of ~88%, the individual layers of silicon steel within the hot-pressed materials were significantly thinned. Specifically, the thicknesses of the high-silicon layer, medium-silicon layer, and low-silicon layer were reduced to approximately 10 μm, 40 μm, and 55 μm, respectively. The thickness ratio is almost consistent with the thickness ratio of the three initial materials, indicating that the materials of each layer underwent nearly the same amount of strain during cold rolling. In addition, some of the high-silicon layers were disconnected due to severe deformation, but no cracks formed. At this stage, the grains of all the layers were severely flattened and elongated. Within these deformed grains, a large number of substructures, like microbands, formed.
Figure 7 presents the Si distribution in the annealed Si-gradient steel after annealing at 1100 °C for 6 min. It can be observed that the silicon distribution pattern in the hot-pressed composites was maintained in the annealed samples. Figure 8 shows the microstructure of different annealed sheets. After annealing, the cold-rolled microstructures underwent recrystallization and grain growth. Here, the recrystallized microstructure in each layer of all the samples was mainly characterized by columnar grains throughout the layer thickness. This is also related to the SIBM behavior during annealing. In the PO-G sample (Figure 8a), the average grain sizes of the high-silicon layer, medium-silicon layer, and low-silicon layer were 22.3 μm, 37.4 μm, and 49.6 μm, respectively. In the CO-G sample (Figure 8b), the average grain sizes of the high-silicon layer, medium-silicon layer, and low-silicon layer were 20.6 μm, 33.4 μm, and 42.5 μm, respectively. For the CR-G sample (Figure 8c), the average grain sizes of the high-silicon layer, medium-silicon layer, and low-silicon layer were 22.6 μm, 38.3 μm, and 49.1 μm, respectively. Thus, the grain sizes of all the three samples were all relatively small with little difference among them. Furthermore, the high-silicon layer had the smallest grain size, while the low-silicon layer had the largest grain size. This trend was consistent across all three samples. This is mainly due to the inhibition of grain growth by the boundaries of each layer.

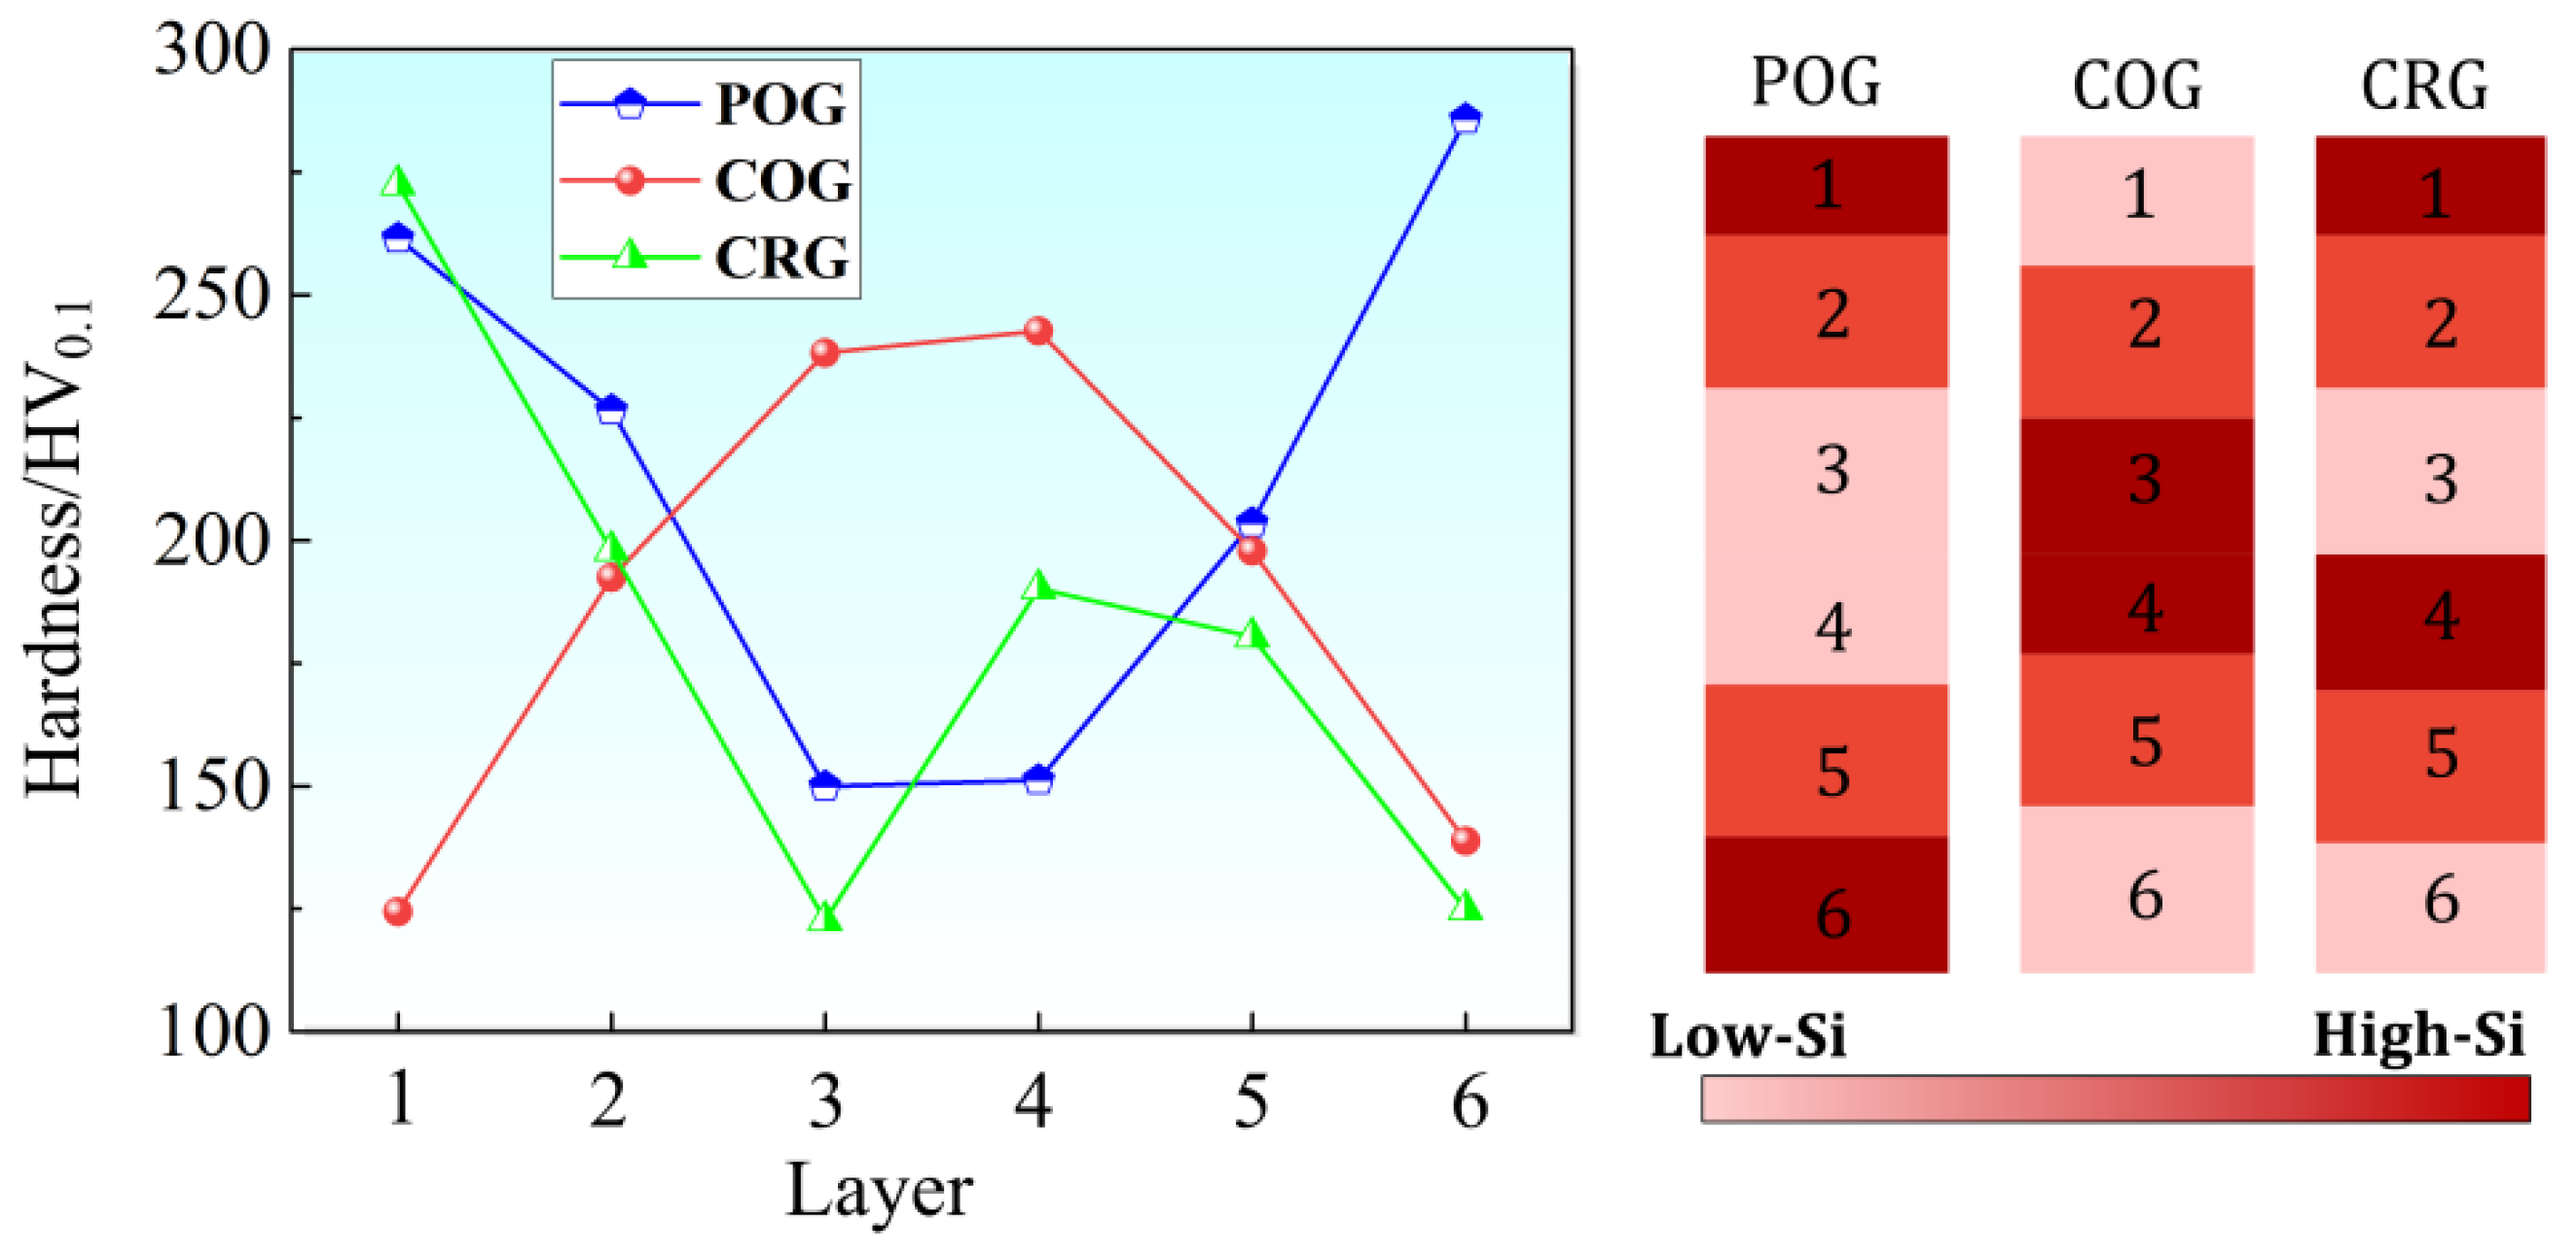
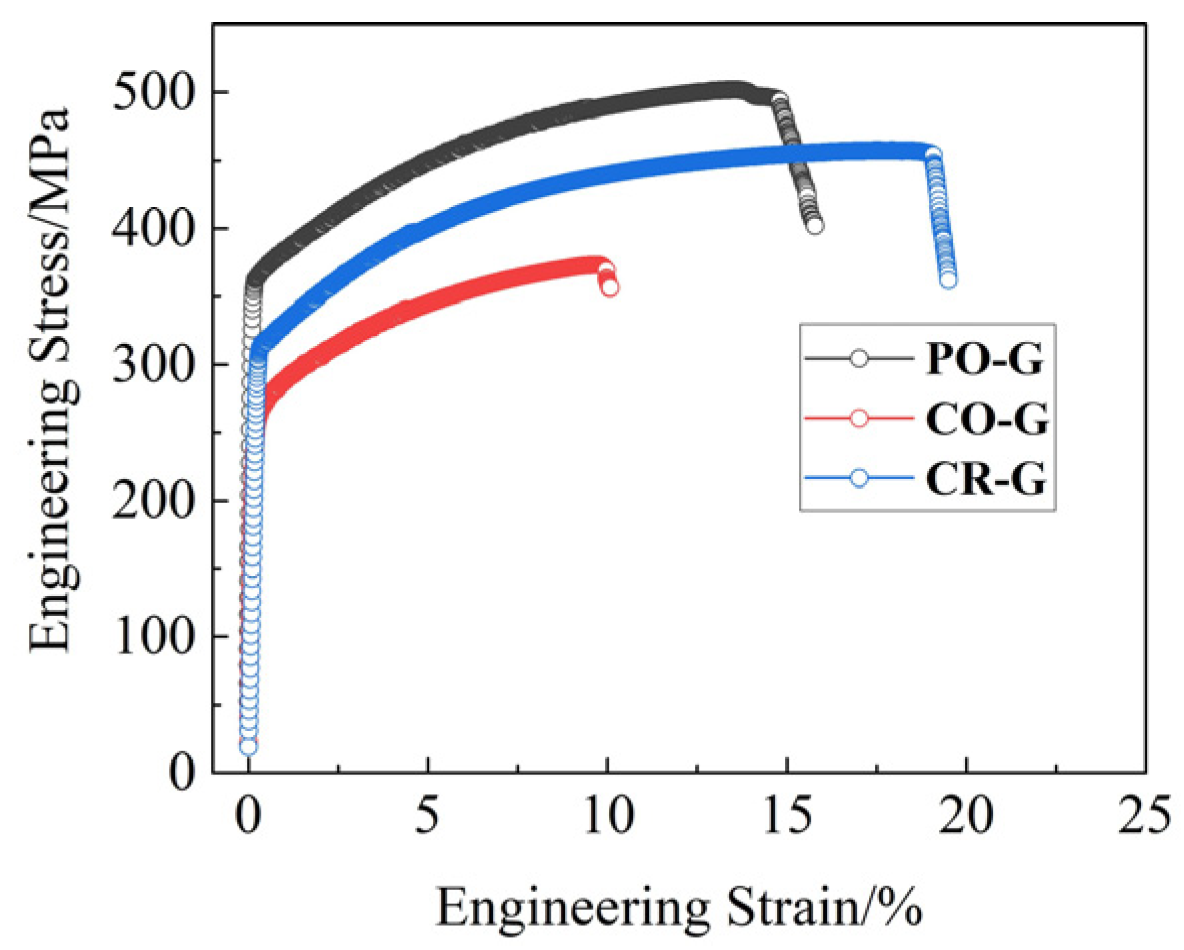
3.3. Magnetic and Mechanical Properties of the Annealed Si-Gradient Electrical Steel

The magnetic properties of non-oriented electrical steel include magnetic induction and core loss. The total core loss is divided into hysteresis loss Ph, eddy current loss Pe, and anomalous loss Pa. The total loss can be calculated by the following equation [24]:
Pt = Ph + Pe + Pa = khfBα + kef2B2 + kaf1.5Bβ
where B is magnetic induction, and f is frequency. The kh, ke, ka, α, and β are assumed to be constants. When B = 1.0 T,
Pt = Ph + Pe + Pa = khf + kef2 + kaf1.5
The value of kh can be calculated by fitting the values of P10/100, P10/400, and P10/1000. Then, the Ph is obtained by Equation (2). The classical eddy current loss is expressed by the following equation [25]:
Pe = π2t2f2B2k2/(6000 × γρ)
where t is the thickness of the sheet; f is the frequency; B is the maximum magnetic flux density; ρ is the resistivity; γ is the density of the material; and k is the waveform factor, and here k = 1.11 [26]. After calculating Pe, Pa can be obtained according to Equation (1).
Figure 9 shows the magnetic induction B50 at 5000 A/m and the core loss separation at 100–1000 Hz and magnetic flux density of 1.0 T. The B50 values of the annealed PO-G and COG samples were 1.73 T, whereas the CR-G sample exhibited a slightly higher B50 value (~1.75 T). In terms of core loss at a frequency of 100 Hz, the total loss for all the samples ranged from 3.5 W/kg to 3.9 W/kg. The CO-G sample exhibited the lowest loss. At this frequency, the hysteresis loss accounts for about 70–80% of the total loss. As the frequency increased, the total loss gradually rose, with a decrease in the proportion of hysteresis loss and an increase in the proportion of eddy current loss. At this point, the PO-G sample demonstrated the lowest core loss, while the CR-G specimen exhibited the highest core loss. In addition, the PO-G sample also had the lowest eddy current loss. Overall, the annealed PO-G sample exhibited better magnetic properties at high frequencies. This is likely due to the high silicon concentration at the surface of the PO-G electrical steel, which enhances the surface resistivity and subsequently reduces the eddy current loss [10]. In addition, the core loss of the Si-gradient composites was higher than that of the initial medium- and high-silicon steel. This is mainly due to the existence of multiple layer interfaces that increase the hysteresis loss [27].
The hardness distribution across the thickness of the annealed composites is displayed in Figure 10. It can be observed that the hardness of each layer positively correlated with the silicon concentration. In the PO-G sample, the high-silicon layer exhibited a hardness ranging from 262 HV0.1 to 284 HV0.1, while the low-silicon layer had a hardness of ~145 HV0.1. In addition, both the low-silicon and high-silicon layers in the CO-G sample exhibited lower hardness values compared to the PO-G sample. For the CR-G sample, the high-silicon layer located at the surface displayed a relatively high hardness of ~273 HV0.1, whereas the high-silicon layer situated at the center exhibited a reduced hardness of 184 HV0.1. The distribution of hardness is positively correlated with the distribution of silicon element concentration. A high silicon content provides stronger solid solution strengthening.
Figure 11 presents the tensile stress–strain curves for the annealed samples, with the detailed tensile properties listed in Table 2. It can be observed that the PO-G sample exhibited the best mechanical properties, possessing the highest strength (σ0.2 = 365.4 MPa, σb = 501.7 MPa). Furthermore, the mechanical properties of the CO-G annealed sample were the worst, with a tensile strength of only 373.2 MPa. The comprehensive mechanical properties of the CR-G sample fell between those of the PO-G and CO-G samples. Compared to the initial high-silicon steel material (Figure 3), the PO-G composite exhibited significantly improved plasticity. Furthermore, it had superior strength compared to the initial medium- and low-silicon samples. The improvement of mechanical properties of electrical steel is related to the design of the layered structure. On the one hand, the different mechanical responses among the layers lead to the accumulation of geometrically necessary dislocations and back stress in the softer layers, thereby enhancing the strain hardening capability [28]. On the other hand, the strain continuity required for interfacial bonding results in the dispersion of inherent plastic instability in the hard and brittle layers, further improving their plasticity [29]. When the silicon concentration is in an inverse gradient or cross-gradient configuration, the hardness and strength of the surface layers are lower, leading to earlier deformation during tensile testing and a weakened strain hardening capacity.

4. Conclusions

(1) The microstructure of hot-pressed laminated Si-gradient composites is influenced by the stacking method. The hot-pressed structure of the low-silicon layer was characterized by equiaxed grains when it was placed on the surface layer and dominated columnar grains when it was placed on the inner layer. In addition, both the medium-silicon and high-silicon layers were composed of columnar grains after hot pressing.
(2) The thickness ratio of each layer in the cold-rolled Si-gradient laminated composites was close to the thickness ratio of the initial material. After annealing, the composites inherited the silicon gradient distribution of the hot-pressed band. The recrystallized microstructure of each layer was dominated by columnar grains. The average grain size of each layer gradually increased with layer thickness.
(3) The laminated composite with a positive Si-gradient exhibited the best combination of mechanical properties (σ0.2 = 365.4 MPa, σb = 501.7 MPa) and high-frequency magnetic properties. The high-frequency magnetic properties of the CR-G composite and the mechanical properties of the CO-G composite were the worst.

Author Contributions

Conceptualization, H.J.; methodology, K.G.; investigation, K.G. and Q.X.; resources, H.J.; data curation, Y.H.; writing—original draft preparation, K.G.; writing—review and editing, K.G. and Q.X.; supervision, H.J.; funding acquisition, H.J. All authors have read and agreed to the published version of the manuscript.

Funding

This research was funded by the National Natural Science Foundation of China (52205356); the Natural Science Foundation of Jiangxi Province (20232BAB204053, 20224BAB214048); and the Open Project of Key Laboratory of Conveyance and Equipment and the Ministry of Education (KLCE2021-07).

Data Availability Statement

The original contributions presented in this study are included in the article. Further inquiries can be directed to the corresponding author.

Conflicts of Interest

The authors declare no conflicts of interest.

References

  1. Fan, L.; Zhu, Y.; Yue, E.; He, J.; Sun, L. Microstructure and texture evolution of ultra-thin high grade non-oriented silicon steel used in new energy vehicle. Mater. Res. Express 2022, 9, 096515. [Google Scholar] [CrossRef]
  2. Chen, Y.; Yang, B.; Zhou, Y.; Wu, Y.; Zhu, H. Evaluation of pitting corrosion in duplex stainless steel Fe20Cr9Ni for nuclear power application. Acta Mater. 2020, 197, 172–183. [Google Scholar] [CrossRef]
  3. Tian, W.P.; Jin, Z.Q.; Wang, X.R.; Xie, G.M. Wire-arc directed energy deposition super martensitic stainless steel with excellent strength and plasticity. J. Manuf. Process. 2023, 103, 11–22. [Google Scholar] [CrossRef]
  4. Guo, F.; Niu, Y.; Fu, B.; Qiao, J.; Qiu, S. Influence mechanisms of cold rolling reduction rate on microstructure, texture and magnetic properties of non-oriented silicon steel. Crystals 2024, 14, 853. [Google Scholar] [CrossRef]
  5. Jiao, H.; Xu, Y.; Zhao, L.; Misra, R.D.K.; Tang, Y.; Liu, D.; Hu, Y.; Zhao, M.J.; Shen, M. Texture evolution in twin-roll strip cast non-oriented electrical steel with strong Cube and Goss texture. Acta Mater. 2020, 199, 311–325. [Google Scholar] [CrossRef]
  6. Du, Y.; O’ Malley, R.; Buchely, M.F. Review of magnetic properties and texture evolution in non-oriented electrical steels. Appl. Sci. 2023, 13, 6097. [Google Scholar] [CrossRef]
  7. Hawezy, D. The influence of silicon content on physical properties of non-oriented silicon steel. Mater. Sci. Technol. 2017, 33, 1560–1569. [Google Scholar] [CrossRef]
  8. Yu, J.; Feng, H.; Jiang, S.; Wang, L.; Lin, P.; Sun, D.; Yan, B.; Zhang, Y. Revealing mechanisms for significantly enhancing plasticity of high silicon steel by combining experiment with first principle. Mater. Charact. 2023, 204, 113223. [Google Scholar] [CrossRef]
  9. Ouyang, G.; Chen, X.; Liang, Y.; Macziewski, C.; Cui, J. Review of Fe-6.5 wt%Si high silicon steel—A promising soft magnetic material for sub-kHz application. J. Magn. Magn. Mater. 2019, 481, 234–250. [Google Scholar] [CrossRef]
  10. Peng, M.; Zhong, Y.; Zheng, T.; Lan, L.; Zhou, J.; Ren, Z. 6.5 wt% Si high silicon steel sheets prepared by composite electrodeposition in magnetic field. J. Mater. Sci. Technol. 2018, 34, 2492–2497. [Google Scholar] [CrossRef]
  11. Li, C.; Yang, C.; Cai, G.; Wang, Q. Ordered phases and microhardness of Fe-6.5%Si steel sheet after hot rolling and annealing. Mater. Sci. Eng. A 2016, 650, 84–92. [Google Scholar] [CrossRef]
  12. Zhang, D.; Song, Y.; Wu, Z.; Yang, X.; Wang, C.; Su, Y.; Sun, H.L.; Ma, C.; Wang, B. Texture genetics and magnetic properties of Fe-6.5% Si materials modified with Cu. J. Mater. Sci. 2024, 59, 16735–16748. [Google Scholar] [CrossRef]
  13. Takada, Y.; Abe, M.; Masuda, S.; Inagaki, J. Commercial scale production of Fe-6.5 wt.% Si sheet and its magnetic properties. J. Appl. Phys. 1988, 64, 5367–5369. [Google Scholar] [CrossRef]
  14. Ros-Yanez, T.; De Wulf, M.; Houbaert, Y. Influence of the Si and Al gradient on the magnetic properties of high-Si electrical steel produced by hot dipping and diffusion annealing. J. Magn. Magn. Mater. 2004, 272–276, e521–e522. [Google Scholar] [CrossRef]
  15. Tian, G.K.; Bi, X.F. Fabrication and magnetic properties of Fe-6.5% Si alloys by magnetron sputtering method. J. Alloys Comp. 2010, 502, 1–4. [Google Scholar] [CrossRef]
  16. Yoshizaki, S.; Zaizen, Y.; Okubo, T. Characterization of a small motor for drones using new Si-gradient steel (JNRFTM). J. Magn. Magn. Mater. 2024, 593, 171751. [Google Scholar] [CrossRef]
  17. Hiratani, T.; Zaizen, Y.; Oda, Y.; Yoshizaki, S.; Senda, K. Investigation of the magnetic properties of Si-gradient steel sheet by comparison with 6.5% Si steel sheet. AIP Adv. 2018, 8, 056122. [Google Scholar] [CrossRef]
  18. Yu, H.; Wen, Y.; Bi, X. Magnetic and mechanical properties of the gradient FeSi alloys fabricated by magnetron sputtering. J. Alloys Comp. 2015, 634, 83–86. [Google Scholar] [CrossRef]
  19. Wu, Z.Y.; Xian, C.; Jia, J.X.; Liao, X.W.; Kong, H.; Wang, X.S.; Xu, K. Silica coating of Fe-6.5 wt%Si particles using fluidized bed CVD: Effect of precursor concentration on core-shell structure. J. Phys. Chem. Solids 2020, 146, 109626. [Google Scholar] [CrossRef]
  20. Fang, F.; Che, S.; Wang, F.; Zhao, Y.; Zhang, Y.; Wang, W.; Cao, G.; Yuan, G.; Misra, R.D.K.; Wang, G. Microstructure evolution and strengthening mechanism in thin-gauge non-oriented silicon steel with high strength. J. Magn. Magn. Mater. 2022, 563, 169791. [Google Scholar] [CrossRef]
  21. Li, H.Z.; Liu, H.T.; Liu, Y.; Liu, Z.Y.; Cao, G.M.; Luo, Z.H.; Zhang, F.Q.; Chen, S.L.; Lyu, L.; Wang, G.D. Effects of warm temper rolling on microstructure, texture and magnetic properties of strip-casting 6.5 wt% Si electrical steel. J. Magn. Magn. Mater. 2014, 370, 6–12. [Google Scholar] [CrossRef]
  22. Jiao, H.; Wu, W.; Hou, Z.; Xie, X.; Tang, Y.; Misra, R.D.K.; Liu, D.; Hu, Y.; Zhao, L. Ultrastrong {100} texture in twin-roll strip cast non-oriented electrical steel through two-step annealing. Scr. Mater. 2024, 243, 115998. [Google Scholar] [CrossRef]
  23. Zhao, J.; Zaiser, M.; Lu, X.; Zhang, B.; Huang, C.; Kang, G.; Zhang, X. Size-dependent plasticity of hetero-structured laminates: A constitutive model considering deformation heterogeneities. Int. J. Plast. 2021, 145, 103063. [Google Scholar] [CrossRef]
  24. Yuan, W.J.; Li, J.G.; Shen, Q.; Zhang, L.M. A study on magnetic properties of high Si steel obtained through powder rolling processing. J. Magn. Magn. Mater. 2008, 320, 76–80. [Google Scholar] [CrossRef]
  25. Sidor, J.J.; Verbeken, K.; Gomes, E. Through process texture evolution and magnetic properties of high Si non-oriented electrical steels. Mater. Charact. 2012, 71, 49–57. [Google Scholar] [CrossRef]
  26. Hou, D.; Fang, F.; Wang, Y.; Zhang, Y.; Zhang, X.; Misra, R.D.K.; Yuan, G. Nanoprecipitation behavior and resultant mechanical and magnetic properties in Fe-Si-Ni-Al-Mn high strength non-oriented silicon steel. Mater. Sci. Eng. A 2021, 819, 141529. [Google Scholar] [CrossRef]
  27. Jiao, H.; Xie, X.; Tang, Y.; Hu, Y.; Liu, D.; Zhao, L. Improved texture and magnetic properties in thingauge strip-cast non-oriented electrical steel through matching design of hot-cold rolling. J. Mater. Res. Technol. 2023, 24, 6411–6424. [Google Scholar] [CrossRef]
  28. Zhou, H.; Huang, C.; Sha, X.; Xiao, L.; Ma, X.; Höppel, H.W.; Göken, M.; Wu, X.; Ameyama, K.; Han, X. In-situ observation of dislocation dynamics near heterostructured interfaces. Mater. Res. Lett. 2019, 7, 376–382. [Google Scholar] [CrossRef]
  29. Liang, F.; Zhang, B.; Yong, Y.; Luo, X.M.; Zhang, G.P. Enhanced strain delocalization through formation of dispersive micro shear bands in laminated Ni. Int. J. Plast. 2020, 132, 102745. [Google Scholar] [CrossRef]
Figure 1. Schematic diagram of (a) stacking methods and (b) processing routes of different Si-gradient electrical steel composites.
Crystals 14 01023 g001
Figure 2. Microstructures and textures (φ2 = 45° ODF) of different initial silicon steel: (a,d) high-silicon steel; (b,e) medium-silicon steel; (c,f) low-silicon steel.
Crystals 14 01023 g002
Figure 3. Tensile engineering strain–stress curves obtained at room temperature of the initial materials with different silicon content.
Crystals 14 01023 g003
Figure 4. Silicon distribution in terms of thickness for the different hot-pressed Si-gradient electrical steel: (a) PO-G sample, (b) CO-G sample, and (c) CR-G sample.
Crystals 14 01023 g004
Figure 5. EBSD IPF (inverse pole figure) map of the microstructure of the hot-pressed Si-gradient electrical steel composites: (a) PO-G sample, (b) CO-G sample, and (c) CR-G sample.
Crystals 14 01023 g005
Figure 6. Cold-rolled microstructure of different hot-pressed composites: (a) PO-G sample, (b) CO-G sample, and (c) CR-G sample.
Crystals 14 01023 g006
Figure 7. Silicon distribution in terms of thickness for the different annealed Si-gradient electrical steel: (a) PO-G sample, (b) CO-G sample, and (c) CR-G sample.
Crystals 14 01023 g007
Figure 8. Microstructures (left), EBSD IPF map (middle), and schematic diagram of Si-gradient pattern (right) in different annealed composites: (a) PO-G sample, (b) CO-G sample, and (c) CR-G sample.
Crystals 14 01023 g008
Figure 9. Magnetic properties of the annealed Si-gradient laminated composites: (a) magnetic induction B50, (b) core loss P10/100, (c) core loss P10/400, and (d) core loss P10/1000.
Crystals 14 01023 g009
Figure 10. Hardness distribution across the thickness of the annealed composites.
Crystals 14 01023 g010
Figure 11. Tensile engineering strain–stress curves obtained at room temperature of the annealed Si-gradient laminated composites.
Crystals 14 01023 g011
Table 1. Magnetic induction and core loss of the initial silicon steels.
MaterialB50 (T)P10/100 (W/kg)P10/400 (W/kg)P10/1000 (W/kg)
High-silicon steel1.661.096.2421.66
Medium-silicon steel1.722.3016.5275.53
Low-silicon steel1.773.7133.78172.21
Table 2. Strength and elongation of the annealed Si-gradient composites.
Sampleσ0.2/MPaσb/MPaElongation/%
PO-G365.4501.714.6
CO-G268.7373.29.8
CR-G315.7457.318.4
Disclaimer/Publisher’s Note: The statements, opinions and data contained in all publications are solely those of the individual author(s) and contributor(s) and not of MDPI and/or the editor(s). MDPI and/or the editor(s) disclaim responsibility for any injury to people or property resulting from any ideas, methods, instructions or products referred to in the content.

