3.1. Analysis of Water Mist Cooling
When subjected to continuous heating, Lithium-ion batteries will gradually experience self-heating, safety valve opening and eventually thermal runaway. During this process, the battery will generate a significant amount of heat spontaneously. If not cooled promptly, the thermal runaway could spread to other batteries, creating a substantial fire hazard. Equation (1) can be used to calculate the heat accumulation of the battery itself after spontaneous heat generation.
where,
Qrem is the remaining heat of the battery;
Qtot is the total heat transferred by the battery self-heating and the heating plate;
Qair is the heat dissipated by the air.
Qrem and
Qair can be calculated by Equations (2) and (3), respectively.
where,
cb is the specific heat of the battery, which is assumed to be uniform throughout the calculation and is assigned a value of 1.38 kJ/(kg·K);
me is the remaining mass of the battery;
T0 and
Te are the temperature of the battery at the beginning and the end of the experiment, respectively;
A is the area of the battery exposed to the air;
h is the air convection heat transfer coefficient, assuming the air is naturally convective in the experimental and taking the value of 10 W/(m
2·K);
T is the total experimental time;
Ti and
Ta are the battery temperature at time
i and ambient temperature, respectively;
ε is the surface emissivity of the battery, which takes the value 0.05 because the battery surface is a smooth aluminium surface [
21];
σ is the Stefan-Boltzmann constant, which takes the value of 5.67 × 10
−8 W/(m·K).
Qrem and
Qair can be derived from the calculation, which can be substituted into Equation (1) to calculate
Qtot at each moment of cut-off in Case 1. Taking the safety valve opening time as a reference, then the total heat production of different cases can be calculated. When cooling inhibition is intervened, the heat of water mist cooling
QWM can be calculated by Equation (4).
The opening of the battery safety valve causes gas to be ejected from the battery; this heat loss Qeje will be discussed below.
Assuming the distributions of stress, electrolyte and gas production within the battery after self-generated heat are uniform, and ignoring the effect of potential energy, the fluid ejected from the safety valve is assumed to satisfy Bernoulli’s law as shown in Equation (5).
where,
P is the pressure inside the battery;
ρ is the density of the gas ejected from the safety valve;
v is the flow rate of the gas ejected from the safety valve.
Derived from the above equation, the mass of gas ejected from the battery safety valve
Mval is proportional to the integral of the square root of the battery stress
F. The amount of heat
Qeje, carried away by the gas ejected after the safety valve is opened can be calculated from Equation (6).
where
T1 and
Ti are the temperature at the safety valve before the safety valve is opened and the battery temperature at time
i, respectively;
T is the total time of the experiment;
α is a constant calculated from the experiment data and has the value 3.8 × 10
−5.
Therefore, when the safety valve is opened, the heat of water mist cooling
QWM can be calculated by Equation (7).
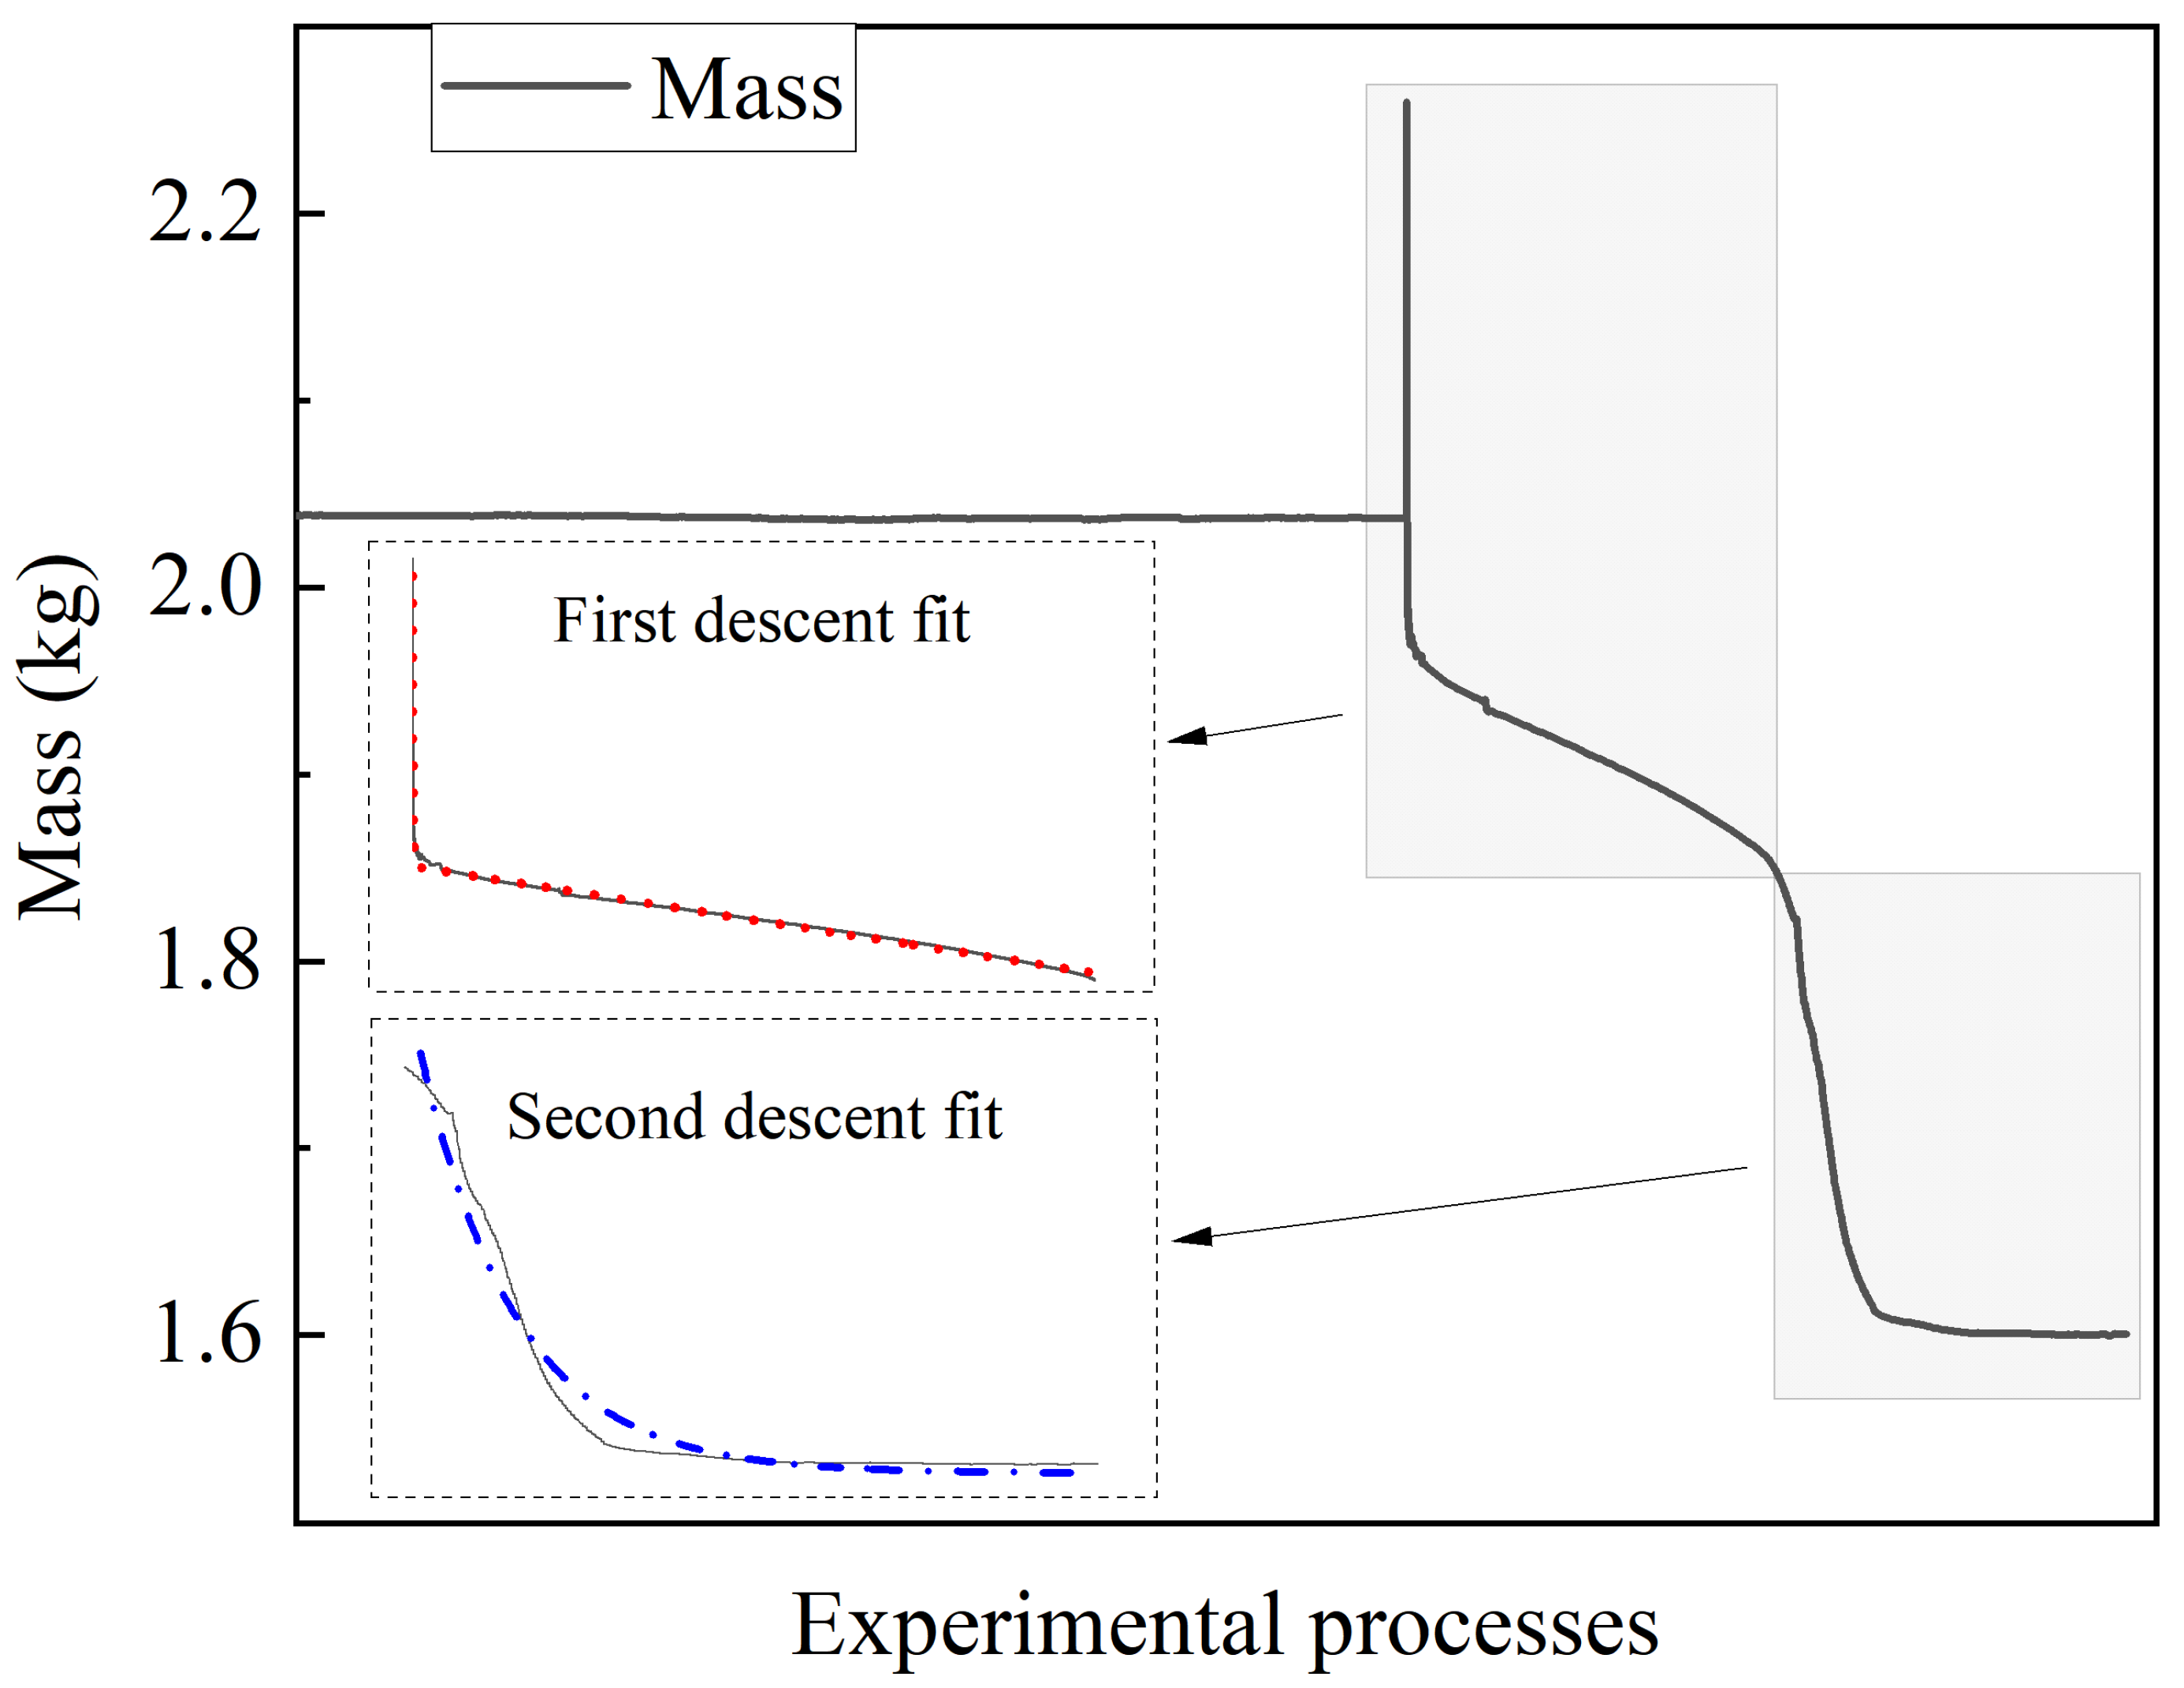
The mass data for Case 1 is plotted and fitted as shown in
Figure 3. After the safety valve is opened, there are two drop intervals in the battery mass, corresponding to the two times when the safety valve is opened and the thermal runaway is initiated. In the first drop interval, the battery is observed to be overweight due to the reaction force of the ejected gas on it when the safety valve is relieved. During the second drop interval, it is observed that the rate of mass loss is greater in the first half and the mass is more stable in the other half. The findings suggest that the electrolyte evaporates faster and the side reactions are more intense after the thermal runaway is initiated; when the electrolyte is exhausted, the battery mass tends to stabilize and the thermal runaway process tends to end. The ExpAssoc function model has been used to fit the two drop intervals, both of which gives a correlation index R
2 greater than 0.95. The high confidence level of the fit suggests that the battery mass loss is stable without serious fluctuations and could be applied to the above equation calculations.
By inputting the experiment data of each case into the calculation, as well as the water mist release time, we can derive the heat and water mist cooling rate of each part of each case, as shown in
Table 2.
The cooling rates of Cases 3 to 5 are 0.80 kW, 1.06 kW and 1.52 kW, respectively, which are higher than that of Case 2 (0.08 kW), indicating that the cooling rate of water mist release is higher after the safety valve of the battery is opened, i.e., the heat transfer effect between the water mist and the jet gas is more effective when the water mist and the jet gas are convected. Using the safety valve opening and thermal runaway initiating time point of Case 1 as the basis, the corresponding
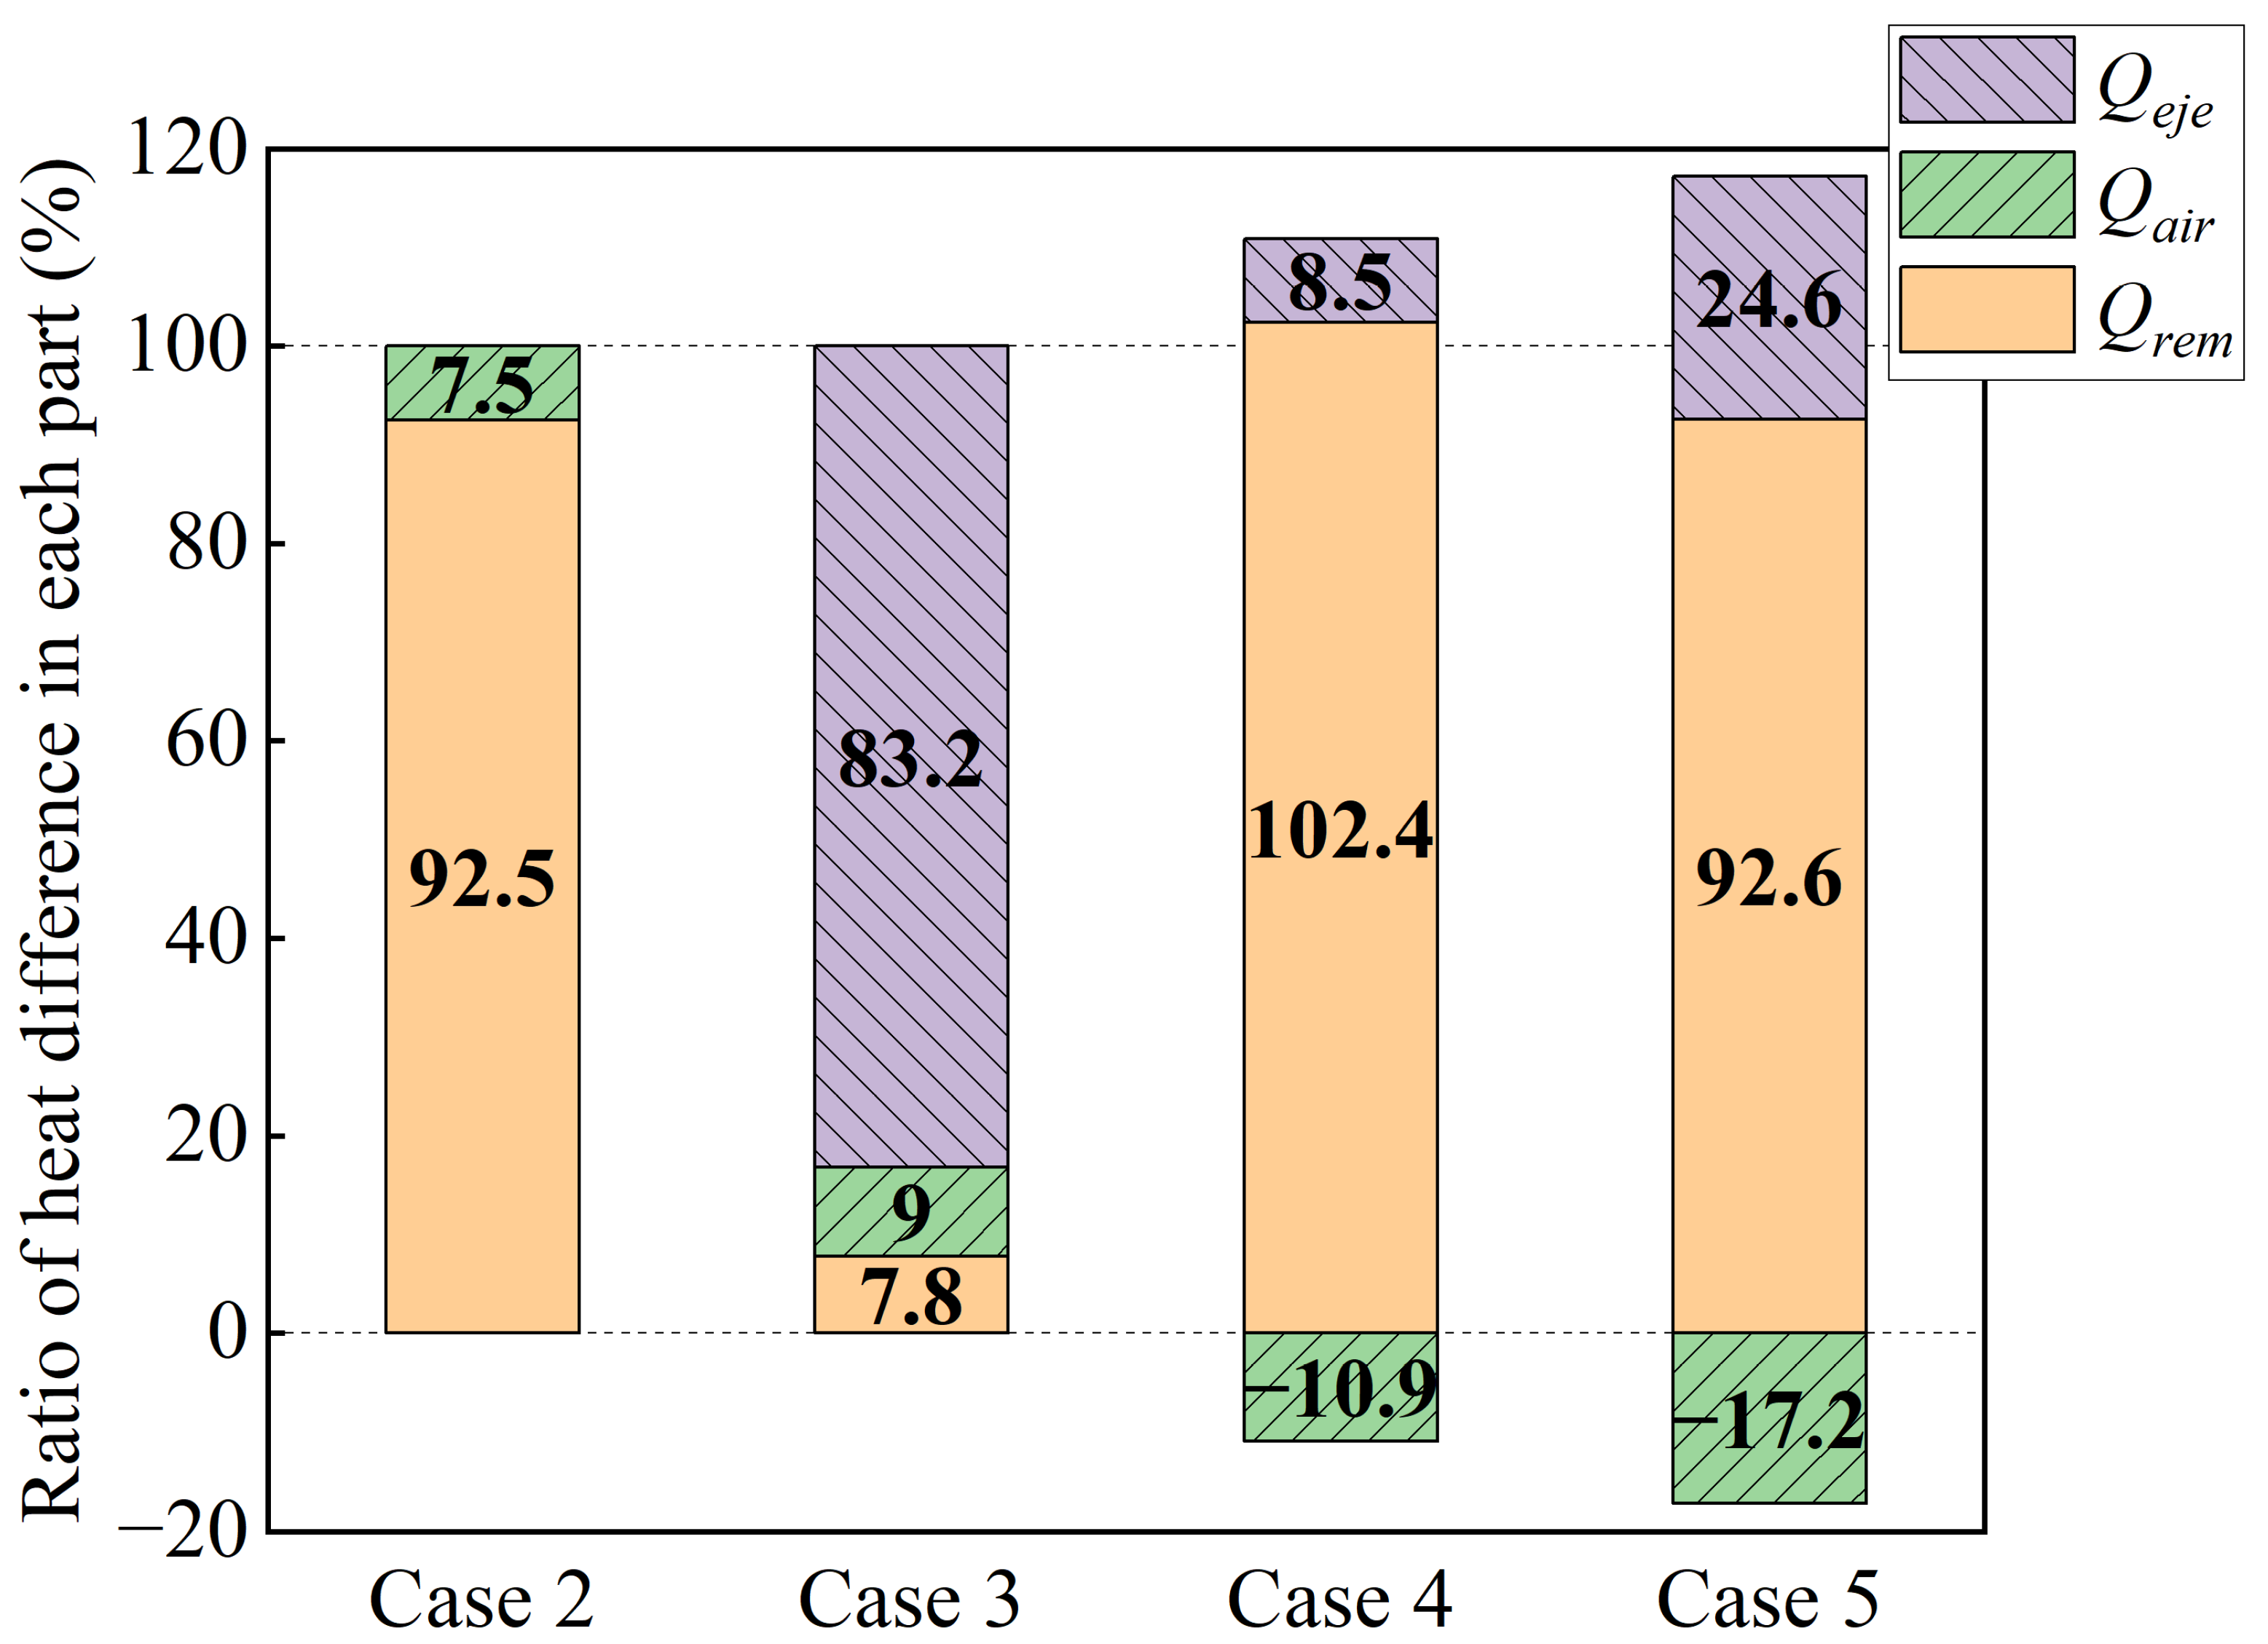
Qtot for each case from the start of heating to the end of extinguishing can be calculated. On the assumption that the batteries underwent the same thermal runaway process in each case, the heat difference of each part affected by the water mist can be derived by subtracting the heat of each part in Cases 2 to 5 from the corresponding stage in Case 1, as shown in
Figure 4. The main role of the water mist cooling part is: Cases 2, 4 and 5 mainly
Qrem, accounting for 92.5%, 102.4%, and 92.6%, respectively; Case 3 mainly
Qeje, accounting for 83.2%. It is noticed that there are cases where the percentage heat difference is greater than 100%. This is due to the fact that water droplets reduce the temperature on the surface of the battery, and this reduction affects the convective and radiative heat transfer with the air, making the
Qair difference negative. The percentage of heat difference indicates that when the battery is violently ejected, the water mist cooling mainly works to suppress the ejected heat, but otherwise mainly works to reduce the temperature of the battery itself. As there is a component of water mist cooling after reaching the highest temperature during thermal runaway in Cases 6 and 7, further analyses will be conducted separately in the following section.
Prior to the release of water mist, the temperature rise rate of the battery increases over 400 s and stabilizes after 400 s. The temperature rise rates of Cases 2~4 are about 0.07 °C/s and that of Case 5 is about 0.11 °C/s. Following the release of the water mist, the temperature rise rate reduces differently in each case, of which Case 3 decreases the most, and the duration of battery fire extinguishing of Cases 3~5 is similar, which is about 15 s. This is because the heat storage of the battery is less and the self-produced heat rate is slower before the onset of thermal runaway, which means that the main reason for the battery temperature rise is still the heat transfer from the heating plate. At this time, the application of water mist cooling can inhibit the battery temperature rise. After the application of water mist cooling, the temperature of the battery in Cases 2~5 remains stable before and after the time of thermal runaway initiation in Case 1. Cases 2 and 3 remain stable at about 100 °C, while after a longer heating time in Cases 4 and 5, the battery temperature remains stable at about 120 °C. The accumulated heat density is introduced and its calculation is shown below in Equation (8).
where
cb is the specific heat of the battery, which is assumed to be uniform throughout the calculation and is assigned a value of 1.38 kJ/(kg·K);
T0 and
Ti are the battery temperatures at the start of heating and at any time
i, respectively.
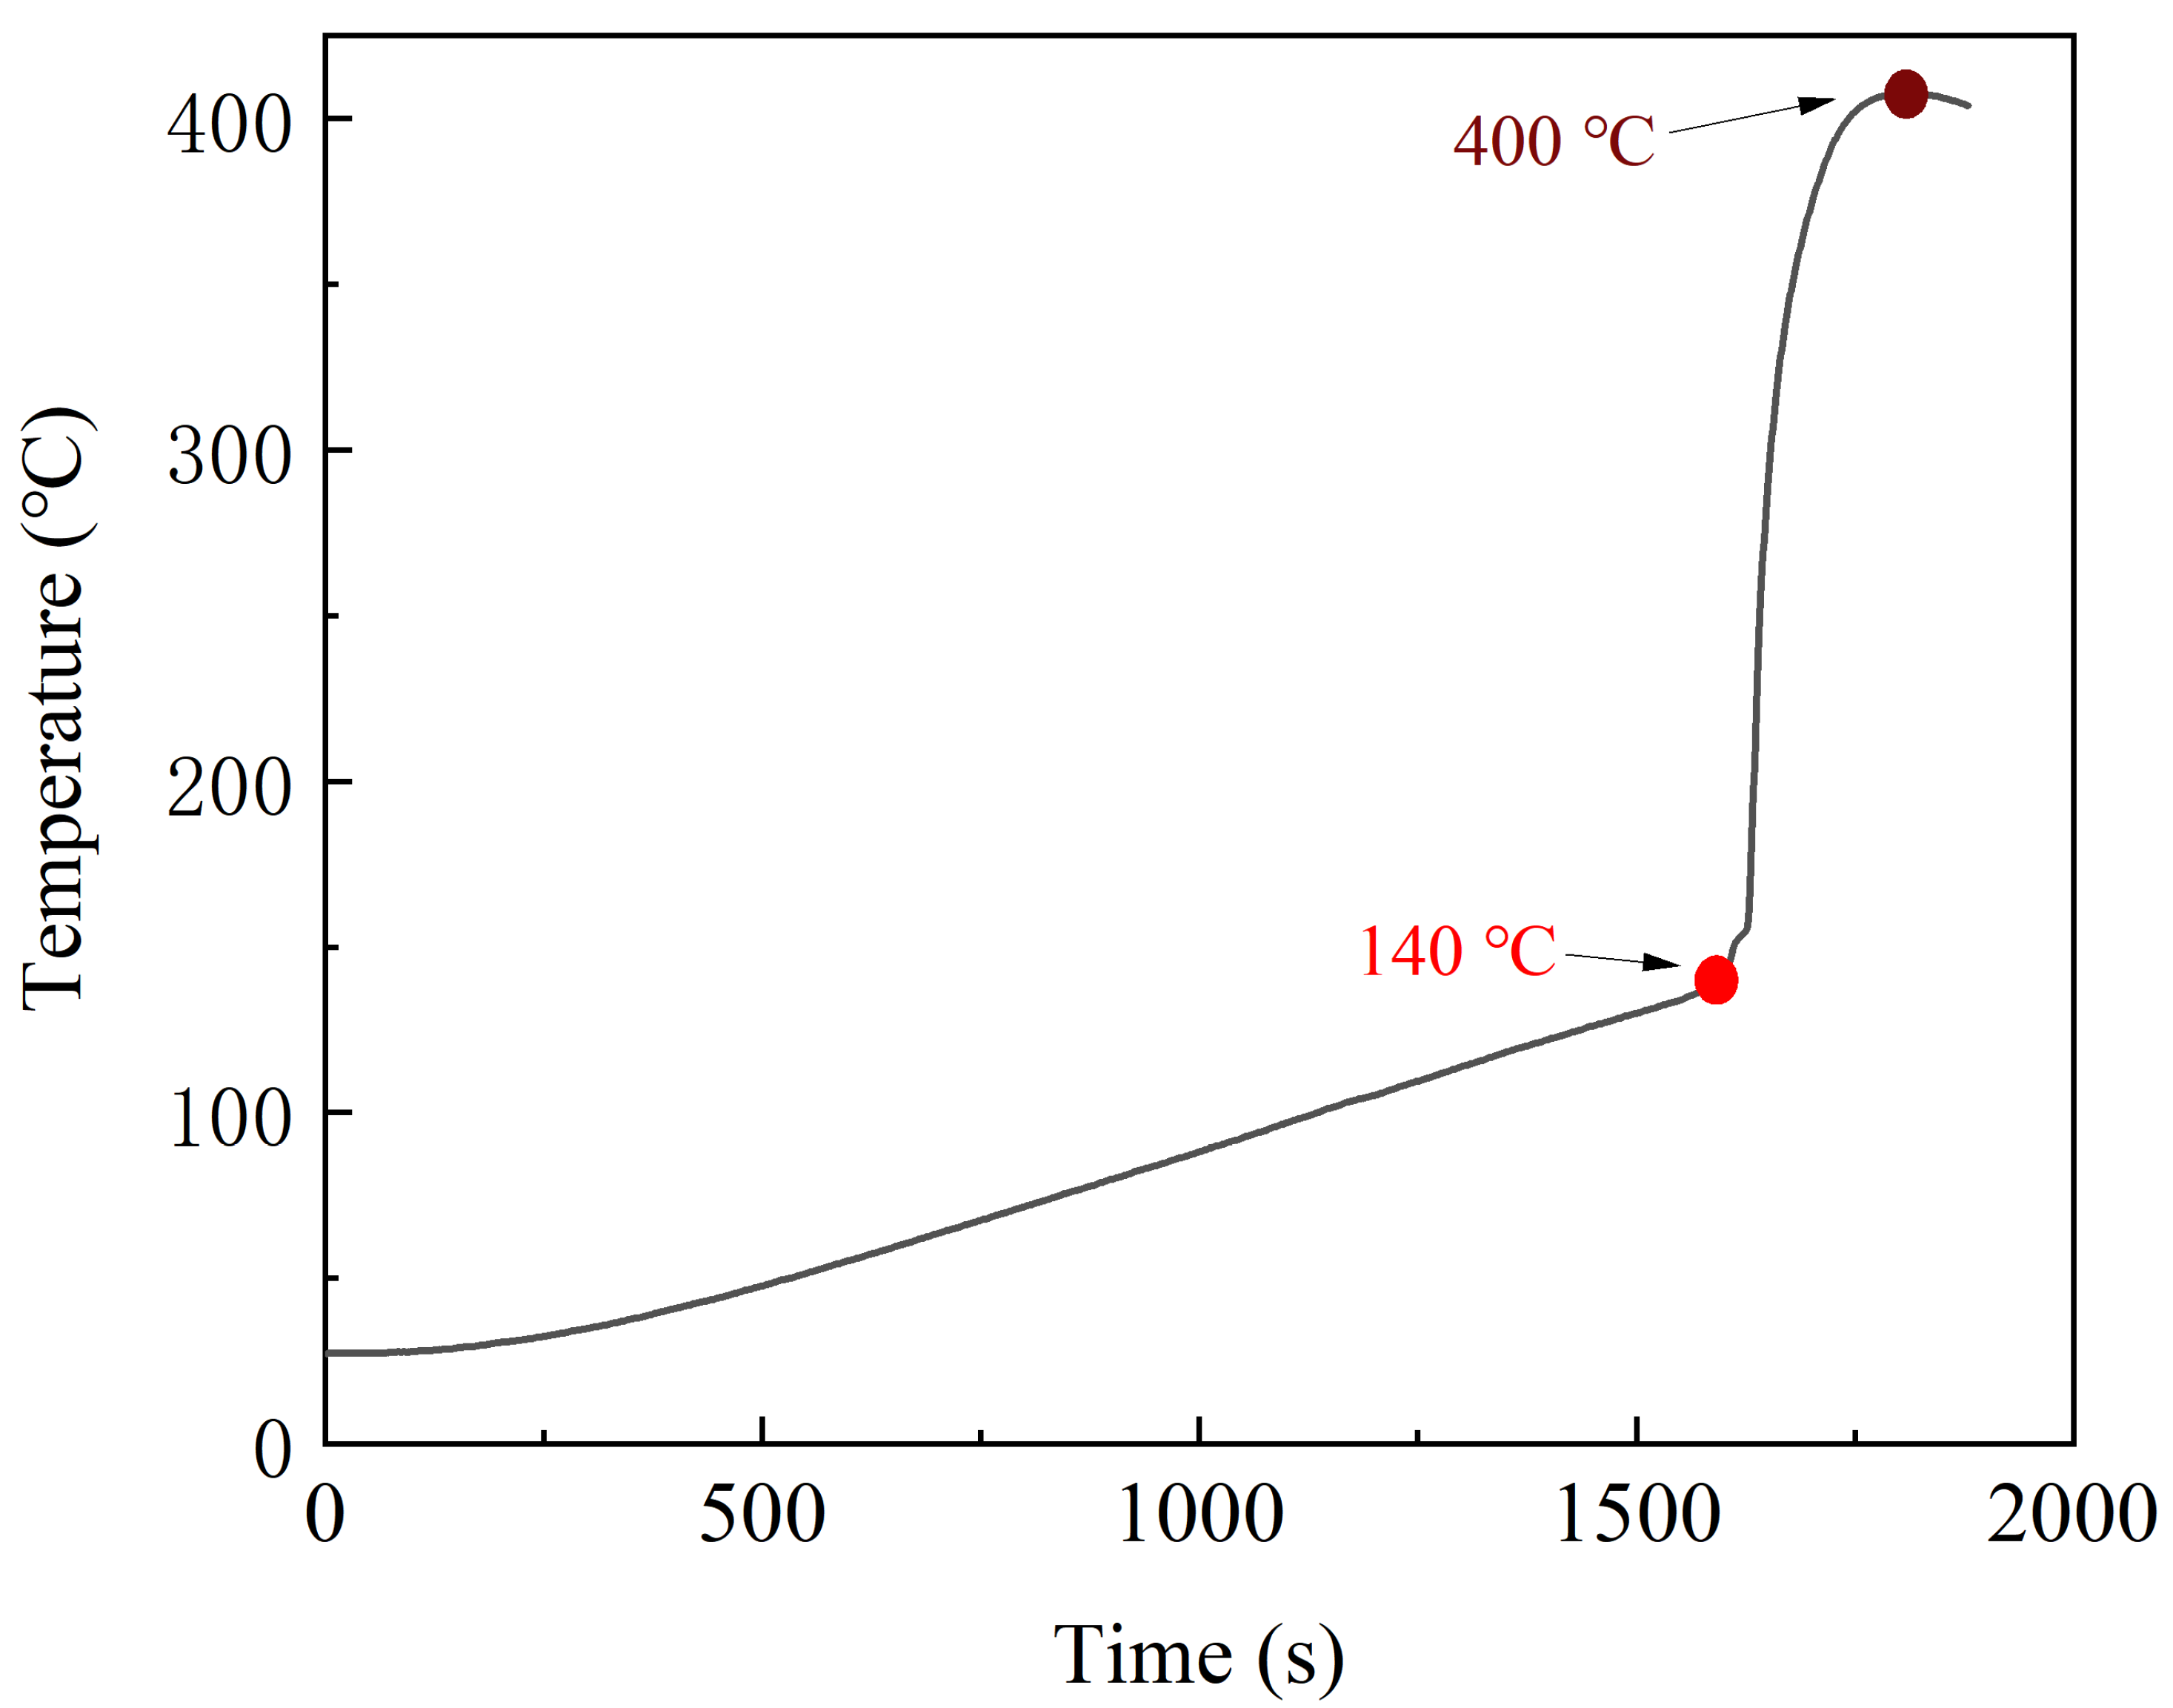
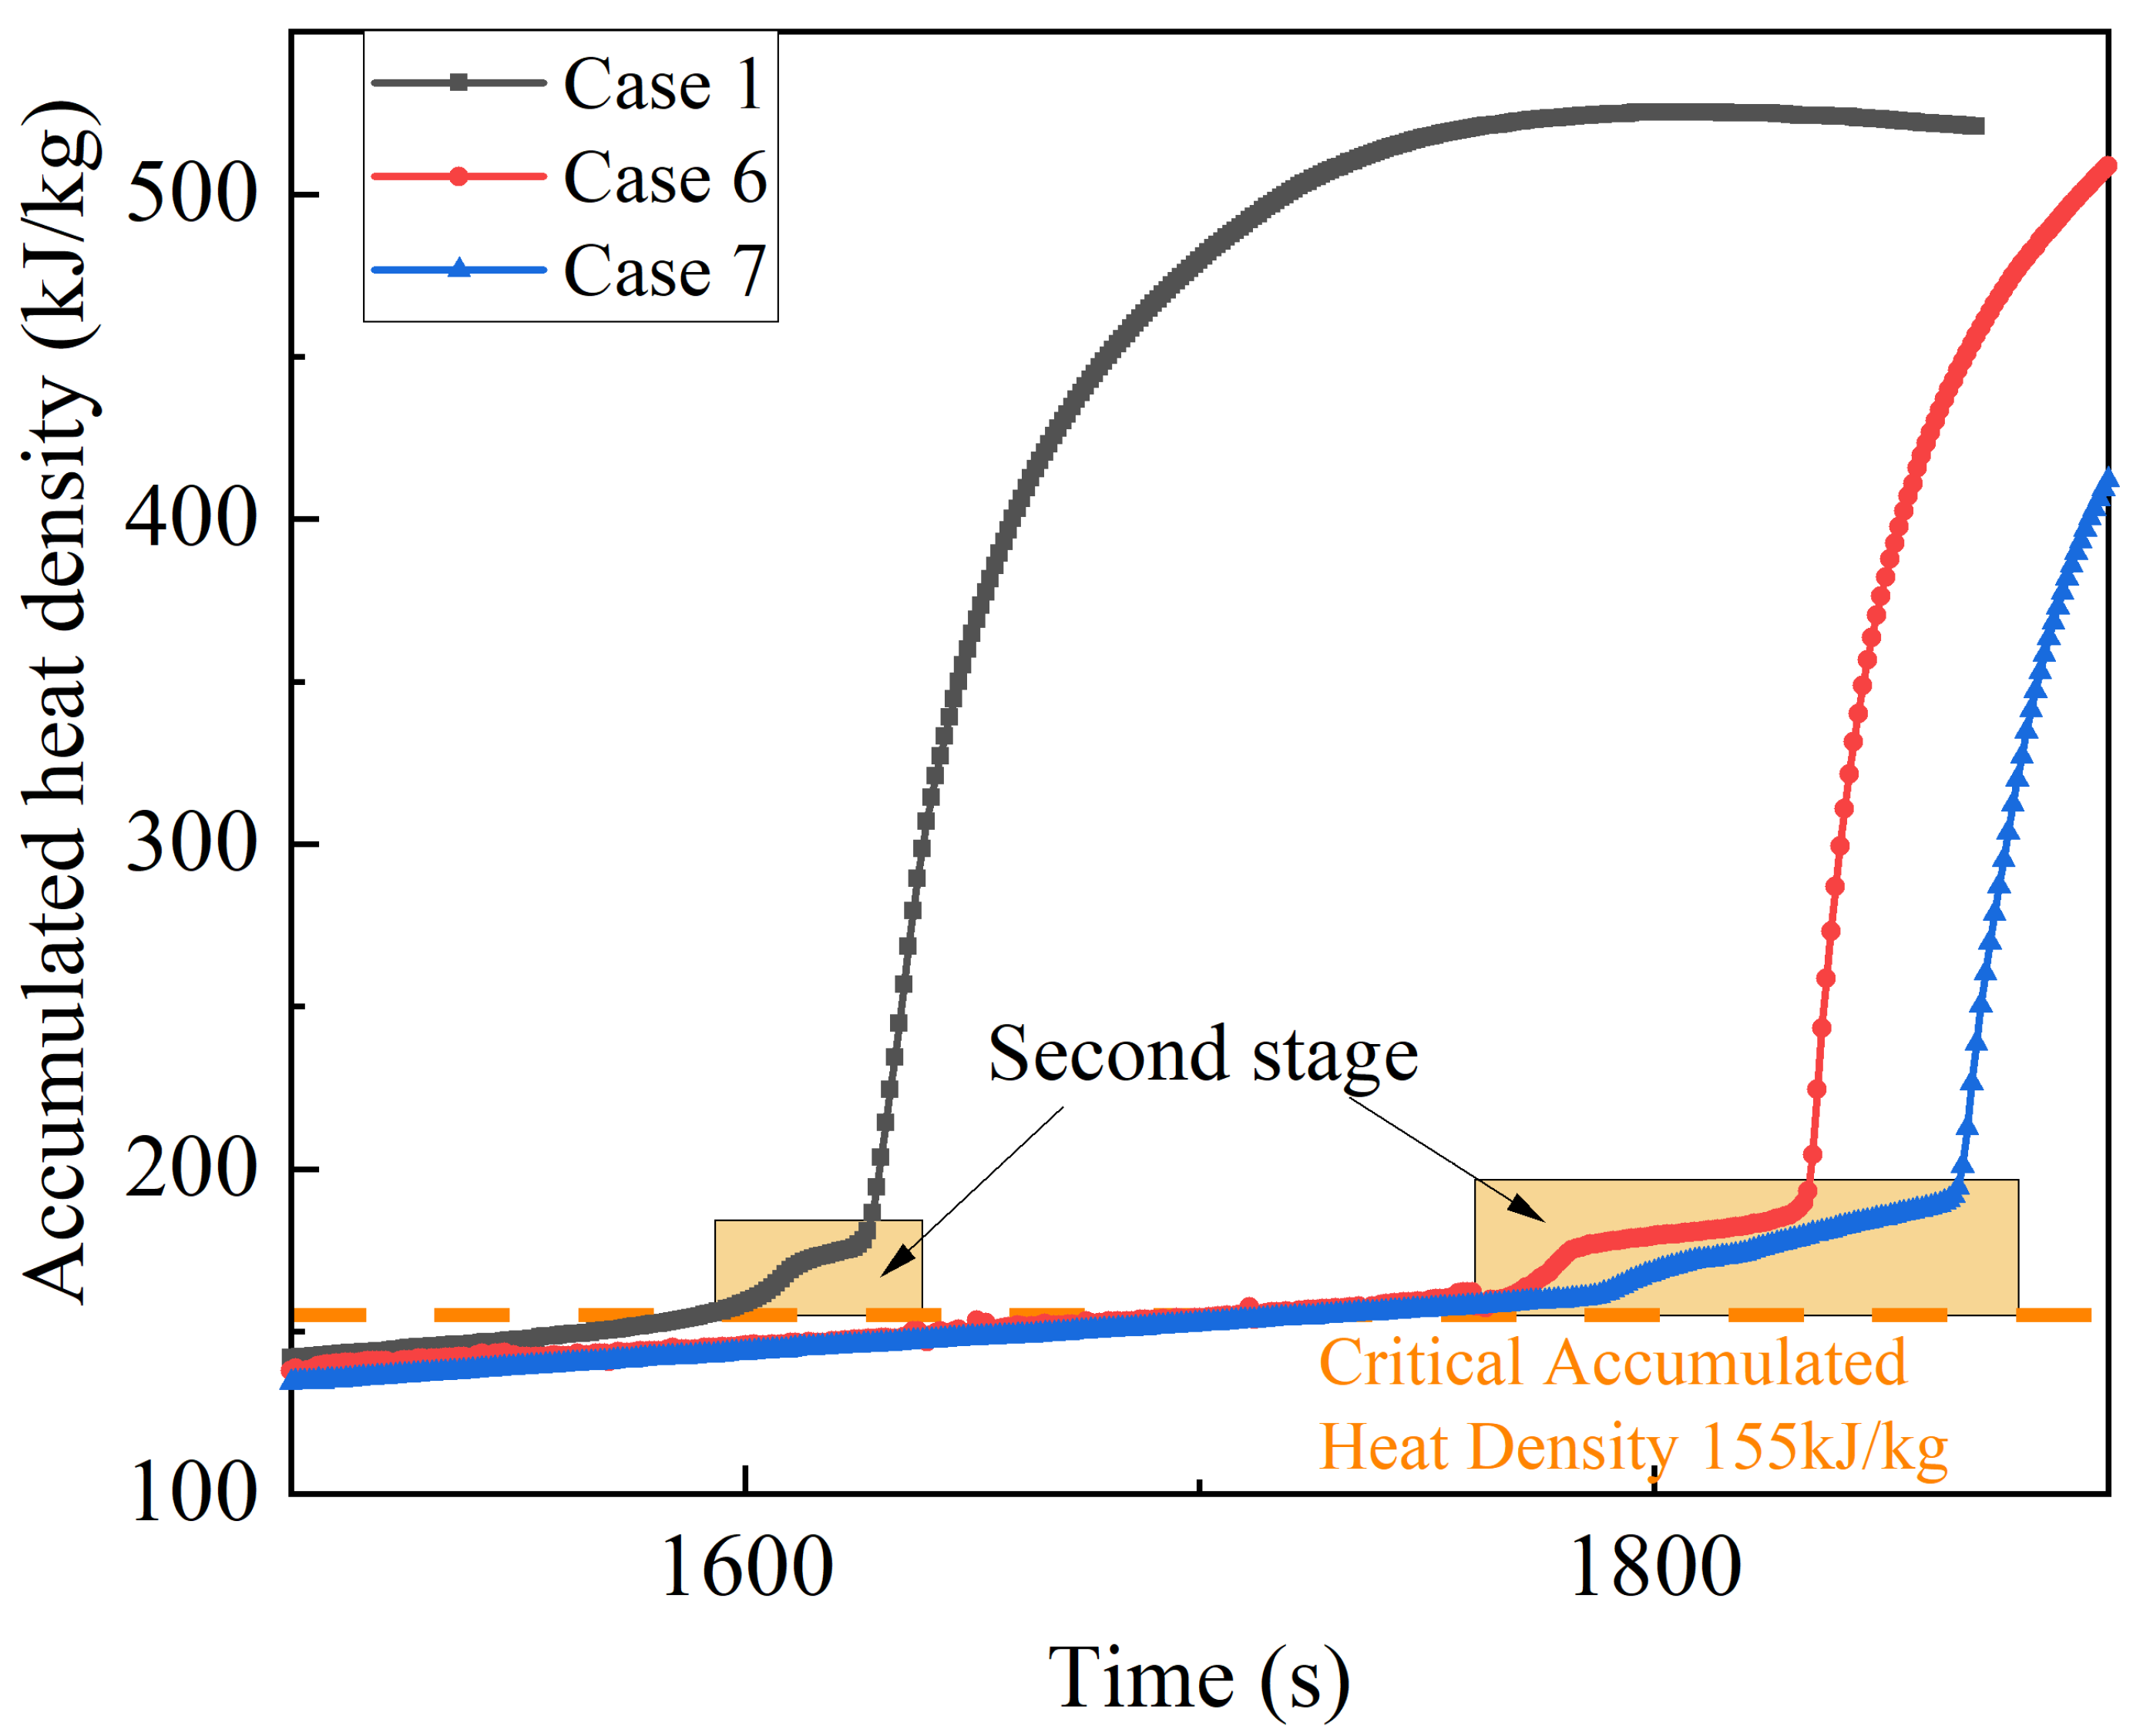
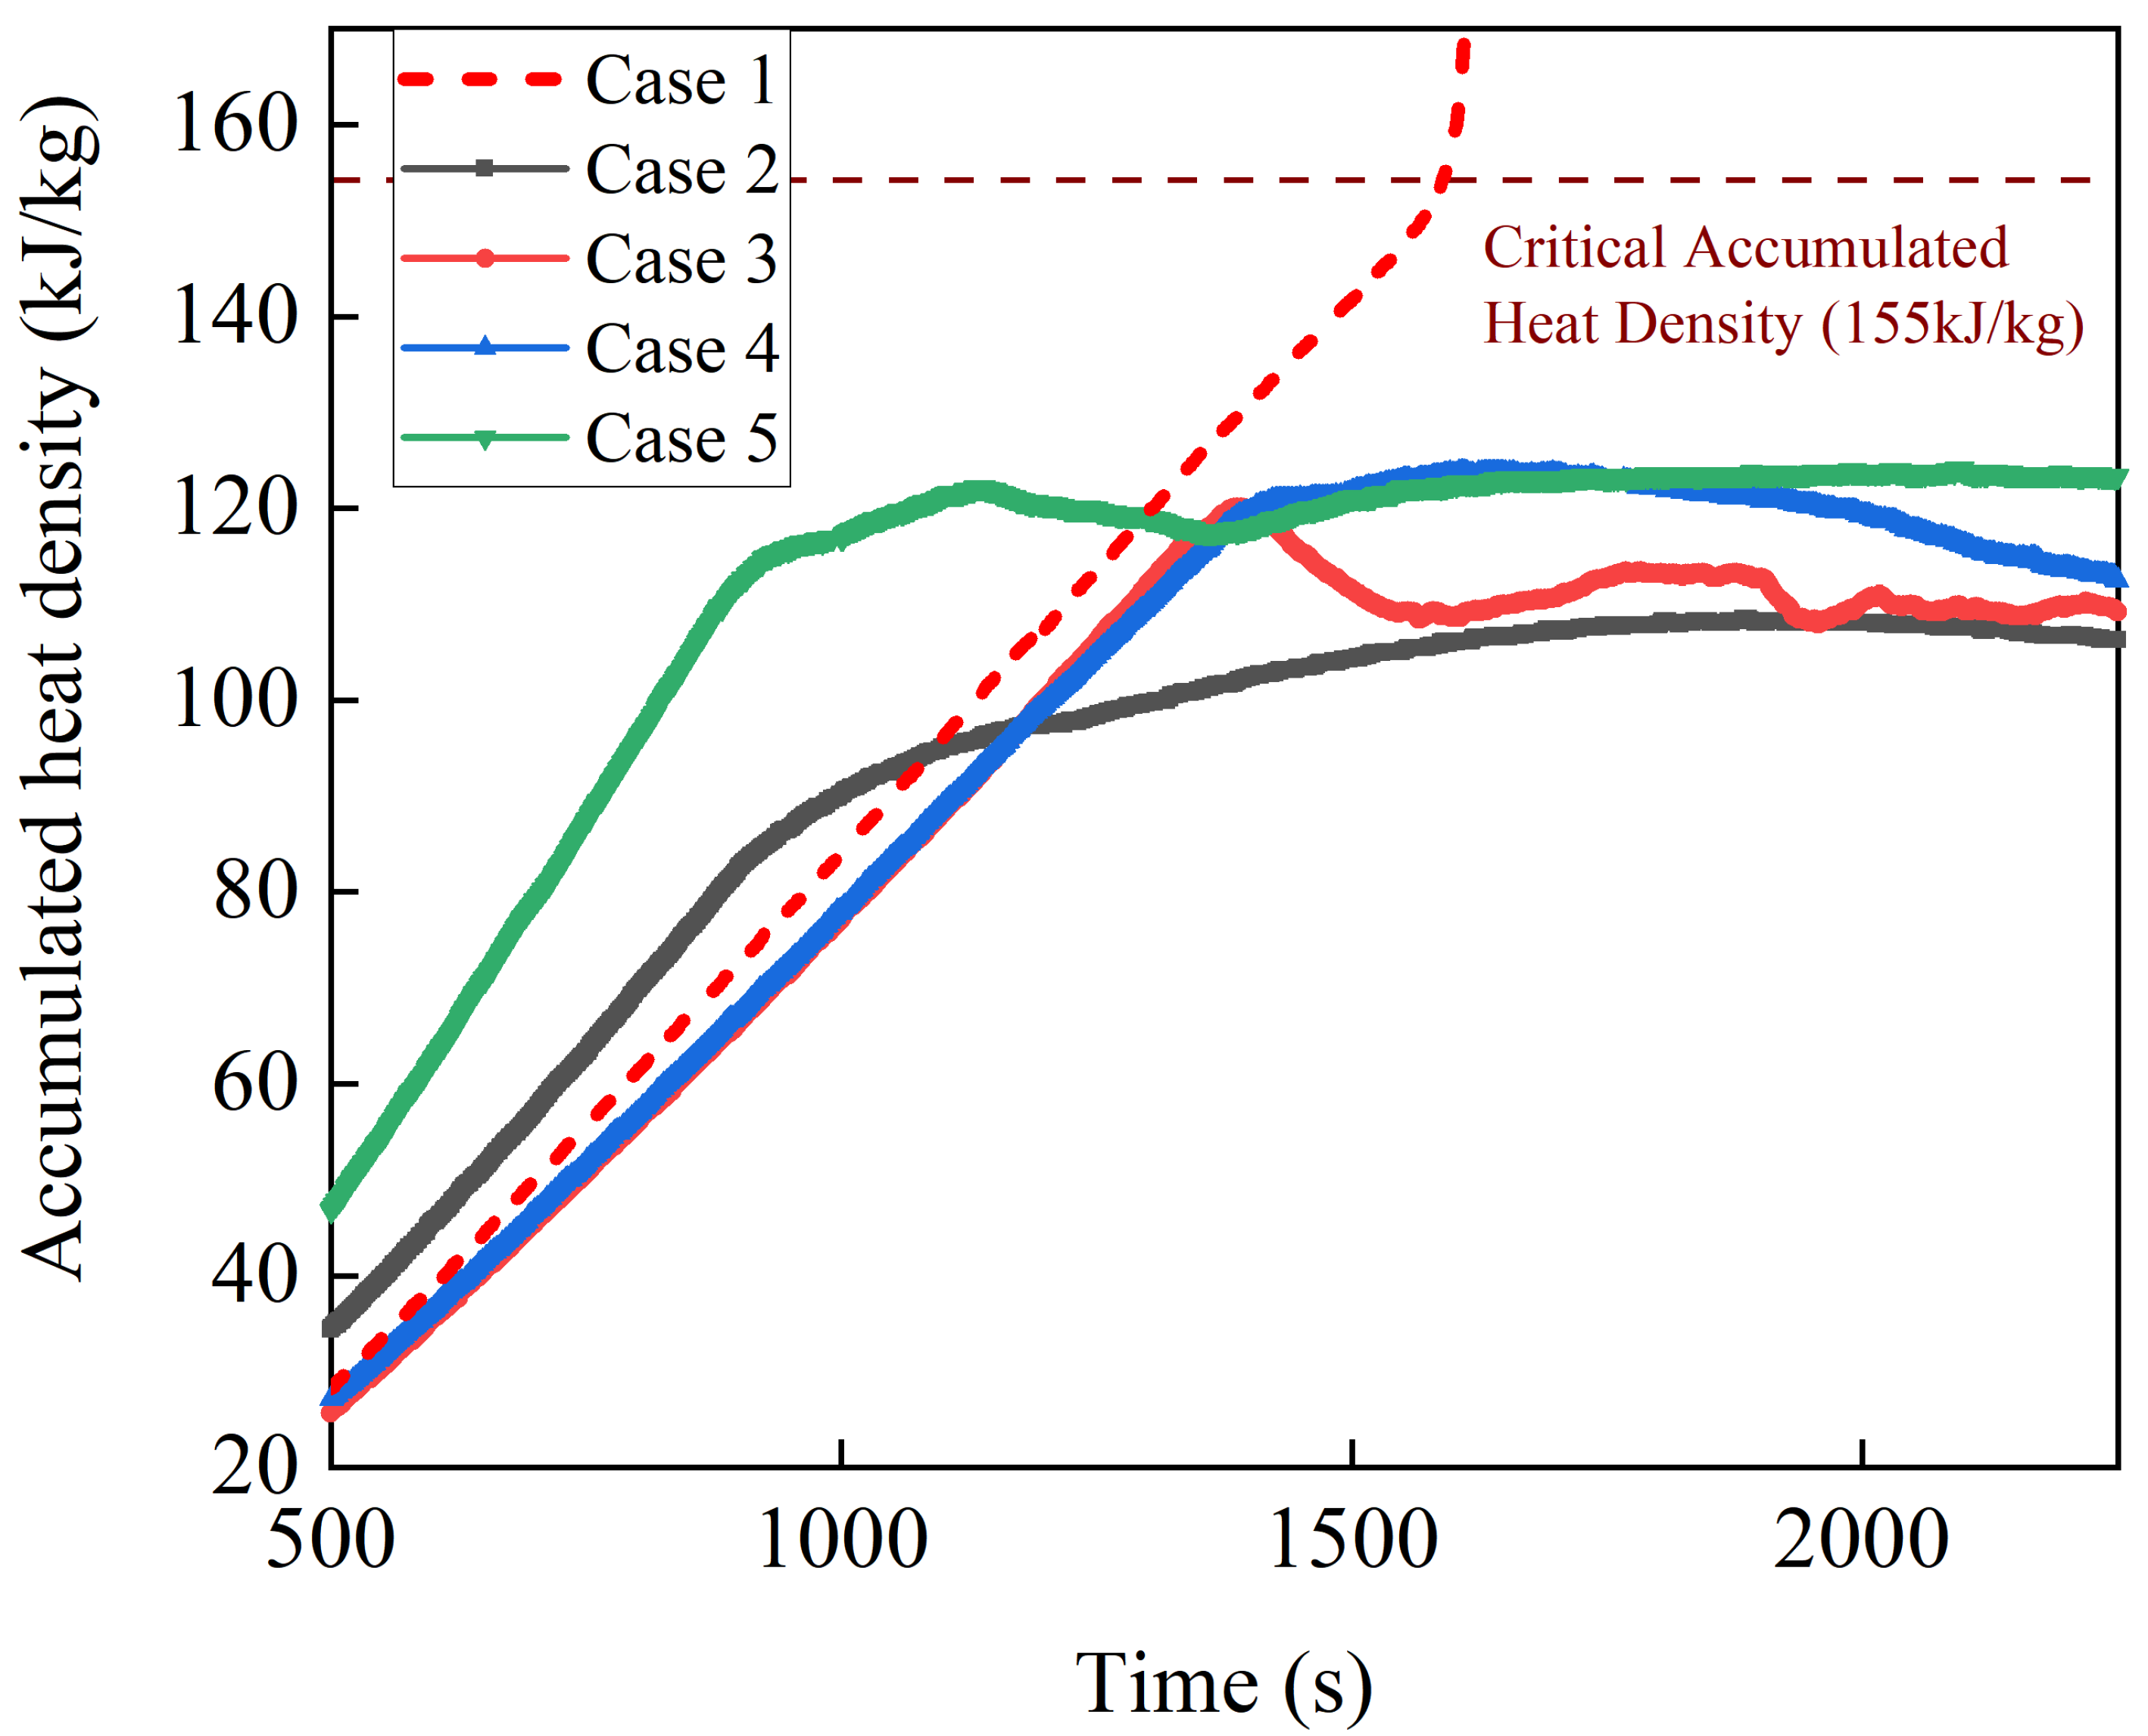
The critical accumulated heat density for thermal runaway is noted at 155 kJ/kg for the battery in Case 1 at the onset of thermal runaway. As shown in
Figure 5, after the water mist is released, the increase in the accumulated heat density in Cases 2, 4 and 5 immediately slows down, and after a period, the increase gradually stops and turns into a downward trend; while in Case 3, the accumulated heat density of the battery immediately decreases after the water mist is released. Clearly, the small-diameter water droplets falling on the battery surface could immediately evaporate and absorb the heat, and will not form a water film on the battery surface which could affect the subsequent droplet evaporation to dissipate the heat. Before and after water mist cooling, the maximum accumulated heat density of the batteries in Cases 2~5 is 108 kJ/kg, 120 kJ/kg, 124 kJ/kg and 124 kJ/kg, respectively, which is less than the critical value of 155 kJ/kg. In conclusion, the release of water mist before the onset of thermal runaway is effective in suppressing the thermal runaway of the batteries.
For Case 6, since the release of water mist occurs at the initiation of thermal runaway, the cooling process of water mist should be divided into two stages: inhibition before and cooling after the end of thermal runaway, and the cut-off point is at the moment when the battery reaches its maximum temperature. Applying the equation above, the value of
Qrem,
Qtot,
Qair,
Qeje and
QWM is 756.2 kJ, 1058.7 kJ, 29.0 kJ, 191.1 kJ and 82.4 kJ, respectively in the first stage, and the cooling rate of the water mist is 0.78 kW. Compared to this stage of Case 1,
Qrem decreases by 150.3 kJ and
Qair and
Qeje increases by 12.0 kJ and 66.5 kJ, respectively in the first stage of Case 6, indicating that the heat accumulated inside the battery decreases and the heat ejected from the battery increases.
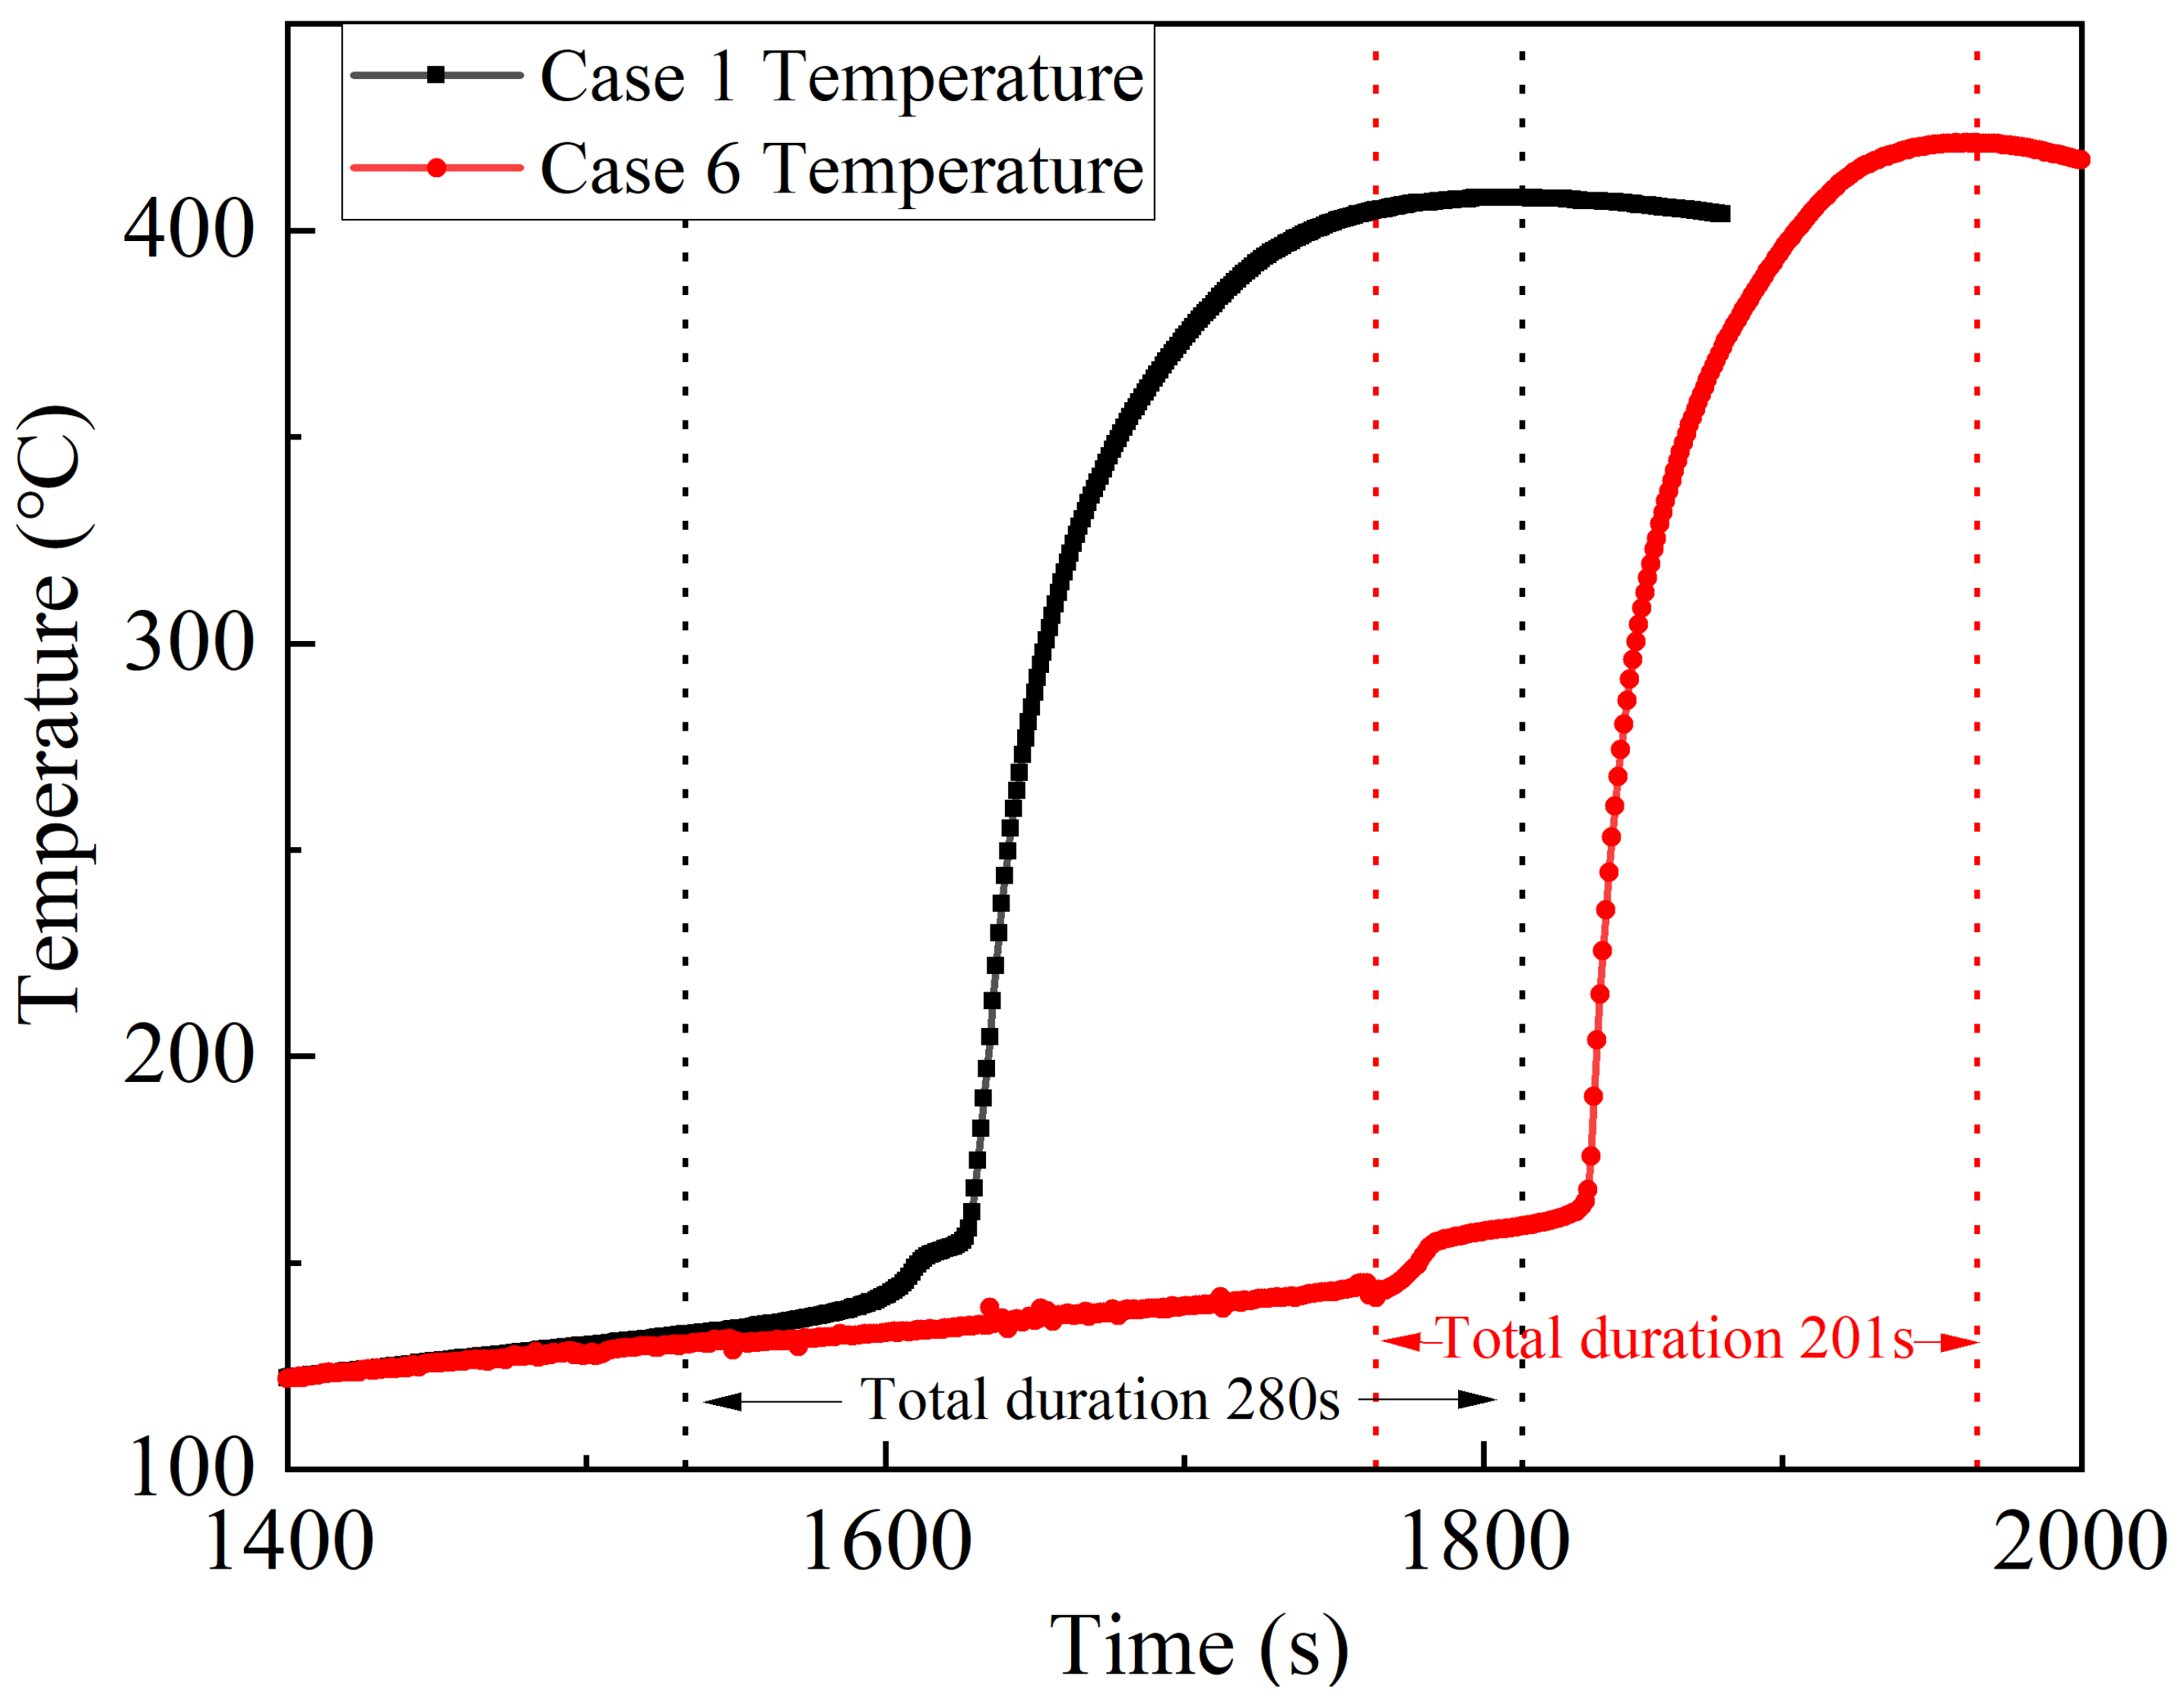
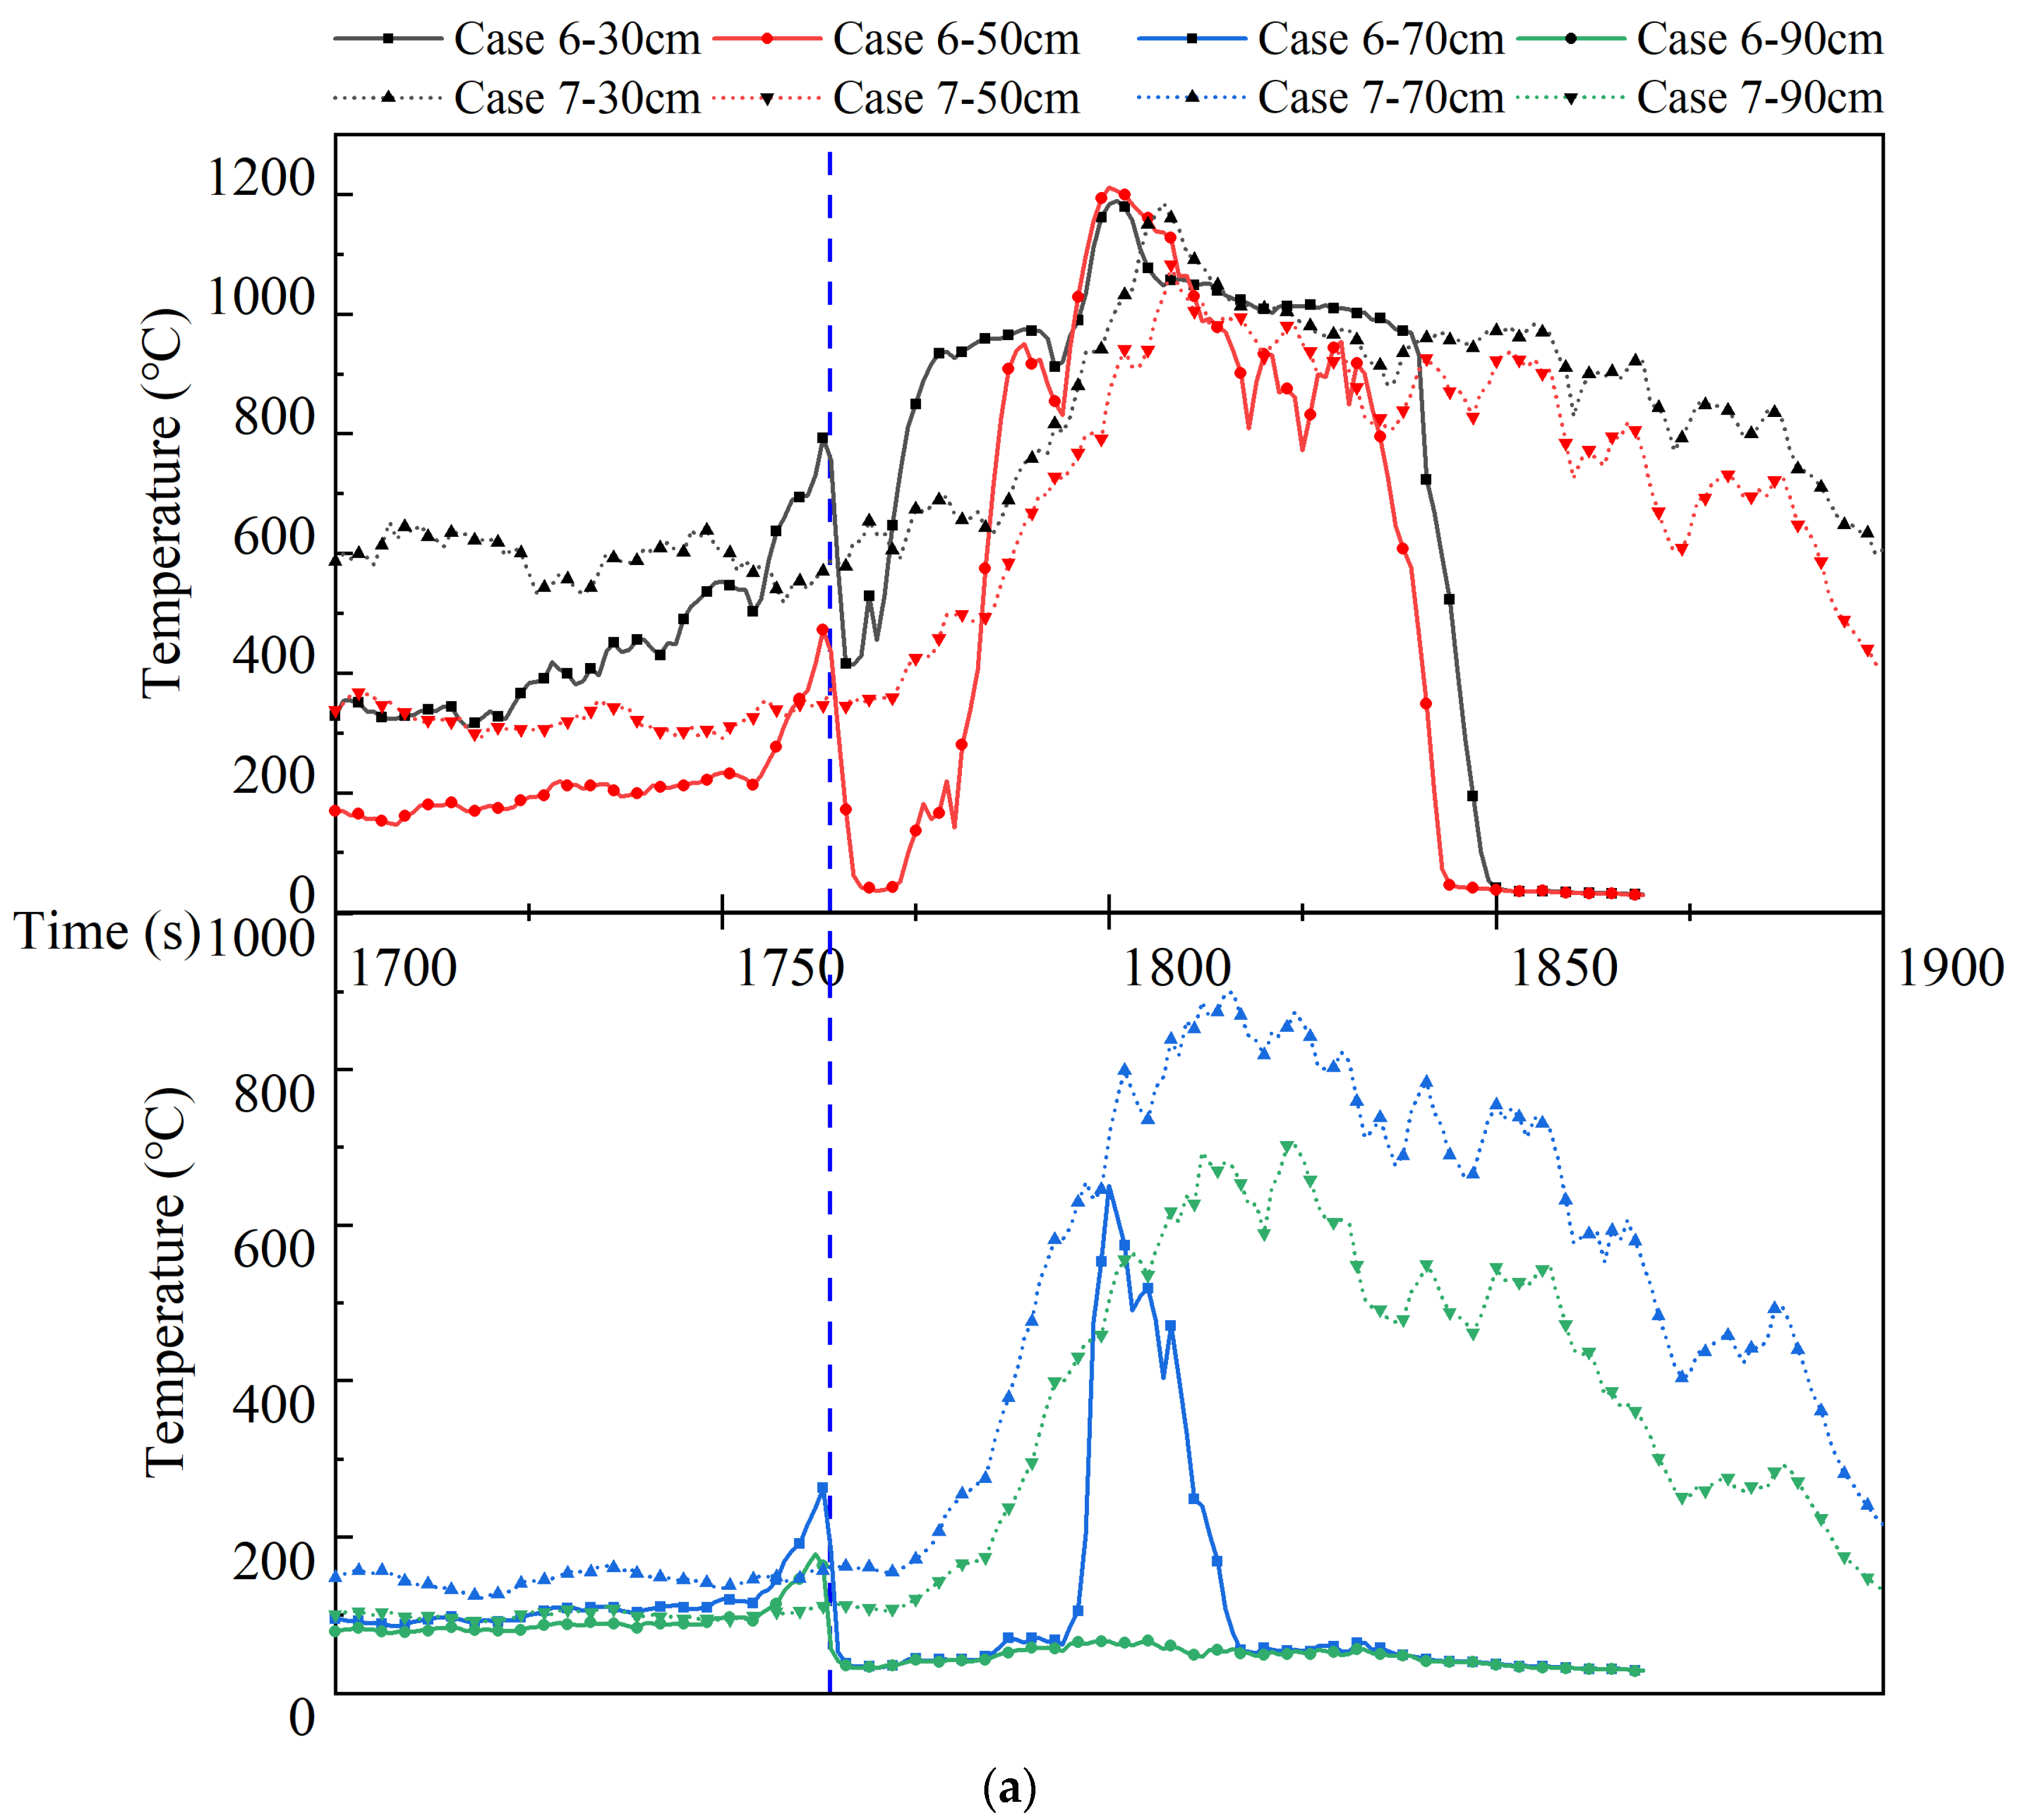
Figure 6 shows that the thermal runaway initiation time is delayed by 231 s compared to Case 1. This delay allows more heat to accumulate inside the battery, resulting in a more intense thermal runaway process and more heat being removed by the gas jet. It can be deduced from the fact that the maximum surface temperature of the thermal runaway battery increases by almost 15 °C and the average temperature of the battery safety valve increases by almost 140 °C. The duration of thermal runaway in Case 6 is nearly 80 s less than in Case 1. Since the above thermal runaway process is more intense, it could be considered that although the water mist cannot reduce the thermal runaway of the battery, it can reduce the total duration of thermal runaway, thus reducing the loss due to thermal runaway of the battery. As the cooling rate is slightly lower in the first stage of Case 6 than in Cases 2~5, and there is an obvious confrontation and delamination phenomenon between the water mist and the battery flame in the experiment, it could be inferred that this phenomenon is the reason for the slightly lower cooling rate of the water mist, which will be analysed in the following sections.
During the second stage of Case 6, the thermal runaway of the battery ceases and it no longer produces heat by itself, and at this time the water mist cooling all acts on the remaining heat of the battery. Subtracting the total
QWM of Case 6 from that of the first stage, the
QWM of the second stage is 498.0 kJ, which can be calculated as a cooling rate of 0.33 kW, and that of Case 7 is 0.34 kW. According to
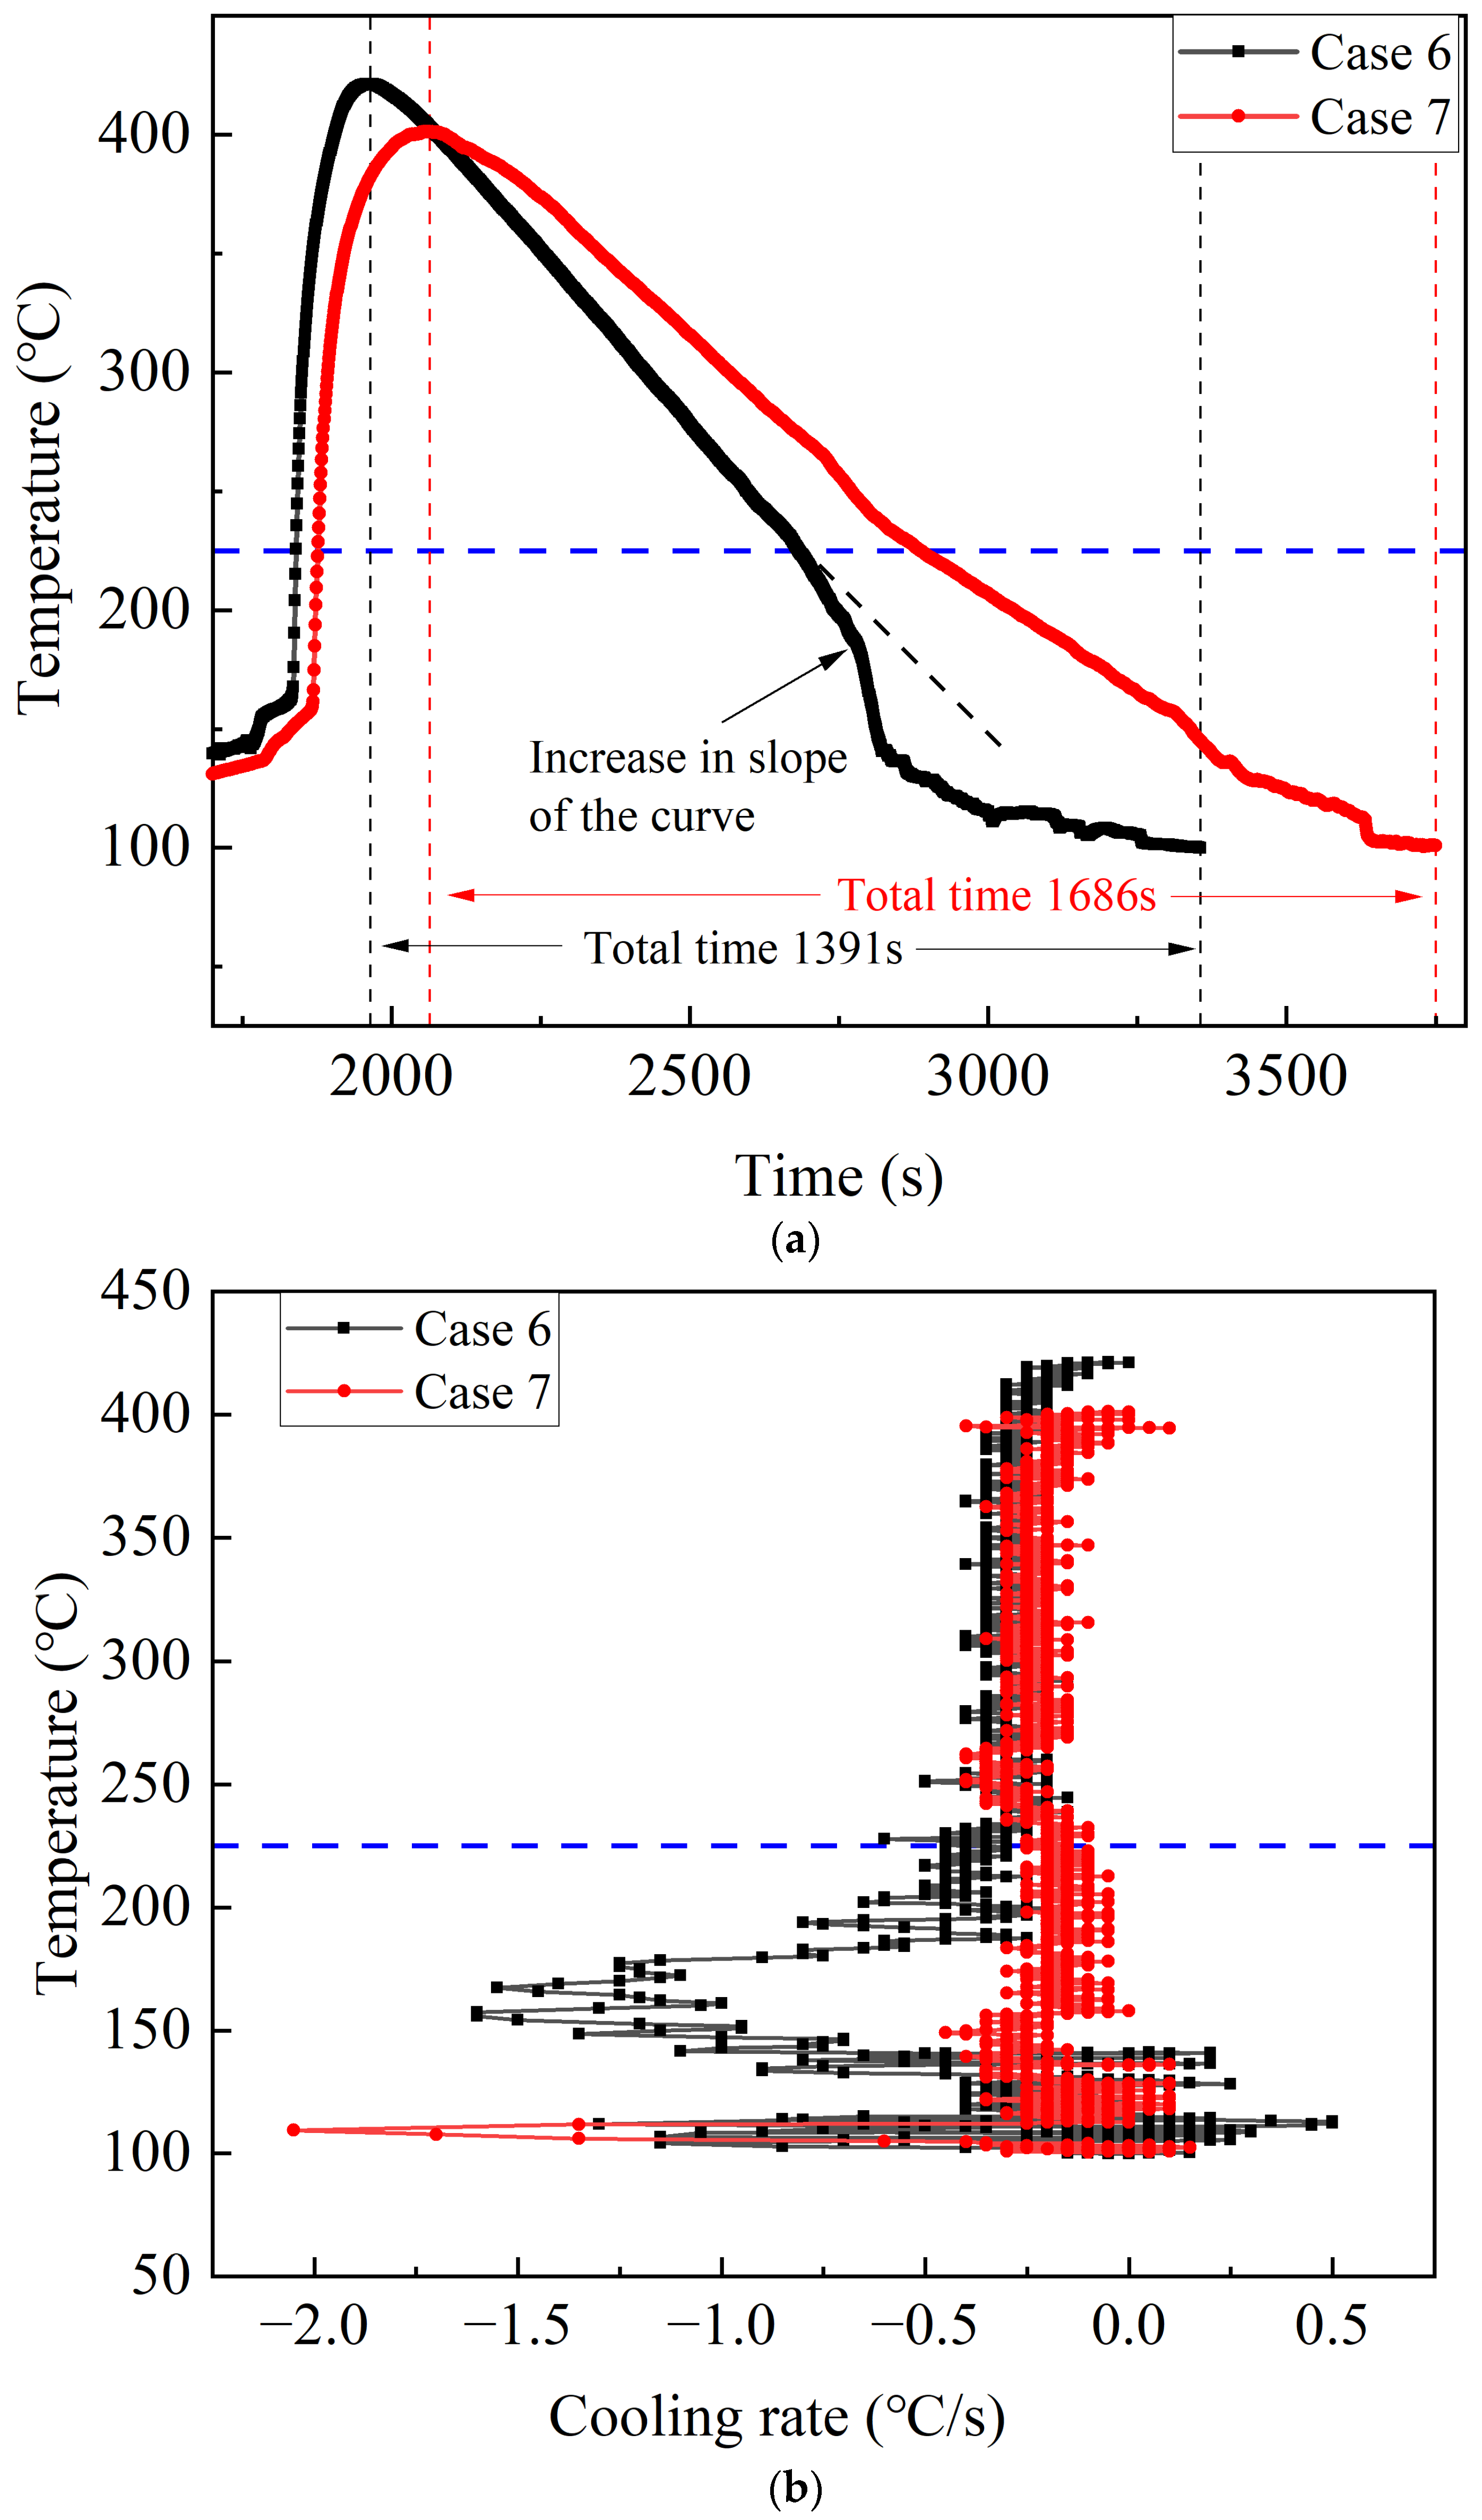
Figure 7, Case 6 has a shorter actual cooling time, and the time required to cool the battery to 100 °C is reduced by 295 s compared to Case 7. There is no significant difference between the cooling rate of Cases 6 and 7 when the battery temperature is above 225 °C; when the battery temperature drops to 225 °C, the cooling rate of Case 6 increases significantly and is much higher than that of Case 7. This is because in Case 6, water mist is released at the onset of thermal runaway, which leads to cooling throughout the entire process of the battery thermal runaway. While the violent thermal runaway cannot be suppressed, the continuous cooling can shorten the duration of the thermal runaway. Coupled with the higher cooling rate and shorter cooling time at the location shown in
Figure 7a in the second stage of Case 6, it could be inferred that when the thermal runaway ceases, the internal temperature of the battery is lower than that in Case 7. Since the internal temperature of the battery during thermal runaway is much higher than the surface, there is a certain delay when using surface temperature to judge the trend of internal temperature. The significant ‘dive’ in the battery temperature curve when the temperature decreases to 225 °C, compared to Case 7, reflects the lower internal battery temperature in Case 6.
The violent pyrolytic reaction between the electrolyte and the cathode material will generate a large amount of heat during the thermal runaway of the battery [
22]. The internal structure of the battery is irreversibly damaged when the separator melts, which directly lead to the initiation of the thermal runaway [
23]. In other words, the collapse and melting of the separator directly causes the reaction between the electrolyte and the cathode material. From
Figure 8, it is clear that the three parts of each curve can well match the three stages of the accumulative heat density increase of the thermal runaway process in lithium ion batteries: the first stage of the SEI film pyrolysis corresponds to the slowly rising part of the curve; the second stage of the separator collapse and melting corresponds to the jumping part of the curve; and the third stage of the violent reaction between the anode and cathode material corresponds to the rapidly rising part of the curve. It should be noted that the melting of the separator is a rare endothermic reaction during the thermal runaway process, which corresponds to the decline in the slope of the curve in the second stage of the process. During the process of melting, the PE separator has a heat absorption of 190 J/g, while the PP separator has a heat absorption of 90 J/g [
24]. When the separator starts to melt, the pyrolysis reactions inside the battery are intensified, so the slope of the curve at the beginning of the second stage is higher than that of the first stage. Upon the large-scale melting of the separator, the heat absorption rate increases and the slope of the curve decreases significantly until the separator is melted. The thermal runaway process could not be prevented in the second stage due to the irreversible damage to the internal structure of the battery, even if Case 6 intervened with water mist for cooling. Hence, the critical heat density accumulation of 155 kJ/kg at the initiation of the second stage is identified as the critical point to determine whether the initiation of thermal runaway can be inhibited.
In conclusion, water mist performs well in cooling and preventing thermal runaway when the battery has not initiated thermal runaway yet. When reaching the second stage of thermal runaway process, the battery separator starts to melt, then the application of water mist could not be able to inhibit the occurrence of thermal runaway, but it can reduce the duration of thermal runaway and the cooling time required after it happens, thus reducing the loss caused by thermal runaway of the battery.
3.2. Analysis of Water Mist against Thermal Runaway Flames
During thermal runaway, the active materials inside the lithium-ion battery will undergo a violent pyrolysis reaction. During the material pyrolysis process, a certain amount of H
2, CO, CO
2 and hydrocarbon gases are generated, of which H
2 accounts for more than 99% [
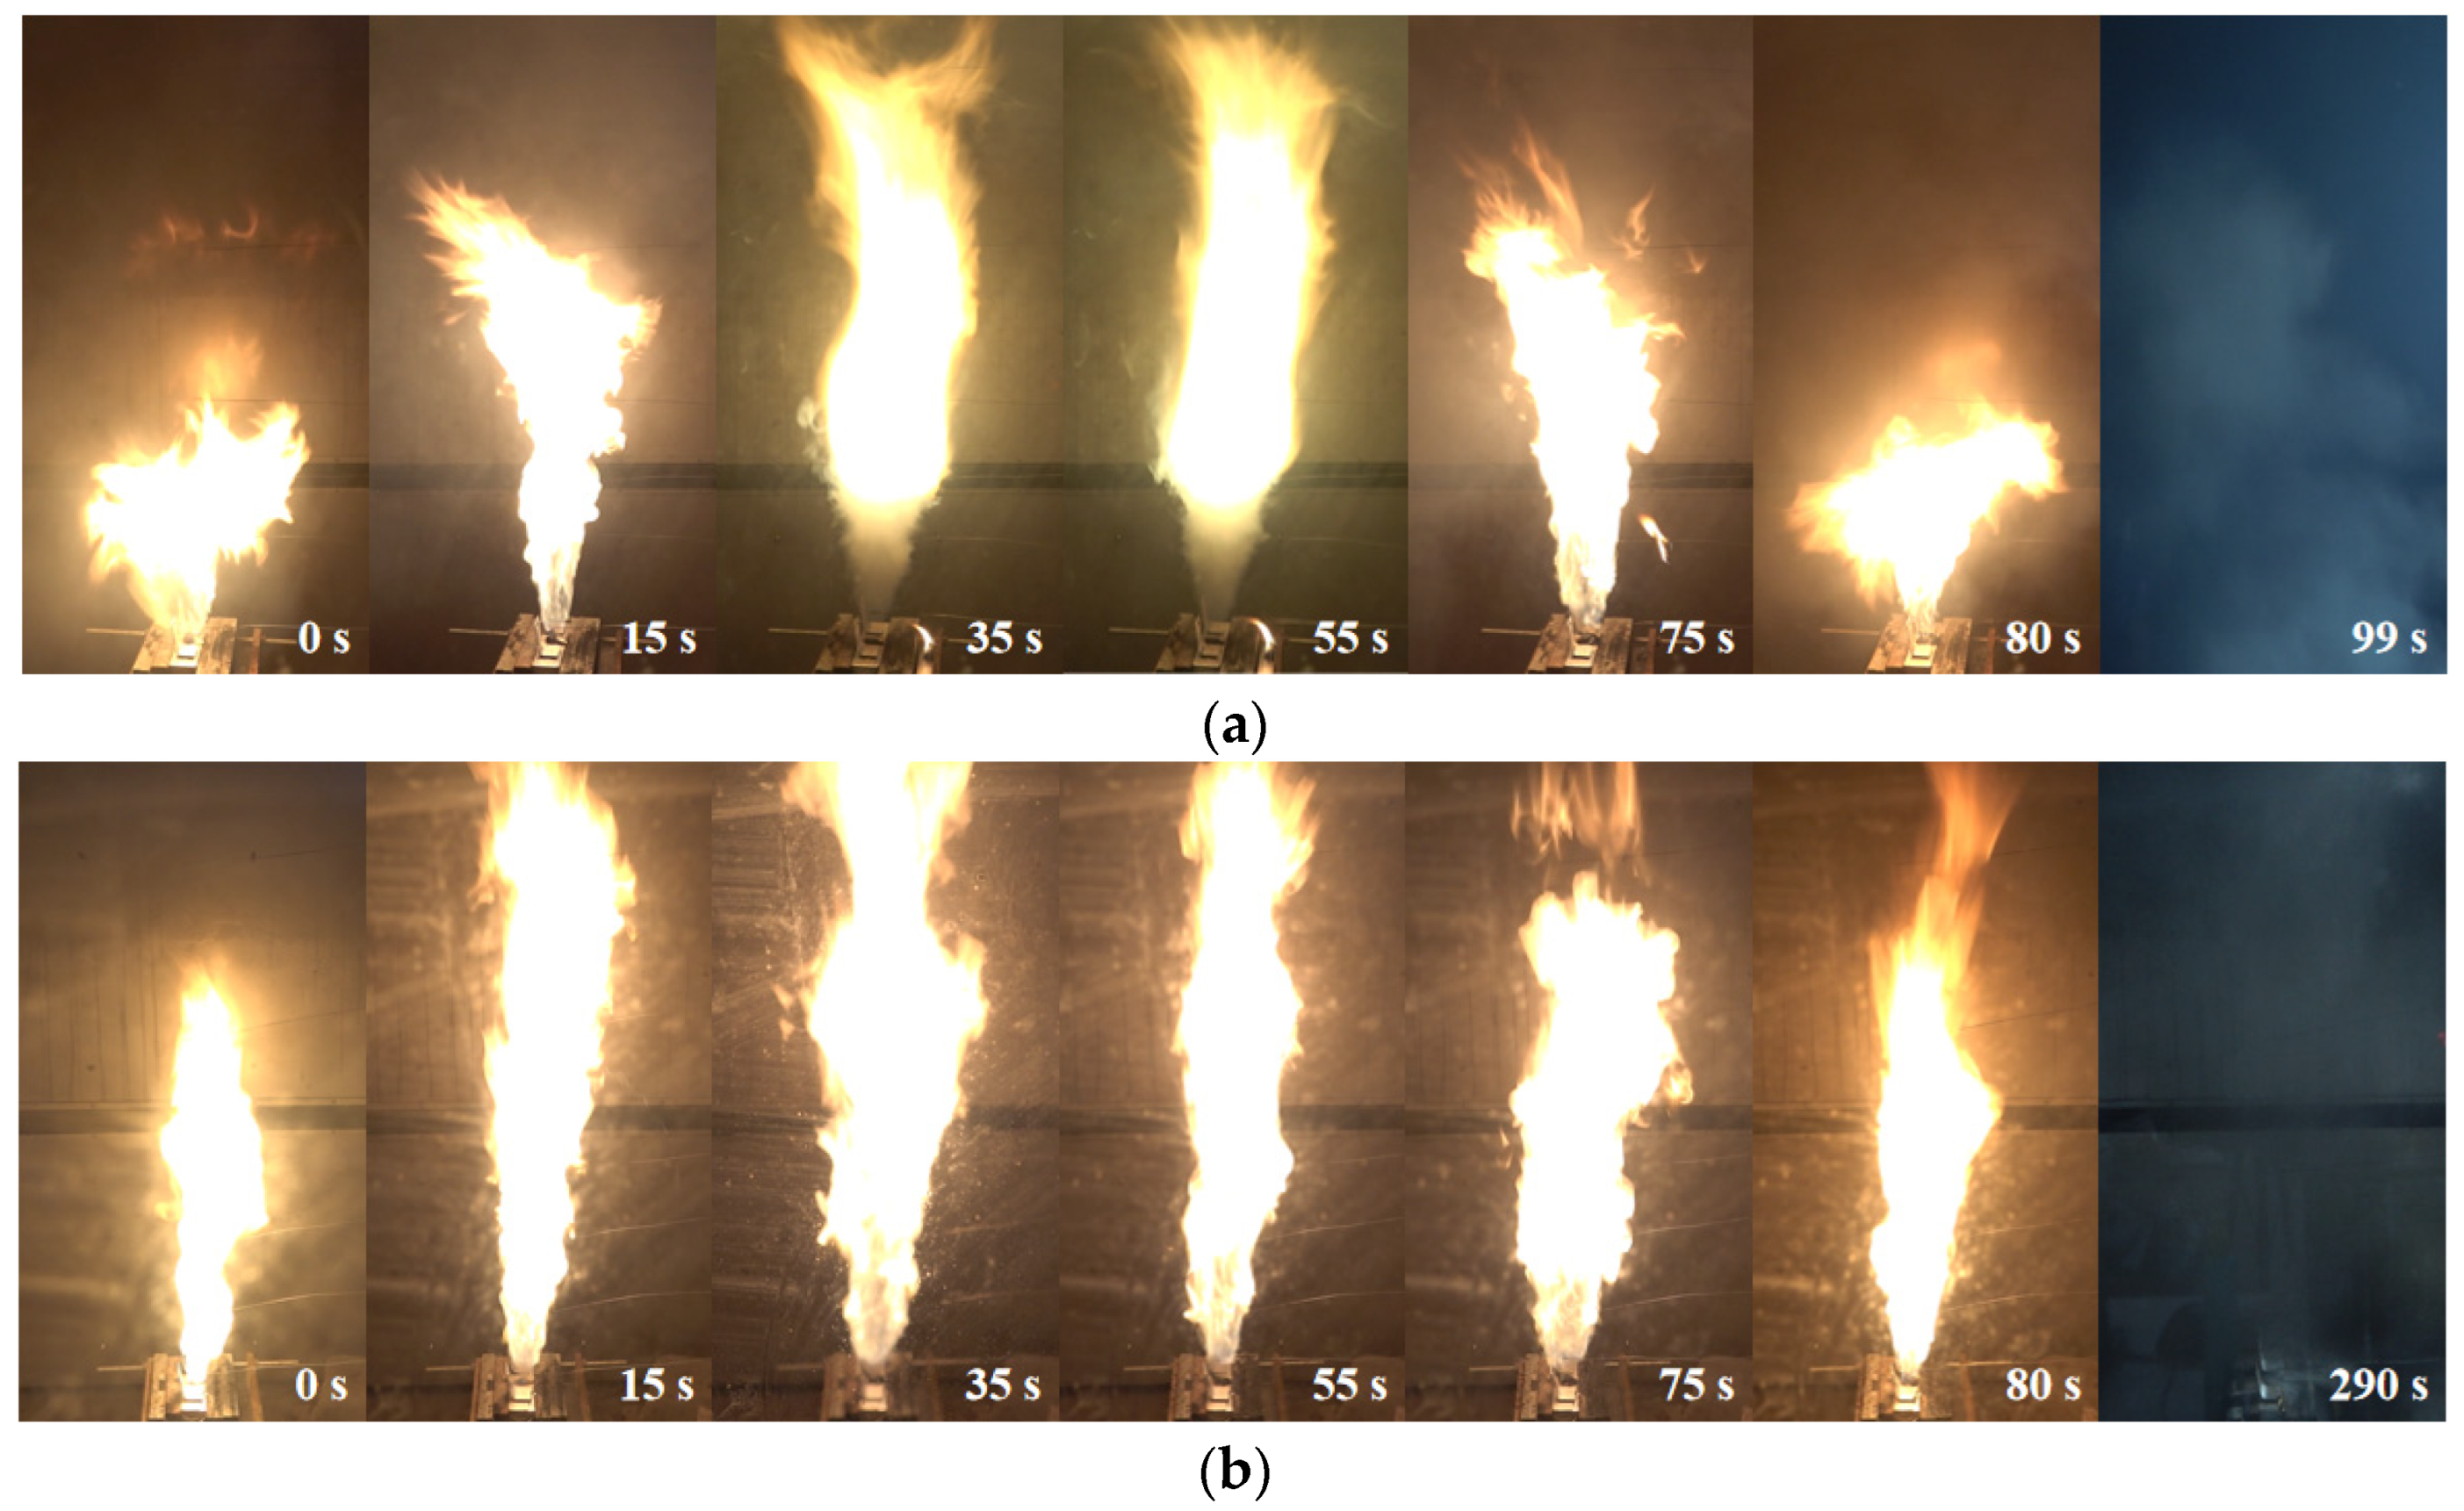
25], and the electrolyte is evaporated rapidly due to the considerable heat generated from the battery. During thermal runaway, a large amount of high-temperature greyish-white smoke is ejected from the safety valve at a high speed, and sometimes the battery flame extinguishes because the smoke is ejected too fast and mixes unevenly with the air. After the thermal runaway is initiated, a turbulent flame is formed above the safety valve. When applying water mist during this time, an obvious confrontation phenomenon between the water mist and the flame can be observed. This means the water droplets are unable to fall on the battery surface normally, which causes a reduction in cooling efficiency.
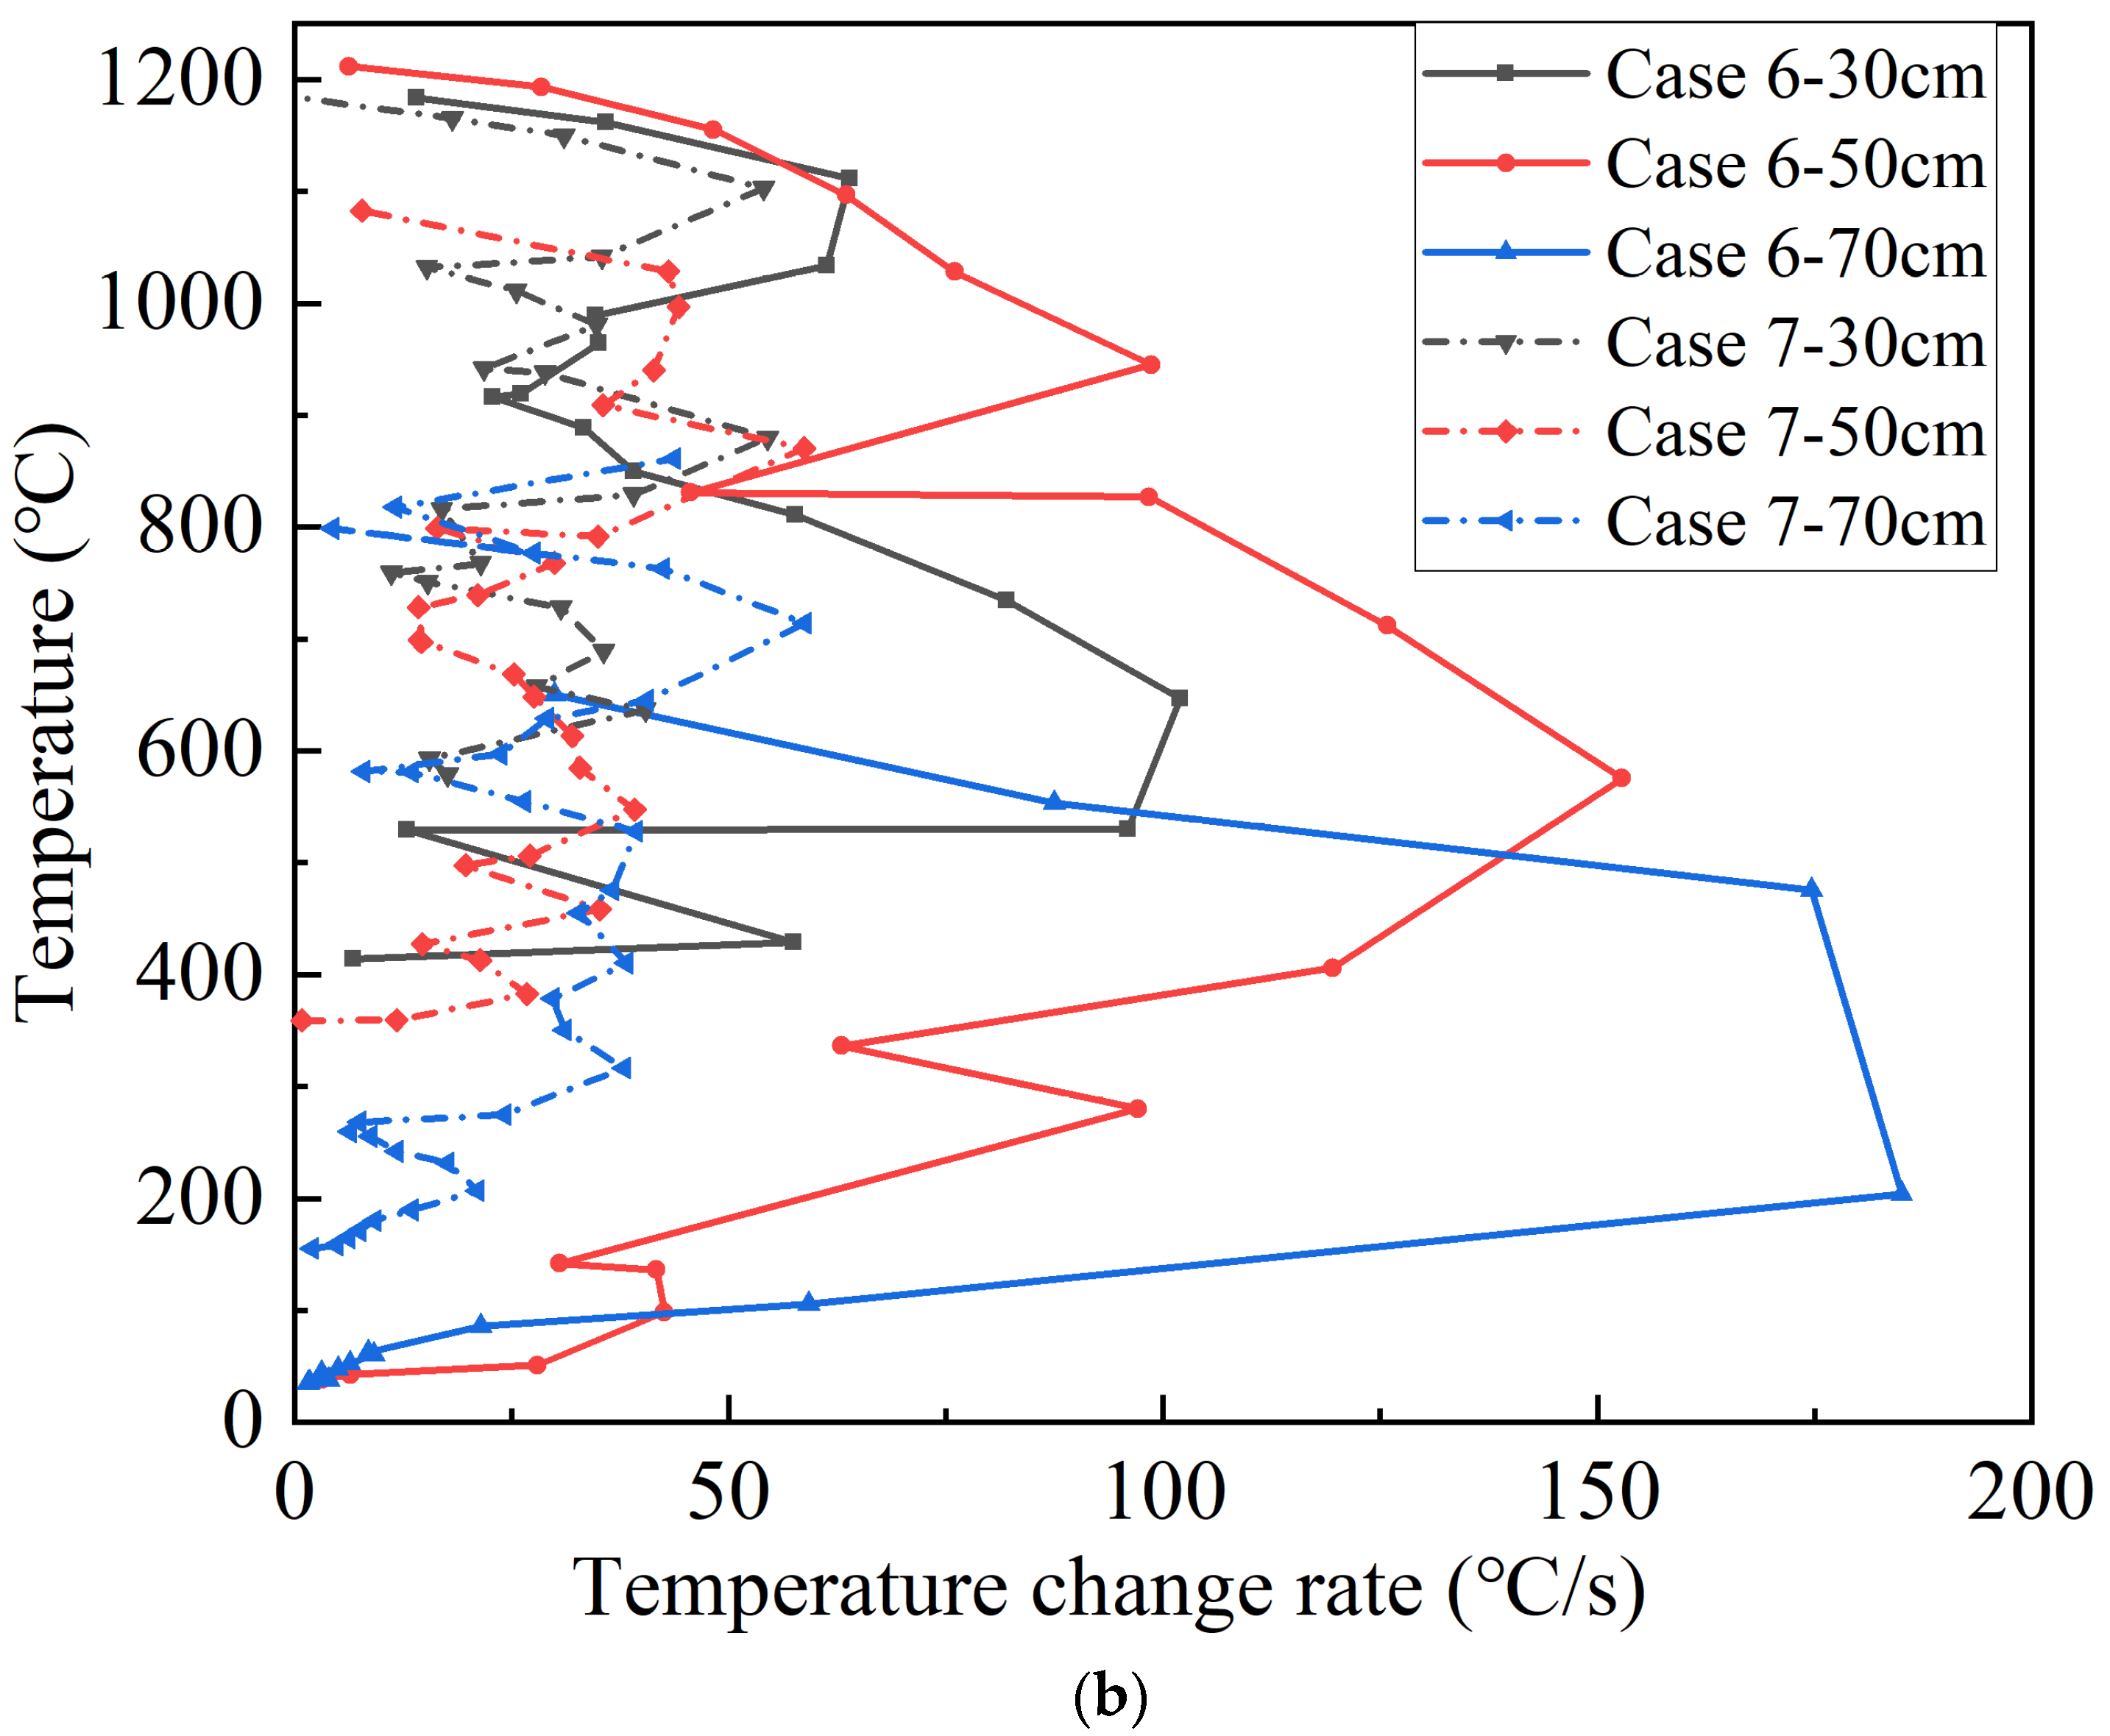
Figure 9 depicts the flame temperature and the change rate curve above the safety valve in Cases 6 and 7 during thermal runaway, of which the upper half of
Figure 9a shows the temperature curve at the slightly higher flame temperature in Case 6 and the lower half the temperature curve at the slightly lower flame temperature, and the dotted line is the time of water mist release in Case 6. Upon the release of water mist, the temperature at 30 cm and 50 cm above the safety valve in Case 6 decreases rapidly, and the temperature increases rapidly with the intensifying combustion and is higher than that in Case 7; the temperature at 70 cm above the safety valve also shows a tendency to decrease followed by a rapid increase, but the temperature here is lower than that in Case 7; the temperature at 90 cm above the safety valve decreases rapidly and remains stable. It happens because when the thermal runaway is initiated, the gas ejection speed of the safety valve gradually increases, and the water mist gradually becomes unable to suppress the turbulent flame ejected at a high speed, and the flame height gradually increases. The pressure of water mist compresses the top of the flame, and the heat carried by the flame is also compressed below the distortion region, and the temperature of the flame in this region is also higher due to the heat storage; the distortion region of the flame is affected by the cooling of water mist, and the overall temperature is lower than that of the non-extinguishing case, although the temperature increases faster in the development of thermal runaway; the temperature in the flame distortion region is maintained at a lower level due to the continuous cooling of water mist. It could therefore be determined that the flame distortion region is the region where the water mist confronts with the thermal runaway flame. The temperature is stable at a lower level above this region, and fluctuates greatly due to the flame fluctuation and the confrontation in this region. Compared to the non-extinguishing case, in this region the temperature is lower. However, in the immediate vicinity below this region, the temperature is higher and flame is more intense [
26].
Figure 9b shows the variation curves of the temperature rise rate in the flame rise stage after the release of water mist, and the temperature rise rate is higher at 30 cm, 50 cm and 70 cm above the safety valve in Case 6. It is noted that for Case 6, although there is no high temperature section, the temperature rise rate is higher in the low temperature section at 70 cm, and both the temperature and the temperature rise rate are higher at 50 cm. The impact of water mist on flames can be divided into two main parts: one is to cool the heat at the top of the flame, suppressing the high temperature in the confrontation region; the other is to compress a proportion of the heat in the confrontation region, increasing the rate of temperature rise in the low-temperature region and the temperature as well as the rate of temperature rise in the adjacent regions below. Assuming that the batteries have the same rate of jet heat production at the same height and at the same moment of thermal runaway, the rate of heat change in the confrontation region and the adjacent region below is shown in Equations (9) and (10):
where
and
are the rate of heat change in the confrontation region and the adjacent region below, respectively;
is the rate of heat production in each region;
is the rate of cooling by the water mist;
is the rate of heat change compressed by the water mist.
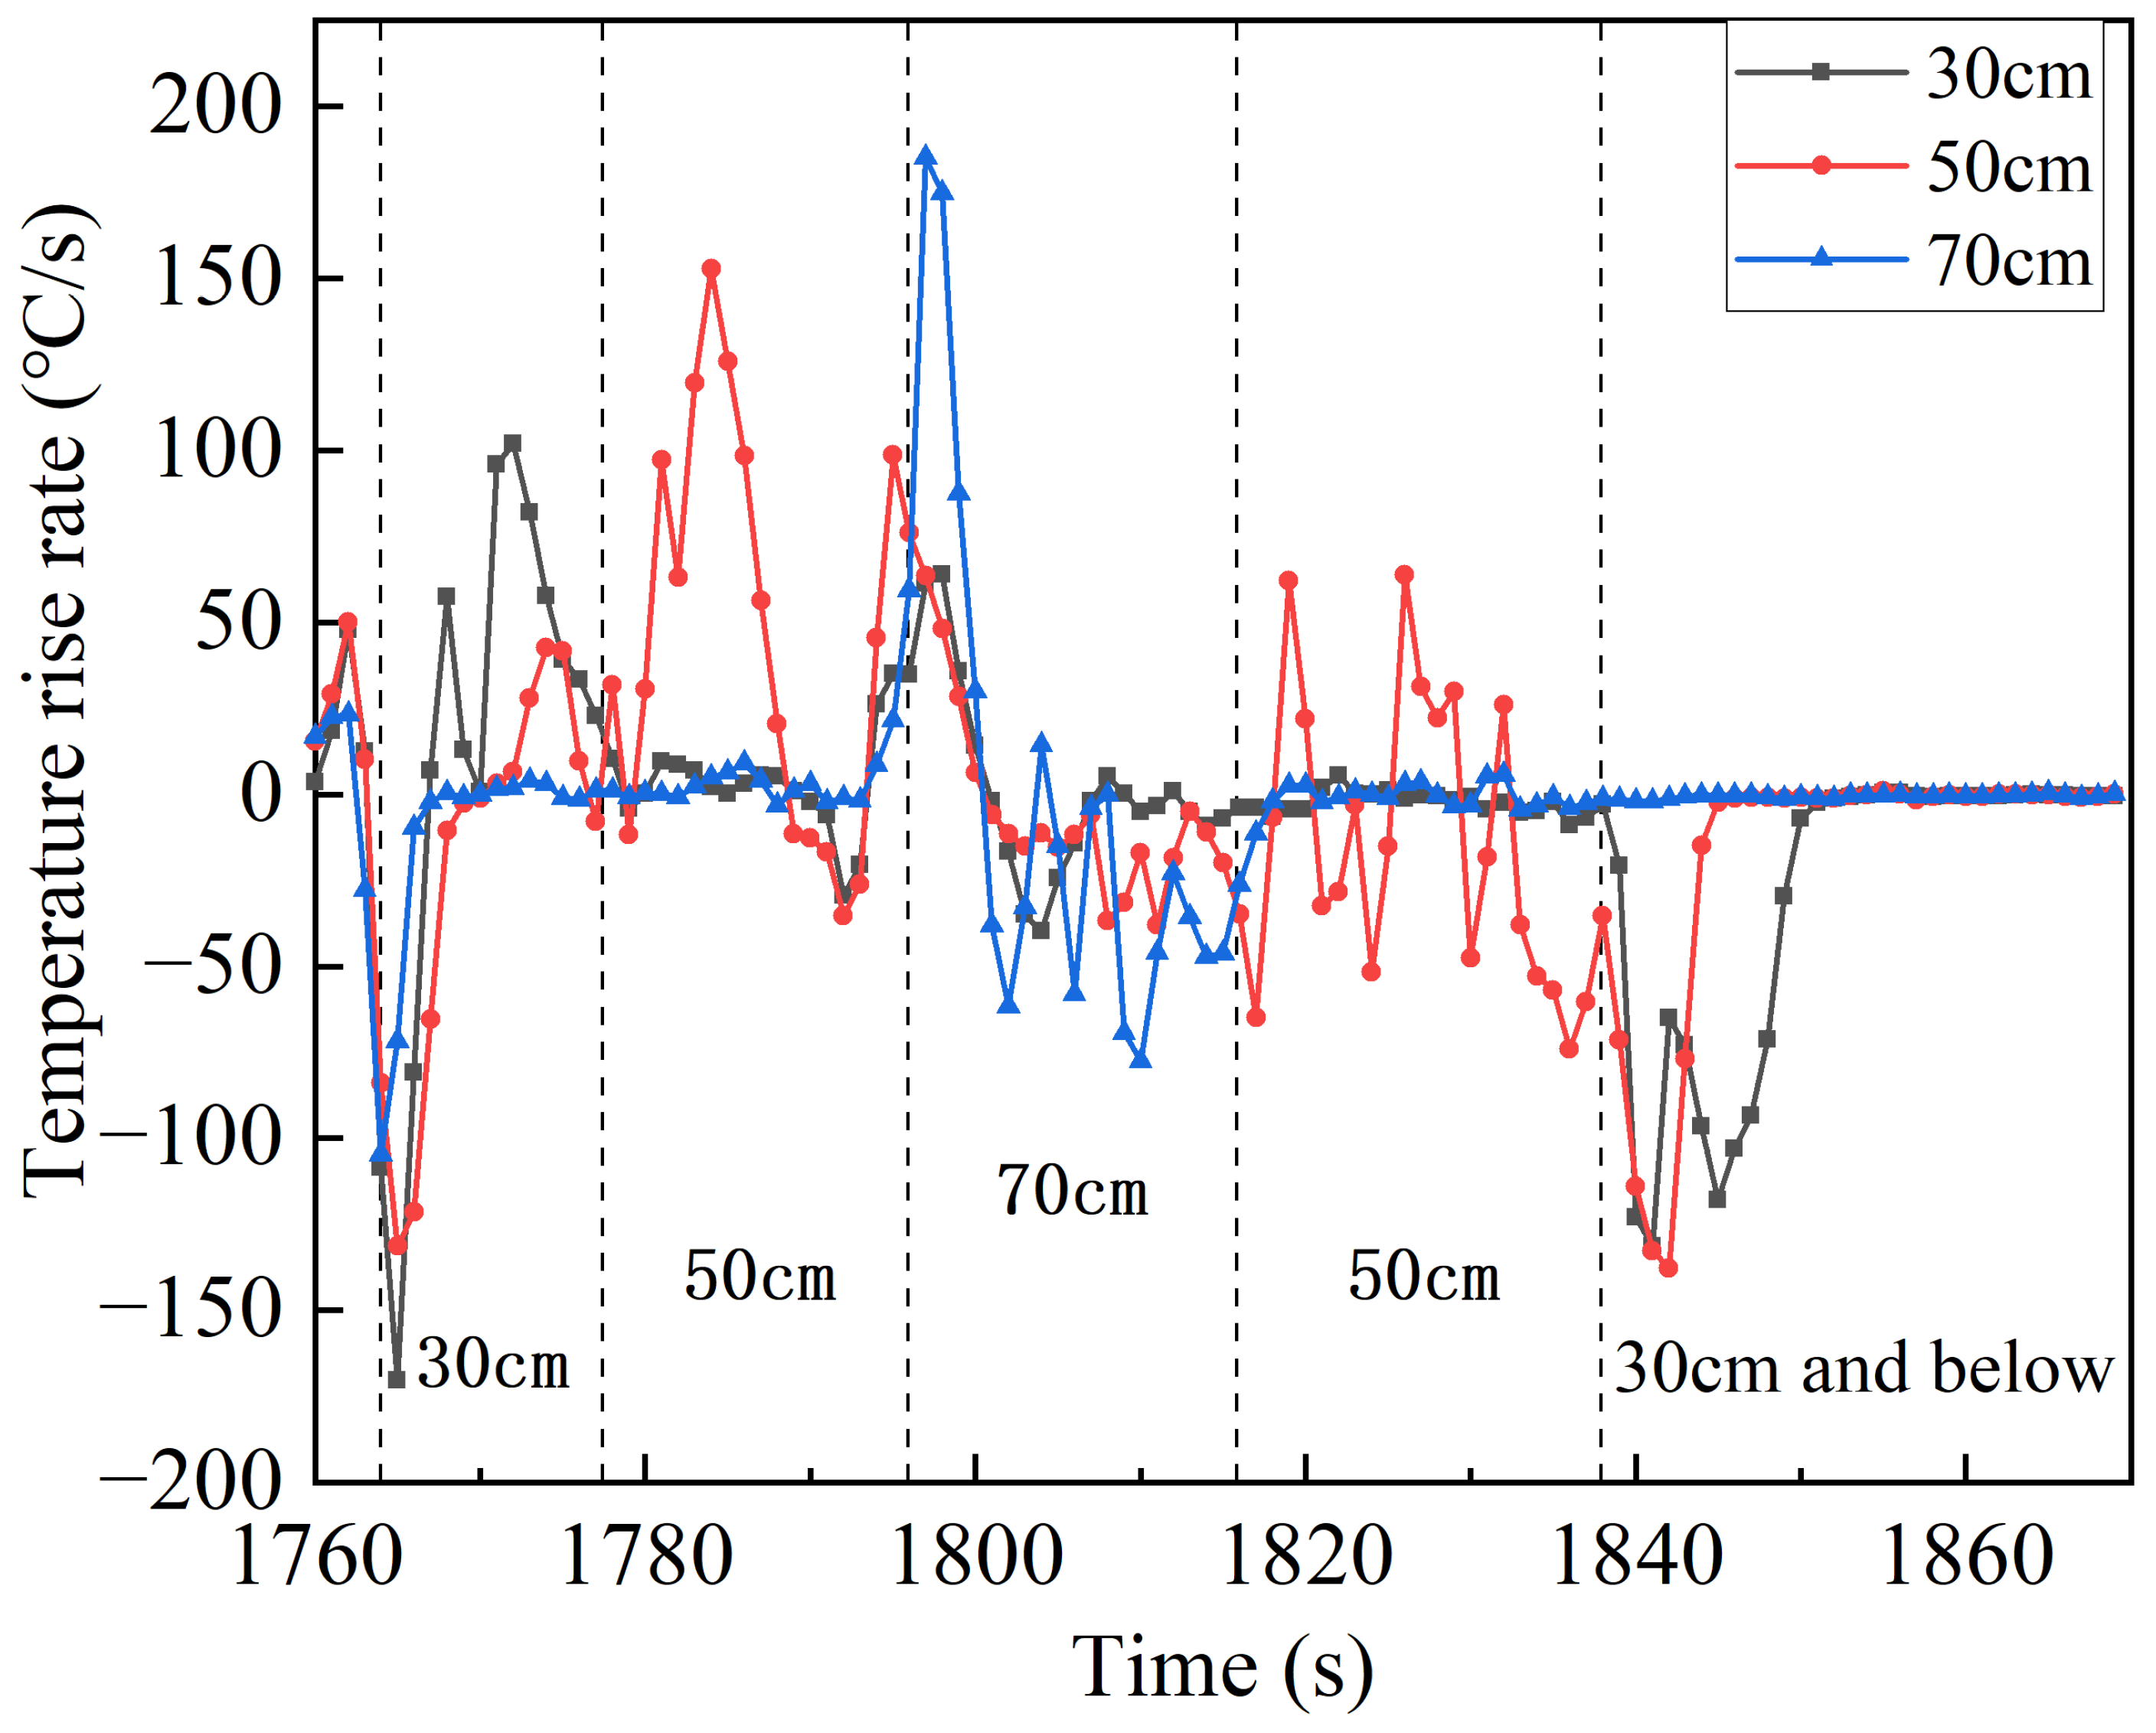
The region with the highest flame fluctuation is identified as the confrontation region between the water mist and the thermal runaway flame. This region shows the highest fluctuation of the temperature rise rate in each period. The temperature increase rate curves at different points above the safety valve for Case 6 are shown in
Figure 10. It is evident that the confrontation region initially rises and then decreases during the thermal runaway process. When the water mist is released, the confrontation region is at 30 cm above the safety valve, and it subsequently rises to 50 cm and 70 cm after 15 s and 35 s, respectively. Around 20 s later, the confrontation region gradually drops to 50 cm and stabilizes below 30 cm after 25 s, and the flame is extinguished after 44 s. During the development of thermal runaway, the height of the confrontation region tends to rise slowly from 30 cm to a maximum of 70 cm, then falls back and stabilizes for a long time at 50 cm, and finally falls more rapidly until the flame is extinguished. The reason for it is, in the thermal runaway process, the reaction rate inside the battery quickly reaches its peak and remains stable, and after a while the internal active material decreases so that the reaction rate decreases faster. The confrontation region in this case remains at 50 cm for most of the time, accounting for 40.4%. The flame morphology illustrated in
Figure 11 is affected the most by the confrontation: at this stage, the safety valve gas jet speed increases, so that the upward force generated by the flame jet increases, and gradually matches the downward force of the water mist. As the gas pressure decreases with increasing height, the flame flow rate is high at the bottom and low at the top, the flame width is small at the bottom and large at the top, and the flame morphology is also “conical”. At a distance of 30 cm, the jet speed of the safety valve is too low, so that the flame cannot fight against water mist, and the flame morphology is shown as “stacked”; at a distance of 70 cm, on the other hand, the jet speed of the flame is too high, so that the water mist can only suppress a small region at the top of the flame, and the flame morphology is shown as “T-shaped”. Compared with Case 7, the water mist primarily affects the flame morphology in other periods, except when the thermal runaway reaches the peak: before the thermal runaway reaches the peak, the flame height could be compressed to a certain extent; after the thermal runaway reaches the attenuation period, the flame height could be compressed and the flame extinguishing could be accelerated.
According to the heat calculation table in Chapter 3.1, the heat removed from the battery by the water mist in Cases 6 and 7 is 580.3 kJ and 592.1 kJ, respectively, and the heat remaining in the battery at the end of the thermal runaway in the two cases is 756.2 kJ and 880.4 kJ, respectively. Assuming that the total heat production during thermal runaway is the same in the two cases, the difference in the remaining heat at the end of thermal runaway is 124.2 kJ, which is the cooling amount of water mist during the thermal runaway period, so the total cooling amount of water mist in Case 6 could be divided into two parts, 124.2 kJ during the thermal runaway period and 456.1 kJ after the thermal runaway. It indicates that during thermal runaway, the cooling amount of water mist accounted for 21.4% of the total cooling, and the cooling rates of the two parts are 0.57 kW and 0.33 kW, respectively. In Case 6, the cooling duration in thermal runaway accounts for only 13.5% of the total cooling, and the cooling duration after the end of thermal runaway is 295 s shorter than that in Case 7. This suggests that while the long release distance challenges the water mist in its ability to fight against the thermal runaway flame, and the water droplets could not normally fall on the battery surface and inhibit the development of thermal runaway, it could still maintain a better cooling effect and reduce the damage of thermal runaway and the difficulty of subsequent cooling.


