Article

Crystallization of Intermetallic Phases Fe2Si, Fe5Si3 for High Alloyed Cast Irons

Department of Foundry Engineering, Faculty of Mechanical Engineering, Silesian University of Technology, 7 Towarowa Street, 44-100 Gliwice, Poland
Crystals 2023, 13(7), 1033; https://doi.org/10.3390/cryst13071033
Submission received: 29 May 2023 / Revised: 23 June 2023 / Accepted: 26 June 2023 / Published: 29 June 2023
(This article belongs to the Special Issue Microstructure and Properties of Intermetallic Alloys)

Abstract

:
This paper presents the results of laboratory tests related to high-alloy silicon cast iron (HSCI). These materials are corrosion-resistant and commonly used in cathodic protection systems as protective electrodes. Due to their high fragility, alloys with increased Si content are not suitable for producing elements exposed to dynamic loads. This paper analyzes the crystallization process of silicon alloys (with Si content between 23% and 25%) using thermal and derivation analysis methods. The tests also included an extended analysis of chemical composition. The metallographic tests included scanning electron microscopy with an EDS system, and the phase composition was determined using X-ray diffraction. As a result of the tests, the warp components were identified, the primary share of which are intermetallic phases of the Fe5Si3 type. Moreover, single silicon crystals were found. The test results allowed for clarification of the temperature range of the transition of the Fe2Si phase into the Fe5Si3 phase and the determination of characteristic points of the crystallization process (TSolidus i TLiquidus). Furthermore, bifilm-type inclusions were identified in the alloys. We also managed to present the silicon crystals and Fe5Si3 phases in a spatial layout via observation of the surfaces of contraction cavities using scanning electron microscopy.

1. Introduction

In accordance with the description included in the paper [1] by J. Campbell, cast iron belongs to the group of multi-component technical iron and carbon alloys. To differentiate it from steel or steel casting, it is defined as a cast alloy with a carbon content that ensures solidification of the end liquid phase at eutectic temperature, and this content amounts to at least 2.08% in the case of a double Fe–C alloy. Cast iron may change the carbon content to a high extent due to the fact that it contains other elements (Mn, P, and S) and elements that are treated as alloys (Ni, Cr, and Cu).
Alloying elements [2,3,4,5,6,7] added to cast iron, apart from impacting the carbon content, also cause the creation of phases [1,8] in the microstructure of the alloy, providing it with special properties that allow applying the analyzed alloy in specific work conditions [9,10,11,12].
The cast iron alloy, which includes silicon as the main alloying element (high silicon cast iron, HSCI), is characterized by a low carbon content in its chemical composition. Despite the fact that the alloy contains carbon in the amount of approx. 1%, it is considered to be cast iron as it crystallizes in the eutectic range [1].
The first cast made of high silicon cast iron was used in the chemical industry by A. Jouvé in 1907. This was a groundbreaking achievement since stainless steels were unknown back then (stainless steel was patented in 1912 by Krupp’s German engineers). The patent is related to austenitic steel, duplex stainless steel [13], and super-austenitic steel [14]. Nickel and nickel–molybdenum alloys were also unknown at this time. Due to its low price and very good chemical resistance (especially to sulfuric acid), cast iron with a silicon content in the range of 14–17% remained unrivaled on the market for a long time.
Currently, the application of HSCI is limited to corrosion-resistant elements. It also shows abrasion resistance. However, its most prominent advantage is its high resistance to the corrosive effects of many acids (sulfuric and nitrogen) and solutions of copper and chlorine [15]. High silicon cast iron is used to produce electrodes for cathodic protection systems [16,17].
The silicon content in alloys with iron, carbon, or other elements divides technically useful alloys into two basic groups. The first is cast iron with a maximum silicon content of 6% (SiMo), while the second is cast iron with a silicon content exceeding 14.5% [18]. In the range of 6–14% Si, the obtained quality parameters of the alloy in technical applications are not particularly good [18].
In the case of the analyzed grades of HSCI cast iron (Si content above 20%), we deal with many components of the microstructure: graphite, silicon ferrite, intermetallic phases, and bifilm inclusions [19,20,21,22,23]. The iron–silicon phase balance system is well known [24]. Intermetallic phases of iron and silicon have numerous applications [25,26,27]. Those phases impact the properties of casting alloys. Therefore, the process of crystallization of those phases for specific chemical compositions must be described based on experimental methods.
The purpose of this work is to describe the crystallization process of cast iron with increased silicon content. The main emphasis was placed on the crystallization process of intermetallic phases, whose share in the analyzed alloys is significant.

2. Materials and Methods

The tests were conducted in laboratory conditions. Two-stage metallurgical processing of liquid metal was used [15]. The tests were carried out using a medium-frequency induction furnace (PI25, ELKON LLC, Rybnik, Poland). The working capacity of the induction furnace is 25 kg. Steel scrap with low sulfur content was used as a feedstock. The chemical composition of the steel scrap is presented in Table 1.
The remaining components added during melting included ferrosilicon FeSi75 and synthetic graphite with a carbon content above 99.35%. The steel scrap was prepared appropriately for each melting. Before the weighing process, the steel scrap was cleaned of oxides and other impurities. Then, it was dried at 250 °C for 2 h inside a resistance furnace (DW40, Mario Di Maio SpA, 11-20122 Milano, Italy). For each melt, the measured portion of ferrosilicon FeSi75 was annealed at 650 °C for 2 h in a resistance chamber furnace (Curing Furnace F-120, Mario Di Maio SpA, 11-20122 Milano, Italy). Another stage included initial melting, which consisted of a melt of steel scrap with added graphite carburizer and ferrosilicon. After removing the slug, the prepared and melted material was poured into a steel casting mold. The material prepared this way was used in the proper melt in the next step. Double melting was conducted to eliminate gas dissolved in the liquid alloy [15]. During the initial melting, samples for carbon content analysis were collected. The planned carbon content was 0.5%. The second melting stage consisted of melting a previously prepared charge in an induction furnace and correcting the carbon content. During the melting of the charge, the metal bath was degassed. This method was based on overheating liquid metal to 1400 °C, followed by a gradual reduction in the temperature in the furnace to approx. 1200 °C to remove gases from the bath [15]. After the liquid alloy reached a temperature of 1200 °C, it was heated to approx. 1350 °C. Then, the liquid metal was poured into a ladle, the bottom of which was covered with FeTi67 foundry alloy to degas the metal bath [15].
The TDA analysis was carried out using Crystaldigraph M24 (Z-TECH, Gliwice, Poland) and testers made by Electronite with PtRh10-Pt, S type thermoelement. A signal from the Crystaldigraph M24 multi-channel transducer was sent using a RS323 connector to a mobile computer with appropriate software (TDAnalyzer_v12.1 from Z-TECH, Gliwice, Poland). Based on the registered temperature changes over time, the first temperature derivative was calculated after some time. It allows for the precise determination of characteristic transitions for the analyzed alloys. This is associated with the emergence of thermal effects due to the crystallization of particular phases in the alloy during analysis. Due to the use of a prototype analog-to-digital converter for temperature recording, the measurement error cannot be unequivocally calculated. Considering all factors related to the measurement procedure and previous experience, the measurement error was estimated at 0.015%.
The analysis of the chemical composition of the obtained samples was conducted using a Leco GDS 500 spectrometer (Model No. 607-500, Leco Corporation, 3000 Lakeview Ave., St. Joseph, MI, USA) and a CS125 carbon–sulfur analyzer (Leco Corporation, 3000 Lakeview Ave., St. Joseph, MI, USA). Due to the high silicon content in the analyzed alloys, it was decided to carry out an additional analysis of the Si content based on the weighing method, which was performed in the Chemical Analysis Laboratory of the Welding Technology Institute in Gliwice. The collective results of the chemical composition analysis are presented in Table 2.
The metallographic tests were performed using scanning electron microscopy. Phenom Pro-X scanning electron microscopy and the EDS system were used (Phenom-World B.V., Eindhoven, Netherlands). Nonetched microsections and sample fractures were used in the tests. X-ray diffraction using an X-ray diffractometer was carried out in order to determine the phase composition. The tests were executed on a Panalytical X’Pert PRO X-ray diffractometer (Almelo, The Netherlands) with radiation filtration from a lamp with a cobalt anode and a PIXcel 3D detector on the deflected beam axis. The measurement was carried out using a stepwise method. Measurement parameters included: angle range: from 20 to 120 degrees; 2 theta step: 0.026 degrees; scanning time, step: 100 s; average “K alpha” wavelength for a cobalt lamp: 1.7909 A (0.179 nm).
In order to determine the theoretical phase composition of the tested cast iron in the balanced state, calculations were carried out using Thermo-Calc version 2003 software.

3. Results

3.1. TDA Analysis

The tests were carried out in accordance with the procedure presented in the previous chapter. The cool-down curves were registered, and the crystallization curves were determined (TDA). In the TDA graph presented in Figure 1a (for HSCI 23 alloy), we can observe a thermal effect indicating the liquidus temperature at 1220 °C. The solidus temperature for the tested alloy was determined at 1158 °C. In the temperature range of 1095–978 °C, we observe a thermal effect due to the transition of the Fe2Si phase into the Fe5Si3 phase.
Figure 1b shows the TDA analysis graph for the HSCI 25 alloy. The graph shows the liquidus temperature, which is 1291 °C. This value matches the phase balance graph for the Fe–Si system. The solidus temperature for the tested alloy was determined at 1126 °C. In the temperature range of 1109–987 °C, we observe a thermal effect due to the transition of the Fe2Si phase into the Fe5Si3 phase. Based on the presented crystallization curves, we may precisely indicate the time and temperature range of phase transitions. Due to the main purpose of the paper, which focuses on the intermetallic phase area, it may be stated that the thermal effect due to crystallization of the Fe5Si3 phase occurs in the solid state.

3.2. XRD Analysis

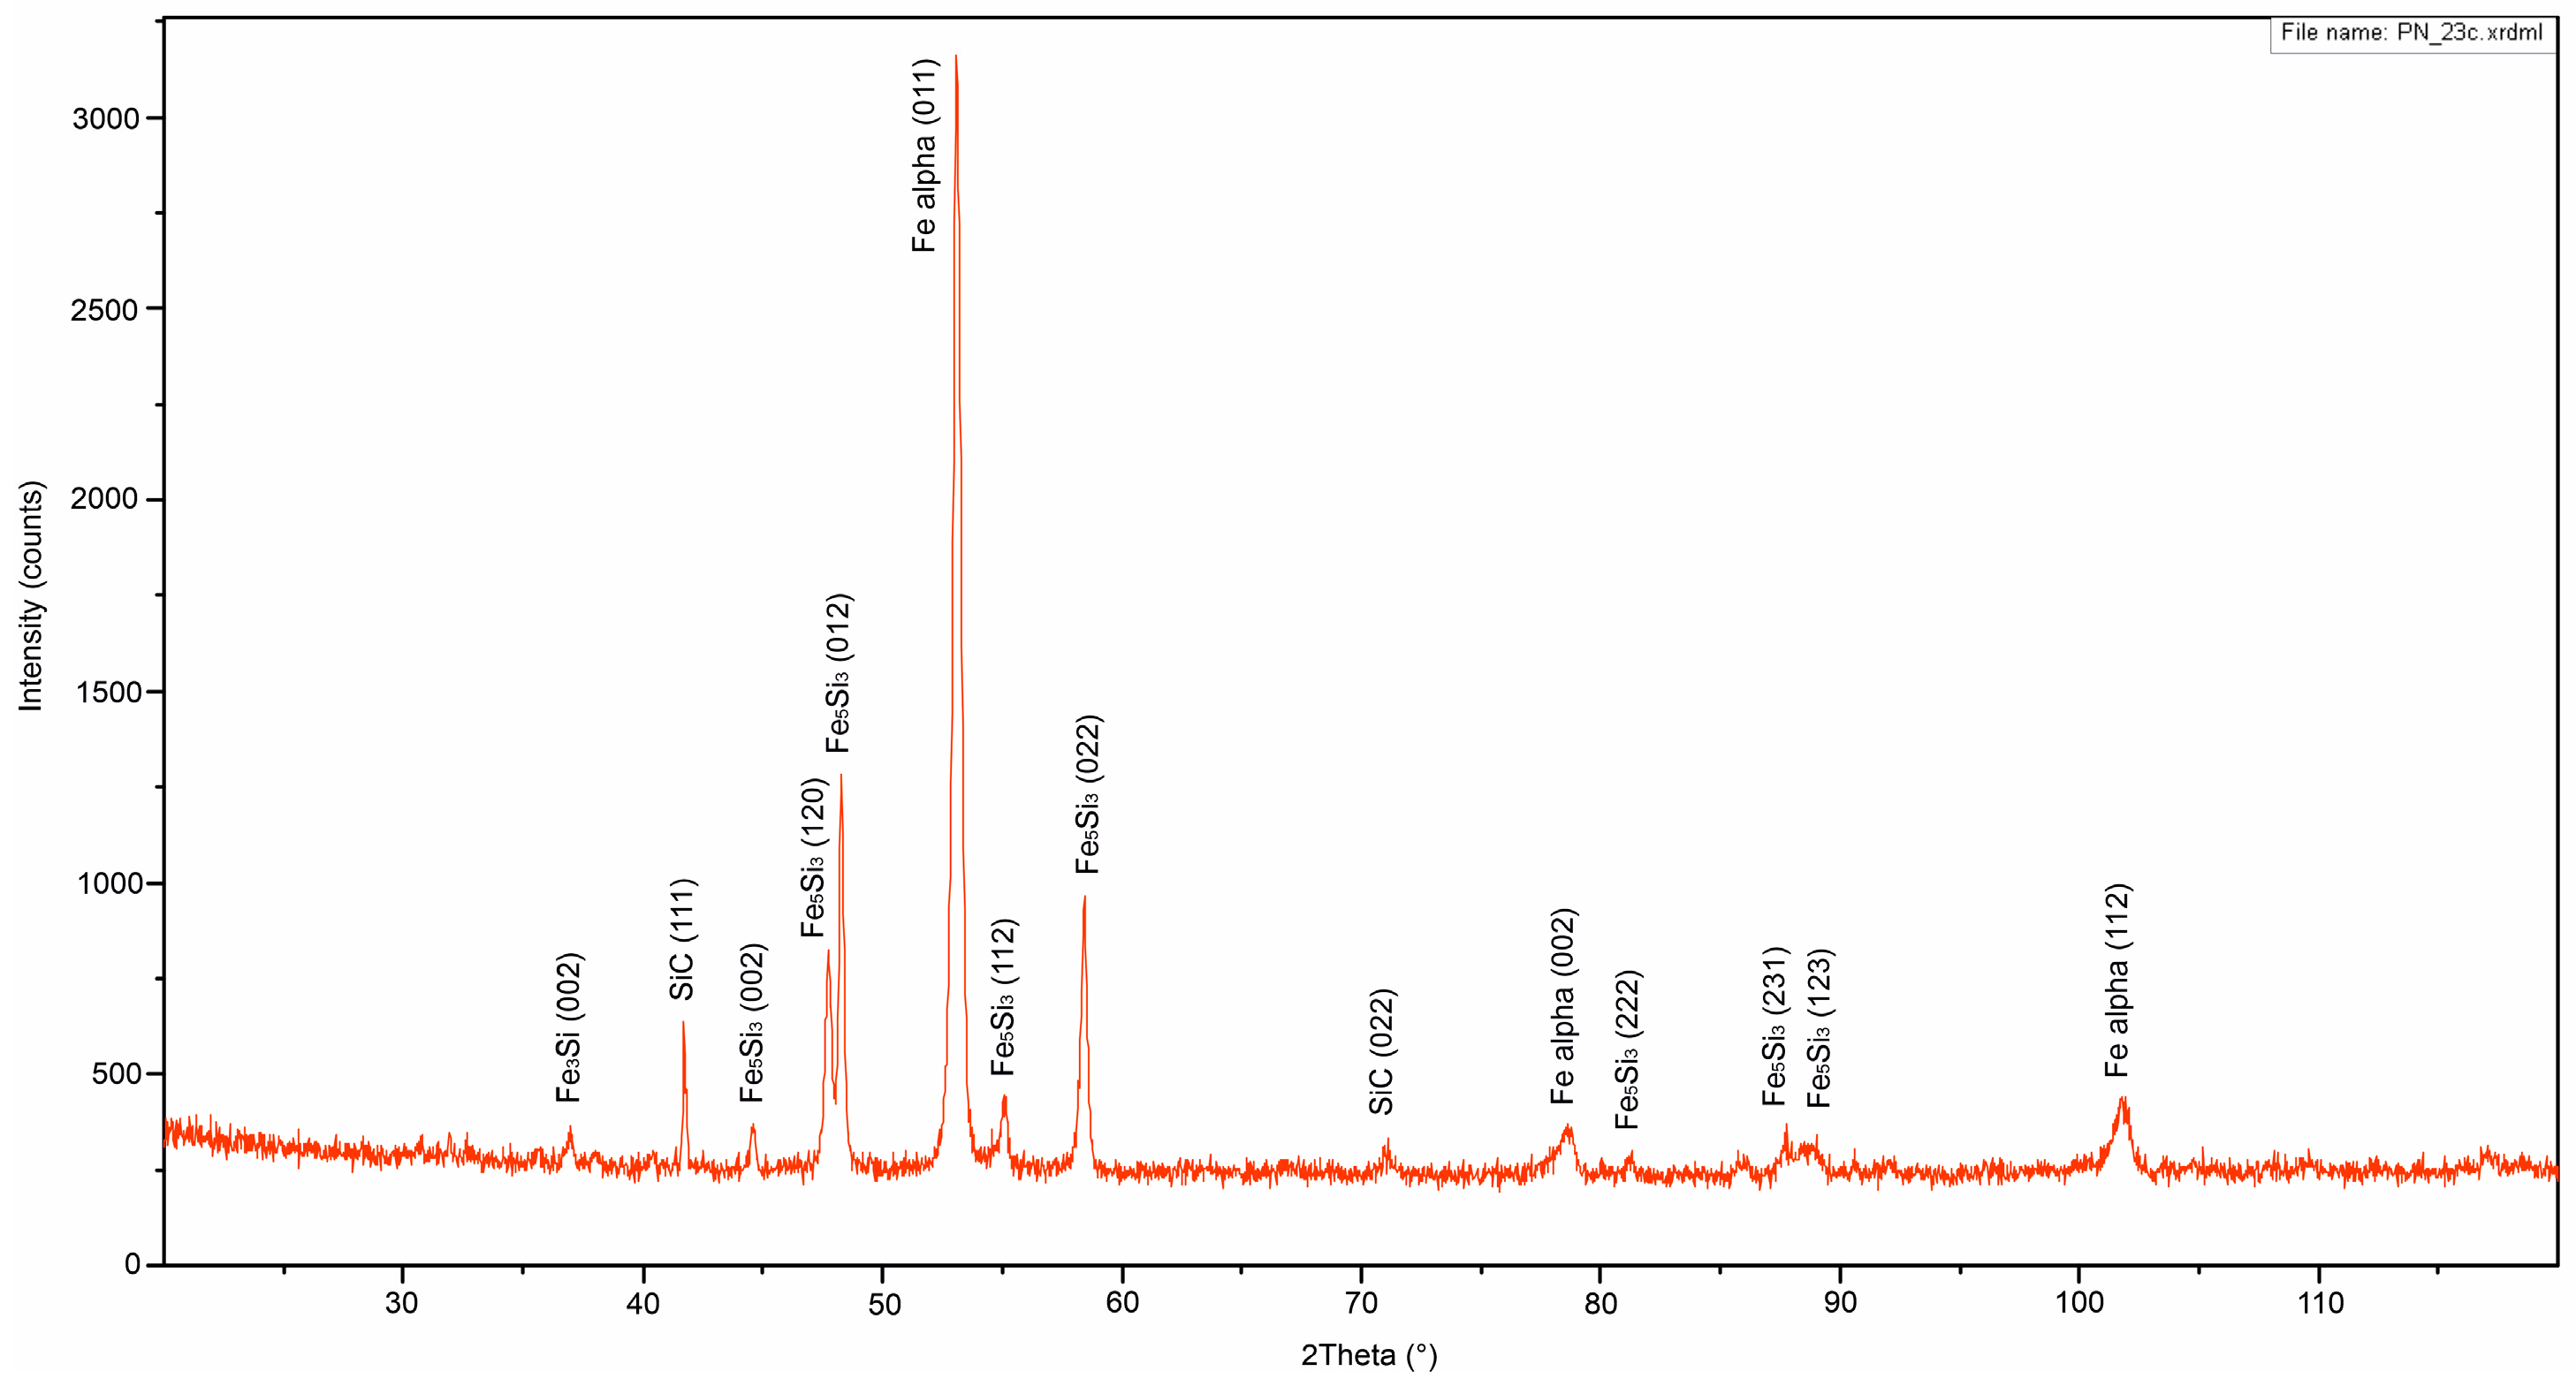
The analyzed alloys were subjected to analysis using an X-ray diffractometer. The X-ray diffraction analysis for the HSCI 23 melt disclosed the presence of silicon ferrite and an intermetallic phase of Fe5Si3 (98–063–3540) type (Figure 2). The graph also shows spectra from the SiC (98–018–2361) compound and the Fe3Si (98–041–2841) phase. Figure 3 shows the results of the analysis for the HSCI 25 melt. The presented diffraction pattern shows spectra of silicon ferrite Feα (98–008–1495) and Fe5Si3 (98–063–3540), Fe3Si (98–041–2841), and SiC (98–018–2361) compound intermetallic phases. In addition, spectra of the SiC compound are available. This is probably a measurement error, which in a way, relates to the single silicon crystals observed in the microstructure. In the tested alloy, we are dealing with the phenomenon of carbon segregation, which enriches the surface of silicon crystals without forming a bond with them. The formation temperature of the SiC compound [28] and the conditions under which such compounds are formed are far from the conditions and temperature range of the crystallizing alloy.
The analysis results clearly show that the analyzed alloys have two types of intermetallic phases: Fe3Si (98–041–2841), Fe5Si3 (98–063–3540), and silicon ferrite (98–008–1495).

3.3. Metallographic Analysis

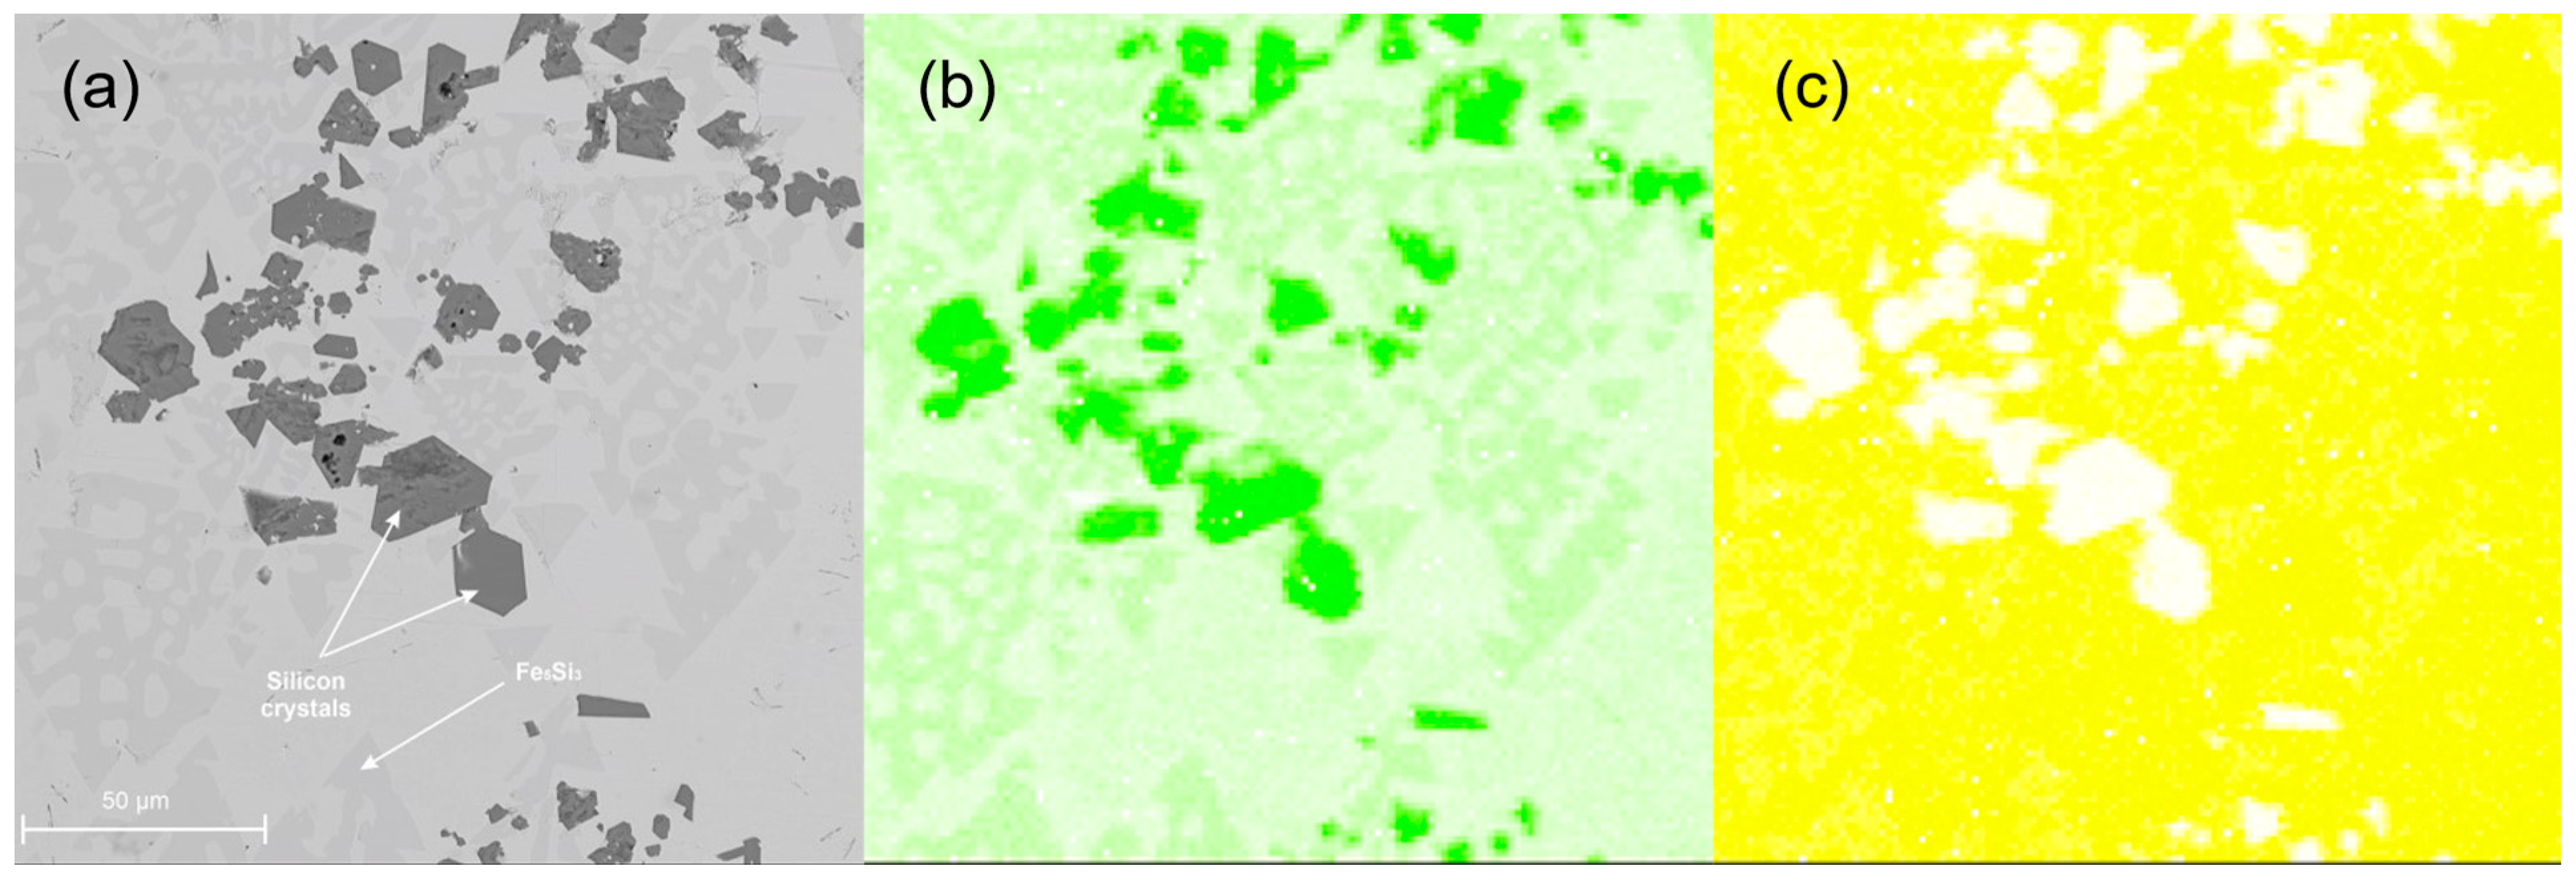
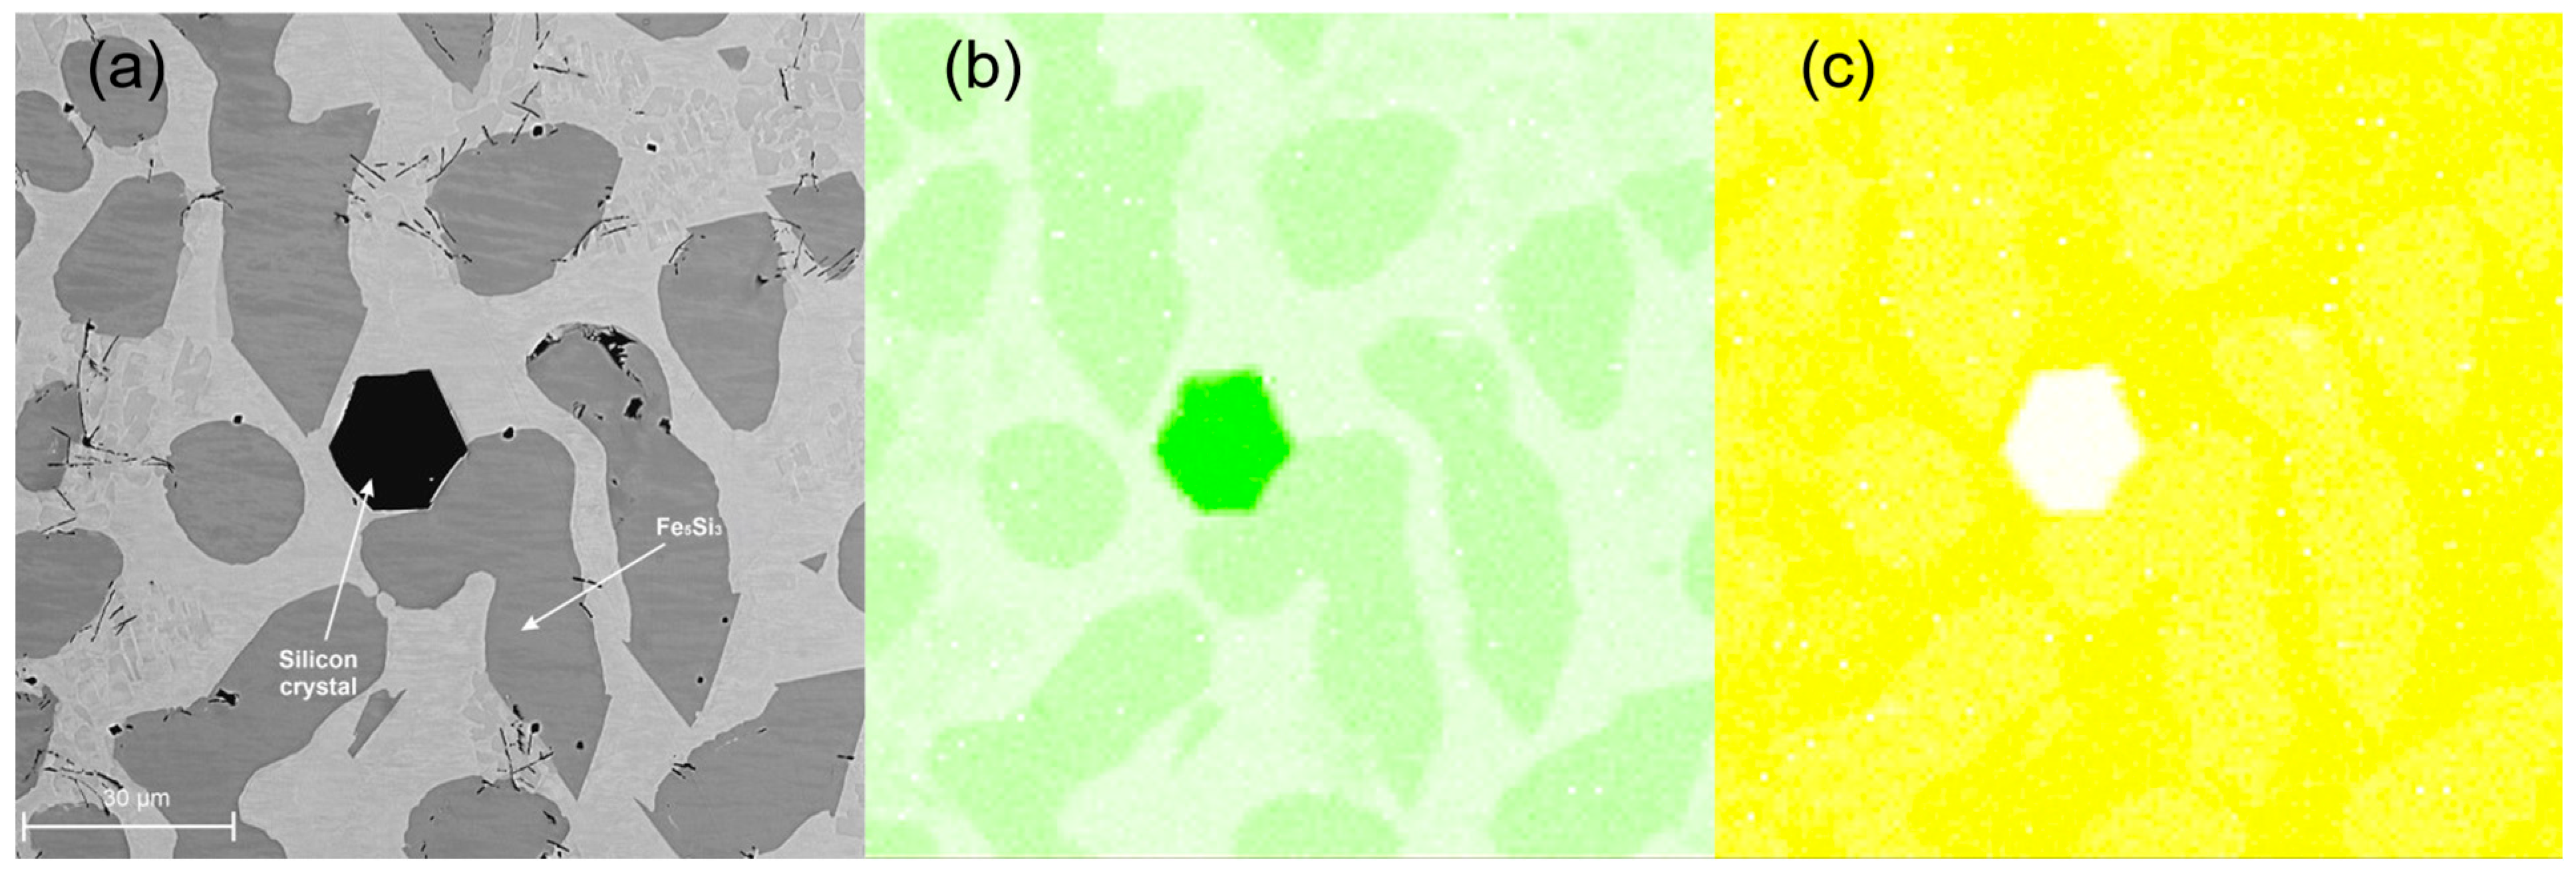
Figure 4 and Figure 5 show the metallographic analysis results, including EDS analysis, for the described alloys. Si crystals and phases, the main elements of Si and Fe, were identified.
The metallographic analysis did not confirm the presence of the FeSi phase. In contrast, the presence of the SiC compound is questionable, and based on the gathered data, it is impossible to clearly determine the type of participation we deal with. Moreover, elements of the microstructure of complex multielement chemical composition, which would indicate the presence of complex silicon, carbon, and iron compounds, were not observed.
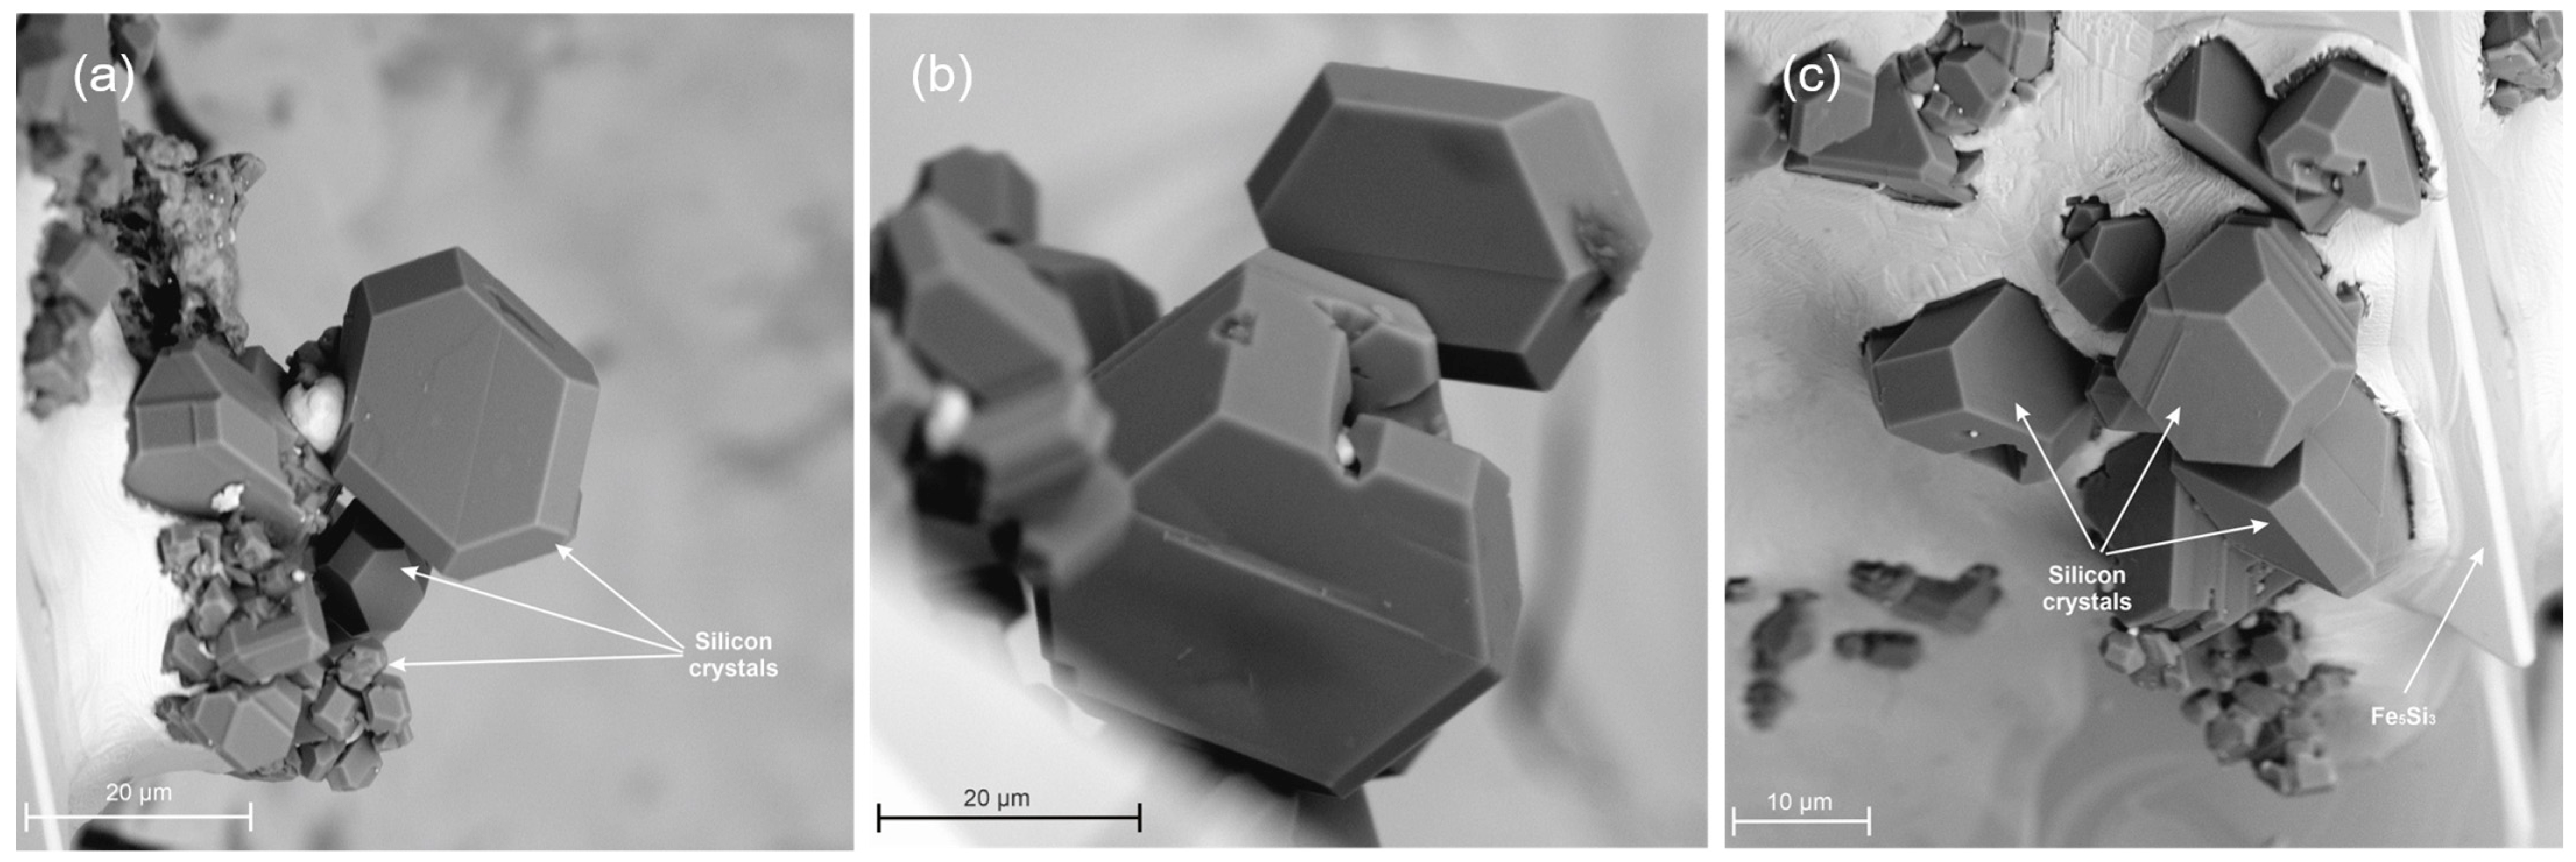
The next step included an analysis of the surface of the contraction cavities in the obtained casts. It turned out that the half-closed surfaces contain particularly interesting elements of the microstructure, the structure of which may be observed in a spatial view. Figure 6a–f presents the analysis results for the HSCI 23 alloy. Special attention should be paid to the wall crystals of the Fe5Si3 intermetallic phase. The chemical composition of the crystals (Fe5Si3) was determined based on the results obtained from diffraction and EDS analysis. Moreover, silicon crystals are visible in Figure 6d.
Figure 7a–c presents the participation of silicon crystals. Those participations are located on the surface of the contraction cavity. We can also observe the participation of wall crystals in the Fe5Si3 intermetallic phase. This participation is presented in Figure 7c.
Figure 8 shows the participation of the Fe5Si3 intermetallic phase and the EDS analysis in the form of maps of the distribution of elements (b) Fe and (c) Si. According to the stoichiometric formula, the analyzed area is richer in iron and poorer in silicon.
Figure 9 shows a view of the surface of the shrinkage cavity, on which the growth sequence of the wall crystals of the Fe5Si3 intermetallic phase was recorded. As a result of the shrinkage of the casting, there was a shortage of liquid metal in the observed area, which resulted in the “exposure” of the intermetallic phase crystals.
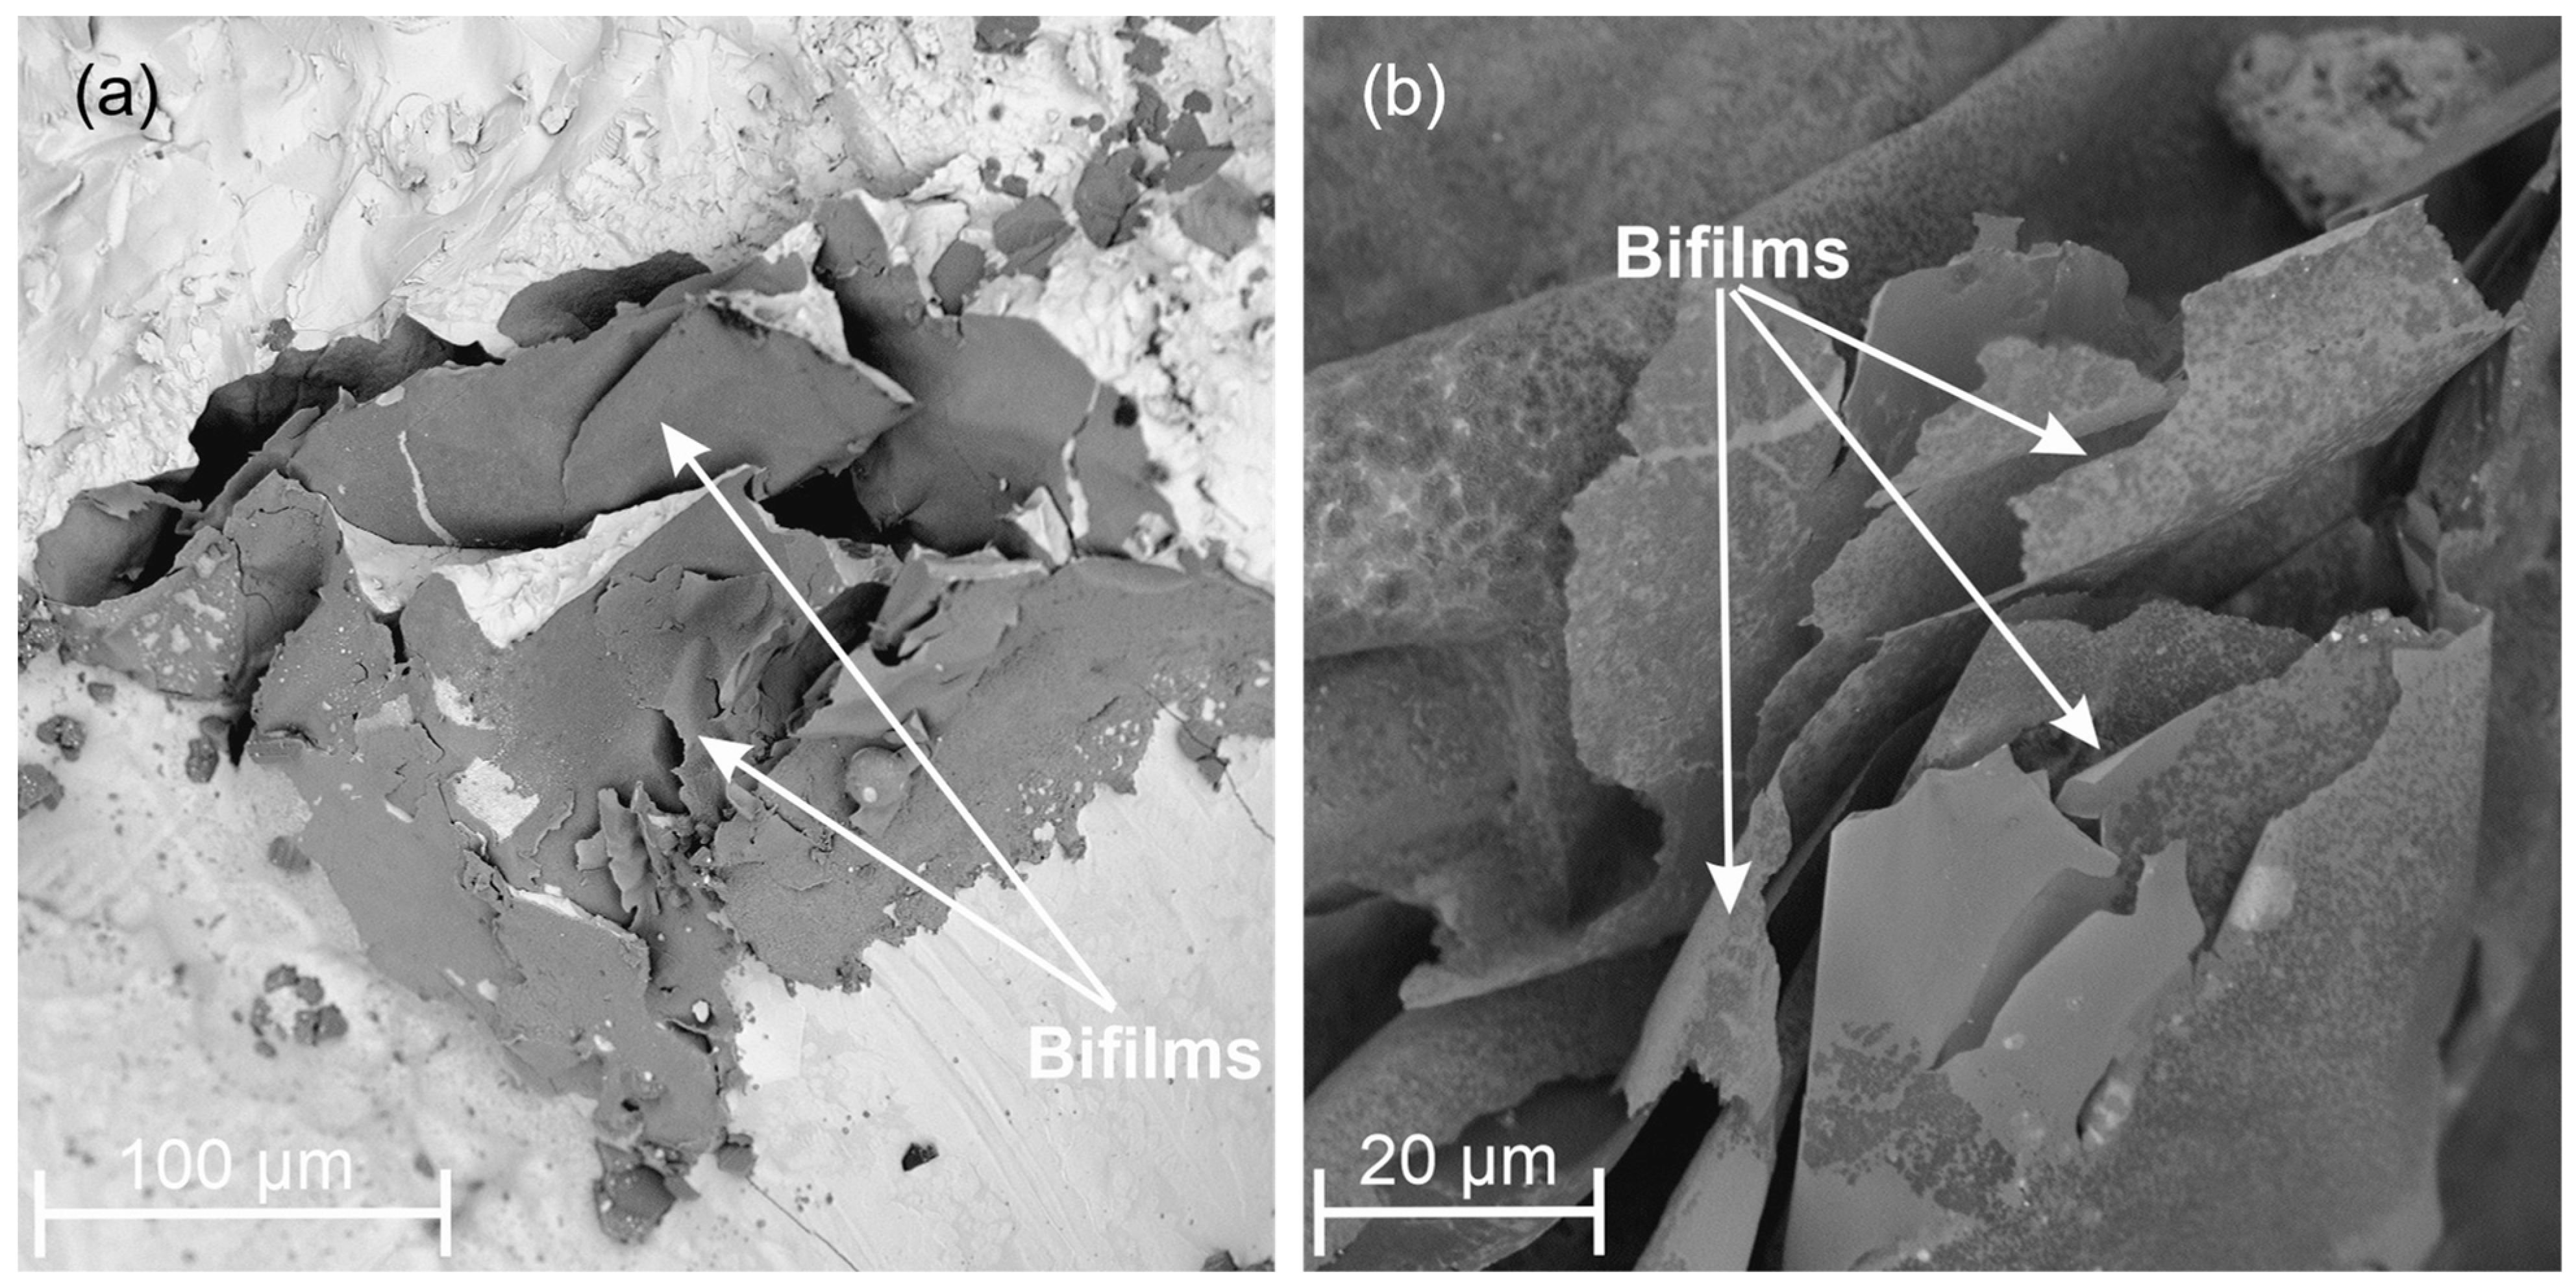
Bifilms were found in selected areas of the contractile cavity. These are harmful deposits that reduce the quality of the casting alloy. Due to the alloy’s chemical composition and especially the high silicon content, alloys of this type are characterized by a high tendency to form oxide layers. Defects of this type are formed in the metallurgical process. Certainly, they can be reduced but not completely eliminated. The bifilm inclusions are shown in Figure 10a,b.

4. Discussion

Most importantly, the presented test results allowed for the determination of the characteristic temperatures of phase transitions for two specific multielement alloys. In order to determine the theoretical phase composition of the tested cast iron in the balanced state, calculations were carried out using Thermo-Calc software, ver. 2003.
Crystallization of multielement alloys often includes various types of unbalanced impacts, linear or non-linear dynamic processes, and accidental fluctuations in the system (diffusions, segregation, transformation, nucleation, growth of particles, ion exchange reaction, surface reaction, liquid flow, advection, convection, infiltration, heat flow, transformation of controlled curves). The simulation of the processes takes into account mass transfers and the transport of energy caused by various processes. However, treating all those processes via a single simulation program is very complicated. Therefore, various approximations and simplifications must always be made. There are two groups of methods. One includes geometric aspects, while the other considers thermodynamics and kinetics. They are a source of useful information regarding fractions and shares of different phases in given compositions of alloys under specific conditions. Our approach consisted of minimizing the total Gibbs free energy in the alloy system in order to specify optimal fractions and compositions of occurring phases in the temperature function [29,30,31].
Calculations were carried out for a pseudo-double system with constant carbon and variable silicon. The results of the calculations are presented in Figure 11 in graphical form.
Based on the calculations, it was found that the higher content of silicon limits the range of occurrence of austenite. Moreover, the temperature range of occurrence of ferrite decreased. Certainly, a high silicon content improves the alloy’s graphitization ability, which matches the literature data [1].
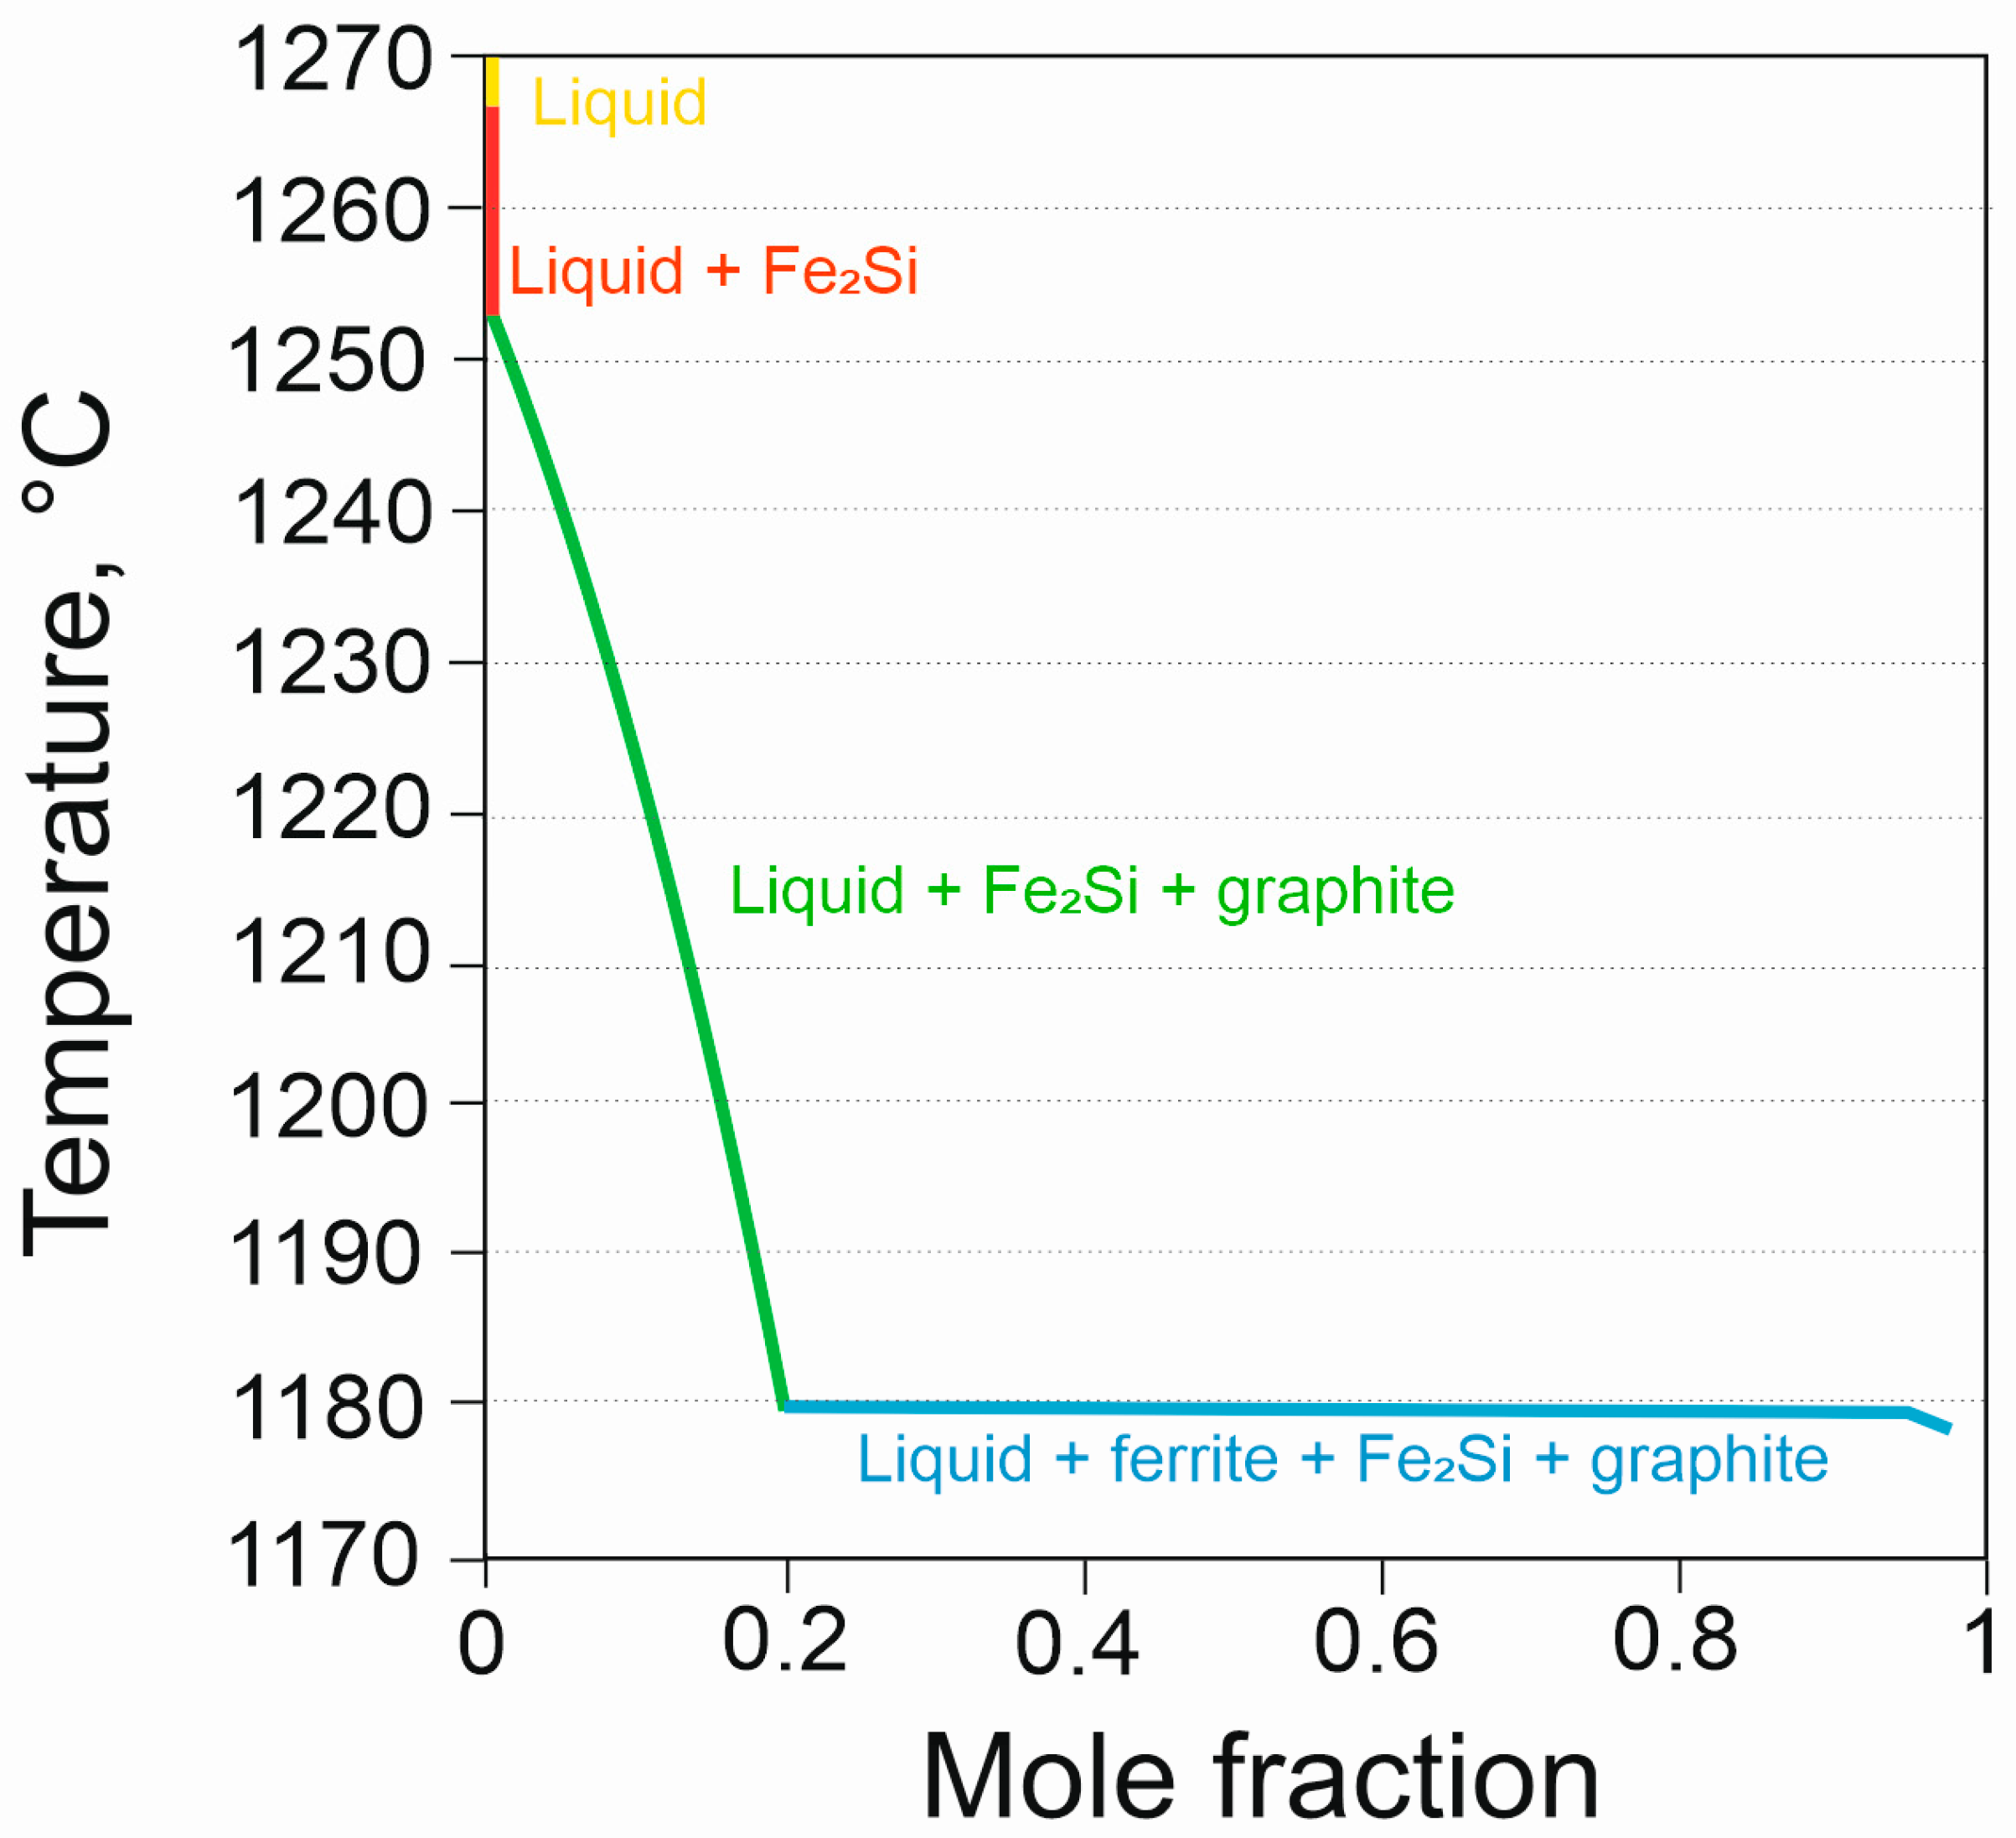
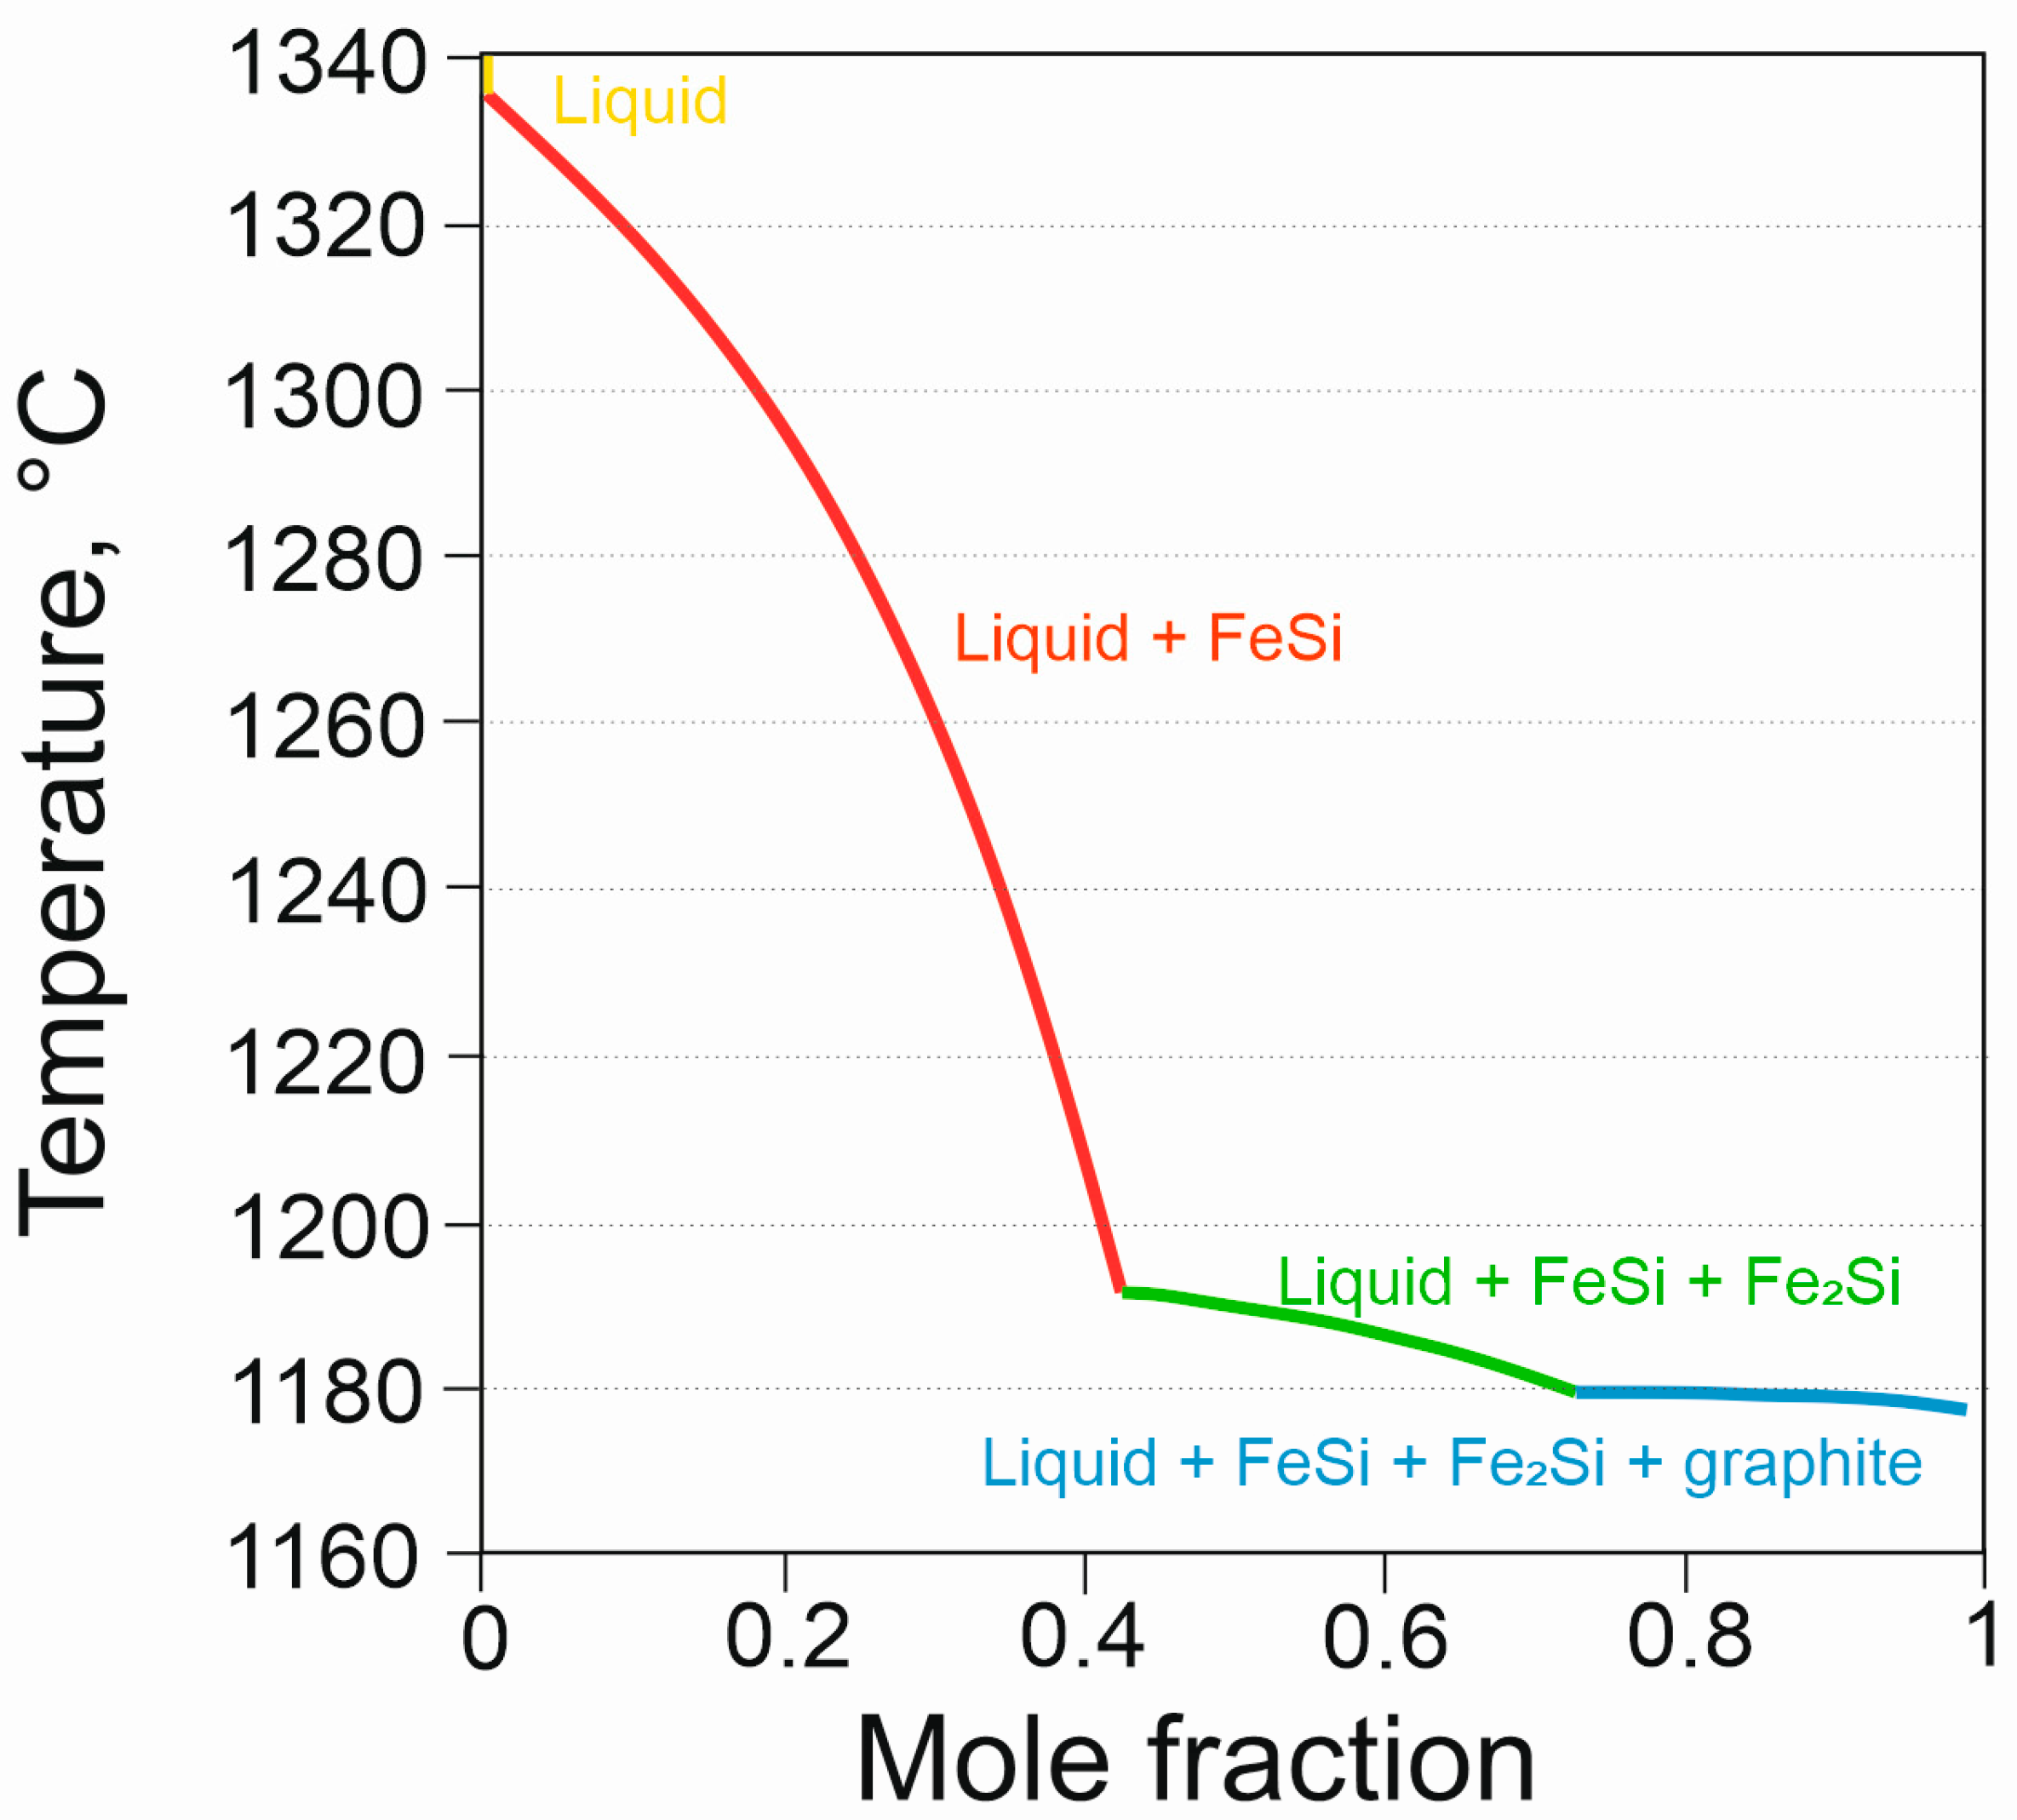
The next stage included calculating the share of phases in the temperature function in non-equilibrium conditions. The graphs show the condition of the alloy as a function of temperature changes. The results were related to the mole fractions of the individual phases present in the drawings. The graphs are shown in Figure 12 and Figure 13.
The calculations conducted are summarized in the form of a table (Table 3), which contains detailed temperature values for characteristic phases.
Based on the obtained results, a decreasing temperature range of occurrence of ferrite, together with an increase in Si content, was observed. Moreover, the solidus line starts to emerge at increasingly lower temperatures, whereas the participation of ferrosilicons becomes more intensive. The calculated solidus temperature values significantly differ from those determined during TDA curve registration. The difference between the experimentally recorded solidus temperature and the temperature calculated in the simulation was calculated. The calculated solidus temperature values are higher than the temperatures recorded during the tests. For the HSCI 23 alloy, this difference is −20 °C, and for the HSCI 25 alloy, it is −42 °C. This difference results from the limitations of the calculations performed (it is impossible to precisely reproduce the chemical composition of the analyzed alloys due to their complexity and the presence of elements with trace concentrations). Those elements impact the characteristic transitions in the tested alloys; however, their precise determination at this research stage is impossible.
Furthermore, the high amount of silicon in the alloys favors the emergence of complex intermetallic phases and oxygen inclusions of the “bifilms” type. This is due to a greater ability to absorb gas (mainly oxygen) from the surroundings. When oxygen reacts with liquid metal, it causes the creation of thin oxygen inclusions in the form of membranes or bifilms (as they are called by J. Campbell) [19,20].
By observing contraction cavities created during the casting process, we managed to document the spatial structure of the silicon crystals of the Fe5Si3 intermetallic phase. This type of analysis on surfaces of contraction cavities brings about a series of interesting results, which show oxygen inclusions [22], the participation of graphite “pushed out” of the metal bath [15], titanium carbides (TiC) [32], TiAlSi intermetallic inclusions [33], and bifilm defects [34].

5. Conclusions

As a result of the tests conducted, two alloys with increased silicon content were analyzed. The following conclusions were drawn based on the results:
  • Solidus and liquidus temperatures were experimentally determined for the analyzed alloys: HSCI 23 (TL 1220 °C, TS 1158 °C), HSCI 25 (TL 1291 °C, TS 1126 °C).
  • The phase transition temperature range, observed due to the heat effect from the transition of the Fe2Si phase into the Fe5Si3 phase, was determined. HSCI 23 (1095–978 °C), HSCI 25 (1109–987 °C).
  • The spatial structure of the Fe5Si3 intermetallic phase, occurring on the surface of contraction cavities, was disclosed.
  • A high level of silicon in the discussed alloys favors the emergence of oxygen inclusions of the “bifilm” type due to the increased absorption of gases by a liquid alloy.

Funding

This research received no external funding.

Data Availability Statement

Data sharing is not applicable to this article.

Conflicts of Interest

The author declares no conflict of interest.

References

  1. Campbell, J. Complete Casting Handbook, 2nd ed.; Elsevier: Oxford, UK, 2015; p. 275. [Google Scholar]
  2. Pacha-Gołȩbiowska, H.; Piekarska, W. Key determinants for high-alloyed cast irons for mechanical engineering. Int. J. Appl. Mech. Eng. 2022, 27, 146–167. [Google Scholar] [CrossRef]
  3. Lekakh, S.N.; Johnson, C.; Godlewski, L.; Li, M. Control of high-temperature static and transient thermomechanical behavior of SiMo ductile iron by al alloying. Int. J. Met. 2023, 17, 22–38. [Google Scholar] [CrossRef]
  4. Chavan, S.; Khandelwal, H. Effect of mo on micro-structural and mechanical properties of as-cast ferritic spheroidal graphite iron. Trans. Indian Inst. Met. 2021, 74, 2703–2711. [Google Scholar] [CrossRef]
  5. Lekakh, S.N.; Johnson, C.; Bofah, A.; Godlewski, L.; Li, M. Improving high-temperature performance of high si-alloyed ductile iron by altering additions. Int. J. Met. 2021, 15, 874–888. [Google Scholar] [CrossRef]
  6. Cofiño-Villar, A.; Alvarez-Antolin, J.F.; Asensio-Lozano, J. Enhanced fracture strength in the working layer of rolls manufactured in Ni-hard cast iron alloyed with Mo, Nb and Mg. Metals 2018, 8, 725. [Google Scholar] [CrossRef] [Green Version]
  7. Vaško, A.; Uhríčik, M.; Kuchariková, L.; Tillová, E. Microstructure, mechanical and fatigue properties of SiMo- and SiCu- nodular cast irons. Procedia Struct. Integr. 2018, 13, 1527–1532. [Google Scholar] [CrossRef]
  8. Kotarska, A. The laser alloying process of ductile cast iron surface with titanium. Metals 2021, 11, 282. [Google Scholar] [CrossRef]
  9. Wieczorek, A.N. Comparative studies on the wear of ADI alloy cast irons as well as selected steels and surface-hardened alloy cast steels in the presence of abrasive. Arch. Metall. Mater. 2017, 62, 119–128. [Google Scholar] [CrossRef] [Green Version]
  10. Liu, C.; Du, Y.; Wang, X.; Zheng, Q.; Zhu, X.; Zhang, D.; Jiang, B. Comparison of the tribological behavior of quench-tempered ductile iron and austempered ductile iron with similar hardness. Wear 2023, 520, 204668. [Google Scholar] [CrossRef]
  11. Górny, M.; Gondek, Ł.; Angella, G.; Tyrała, E.; Kawalec, M.; Bitka, A. Structural stability of thin-walled austempered ductile iron castings. Arch. Civ. Mech. Eng. 2023, 23, 79. [Google Scholar] [CrossRef]
  12. Gebhardt, C.; Zhang, J.; Bezold, A.; Broeckmann, C. Microscale fatigue mechanisms in high silicon alloyed nodular cast iron. Int. J. Fatigue 2023, 168, 107402. [Google Scholar] [CrossRef]
  13. Baddoo, N.R. Stainless steel in construction: A review of research, applications, challenges and opportunities. J. Constr. Steel Res. 2008, 64, 1199–1206. [Google Scholar] [CrossRef]
  14. Nilsson, J. Super duplex stainless steels. Mater. Sci. Technol. 1992, 8, 685–700. [Google Scholar] [CrossRef]
  15. Stawarz, M.; Dojka, M. Bifilm inclusions in high alloyed cast iron. Materials 2021, 14, 3067. [Google Scholar] [CrossRef]
  16. Pedeferri, P. Cathodic protection and cathodic prevention. Constr. Build. Mater. 1996, 10, 391–402. [Google Scholar] [CrossRef]
  17. Bertolini, L.; Bolzoni, F.; Pedeferri, P.; Lazzari, L.; Pastore, T. Cathodic protection and cathodic prevention in concrete: Principles and applications. J. Appl. Electrochem. 1998, 28, 1321–1331. [Google Scholar] [CrossRef]
  18. Stawarz, M.; Kajzer, W.; Kajzer, A.; Dojka, M. Physicochemical properties of silicon cast iron. Arch. Foundry Eng. 2017, 17, 101–106. [Google Scholar] [CrossRef]
  19. Campbell, J. Hoyt memorial lecture—Stop pouring, start casting. Int. J. Met. 2012, 6, 7–18. [Google Scholar] [CrossRef]
  20. Fox, S.; Campbell, J. Visualisation of oxide film defects during solidification of aluminium alloys. Scr. Mater. 2000, 43, 881–886. [Google Scholar] [CrossRef]
  21. Lazaro-Nebreda, J.; Patel, J.B.; Lordan, E.; Zhang, Y.; Karakulak, E.; Al-Helal, K.; Fan, Z. Degassing of aluminum alloy melts by high shear melt conditioning technology: An overview. Metals 2022, 12, 1772. [Google Scholar] [CrossRef]
  22. Dojka, M.; Stawarz, M. Bifilm defects in Ti-inoculated chromium white cast iron. Materials 2020, 13, 3124. [Google Scholar] [CrossRef] [PubMed]
  23. Gyarmati, G.; Fegyverneki, G.; Tokár, M.; Mende, M. Investigation on double oxide film initiated pore formation in aluminum. casting alloys. Int. J. Eng. Manag. Sci. 2020, 5, 141–153. [Google Scholar] [CrossRef]
  24. Rappenglück, M.A. Natural iron silicides: A systematic review. Minerals 2022, 12, 188. [Google Scholar] [CrossRef]
  25. Kimura, Y.; Yamada, M.; Chai, Y.W. Thermoelectric properties of nearly single-phase-FeSi2 alloys fabricated by gas-atomized powder sintering. Mater. Trans. 2019, 60, 652–661. [Google Scholar] [CrossRef] [Green Version]
  26. Sakata, T.; Sakai, Y.; Yoshino, H.; Fujii, H.; Nishida, I. Studies on the formation of FeSi2 from the FeSi Fe2Si5 eutectic. J. Less-Common Met. 1978, 61, 301–308. [Google Scholar] [CrossRef]
  27. Santamaría-Pérez, D.; Nuss, J.; Haines, J.; Jansen, M.; Vegas, A. Iron silicides and their corresponding oxides: A high-pressure study of Fe5Si3. Solid State Sci. 2004, 6, 673–678. [Google Scholar] [CrossRef]
  28. Yang, D.; Yu, Y.; Zhao, X.; Song, Y.; Lopez-Honorato, E.; Xiao, P.; Lai, D. Fabrication of silicon carbide (SiC) coatings from pyrolysis of Polycarbosilane/Aluminum. J. Inorg. Organomet. Polym. Mater. 2011, 21, 534–540. [Google Scholar] [CrossRef]
  29. Chen, H.; Barman, T. Thermo-calc and DICTRA modelling of the β-phase depletion behaviour in CoNiCrAlY coating alloys at different al contents. Comput. Mater. Sci. 2018, 147, 103–114. [Google Scholar] [CrossRef]
  30. Sadowski, T.; Golewski, P. Detection and numerical analysis of the most efforted places in turbine blades under real working conditions. Comput. Mater. Sci. 2012, 64, 285–288. [Google Scholar] [CrossRef]
  31. Chen, H.; Jackson, G.A.; Voisey, K.T.; McCartney, D.G. Modelling and experimental study on β-phase depletion behaviour of HVOF sprayed free-standing CoNiCrAlY coatings during oxidation. Surf. Coat. Technol. 2016, 291, 34–42. [Google Scholar] [CrossRef]
  32. Dojka, M.; Dojka, R.; Stawarz, M.; Studnicki, A. Influence of Ti and REE on primary crystallization and wear resistance of chromium cast iron. J. Mater. Eng. Perform. 2019, 28, 4002–4011. [Google Scholar] [CrossRef] [Green Version]
  33. Gyarmati, G.; Bubonyi, T.; Fegyverneki, G.; Tokár, M.; Mende, T. Interactions of primary intermetallic compound particles and double oxide films in liquid aluminum alloys. Intermetallics 2022, 149, 107681. [Google Scholar] [CrossRef]
  34. Gyarmati, G.; Vincze, F.; Fegyverneki, G.; Kéri, Z.; Mende, T.; Molnár, D. The effect of rotary degassing treatments with different purging gases on the double oxide- and nitride film content of liquid aluminum alloys. Metall. Mater. Trans. B Process Metall. Mater. Process. Sci. 2022, 53, 1244–1257. [Google Scholar] [CrossRef]
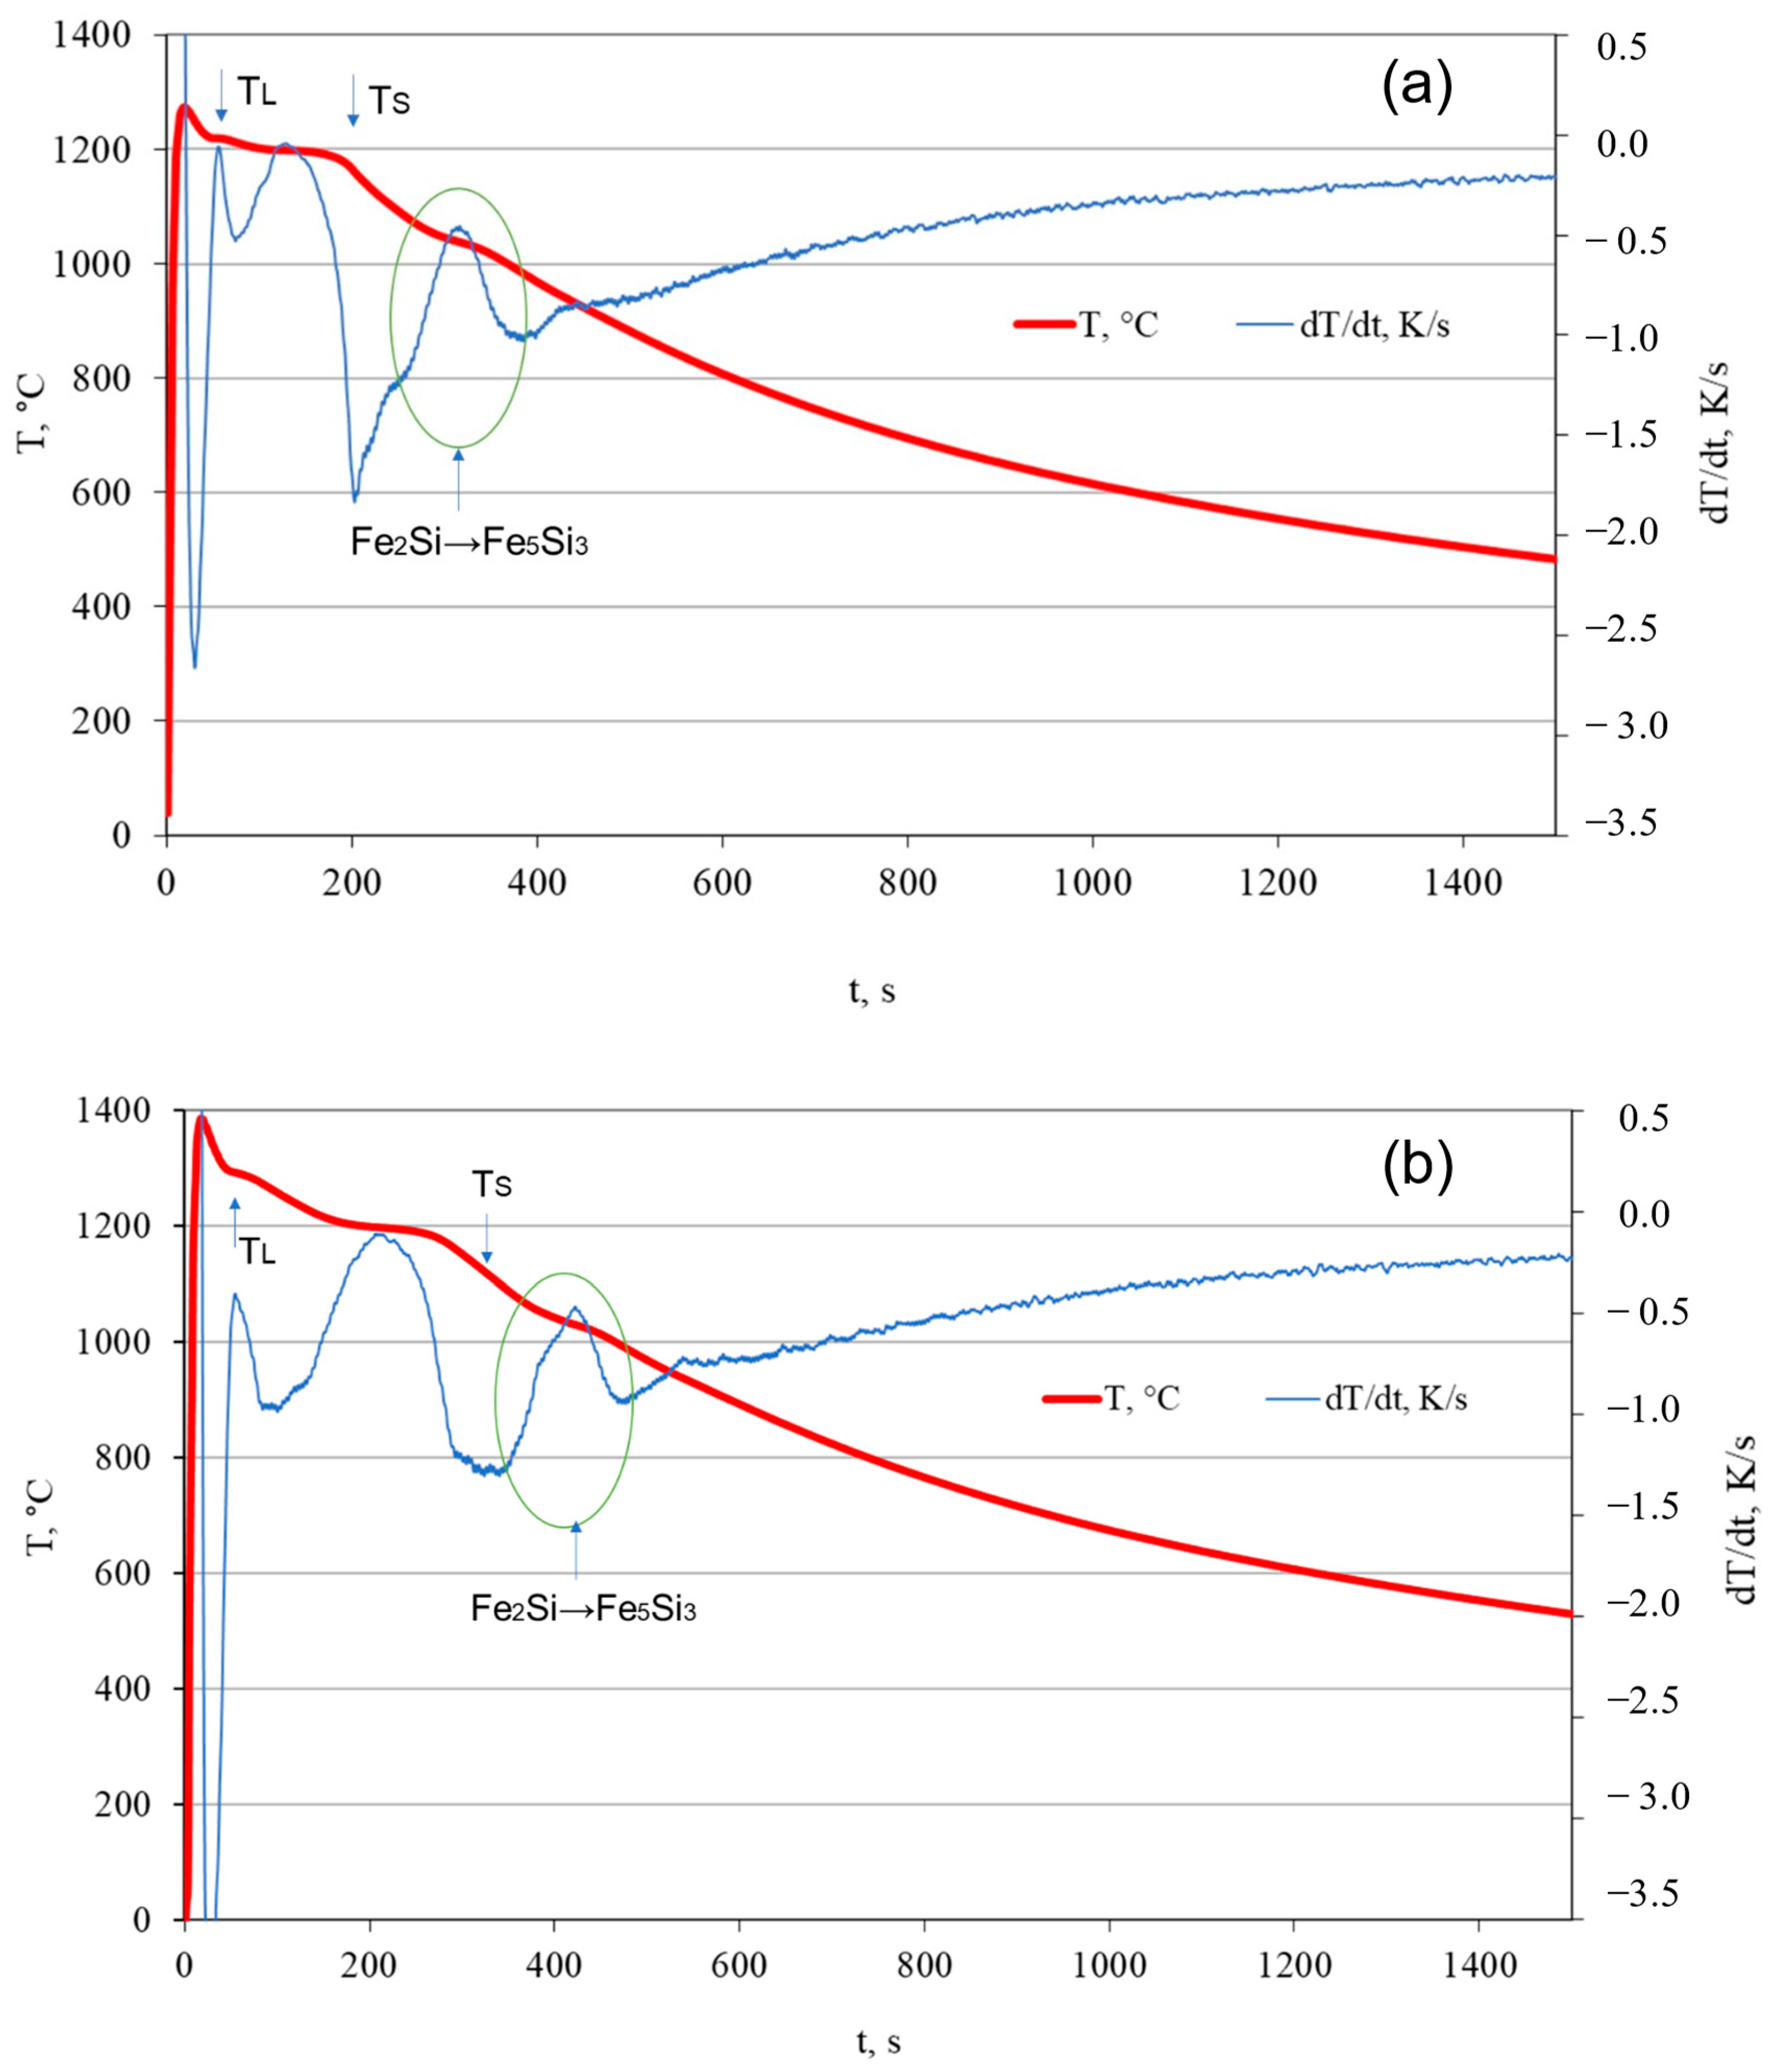
Figure 1. TDA analysis for HSCI 23 (a) and HSCI 25 (b) alloys.
Crystals 13 01033 g001
Figure 2. Diffraction analysis for the HSCI 23 alloy.
Crystals 13 01033 g002
Figure 3. Diffraction analysis for the HSCI 25 alloy.
Crystals 13 01033 g003
Figure 4. The EDS analysis for the HSCI 23 alloy includes (a) SEM microstructure, (b) the map of Si decomposition, and (c) the map of Fe decomposition.
Crystals 13 01033 g004
Figure 5. The EDS analysis for the HSCI 25 alloy includes (a) SEM microstructure, (b) the map of Si decomposition, and (c) the map of Fe decomposition.
Crystals 13 01033 g005
Figure 6. SEM analysis of the surface of contraction cavities for the HSCI 23 alloy. Pictures (af) show the participation of the Fe5Si3 phase in the form of wall crystals. Picture (d) shows the participation of silicon crystals.
Crystals 13 01033 g006
Figure 7. SEM analysis of the surface of contraction cavities for the HSCI 23 alloy. Pictures (ac) show the participation of silicon crystals. Moreover, picture (c) shows a crystal from the Fe5Si3 intermetallic phase in the form of a wall crystal.
Crystals 13 01033 g007
Figure 8. The EDS analysis for the HSCI 25 alloy includes (a) SEM microstructure, (b) the map of Si decomposition, and (c) the map of Fe decomposition.
Crystals 13 01033 g008
Figure 9. SEM analysis of the surface of contraction cavities for the HSCI 25 alloy. Pictures (a,b) show the participation of the crystals in the Fe5Si3 intermetallic.
Crystals 13 01033 g009
Figure 10. Inclusions of the “bifilm” type at the fractures of samples (a) for the HSCI 23 alloys and (b) for the HSCI 25 alloy.
Crystals 13 01033 g010
Figure 11. Pseudo-double graph for constant carbon at the level of 0.5%.
Crystals 13 01033 g011
Figure 12. Share of the phases in the temperature function in non-equilibrium conditions for the HSCI 23 alloy.
Crystals 13 01033 g012
Figure 13. Share of the phases in the temperature function in non-equilibrium conditions for the HSCI 25 alloy.
Crystals 13 01033 g013
Table 1. Chemical analysis of steel scrap used in the research.
Chemical Composition, % of Weight
CCrSiMnNiMoS
0.0800.0370.0010.5940.0240.010.006
CoCuAlSbAsBP
0.0100.0040.0460.0090.1080.000.016
PbNbSnTiWVFebal
0.0020.0310.0090.0010.0110.00698.995
Table 2. Chemical composition of high silicon cast iron.
Chemical Composition, % of Weight
1 Si2 C2 SPMnMoCuMgTiFebal
HSCI 2323.530.820.0070.0230.3310.0190.0610.000.02175.18
HSCI 2525.230.120.0070.0210.3290.0100.0690.000.02274.19
1 Si analysis by weight method, 2 Carbon and sulfur analysis by CS 125 Leco.
Table 3. Summary of temperatures and phases for particular alloys.
Temperature, °C
GraphiteFeSiFe2SiSolidus
HSCI 231267125211791178
HSCI 251179133611921168
Disclaimer/Publisher’s Note: The statements, opinions and data contained in all publications are solely those of the individual author(s) and contributor(s) and not of MDPI and/or the editor(s). MDPI and/or the editor(s) disclaim responsibility for any injury to people or property resulting from any ideas, methods, instructions or products referred to in the content.