Article

Ultrafast Mechanism of Material Removal in the Femtosecond Laser Ablation of WS2 and Its Diode Rectification Characteristics

1
Laser Micro/Nano Fabrication Laboratory, School of Mechanical Engineering, Beijing Institute of Technology, Beijing 100081, China
2
Beijing National Laboratory for Condensed Matter Physics, Institute of Physics, Chinese Academy of Sciences, Beijing 100190, China
3
Yangtze Delta Region Academy of Beijing Institute of Technology, Jiaxing 314019, China
*
Author to whom correspondence should be addressed.
These authors contributed equally to this work.
Present Address: Faculty of Physics, University of Duisburg-Essen, Lotharstrasse 1, 47057 Duisburg, Germany.
§
Present Address: Lab. of Precision Measurement and Intelligent Sensing Technology, College of Control Science and Engineering, China University of Petroleum, Qingdao 266580, China.
Crystals 2023, 13(5), 832; https://doi.org/10.3390/cryst13050832
Submission received: 30 April 2023 / Revised: 15 May 2023 / Accepted: 15 May 2023 / Published: 17 May 2023

Abstract

:
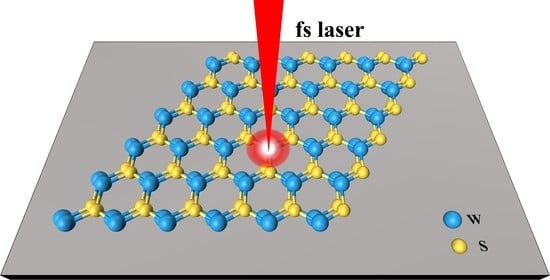
The study investigates the two different underlying ablation mechanisms of WS2 processed by femtosecond (fs) laser with different fluences. With increasing fluence, the saturable expansion of craters and the transformation of three distinct crater morphologies are found. The material response and the transfer and deposition of laser energy are tracked by using a plasma model based on the classical single rate equation model and the Drude model. The results of the numerical simulation and time-resolved transient reflectivity reveal the two different ablation mechanisms, which are coulomb explosion and phase explosion. The mechanism of material removal is distinguished by the critical threshold of 0.85 J/cm2. In addition, the internal ablation region exhibits a high concentration of defects and WO3 according to the results of Raman spectra, X-ray photoelectron spectra, and morphology-dependent photoluminescence mapping. Due to the high concentration with high fluence, the device of WS2/Si p-n junction exhibits a 2.6 times enhancement on the current under forward bias. The findings would be of value to engineer structures to tailor the optoelectronic response of WS2 and to develop potential future optoelectronic devices.

Graphical Abstract

1. Introduction

As a typical kind of transition metal dichalcogenides (TMDCs), tungsten disulfide (WS2) not only has excellent optoelectronic and mechanical properties [1], but also has great potential in applications of photocatalysis [2,3], sensing [4,5], photothermal therapy [6], and others. To further improve the initial performance of TMDCs, several approaches have been developed, including doping [7,8], alterations of the thickness and size of the material [9], and forming heterojunctions [10]. However, it is difficult to balance performance with cost, convenience, and stability. Unlike liquid-phase exfoliation, material modulation can be achieved with greater accuracy and controllability by high-energy beam irradiation (e.g., plasma [11] or laser [12,13,14,15] irradiation). The material modulation, such as the micro/nanostructures [16,17], defect/active sites [18] on TMDCs, and intercalating O2+ ions into TMDCs [19] results in the adjustable electronic and optical properties. In particular, the locally selective modulation with a higher accuracy and quality can be realized through femtosecond laser treatment (FLT) because of its superior processing capacity [14,16,20]. The operator can simply and efficiently modulate the material by adjusting treatment conditions, such as the exposure time, different environments, etc. [21,22,23] Laser energy can directly affect the modulation results due to its great influence on the early stage of ablation [24]. In order to improve modulation, it is essential to understand the mechanisms underlying material removal in the treatment. Several studies have been performed to reveal the process of laser-material interaction with continuous laser [21,25,26]. However, studies into the ablation of TMDCs using a femtosecond laser (fs-laser) pulse is scarce, and the interaction between fs-laser and TMDCs during the processing must be further investigated.
In this work, we extensively elucidated the energy deposition mechanism during the process of irradiation and material removal in the ablation of WS2. The expansion and morphology transformation of craters were found through single-pulse ablation experiments. The response of the excited WS2 and the transfer and deposition of laser energy were investigated via plasma modeling. The numerical simulation results revealed the reforming of laser intensity distribution induced by the interplay between laser and excited WS2, as well as the deposition of energy confined to a shallow layer beneath the surface. Two domain mechanisms of material removal in the ablation of WS2, Coulomb explosion (low fluence) and phase explosion (high fluence), which were distinguished by the critical threshold fluence (Fc), were demonstrated based on the calculated results and ultrafast reflectivity detection. In addition, the modulation in chemical components was also verified by Raman spectra and X-ray photoelectron spectra (XPS), which proved the formation of defects and WO3. Morphology-dependent photoluminescence (PL) mapping was collected to investigate the modulation of the local physical properties. Furthermore, the properties of the WS2/Si p-n junction were investigated before and after the modulation in FLT. These results revealed the mechanisms underlying the deposition of laser energy and fluence-dependent material removal in the ablation of WS2, which can assist in the modulation of WS2 and other TMDCs with FLT.

2. Materials and Methods

2.1. Experimental Methods

The WS2 films, which have a thickness of approximately 20 μm, were obtained through mechanical exfoliation from bulk crystals with an original thickness of around 200 μm (MK10853, Nanjing MKNANO Tech. Co., Ltd., Nanjing, China). The thicknesses of the exfoliated films were determined by laser confocal scanning microscopy (LEXT OLS4100, Olympus, Tokyo, Japan). The ablation of WS2 was performed in ambient air using a laser processing system; a laser pulse of 70 fs duration at a central wavelength of 800 nm (Spitfire Ace, Spectra-Physics) was perpendicularly focused on the film via an objective lens (10×, numerical aperture (NA) = 0.3, Olympus). A classic pump–probe system was used to detect the ultrafast reflectivity dynamics in the ablation of WS2; more details regarding the system are available in Figure S1 (see Supplementary Materials). The transient reflectivity change was acquired through the control of the on–off function of the pump beam, △R/R0 = (R − R0)/R0, where R0 and R represent the probe signals before and after pump beam irradiation, respectively.
The surface morphologies of craters after laser ablation were obtained by scanning electron microscope (SEM, Prime JSM-7800) and atomic force microscope (AFM, Bruker Dimension Edge, Shirley, NY, USA).

2.2. Computational Methods

To investigate the interaction between fs-laser and WS2 during the irradiation, a plasma model based on the classical single rate equation (SRE) model and the Drude model was used to track the material response and the transfer and deposition of laser energy. The numerical model was carried out via in-house code. An 800 nm wavelength laser with a spot radius of 3.5 μm and a pulse duration of 70 fs irradiates on the top surface of WS2. In this model, the dimension along r-direction parallel to the surface is 7 μm, and the thickness of WS2 is 210 nm. The step is set to 10 nm in r-direction and 3.75 nm in z-direction. The peak fluence of the laser is set at t = 70 fs, and the time step is 0.05 fs. The modeling focuses on the process of irradiation, in which only the carrier excitation and thermalization are taken into account [27]; thus, the generation of the free electrons driven by photoionization and impact ionization can be described as:
n e t = P I + β I n e
where ne is the free electron density, P(I) is the photoionization term relative to the laser intensity [28], and β(I) = aiI is the rate of impact ionization, where ai is 6.6 J/cm2 for WS2 [29]. The temperature of the electron subsystem (T) varies with electron density and absorption, which can be expressed as follows:
C e n e T t = α h I
where Ce is the specific heat, Ce = 1.5 kB, kB is the Boltzmann constant, and αh represents the absorption contributed by the electron heating. With the reflection and absorption effect accounted for during the injection of laser energy, the distribution of laser intensity inside WS2 can be expressed as:
I t , r , z = 2 F π / ln 2 t p 1 R exp r 2 r 0 2 4 ln 2 t t p 2 0 z α d z
where F is laser fluence, tp is the pulse duration, and R and α are the surface reflectivity and total absorption coefficient of the ionized WS2 as functions of time and space. According to Equation (4), the relationship between the plasma frequency (ωp) and the complex dielectric function (ε) can be obtained:
ε = ε 1 + ε 2 i = 1 + ε u n 1 N v n e N v ω p ω 2 1 1 + i 1 ω τ e
ω p = n e e 2 m e ε 0
where εun is the dielectric constant of unexcited material; Nv is the initial valence electron density in the WS2 film; ω is the laser frequency; and τe is the electron relaxation time determined by the electron–phonon and electron–ion collisions [30]. The complex refractive index (n) can be derived from Equation (6):
n = n + i k = ε 1 + i ε 2
n = ε 1 + ε 1 2 + ε 2 2 2
k = ε 1 + ε 1 2 + ε 2 2 2
where n is the normal refractive index; and k is the extinction coefficient. Thus, the R and αh function can be obtained via Equations (9) and (10).
R = n 1 2 + k 2 n + 1 2 + k 2
α h = 2 ω k c

3. Results and Discussion

Figure 1a–h depicts the evolution of the final morphology of craters at different laser fluences, and the expansion of craters is clearly dependent on fluence. The AFM micrographs of the samples are available in Figure S2. The crater morphologies can be divided into three types according to their structural characteristics. In type I, the crater is a shallow depression at a lower incident fluence. Type Ⅱ is an intermediate state between type I and type Ⅲ, in which some microcracks form in the center of the crater and become larger with increasing fluence. A further increase in incident laser fluence results in a type Ⅲ morphology, in which obvious material removal and a shallow depression form in the central and external regions, respectively. The ablation depth and external ring diameter are plotted in Figure 1i,j. The depth is directly proportional to the fluence. However, the size of the crater rapidly expands at a lower fluence and gradually stabilizes with the variation in fluence. The evolution of craters indicates a saturable absorption or shielding effect during irradiation, which is closely related to the laser fluence.
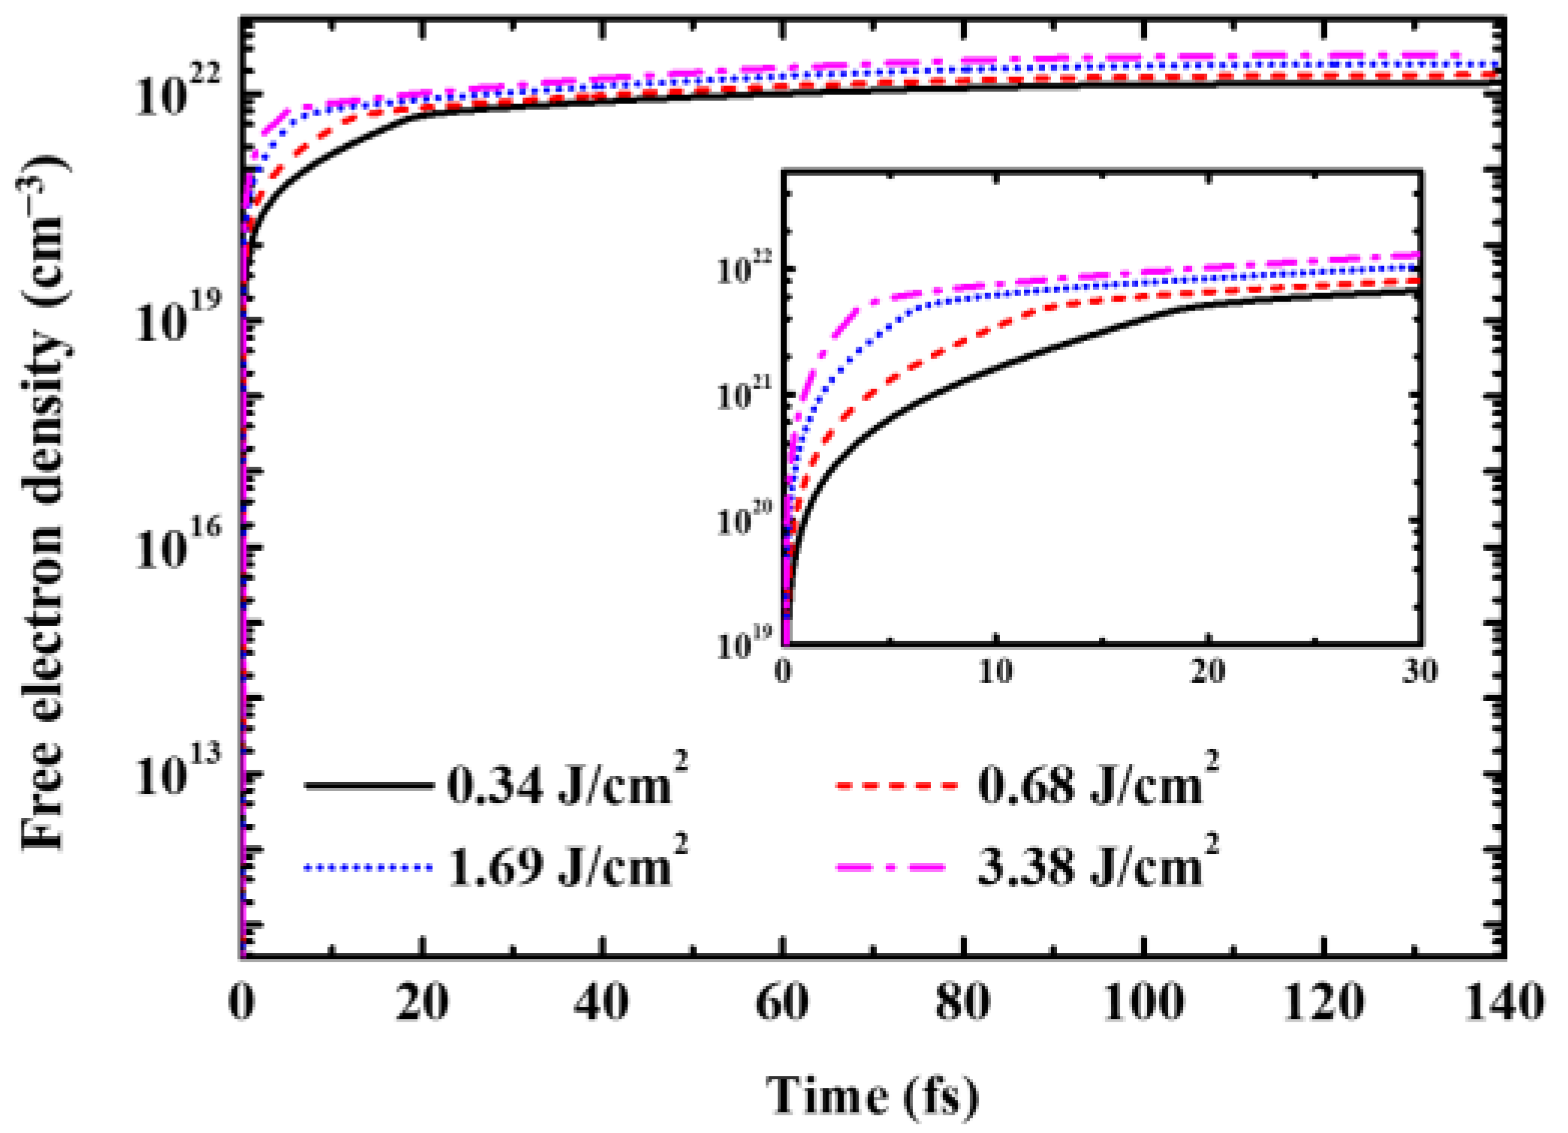
To identify the underlying mechanisms of the crater evolution, the interaction between laser and WS2 in the early stage is revealed through the plasma model, as shown in Figure 2, Figure 3 and Figure 4. During the FLT process, the irradiation of the laser beam rapidly ionizes the material due to its high peak power density, which changes the initial properties of the material and markedly influences the propagation and deposition of laser energy. Once the laser beam is incident on the WS2 surface, bound electrons in the irradiated region are instantly excited and subsequently transit from the valence band to the conduction band. As illustrated in Figure 2, the free electron density immensely increases in an ultrashort time domain at different fluences. The saturation of the increase in free electron density occurs before the laser intensity reaches its maximum value at 70 fs. Although the evolution of free electron density is similar at different fluences, the turning point occurs earlier as injected fluence increases, leading to a more intense ionization process at a higher incident laser fluence.
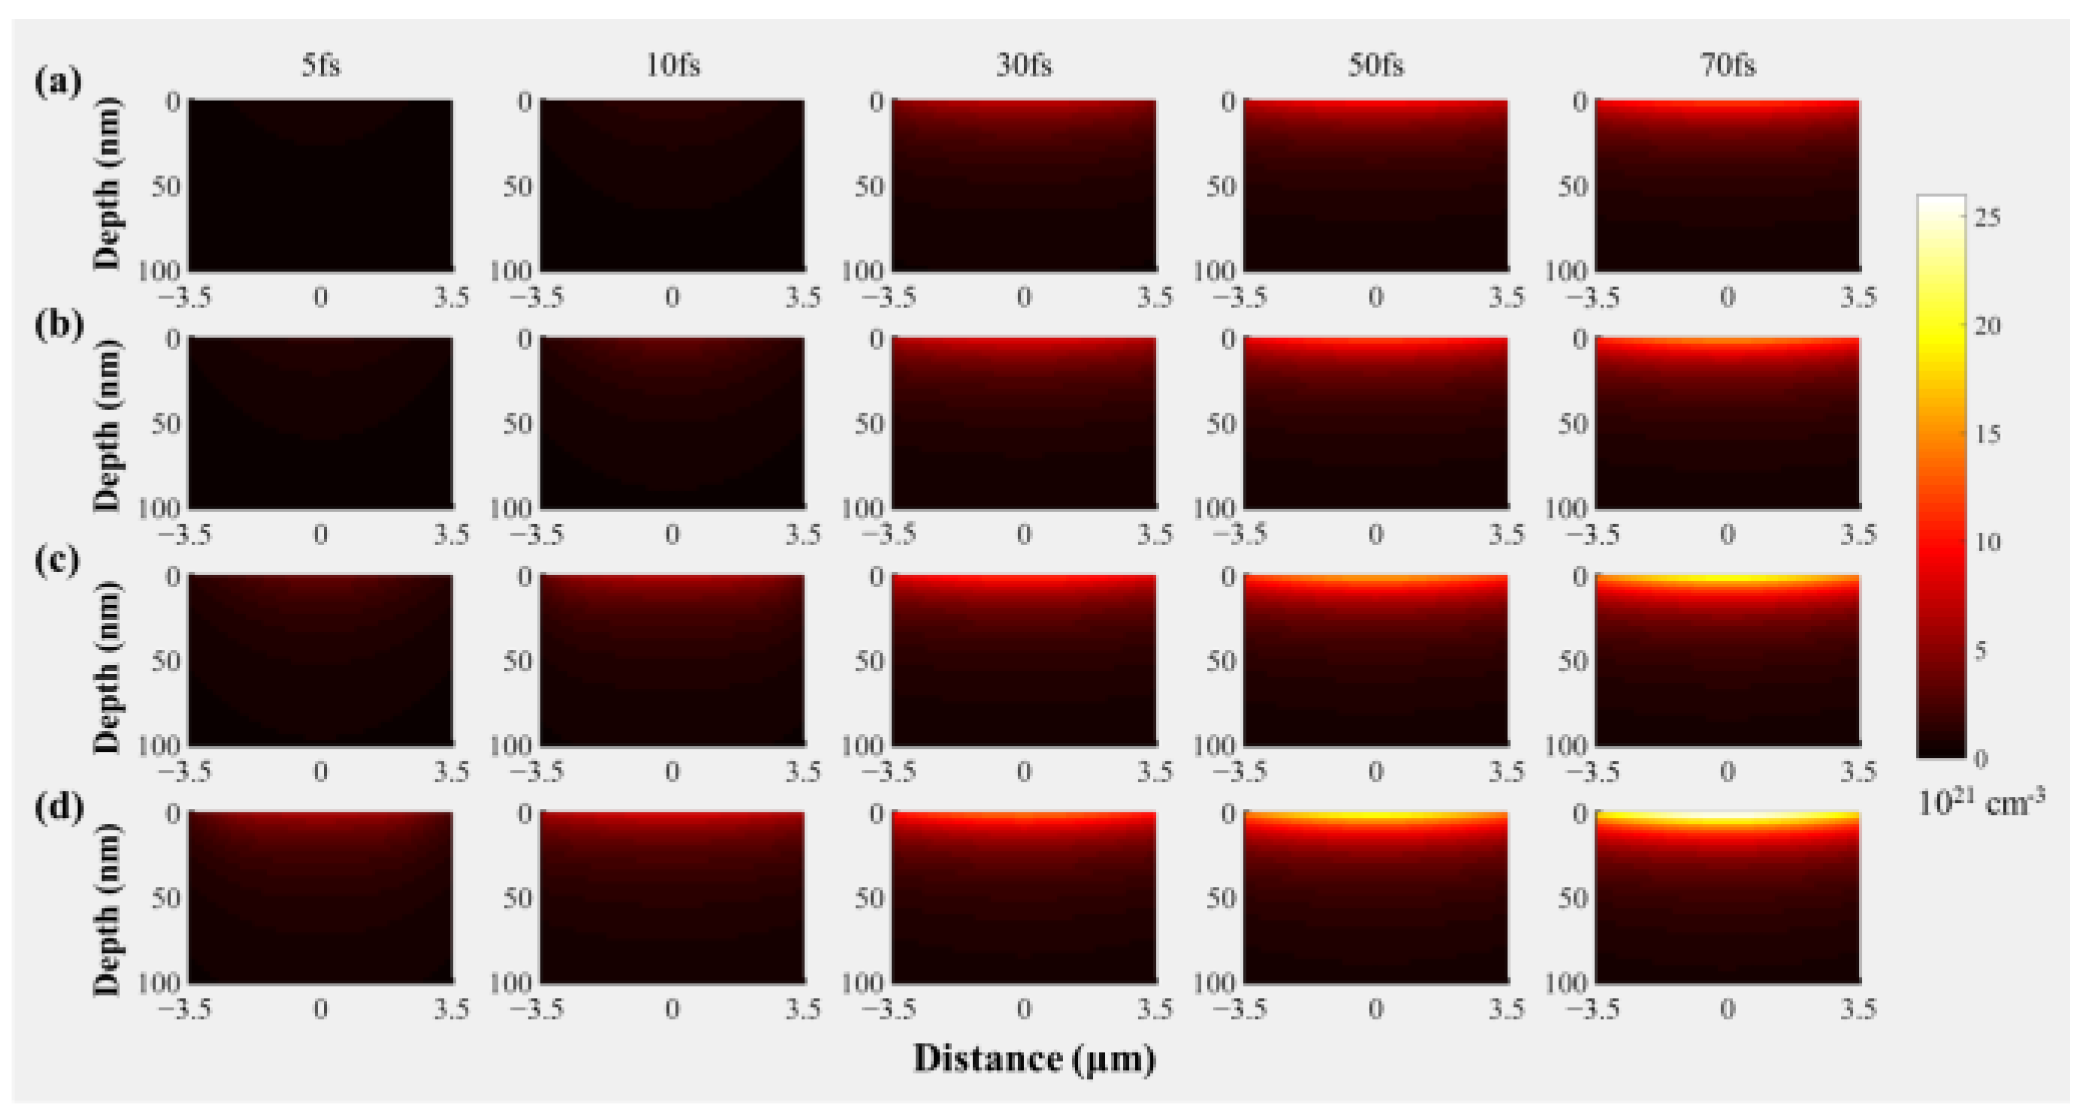
Figure 3 presents the distribution of free electron density inside WS2 after laser irradiation, where a dense plasma region forms as the energy injection increases. An examination of the dense zone at different times revealed that more free electrons are generated at a higher fluence. Although the electron density of the dense zone considerably increases at a high fluence, the region with relatively high density is always located in the shallow region below the surface. The distribution of the dense zone has a significant influence on the propagation and deposition of laser energy, which is mainly determined by the optical properties of the excited material.
At a fluence of 0.34 J/cm2, for example, the reflectivity and absorption coefficient dramatically change with the rapid increase in free electron density. As depicted in Figure 4a, when the electron density increases, the surface reflectivity first decreases from an initial value of 0.36 to a minimum value of 0.06 before rapidly increasing with the further increase in electron density to finally exceed 0.97. The change in reflectivity leads to the enhanced injection of energy in the early stage and almost total reflection when the electron density becomes saturable, as shown in Figure 2 and Figure 4a. Photons are absorbed to excite and heat electrons, and the absorption coefficient reflects the change in the electron density in the material. In Figure 4b, the rapid enhancement of absorption matches the evolution of the free electron density. The propagation of the laser beam inside the solid obeys the Beer–Lambert law and exponentially decreases with propagation depth. The increase in laser intensity before 20 fs, as illustrated in Figure 4c, is the result of the reduced surface reflection. The compound effect of reflection and absorption causes the original laser intensity distribution to sharply reform, which can be vividly observed in Figure 4e,f. With the further increase in reflectivity, only a small amount of energy can be effectively incident onto WS2, which affects the ablation. In general, the interaction between the laser and the excited WS2 enhances the reflection on the surface and the absorption within, which results in only a small amount of laser energy contributing to the ablation of WS2 and the trend of saturation in the expansion of the craters.
The evolutionary patterns of craters under varying fluences indicate that the expansions of the craters are similar in their depth and diameter. The surface morphology is dramatically altered as fluence increases. The section profiles are extracted and plotted in Figure 5a. The increases in depth and diameter are obvious, but the material removal in the external crater region remains stable at a high fluence. Thus, we propose two distinct mechanisms underlying material removal during the ablation of WS2, which can be distinguished by the critical threshold Fc.
According to the section profiles, the deepest position of the external crater is saturable when the fluence exceeds 0.83 J/cm2. Microcracks and deep hollows occur in the central region of the craters as the laser fluence increases. The critical threshold was determined to be between 0.83 and 1.69 J/cm2. When the incident laser fluence increases, the specific type of material removal in the internal and external crater regions is associated with the Gaussian-beam profile. We denote the diameter of the boundary of the internal and external regions as D, and the critical threshold could be obtained through a similar approach to that for the ablation threshold [31]. The fitting function is expressed as below, D 2 = 2 r 0 2 l n E P 2 r 0 2 l n π r 0 2 F c , where Ep is the energy of the laser obtained by photodiode sensors (Newport, 7N6161A); r0 is the beam waist radius. As described in Figure 5b, the value of Fc (0.85 J/cm2) can be obtained by extending the fitted line. When the local fluence is lower than the Fc, as is the case with a low incident fluence and the external part of a high incident fluence, slight material removal occurs. When the laser is incident on the material, the dense plasma region forms in the shallow layer below the surface of WS2. The emission of dense electrons on the surface, namely the Coulomb explosion, leads to shallow material removal in the irradiated region [32,33].
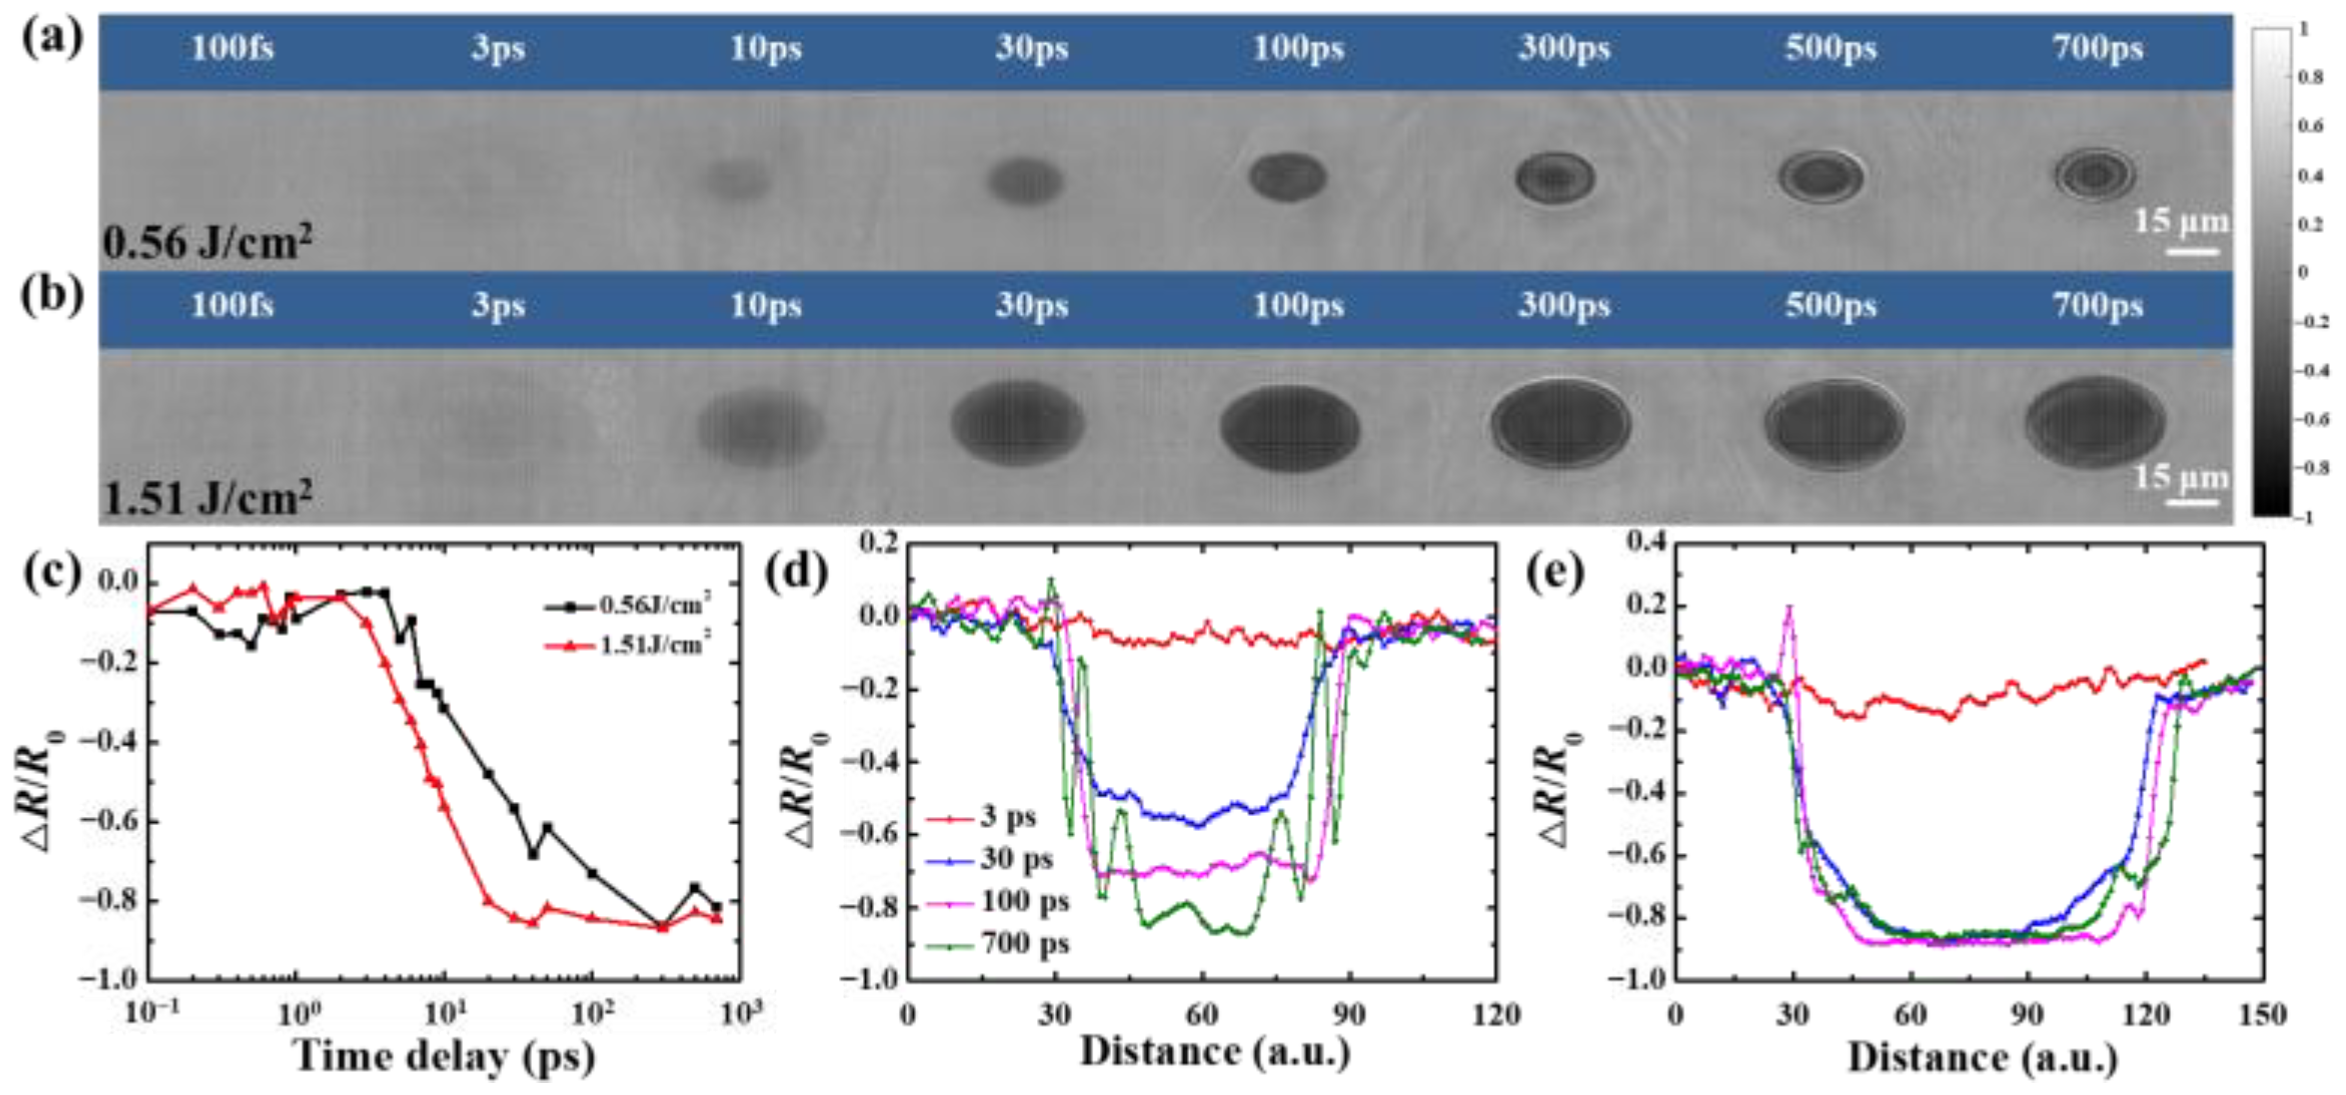
As the incident fluence increases, mild melting may first occur in the middle of the irradiation region. When a melting zone forms in the irradiated region, the optical response of this region changes with time. Hence, ultrafast reflectivity dynamics were analyzed to identify the underlying mechanisms of material removal at different fluences. As depicted in Figure 6a, a slight decrease in surface reflectivity indicates the beginning of ablation. When the heat transfer between the electron and lattice subsystem starts, the region of reflectivity decreases, gradually expands, and then reaches its maximum point at approximately 30 ps, as is the case with MoS2 [34]. The large decrease in reflectivity at 100 ps and the development of Newton rings can be attributed to the formation and motion of the liquid region [35]. In Figure 6c, the temporal evolution of transient reflectivity in the central region of irradiation is plotted as the function of delay time. The spatial distribution extracted from the short axis of the irradiated region is also plotted in Figure 6d,e. The surface reflectivity rapidly decreased at 1.51 J/cm2 and the interference fringes markedly varied at 0.56 J/cm2, which implies the formation of a larger and deeper liquid region at higher fluence. The superheated liquid phase results in dramatic material removal at the irradiation center, where the phase explosion is the dominant mechanism of material removal. During the process of resolidification, the destruction of the crystal structure leads to the formation of microcracks, as illustrated in Figure 1b,c. Additionally, the density gradient induced by the phase explosion drives the molten material towards the center, resulting in the formation of internal and external boundaries in the case of type Ⅲ morphology.
The modulation of FLT not only reflects in the surface morphology, but also in the changes of chemical components in the irradiation region [16]. The Raman spectra of pristine and treated WS2 are plotted in Figure 7a, the peaks located at 348.0, 353.6, and 418.4 cm−1 correspond to the first-order modes (A1g, E2g) and the second-order mode (2LA), respectively [36], which are still present after FLT. This confirms that the main molecular structure of WS2 is still intact after treatment. In addition, a slight red shift in E2g and A1g is observed, which can be attributed to the introduction of defects. Take a fluence of 0.68 J/cm2 as an example in Figure 7b, the broader A1g after FLT also indicates more defects in the treated WS2. The X-ray photoelectron spectra further describe the chemical state changes in the treated WS2 (at a fluence of 0.6 J/cm2). As depicted in Figure 7c,d, the peaks formed at 36.4 and 38.3 eV attest to the formation of WO3, as has been reported [37]. The peaks ascribed to W metal, which are located at 31.7 and 33.8 eV [38], can verify the occurrence of thermal decomposition in FLT. The results above demonstrate the modulation of chemical components and the defect state in FLT, which has a positive effect on the enhanced photoelectrocatalytic performance of pristine WS2 [10].
To further investigate the modulation of the surface defect state in FLT, morphology-dependent photoluminescence (PL) mapping was collected, as shown in Figure 8. The initial fluence, which results in a type Ⅲ morphology (1.69 J/cm2, as shown in Figure 1d), was chosen and the morphology of the crater is shown in Figure 8a. The image shown in Figure 8b illustrates the corresponding spatial distribution of the PL intensity over the sample surface. The PL intensity across the sample was extracted along the dotted horizontal blue line, as shown in Figure 8c. The correlation of surface morphologies with PL mapping demonstrates that the position of the PL maximum varies for different locations on the sample surface, which corresponds to various material removal mechanisms owing to different laser ablation fluences. In our case, the PL intensity is clearly related to defects, which are unevenly distributed in the crater. In the black area without PL enhancement, a significant amount of uniformly distributed nanoparticles were generated due to the Coulomb explosion at low laser fluences. Moreover, this area exhibits fewer defects compared to the bare area, where phase explosion and annealing dominate. When the number of defects increases, trapped excitons can be thermally activated into the delocalized states and captured by the lattice defect channels. Therefore, it is expected that the intensity of localized exciton emission increases with more electron–hole recombining [39]. As for the bright area contributed by the phase explosion related to high laser ablation fluences, the microcracks are caused by thermal stress accompanied with more defects, which generates stronger PL intensity. The dependence of morphology and PL demonstrates that the modulation of the local physical properties can be achieved in FLT due to the different material removal mechanisms.
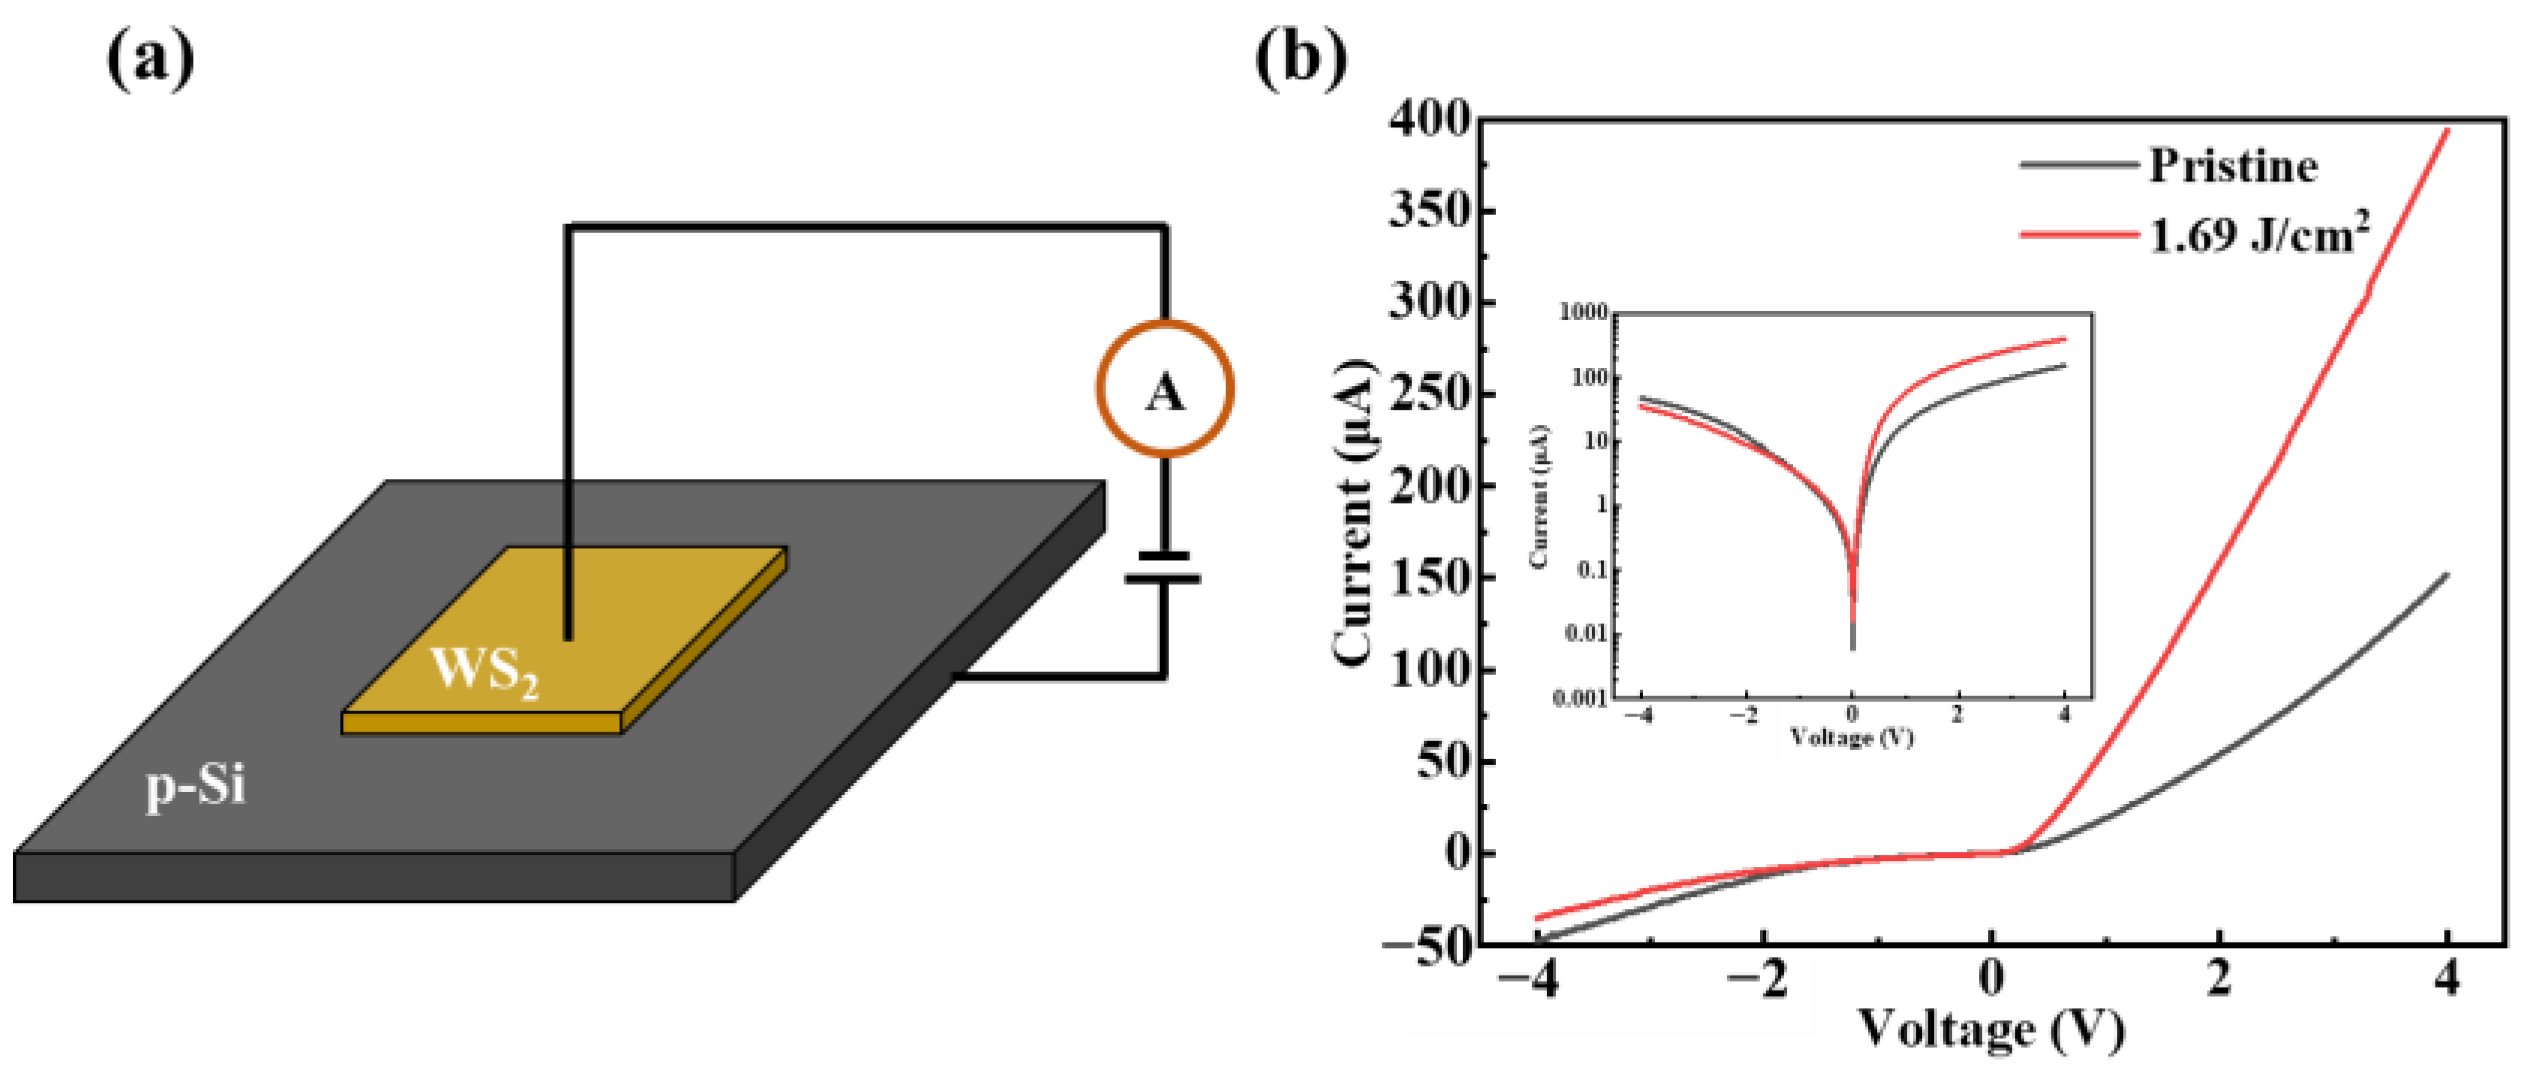
Furthermore, the properties of the WS2/Si p-n junction were investigated before and after the modulation in FLT. The multilayer WS2 was mechanically exfoliated onto p-type Si substrate to assemble a van der Waals p-n junction. A schematic of the device is shown in Figure 9a. The current-voltage (I-V) curve of the device is shown in Figure 9b and the inset shows the I-V curves on a logarithmic scale. Under forward bias, it can be seen that the device exhibits rectification behaviors similar to diodes. The device exhibits a 2.6 times enhancement on the current under forward bias after modulation, as shown in Figure 9b. This may be attributed to the formation of defects and O doping, which creates conditions for the generation of defective energy levels and impurity energy levels, leading to an increase in the number of carriers [40]. Thus, the electric conductivity of the device is improved. When reverse bias is larger than the breakdown voltage (around 1.5 V), the current rapidly increases, as shown in Figure 9b and the inset. This can be considered as a Zener breakdown [41,42], as the voltage is less than 4Eg/e [40]. Here, the Eg is the bandgap of the semiconductor (Eg, Si = 1.12 eV [43] and Eg, WS2 = 1.4–2.1 eV [44]) and e is the electron charge. Thus, the values of 4Eg/e for Si and WS2 are 4.48 V and 5.6–8.4 V. For our measurements, the reverse bias is within 4 V, which is less than the above calculated value. Therefore, the Zener breakdown occurred within our measurement, which indicates that the depletion layer width of WS2/Si p-n diode is sufficiently thin [40].

4. Conclusions

In this work, energy deposition and material removal in the ablation of WS2 using a femtosecond laser pulse were investigated through experiments and modeling. This study altered the incident fluence in the ablation to determine the evolutionary law of surface morphologies. The expansion of the craters was classified into the following three structural types: (Ⅰ) shallow depression, (Ⅱ) microcracks in the center, and (Ⅲ) craters with an internal hollow and external depression. The response of excited WS2 and the reforming of laser intensity were observed with reference to model calculations. During the process of irradiation, large amounts of free electrons were excited from the valence band to the conduction band and gave rise to the formation of a dense plasma region. This region enhanced the surface reflection and internal absorption, which impeded the normal incidence of the subsequent laser pulse, and most of the incident energy was deposited in the shallow layer below the surface. A critical threshold, Fc, was proposed to distinguish between two types of material removal mechanisms. When the incident fluence is lower than the Fc, a slight removal of material occurs due to the Coulomb explosion. When the incident fluence exceeds the Fc, dramatic material removal occurs in the central region with high local fluence, which is caused by phase explosion, and a shallow depression forms in the external region of the irradiation when the local fluence is lower than the Fc. Raman spectra and X-ray photoelectron spectra indicate the formation of defects and the modulation of chemical components. The PL enhancement in the phase explosion area and the PL attenuating in the Coulomb explosion area could be attributed to the diverse lattice defects with different mechanisms of material removal, respectively. The device of the WS2/Si p-n junction exhibits a 2.6 times enhancement on the current under forward bias after laser treatment, which is due to the generation of defective and impurity energy levels. The conditions for the generation of energy levels were provided by the formation of defects and the doping of O. The identification of energy deposition and material removal in the ablation of WS2 provides a feasible strategy for the study of other TMDCs and can assist in the modulation of WS2 with FLT.

Supplementary Materials

The following supporting information can be downloaded at: https://www.mdpi.com/article/10.3390/cryst13050832/s1, Figure S1: schematic diagram of pump-probe system; Figure S2: AFM micrographs of the samples.

Author Contributions

Conceptualization, K.W., Z.C. and J.S.; Data curation, J.S.; Formal analysis, Z.C., F.W. and K.Z.; Funding acquisition, Y.Y. and J.S.; Investigation, K.W., Z.C. and X.W.; Methodology, K.W., Z.C., Y.Y. and J.S.; Project administration, Y.Y. and J.S.; Resources, Y.Y. and J.S.; Software, K.W. and C.P.; Supervision, Y.Y. and J.S.; Validation, Z.C., X.W. and C.P.; Visualization, K.W., Z.C. and K.Z.; Writing—original draft, K.W., Z.C. and X.W.; Writing—review and editing, F.W., J.W., Y.Y. and J.S. All authors have read and agreed to the published version of the manuscript.

Funding

The authors acknowledge financial support received from the National Natural Science Foundation of China (Grant No. 62175253) and the National Natural Science Foundation of China (Grant No. 51975054).

Data Availability Statement

All data required to support this study are presented in the paper and the supplementary materials. Additional data are available from the authors upon reasonable request.

Conflicts of Interest

The authors declare no conflict of interest.

References

  1. Falin, A.; Holwill, M.; Lv, H.; Gan, W.; Cheng, J.; Zhang, R.; Qian, D.; Barnett, M.R.; Santos, E.J.G.; Novoselov, K.S. Mechanical Properties of Atomically Thin Tungsten Dichalcogenides: WS2, WSe2, and WTe2. ACS Nano 2021, 15, 2600–2610. [Google Scholar] [CrossRef]
  2. Sang, Y.; Zhao, Z.; Zhao, M.; Hao, P.; Leng, Y.; Liu, H. From UV to Near-infrared, WS2 Nanosheet: A Novel Photocatalyst for Full Solar Light Spectrum Photodegradation. Adv. Mater. 2015, 27, 363–369. [Google Scholar] [CrossRef] [PubMed]
  3. Ashraf, W.; Fatima, T.; Srivastava, K.; Khanuja, M. Superior Photocatalytic Activity of Tungsten Disulfide Nanostructures: Role of Morphology and Defects. Appl. Nanosci. 2019, 9, 1515–1529. [Google Scholar] [CrossRef]
  4. Kim, J.; Lee, E.; Mehta, G.; Choi, W. Stable and High-Performance Piezoelectric Sensor via CVD Grown WS2. Nanotechnology 2020, 31, 445203. [Google Scholar] [CrossRef]
  5. Afzal, A.M.; Iqbal, M.Z.; Dastgeer, G.; Nazir, G.; Mumtaz, S.; Usman, M.; Eom, J. WS2/GeSe/WS2 Bipolar Transistor-Based Chemical Sensor with Fast Response and Recovery Times. ACS Appl. Mater. Interfaces 2020, 12, 39524–39532. [Google Scholar] [CrossRef] [PubMed]
  6. Cheng, L.; Liu, J.; Gu, X.; Gong, H.; Shi, X.; Liu, T.; Wang, C.; Wang, X.; Liu, G.; Xing, H. PEGylated WS2 Nanosheets as a Multifunctional Theranostic Agent for in Vivo Dual-modal CT/Photoacoustic Imaging Guided Photothermal Therapy. Adv. Mater. 2014, 26, 1886–1893. [Google Scholar] [CrossRef]
  7. Khalil, H.M.W.; Khan, M.F.; Eom, J.; Noh, H. Highly Stable and Tunable Chemical Doping of Multilayer WS2 Field Effect Transistor: Reduction in Contact Resistance. ACS Appl. Mater. Interfaces 2015, 7, 23589–23596. [Google Scholar] [CrossRef] [PubMed]
  8. Caigas, S.P.; Cheng, M.-C.; Lin, T.-N.; Santiago, S.R.M.S.; Yuan, C.-T.; Yang, C.-C.; Chou, W.-C.; Shen, J.-L. P-Type Doping of WS2 Quantum Dots via Pulsed Laser Ablation. ACS Photonics 2018, 5, 4828–4837. [Google Scholar] [CrossRef]
  9. Kim, H.-C.; Kim, H.; Lee, J.-U.; Lee, H.-B.; Choi, D.-H.; Lee, J.-H.; Lee, W.H.; Jhang, S.H.; Park, B.H.; Cheong, H. Engineering Optical and Electronic Properties of WS2 by Varying the Number of Layers. ACS Nano 2015, 9, 6854–6860. [Google Scholar] [CrossRef]
  10. Ma, S.; Zeng, L.; Tao, L.; Tang, C.Y.; Yuan, H.; Long, H.; Cheng, P.K.; Chai, Y.; Chen, C.; Fung, K.H. Enhanced Photocatalytic Activity of WS2 Film by Laser Drilling to Produce Porous WS2/WO3 Heterostructure. Sci. Rep. 2017, 7, 3125. [Google Scholar] [CrossRef]
  11. Yang, X.; Tang, S.; Ding, G.; Xie, X.; Jiang, M.; Huang, F. Layer-by-Layer Thinning of Graphene by Plasma Irradiation and Post-Annealing. Nanotechnology 2011, 23, 25704. [Google Scholar] [CrossRef] [PubMed]
  12. Lu, J.; Lu, J.H.; Liu, H.; Liu, B.; Chan, K.X.; Lin, J.; Chen, W.; Loh, K.P.; Sow, C.H. Improved Photoelectrical Properties of MoS2 Films after Laser Micromachining. ACS Nano 2014, 8, 6334–6343. [Google Scholar] [CrossRef]
  13. Rani, R.; Dimple; Rani, R.; Jena, N.; Kundu, A.; De Sarkar, A.; Hazra, K.S. Controlled Formation of Nanostructures on MoS2 Layers by Focused Laser Irradiation. Appl. Phys. Lett. 2017, 110, 83101. [Google Scholar] [CrossRef]
  14. Xu, C.; Jiang, L.; Li, X.; Li, C.; Shao, C.; Zuo, P.; Liang, M.; Qu, L.; Cui, T. Miniaturized High-Performance Metallic 1T-Phase MoS2 Micro-Supercapacitors Fabricated by Temporally Shaped Femtosecond Pulses. Nano Energy 2020, 67, 104260. [Google Scholar] [CrossRef]
  15. Venkatakrishnan, A.; Chua, H.; Tan, P.; Hu, Z.; Liu, H.; Liu, Y.; Carvalho, A.; Lu, J.; Sow, C.H. Microsteganography on WS2 Monolayers Tailored by Direct Laser Painting. ACS Nano 2017, 11, 713–720. [Google Scholar] [CrossRef]
  16. Zuo, P.; Jiang, L.; Li, X.; Tian, M.; Xu, C.; Yuan, Y.; Ran, P.; Li, B.; Lu, Y. Maskless Micro/Nanopatterning and Bipolar Electrical Rectification of MoS2 Flakes through Femtosecond Laser Direct Writing. ACS Appl. Mater. Interfaces 2019, 11, 39334–39341. [Google Scholar] [CrossRef]
  17. Mahjouri-Samani, M.; Lin, M.-W.; Wang, K.; Lupini, A.R.; Lee, J.; Basile, L.; Boulesbaa, A.; Rouleau, C.M.; Puretzky, A.A.; Ivanov, I.N. Patterned Arrays of Lateral Heterojunctions within Monolayer Two-Dimensional Semiconductors. Nat. Commun. 2015, 6, 7749. [Google Scholar] [CrossRef]
  18. Zuo, P.; Jiang, L.; Li, X.; Ran, P.; Li, B.; Song, A.; Tian, M.; Ma, T.; Guo, B.; Qu, L. Enhancing Charge Transfer with Foreign Molecules through Femtosecond Laser Induced MoS2 Defect Sites for Photoluminescence Control and SERS Enhancement. Nanoscale 2019, 11, 485–494. [Google Scholar] [CrossRef]
  19. Zhang, L.; Nan, H.; Zhang, X.; Liang, Q.; Du, A.; Ni, Z.; Gu, X.; Ostrikov, K.; Xiao, S. 2D Atomic Crystal Molecular Superlattices by Soft Plasma Intercalation. Nat. Commun. 2020, 11, 5960. [Google Scholar] [CrossRef]
  20. Castellanos-Gomez, A.; Barkelid, M.; Goossens, A.M.; Calado, V.E.; van der Zant, H.S.J.; Steele, G.A. Laser-Thinning of MoS2: On Demand Generation of a Single-Layer Semiconductor. Nano Lett. 2012, 12, 3187–3192. [Google Scholar] [CrossRef]
  21. Alrasheed, A.; Gorham, J.M.; Tran Khac, B.C.; Alsaffar, F.; DelRio, F.W.; Chung, K.-H.; Amer, M.R. Surface Properties of Laser-Treated Molybdenum Disulfide Nanosheets for Optoelectronic Applications. ACS Appl. Mater. Interfaces 2018, 10, 18104–18112. [Google Scholar] [CrossRef] [PubMed]
  22. Ardekani, H.; Younts, R.; Yu, Y.; Cao, L.; Gundogdu, K. Reversible Photoluminescence Tuning by Defect Passivation via Laser Irradiation on Aged Monolayer MoS2. ACS Appl. Mater. Interfaces 2019, 11, 38240–38246. [Google Scholar] [CrossRef]
  23. Hu, L.; Shan, X.; Wu, Y.; Zhao, J.; Lu, X. Laser Thinning and Patterning of MoS2 with Layer-by-Layer Precision. Sci. Rep. 2017, 7, 15538. [Google Scholar] [CrossRef]
  24. Jiang, L.; Wang, A.-D.; Li, B.; Cui, T.-H.; Lu, Y.-F. Electrons Dynamics Control by Shaping Femtosecond Laser Pulses in Micro/Nanofabrication: Modeling, Method, Measurement and Application. Light Sci. Appl. 2018, 7, 17134. [Google Scholar] [CrossRef]
  25. Han, G.H.; Chae, S.J.; Kim, E.S.; Gunes, F.; Lee, I.H.; Lee, S.W.; Lee, S.Y.; Lim, S.C.; Jeong, H.K.; Jeong, M.S. Laser Thinning for Monolayer Graphene Formation: Heat Sink and Interference Effect. ACS Nano 2011, 5, 263–268. [Google Scholar] [CrossRef]
  26. Gu, E.; Wang, Q.; Zhang, Y.; Cong, C.; Hu, L.; Tian, P.; Liu, R.; Zhang, S.-L.; Qiu, Z.-J. A Real-Time Raman Spectroscopy Study of the Dynamics of Laser-Thinning of MoS2 Flakes to Monolayers. AIP Adv. 2017, 7, 125329. [Google Scholar] [CrossRef]
  27. Sundaram, S.K.; Mazur, E. Inducing and Probing Non-Thermal Transitions in Semiconductors Using Femtosecond Laser Pulses. Nat. Mater. 2002, 1, 217–224. [Google Scholar] [CrossRef] [PubMed]
  28. Vaidyanathan, A.; Mitra, S.S.; Narducci, L.M.; Shatas, R.A. One-Photon Absorption in Direct Gap Semiconductors. Solid State Commun. 1977, 21, 405–407. [Google Scholar] [CrossRef]
  29. Jing, X.; Tian, Y.; Zhang, J.; Chen, S.; Jin, Y.; Shao, J.; Fan, Z. Modeling Validity of Femtosecond Laser Breakdown in Wide Bandgap Dielectrics. Appl. Surf. Sci. 2012, 258, 4741–4749. [Google Scholar] [CrossRef]
  30. Jiang, L.; Tsai, H.-L. Energy Transport and Material Removal in Wide Bandgap Materials by a Femtosecond Laser Pulse. Int. J. Heat Mass Transf. 2005, 48, 487–499. [Google Scholar] [CrossRef]
  31. Liu, J.M. Simple Technique for Measurements of Pulsed Gaussian-Beam Spot Sizes. Opt. Lett. 1982, 7, 196–198. [Google Scholar] [CrossRef]
  32. Siegel, J.; Puerto, D.; Gawelda, W.; Bachelier, G.; Solis, J.; Ehrentraut, L.; Bonse, J. Plasma Formation and Structural Modification below the Visible Ablation Threshold in Fused Silica upon Femtosecond Laser Irradiation. Appl. Phys. Lett. 2007, 91, 82902. [Google Scholar] [CrossRef]
  33. Hernandez-Rueda, J.; Puerto, D.; Siegel, J.; Galvan-Sosa, M.; Solis, J. Plasma Dynamics and Structural Modifications Induced by Femtosecond Laser Pulses in Quartz. Appl. Surf. Sci. 2012, 258, 9389–9393. [Google Scholar] [CrossRef]
  34. Pan, C.; Jiang, L.; Sun, J.; Wang, Q.; Wang, F.; Wang, K.; Lu, Y.; Wang, Y.; Qu, L.; Cui, T. Ultrafast Optical Response and Ablation Mechanisms of Molybdenum Disulfide under Intense Femtosecond Laser Irradiation. Light Sci. Appl. 2020, 9, 80. [Google Scholar] [CrossRef] [PubMed]
  35. Hernandez-Rueda, J.; Siegel, J.; García-Lechuga, M.; Solis, J. Femtosecond Laser-Induced Refractive Index Changes at the Surface of Dielectrics: Quantification Based on Newton Ring Analysis. JOSA B 2014, 31, 1676–1683. [Google Scholar] [CrossRef]
  36. Berkdemir, A.; Gutiérrez, H.R.; Botello-Méndez, A.R.; Perea-López, N.; Elías, A.L.; Chia, C.-I.; Wang, B.; Crespi, V.H.; López-Urías, F.; Charlier, J.-C. Identification of Individual and Few Layers of WS2 Using Raman Spectroscopy. Sci. Rep. 2013, 3, 1755. [Google Scholar] [CrossRef]
  37. Zhou, P.; Xu, Q.; Li, H.; Wang, Y.; Yan, B.; Zhou, Y.; Chen, J.; Zhang, J.; Wang, K. Fabrication of Two-Dimensional Lateral Heterostructures of WS2/WO3 H2O Through Selective Oxidation of Monolayer WS2. Angew. Chemie 2015, 127, 15441–15445. [Google Scholar] [CrossRef]
  38. Sundberg, J.; Lindblad, R.; Gorgoi, M.; Rensmo, H.; Jansson, U.; Lindblad, A. Understanding the Effects of Sputter Damage in W–S Thin Films by HAXPES. Appl. Surf. Sci. 2014, 305, 203–213. [Google Scholar] [CrossRef]
  39. Gutiérrez, H.R.; Perea-López, N.; Elías, A.L.; Berkdemir, A.; Wang, B.; Lv, R.; López-Urías, F.; Crespi, V.H.; Terrones, H.; Terrones, M. Extraordinary Room-Temperature Photoluminescence in Triangular WS2 Monolayers. Nano Lett. 2013, 13, 3447–3454. [Google Scholar] [CrossRef]
  40. Sze, S.M.; Li, Y.; Ng, K.K. Physics of Semiconductor Devices; John Wiley & Sons: Hoboken, NJ, USA, 2021. [Google Scholar]
  41. Aftab, S.; Khan, M.F.; Min, K.-A.; Nazir, G.; Afzal, A.M.; Dastgeer, G.; Akhtar, I.; Seo, Y.; Hong, S.; Eom, J. Van Der Waals Heterojunction Diode Composed of WS2 Flake Placed on P-Type Si Substrate. Nanotechnology 2017, 29, 45201. [Google Scholar] [CrossRef]
  42. Lan, C.; Li, C.; Wang, S.; He, T.; Jiao, T.; Wei, D.; Jing, W.; Li, L.; Liu, Y. Zener Tunneling and Photoresponse of a WS2/Si van Der Waals Heterojunction. ACS Appl. Mater. Interfaces 2016, 8, 18375–18382. [Google Scholar] [CrossRef]
  43. Hao, L.; Liu, Y.; Gao, W.; Han, Z.; Xue, Q.; Zeng, H.; Wu, Z.; Zhu, J.; Zhang, W. Electrical and Photovoltaic Characteristics of MoS2/Si Pn Junctions. J. Appl. Phys. 2015, 117, 114502. [Google Scholar] [CrossRef]
  44. Iqbal, M.W.; Iqbal, M.Z.; Khan, M.F.; Shehzad, M.A.; Seo, Y.; Park, J.H.; Hwang, C.; Eom, J. High-Mobility and Air-Stable Single-Layer WS2 Field-Effect Transistors Sandwiched between Chemical Vapor Deposition-Grown Hexagonal BN Films. Sci. Rep. 2015, 5, 10699. [Google Scholar] [CrossRef]
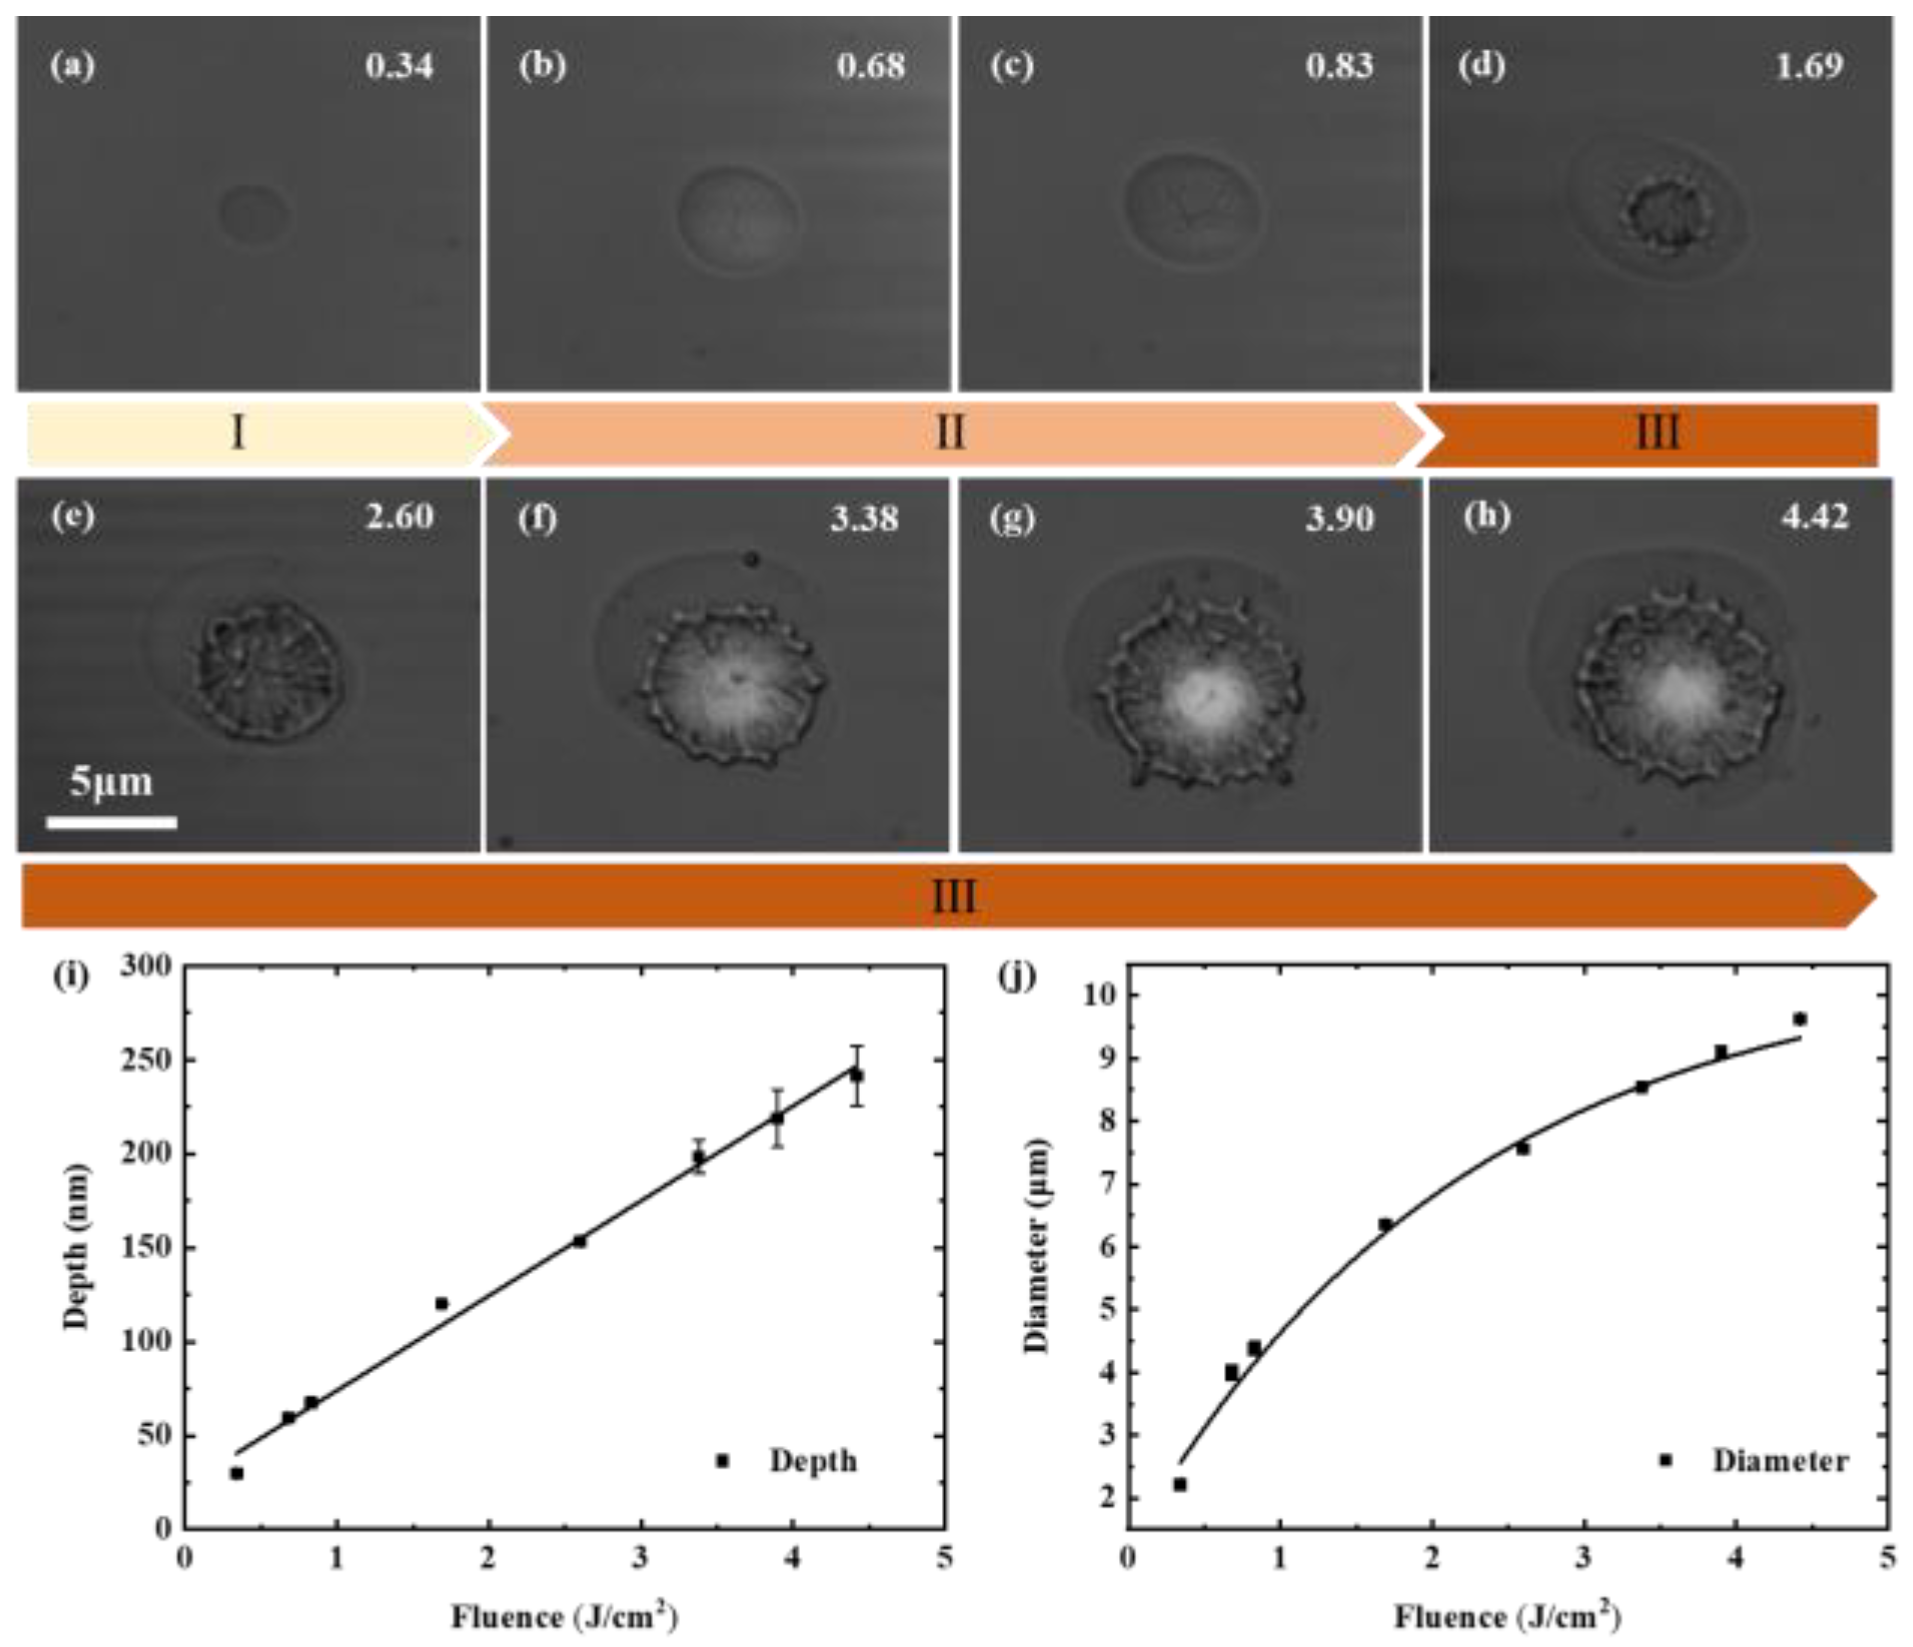
Figure 1. Evolution of craters with increasing laser fluence. (ah) Surface morphologies of craters at different fluences, where Ⅰ, Ⅱ, and Ⅲ represent the three different morphological types; (i) depth and (j) diameter of craters as functions of fluences. The black lines represent the (i) linear and (j) exponential fitting results of experimental data.
Crystals 13 00832 g001
Figure 2. Evolution of free electron density at the central region of the irradiated surface obtained from numerical simulation.
Crystals 13 00832 g002
Figure 3. Evolution of free electron density inside the irradiated WS2 at a fluence of (a) 0.34 J/cm2; (b) 0.68 J/cm2; (c) 1.69 J/cm2; and (d) 3.38 J/cm2 obtained from numerical simulation.
Crystals 13 00832 g003
Figure 4. Optical response and the evolution of laser intensity in the irradiated WS2 at a fluence of 0.34 J/cm2 obtained from numerical simulation. (a) Surface reflectivity and (b) absorption coefficient of the central region. (c) The evolution of laser intensity at different depths plotted as functions of time. (df) The distribution of laser intensity inside the irradiated WS2.
Crystals 13 00832 g004
Figure 5. (a) Section profiles of the craters at different fluences obtained by AFM. (b) Diameter (squared) of the boundary of the internal and external region of the crater versus the incident laser energy, and the material removal mechanisms at (c) low and (d) high fluence.
Crystals 13 00832 g005
Figure 6. Transient reflectivity images of WS2 at different delay times after the excitation of the pump pulse, (a) 0.56 and (b) 1.51 J/cm2. (c) Temporal evolution of transient reflectivity extracted from the center of irradiation. Distribution of transient reflectivity extracted from the short axis of irradiation with (d) 0.56 and (e) 1.51 J/cm2.
Crystals 13 00832 g006
Figure 7. Raman spectra (a,b) and XPS spectra (c,d) of pristine and treated WS2 films using FLT.
Crystals 13 00832 g007
Figure 8. (a) Surface morphologies of craters at a fluence of 1.69 J/cm2 and (b) the corresponding PL mapping images. (c) PL intensity profile along the dotted horizontal blue line.
Crystals 13 00832 g008
Figure 9. (a) Schematic of WS2/Si van der Waals heterojunction device. (b) I-V curves of WS2/Si junction before and after ablation at a fluence of 1.69 J/cm2. The inset shows the I-V curves on a logarithmic scale.
Crystals 13 00832 g009
Disclaimer/Publisher’s Note: The statements, opinions and data contained in all publications are solely those of the individual author(s) and contributor(s) and not of MDPI and/or the editor(s). MDPI and/or the editor(s) disclaim responsibility for any injury to people or property resulting from any ideas, methods, instructions or products referred to in the content.