Abstract
The corrosion behavior of copper and copper-functionalized boron nitride nanocomposites (Cu-BNNS) was studied in a 3.5 wt.% NaCl solution. Polarization curves and cyclic voltammetry experiments were used to differentiate the various stages of corrosion behavior. Additionally, electrochemical impedance spectroscopy (EIS) was used to understand the different steps in the degradation mechanism. The EIS results were analyzed using adsorption models at open circuit potential and at a bias potential of 250 mV, and different reaction kinetics parameters were quantified. During the first hour of immersion, the formation of CuCl increased on the Cu-BNNS, where the reaction constant for the formation of adsorbed CuCl was lower in the impedance model. However, on the Cu electrode, CuCl was not formed during the first hour, and the reaction constant was higher. The proposed model is consistent with the experimental observations from cyclic voltammetry, polarization, and scanning electron microscopy.
1. Introduction
Corrosion is a critical issue in various industries, including automotive, electronics, infrastructure, and defense. As a result, significant research has been undertaken to mitigate the corrosion process by using coatings. Hexagonal-BN has received considerable attention in this context, particularly for low-temperature applications. BN is hydrophobic and impermeable to corrosive ions [1,2,3,4]. However, research on this topic is still in its early stages. For instance, h-BN nano-sheets (BNNS) have been deposited on copper using chemical vapor deposition. The sample with BN coating exhibited a higher open circuit potential and lower anodic currents in a NaCl solution [3]. In another investigation, a BN and polyvinyl alcohol hybrid coating was used on 316 L stainless steel. The hybrid coating demonstrated a low corrosion current due to the hydrophobic, inert, and dielectric nature of BN in synthetic seawater [2]. The corrosion techniques employed in this research included polarization curves, Tafel extrapolation [2,3], and electrochemical impedance spectroscopy [3].
Many electrochemical techniques used in corrosion studies are based on direct current (DC). DC techniques, such as polarization, polarization resistance, and cyclic voltammetry, are based on the potential change resulting from a flow of current (polarization) [5]. DC techniques provide mechanistic information on the corrosion processes. However, they require high polarization, which can lead to surface modification, and consistent results may require several samples.
Another electrochemical approach in the frequency domain is electrochemical impedance spectroscopy (EIS), which can provide mechanistic information without requiring high polarization levels due to the variable frequency [5]. Alternating current (AC) interacts with specific dipoles at different matter levels based on the frequency value. For example, frequencies ranging from 10−2 to 105 Hz can be used to study interfacial phenomena such as corrosion [5].
The results of EIS are analyzed using electric analogs, transmission line modeling, electrochemical reaction mechanisms, and deterministic models [6]. Electric analogs or equivalent circuits are the first and most straightforward approach for analyzing impedance results. Equivalent circuits are versatile in research where the system details are well-known. However, they have limitations concerning physical interpretation, such as geometry sense in porous systems and diffusion phenomena in complex geometries [6].
Therefore, other methods must be employed to describe EIS results for systems in which the adsorption of intermediates is taking place, such as an electrochemical reaction mechanism [6]. However, assigning a corrosion mechanism using only EIS is complex, and it is essential to use other electrochemical, chemical, and characterization techniques [7,8].
The corrosion of copper by NaCl has been previously studied, and a reaction mechanism was proposed [9,10,11]. The corrosion of copper is associated with a dissolution process, the formation of complex compounds, the adsorption of species, the formation of oxides/hydroxides, reduction reactions from these oxides/hydroxides, and mass transfer [9,10,11]. While some steps in the copper corrosion process can be quantified with an electric analog, adsorption cannot be.
The adsorption phenomenon can be explained using an electrochemical reaction model developed for nickel and cobalt by Epelboin [12], for iron in acidified solutions by Keddam [13], and for aluminum by Macdonald [14]. These models use a small sine wave perturbation of potential to quantify the electrochemical reaction constants, the coverage factor of different intermediates adsorbed at the interface, and the double-layer capacitance.
The purpose of this framework is to describe the electrochemical reaction mechanism of a copper film electrode, and another composed of a Cu-thiosemicarbazide-BNNS in NaCl using EIS as the primary tool. The main variables of the process are quantified using the adsorption model, and the analysis is supported by polarization and cyclic voltammetry.
2. Materials and Methods
2.1. Formation of Boron Nitride Nano-Sheets and Functionalization with Thiosemicarbazide
Hexagonal boron nitride (h-BN) was synthesized by the reaction between boric acid and ammonia at 900 °C. The functionalization was done by reaction between h-BN and thiosemicarbazide (CH5N3S) in N-Methlyl-2-pyrrolidone (C5H9NO) (1:10:100 wt.%). The reaction was carried at 170 °C for 30 h under N2 bubbling. The product was dialyzed in C5H9NO for 10 h to remove the unreacted ligands and then centrifuged at 3500 rpm for 15 min. The supernatant was removed, and the precipitate was dried at 75 °C in a vacuum furnace.
2.2. Preparation of the Copper and Composite Copper-Thiosemicarbazide-BNNS Films
Thin nanocomposite films were prepared using the electrodeposition method. The aqueous electrolyte solutions were prepared by 1 M CuSO4∙5H2O, 1.8 M H2SO4, a trace amount of CuCl2, and 6 wt.% f-BNNS. The solution was bath sonicated for 20 min to ensure homogenous dispersion of f-BNNs before transferring it to the electroplating cell. A pure copper sheet (>99%) and an aluminum substrate were used as an anode and cathode, respectively. The electrical power source was a Nuvant Powerstat05 Potentiostat (Nuvant Systems Inc., Crown Point, IN, USA). The electrodeposition was carried out at a current density of 10 A/dm2 and AC frequency of 950 Hz with 30% off time.
The copper deposition was done using the previous variables described above but without adding f-BNNS within the electrolyte. The films were detached from the aluminum electrode for their subsequent electrochemical testing.
2.3. Electrochemical Measurements
Electrochemical measurements were performed using a Gamry Instruments potentiostat (Interface 1000 model) in a standard three-electrode system at 25 °C—an aerated solution of 3.5 wt.% NaCl was used as an electrolyte. The electrochemical cell consists of copper or copper metal matrix composite with an exposed area of 1 cm2 as the working electrode. The films were supported on a plastic substrate to avoid interference with a metallic substrate and mechanical damage. A saturated Ag/AgCl electrode was the reference electrode, and a Pt/Nb mesh electrode of 2 cm diameter was the counter electrode.
The working electrode was immersed in the testing solution for 1 h to reach a quasi-stationary value of the open circuit potential prior to measurement. All the electrochemical experiments were repeated in duplicate to ensure good reproducibility of the results.
Potentiodynamic polarization measurements were carried out in the potential range from −300 mV to 1000 mV vs. open circuit potential with the scanning rate of 0.5 mV s−1. The measurements were done after 1 h of immersion. Following the potentiodynamic polarization scan, three different DC anodic polarization potentials were identified, which were 250, 400, and 600 mV vs. open circuit potential.
Electrochemical impedance spectroscopy (EIS) was measured at open circuit potential and the mentioned bias potentials after 1 h of immersion. An AC perturbation of 5 mV was applied in a frequency range from 10 kHz to 10 mHz recording 10 points per decade.
Cyclic Voltammetry (CV) was applied to both materials after 1 h of monitoring the open circuit potential (Eocp). The forward scan started at Eocp and had a vertex potential of 1 at 0.9 V vs. Eocp. The backward scan started at vertex potential (E1) and a vertex potential (E2) at −0.9 V vs. Eocp. Finally, the scan went from the vertex (E2) to the corrosion potential. Five cycles were done with a scan rate of 5 mV s−1.
2.4. Microstructural Characterization
Analysis of the surface morphology of these materials before and after the corrosion test in the 3.5 wt.% NaCl electrolyte solutions have been studied using scanning electron microscopy, Tescan Vega Microscope (TESCAN, Brno, Czech Republic), at an accelerating voltage of 20.0 kV. The Energy Disperse X-ray Spectroscopy (EDS) analysis was done with an Oxford EDS detector coupled to the microscopy.
3. Results and Discussion
3.1. Morphology of Copper and Composite Film after Deposition
The surface of the Cu deposit is shown in Figure 1a. The Cu film does not have a flat and homogenous surface; grains of different sizes were acquired with a rough surface due to the different growing kinetics during the electrodeposition. The surface of the composite Cu-Thiosemicarbazide-BNNS (Cu-BNNS) material is shown in Figure 1b. Like the copper film, the nanocomposite film has a relatively rough surface but smaller grain sizes than the pure copper samples. It is due to the interaction among the Cu-Thiosemicarbazide-BNNS. The f-BNNS are found to be mainly localized at the copper grain boundaries during the electroplating process, as reported previously [15]. A scheme is displayed in Figure 1c. The f-BNNS are located at the grain boundaries, as shown in Figure 1d, and the EDS result shows the B, N and Cu in these locations.
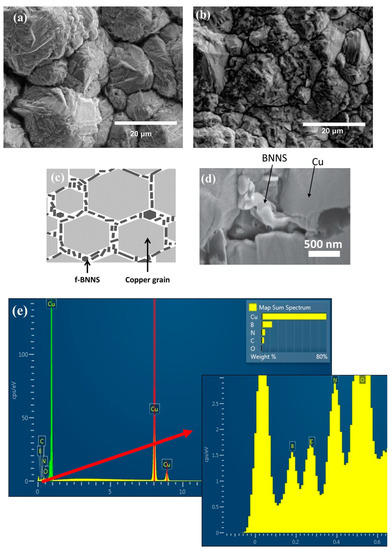
Figure 1.
Scanning electron microscopy images of the Cu film (a), the Cu-thiosemicarbizide-BNNS sample after electrodeposition (b), the scheme showing the Cu and BNNS areas in the copper matrix (c), BNNS located at the grain boundaries of copper (d) and EDS at the grain boundary (e) with a zoom of its left corner.
3.2. Polarization Results
The polarization results are shown in Figure 2. The corrosion behavior is consistent with previous research [16,17,18,19]. Cu shows a reduction reaction associated with oxygen in a solution of 3.5 wt.% NaCl [18,19]. The anodic activation zone (section I) from the corrosion potential (Ecorr) to the Flade’s potential (Ef) has been related to a mixed control (activation-diffusion) [19]. At the Flade’s potential, the current has a decrement (section II) linked to forming a passive layer [19]. At higher potentials (section III), the current increment with different slopes is due to forming of cupric ion compounds [19].
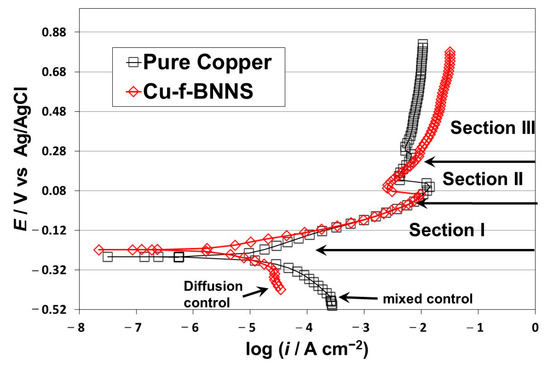
Figure 2.
Polarization curves for Cu and Cu-BNNS.
The critical points of the polarization results are shown in Figure 2. The Cu-f-BNNS electrode has a diffusion control behavior in the cathodic reaction with a slope of −0.072 V dec−1 and a limit current of 4 × 10⁻⁵ A cm−2. On the other side, the Cu electrode has a mixed control (activation-diffusion process) related to the oxygen reduction reaction with a slope of −0.080 V dec−1 and a limit current of 2.6 × 10⁻⁵ A cm−2. The corrosion potential of Cu-f-BNNS is −0.226 V, slightly higher than Cu with −0.254 V. The anodic activation (section I) behavior for Cu-f-BNNS has a lower slope (0.065 V dec−1) than for Cu (−0.085 V dec−1), but the behavior is overlapped from −0.12 to 0.08 V. In section II, Flade’s point is lower for Cu-f-BNNS than for Cu: 0.060 V and 0.098 V, respectively. In section III, Cu-BNNS has a higher potential-current slope than Cu. It indicates that the transformation of Cu+ to Cu+2 is more significant in the Cu-f-BNNS electrode.
The apparent activation control of the anodic behavior has been established as a mixed control (activation-diffusion) [16,20,21]. This is shown in Equation (1), where there is a component for the diffusion of CuCl−2, another for the Cl− concentration, and a third for the electrochemical dissolution of Cu [16,20,21]. The chloride concentration is 0.6 M. The diffusion component and the effect of Cl− are involved in aa constant of the Tafel anodic Equation (2). The activation-diffusion in the cathodic branch was assigned with Equation (3) [22].
where E is the potential; i the current; an the intercept; bn the Tafel slope; n is the cathodic or anodic branch; and ilc the limit cathodic current. The meaning of the other variables is claimed in the Impedance electrochemical model description.
3.3. Cyclic Voltammetry Results
The CV results for the copper sample are shown in Figure 3a. The forward scan shows three peaks at 0.050 V (A1), 0.280 V (A2), and 0.525 V (A3), respectively. In the backward scan, there is one apparent small peak at ≈−0.075 V (A4), followed by another more prominent peak at −0.75 V (A5). A small peak at −0.95 V (A6) was also noted. No current increment was found from the vertex potential (E2) to the Eocp. The reaction mechanism of Cu in NaCl solution has been studied extensively and different options were proposed [10,19,23,24]. The first peak (A1) is associated with reaction (4) (formation of the CuCl), the second peak (A2) with reaction (6) (the formation of Cu+2 from CuCl), and the third apparent peak (A3) is related to pitting. In the backward scan, the peak number 4 (A4) is linked to the partially reverse behavior of reaction (4) due to the competition between dissolution and precipitation of CuCl [25]; the peak (A5) is associated with the reduction of the CuCl, and Cu2O [26,27]; and the peak A6 could be the response of the CuO reduction [26].
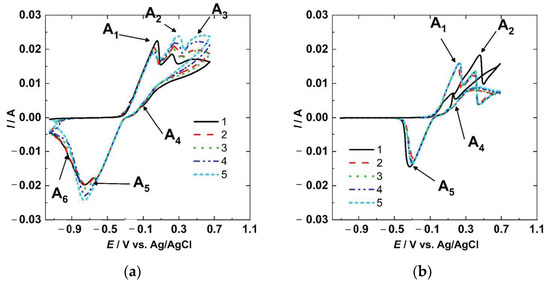
Figure 3.
Cyclic voltammetry for Cu (a) and Cu-BNNS (b).
The results for Cu-BNNS are shown in Figure 3b. Two peaks were obtained in the forward anodic scan at ≈0.2 and ≈0.4 V, and two in the cathodic reverse scan at 0.2 and −0.3 V. The peaks were associated with the same reactions as the copper sample. However, the Cu-BNNS sample had fewer reaction peaks than the copper sample. The A1 anodic peak was related to reaction (4) (formation of CuCl), and the A2 corresponded to reaction (6) (formation of Cu+2). In contrast, the cathodic peak A4 (dissociation of CuCl) is evidence of reversibility of reaction (4), and the cathodic peak A5 could be the evidence of reaction (7) (production of Cu2O from ). The peak A3 was not obtained at this scan rate, but the pitting behavior is evident, like the previous behavior obtained in steel [28] and mentioned in copper [29].
here ki refers to the reaction constants.
The two electrodes had different responses due to the BNNS in the copper matrix. The copper electrode had more oxidation and reduction peaks than the Cu-BNNS. Both electrodes had been immersed in the solution for 1 h before the CV was done, but copper had generated a layer of Cu2O and CuO, while Cu-BNNS had one layer of Cu2O. It is supported by the fact that Cu has two reduction peaks at −0.75 and −0.90 V, and Cu-BNNS has one at −0.25 V. The peak A4 (dissociation of CuCl) was found in the first scan of the Cu-BNNS, but it is minimal in the Cu results. The peak A4 (dissociation of CuCl) has been explained in terms of the reduction of CuCl followed by an increment of Cl− concentration, increasing the dissolution rate. In addition, the dissolution could be diminished due to the layer acquired in the oxidation and free polarization time. These factors lead to the anodic peak (A4) in a reverse scan (reduction polarization) [25,30]. This peak could have a better resolution with the increment of the scan rate in CV [25].
The Cu-BNNS electrode had a low current response associated with reaction (4) (formation of CuCl) in the first scan due to a previous formation of CuCl. This CuCl had been produced during immersion before the CV testing started. The second peak (A2) is a result of the transformation of Cu+ to Cu+2, as shown in Equations (6) and (7) in the first scan. In the rest of the cycles, the peaks had approximately the same height and amplitude because the first scan modified the surface, and the products were almost constant on the surface. However, the peaks slightly increase with each cycle, related to the pseudo-reversible reactions.
On the Cu sample, the layer formed during the pause time before the CV comprised porous CuO, Cu2O, and some CuCl. This action allowed a formation of CuCl in the first scan, which produced a higher peak A1 (formation of CuCl), but a short height in peak A2 (formation of Cu+2) associated with reaction (6) (formation of Cu+2). Peak A6 can support it in the first and second scans, and then this peak disappeared in the following scans. After the first two CV cycles, the peaks increased proportionally, showing the behavior of pseudo-reversible reactions.
The copper did not show an apparent pitting behavior. Nevertheless, copper has shown pitting potentials in CV results depending on the scan rate [25,27]. The Cu-BNNS had a pitting behavior that replaced the apparent third oxidation peak A3 of the Cu result.
3.4. Impedance Electrochemical Model at the Open Circuit Potential
A mechanism of adsorption was proposed by Epelboin [31]. In addition, this model has been applied to passivation behaviors where adsorbed chemical groups are an essential part of the corrosion process [12,13,14]. The corrosion mechanism at Eocp is shown in reactions (4), (5), (8), and (9).
where ki refers to the reaction constants, the faradaic current of the previous reactions is displayed in Equation (10).
here, for the electrochemical reactions. Furthermore, if is the faradaic current density, F the Faraday constant, b is the inverse of the cathodic or anodic slope of a Tafel behavior, E the potential vs. Eocp, θ1 the coverage factor for CuCl, θ2 the coverage factor for O2, [Cl−] the chloride concentration, and [H+] the hydrogen concentration.
The mass balance based on each adsorbed chemical intermediate is represented in Equations (11) and (12), while the mass balance for the is displayed in Equation (13). Additionally, the concentration expression of is based on the references [32,33].
where βi is a constant that correlates the coverage fraction with the surface concentration, the diffusion coefficient δ the thickness of the layer formed during the Eocp measurement before the EIS test, the concentration of the specie at the interface, and the concentration of the compound in bulk, which has a value of zero. The steady-state expressions are obtained when the change of the coverage factors and of the against time is zero. The result is shown in Equations (14)–(17).
where and .
The equations showed previously are changed into the following mathematical expressions by linearizing a small wave AC perturbation [32,34].
where, , , , , j is the imaginary number, ω the angular frequency, and ZF is the faradaic impedance.
Since the experimental results at open circuit potential have a semi-infinite diffusion behavior due to the oxygen, a previous model, which coupled adsorption and semi-infinite diffusion, was used in this analysis [33]. Hence, the relations needed to calculate the total impedance are shown in Equation (20).
where σ is the Warburg for semi-infinite diffusion, Zt is the total impedance, Qdl is the pseudo-capacitance of the double layer, and ndl is the exponent of the constant phase element.
3.5. Impedance Electrochemical Model for Active Anodic Polarization (Section I in the Figure 2)
The mathematical relations applied at Eocp can be modified because reactions (8) and (9) (reduction of oxygen) are negligible at anodic polarization. Hence, the anodic polarization approach is based on Equations (4) and (5). The rate of each step in the mechanism is , , , and . The expression for the current is shown in Equation (21). At the same time, the relation between the coverage factor and potential can be found from the dependency of coverage with time in non-steady conditions in Equation (22) [33]. In addition, the expression of diffusion of is essential to complete this approach, and the expression is supported by Hibbert and Murphy [35].
where IF is the faradaic current, a the surface area of the electrode, θ3 the coverage factor for CuCl, θ4 the coverage factor of the corrosion products created during the Eocp monitoring, and l is the thickness of the layer form during the Eocp measurement. The steady-state expression for Equations (22) and (23) are shown in expressions (24) and (25), respectively.
The faradaic impedance ZF2 can be obtained by linearizing Equations (21)–(23) for a small wave perturbation. It is shown in the expressions (26) and (27).
The diffusion of and Cl− can be integrated only into the behavior of in ZF2. It could be obtained from the Warburg impedance, N(ω), with a diffusion layer of finite thickness. The ZF2 relation is displayed in Equation (28).
where , and .
The total impedance is acquired by adding the ZF2 to the double-layer capacitance expressed for the constant phase element. The combination must be done in parallel. Hence, the total impedance is shown in expression (29).
where Zt2 is the total impedance for anodic polarizations, Qdl2 is the pseudo-capacitance, and ndl2 is the exponent of the constant phase element.
3.6. Qualitative Analysis of the Impedance Results
The values of the open circuit, Flade’s potential, passivation potential, and corrosion current were modified due to the addition of 6 wt.% BNNS as they were described in the polarization results. Furthermore, the cathodic behavior was controlled by diffusion for the Cu-BNNS and by activation diffusion for copper. It was confirmed in the EIS results shown in Figure 4a, where a semicircle at a high and medium frequency (HF-MF) and a line with a slope around 45° at low frequency (LF) were acquired. This impedance result has been associated with a mixed control of electrochemical reaction diffusion [33].
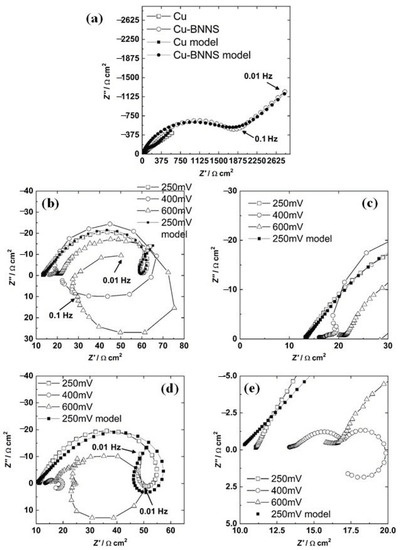
Figure 4.
Nyquist diagram for copper and copper-BNNS at corrosion potential (a), for copper under different bias potentials (b) and its zoom (c), for copper-BNNS under different bias potentials (d) and its zoom (e).
The resistance is proportionally inverse to the current, and then a high current of the cathodic diffusion component must be associated with low impedance at LF. In Figure 4a, the semicircle for Cu-BNNS has a higher diameter than the unclear semicircle for copper, while the line for Cu-BNNS has a higher impedance than the line for copper. The diffusion (Warburg behavior) for Cu-BNNS was recorded in a few points at LF, whereas the same behavior was seen at MF-LF for Cu. The number of points recorded at LF could be related to the magnitude of the diffusion component as follows: a low quantity of points at LF with a slope of 45° means a higher diffusion resistance. In contrast, a higher quantity of points at LF is associated with a lower diffusion magnitude; both conditions can be compared when the results at LF are around the same order of magnitude. It means the diffusion component is more critical for Cu-BNNS than Cu, which is the same result acquired by the polarization technique.
Three different behaviors in the anodic branch of a polarization curve have been described in copper corrosion [19]. These sections are shown in Figure 2. According to this scheme, three different bias potentials were chosen: 250, 400, and 600 mV vs. Eocp of each material.
The Nyquist diagram of copper for all the bias potentials is shown in Figure 4b. There is a semicircle at HF-MF and a ringlet at LF and 250 mV. In addition, the semicircle does not have a perfect circular shape that could be explained by three situations [36]. The first reason is the roughness of the surface, the second is the diffusion of the electrochemical species from the interface to the bulk passing through a deposit of Cu2O and other products, and the third is a combination of the two previous phenomena. The deposit of Cu2O could be formed in the preparation process at room temperature (reaction (7)) with a thickness of 2 nm [37].
The impedance results at a bias potential of 400 mV for Cu are displayed in Figure 4b (zoom in Figure 4c). There is a small semicircle at HF, another at MF, and a positive loop at LF. Due to the non-faradaic process, the first loop results from charging and discharging processes across the interface [38]. A semicircle at MF indicates diffusion impedance, while a positive loop at LF is directly related to the current process of adsorbed chemical intermediates [36]. This potential is localized at section II of the polarization, where a layer of adsorbed CuCl will precipitate. It produces a current decrement, which depends on the chloride concentration and temperature [39]. In section II, the formation of CuCl is faster than its complexation and diffusion of .
The bias potential of 600 mV for Cu is presented in Figure 4b. There is one semicircle at HF, another at MF, a positive loop at LF, and a third semicircle in the last four frequencies. The loop at HF represents the charging-discharging process at the interface [38], the second is diffusion impedance, and the third is the semicircle (the inductive loop) associated with adsorbed intermediates [38]. In section III, the production of cupric and cuprous anions leads to forming two semicircles, one as an inductive loop and another as a semicircle in the negative imaginary region at low frequency [40].
The Nyquist diagram of Cu-BNNS, which includes the three applied bias potentials, is shown in Figure 4d. At 250 mV of polarization,, it displays a semicircle with a rotation to the positive axis at HF-MF, an inductive ringlet that, this time, crosses to the inductive behavior and the initial part of a new semicircle. This behavior was explained by Song et al. [38] and Cao [40]. The first semicircle is associated with the energy employed to align the dipoles at the interface [38]. The other two behaviors are explained by the existence of three state variables. They are (a) potential, (b) the coverage area of adsorbed species or product layers, and the concentration at the interface of one chemical specie [40].
At 600 mV, the behavior is very similar to the copper result. The Nyquist diagram is presented in Figure 4d. There is a line at the HF (zoom in Figure 4e), a semicircle at HF-MF, an inductive loop at MF-LF, and the initial part of a third semicircle. The origin of this impedance result is the same phenomenon as the conditions mentioned above. It is the double-layer response, the diffusion of some ions, and the creation-transformation of a layer [38].
3.7. Quantitative Analysis of the Impedance Results
The quantification of the variables must be done by fitting the experimental results with the proposed models. The fitting process follows five steps described previously, applying a genetic algorithm, evolution strategies, and the Levenberg-Marquardt method [41]. In addition, the solutions were found among meaningful physical ranges of the variables. The graphic results are shown in Figure 4, while values of the parameters are displayed in Table 1 and Table 2 for Eocp and 250 mV, respectively. The Faraday´s constant (F) was 96,485 J V−1 equivalent−1, and area (a) was 0.785 cm2. A good agreement can be seen between the experimental data and the model fittings in Figure 4.

Table 1.
Parameters obtained from the fitting of the model at open circuit potential.
Table 2.
Parameters obtained from the fitting of the model at 250 bias potential (Section I of the polarization results).
At Eocp conditions, the coverage factor is low for both CuCl and O2. These coverage factors are associated with the uniform layer of 2 nm produced during the testing and deposit procedures [37]. The values of the coverage factor are in the range of the ones calculated for Al in alkaline solutions [42]. It is from 10−8 to 10−9 values. CuCl is more active than O2 at the surface because θ1 is higher than θ2 on both materials.
The constant rate of reaction (4) (CuCl formation), , is higher for Cu than for Cu-BNNS at Eocp. On the other hand, the reaction constant of reaction (6) (formation of ), , increases for Cu-BNNS at Eocp. It is consistent with the CV result because the immersion time previous before EIS testing led to a faster formation of CuCl on the Cu-BNNS than on Cu. Hence, the peak A1 was significant for Cu and small for Cu-BNNS, confirmed by higher value. In addition, the peak A2 was higher for Cu-BNNS due to the transformation of CuCl into Cu+2 at the first scan. The reaction (6) (formation of Cu+2) is not considered at Eocp because it is valid only at higher polarization, but the detachment of CuCl is higher for Cu-BNNS than for Cu, as is seen in the value of . The value of is in the same order of magnitude in both materials, while is much lower for copper. Those magnitudes support an easier formation of CuCl on Cu-BNNS than on Cu. These parameters are connected to the coverage factor θ1, which contradicts to the previous ideas because θ1 is higher in Cu than in Cu-BNNS. However, the cathodic reaction is controlled by diffusion of the O2. The value of σ is almost double in Cu-BNNS than in Cu, which agrees with the polarization result (Figure 4), where a diffusion control is seen in the Cu-BNNS and mixed control reaction-diffusion was acquired in Cu. The Warburg coefficient is lower in Cu than in Cu-BNNS, influencing the coverage θ2. The coverage factor θ2 is related to the adsorbed oxygen at the interface. If diffusion controls the system, the coverage factor will be lower. In addition, the reaction constant values and are very high and similar.
The pseudo-capacitance at Eocp, Qdl, is higher for Cu-BNNS because of the formation of CuCl. In contrast, the transformation of CuCl must be higher on Cu, as shown in Figure 5. The greater roughness in the surface of the Cu-BNNS is shown in the coefficient ndl of the CPE. The value of ndl is 0.75 for the Cu-BNNS and 0.85 for Cu. This fact is in accordance with the SEM results in Figure 2.
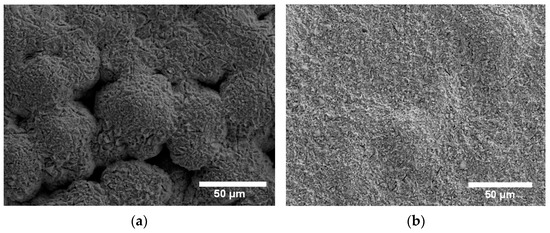
Figure 5.
Cu film after corrosion at 250 mV (a) and Cu-BNNS film after corrosion at 250 mV (b).
For the 250 mV, a different model was adopted because, at high anodic polarization, the cathodic reaction (9) had no influence. However, diffusion of is an essential factor in the corrosion process, as mentioned in the polarization results. There are two coverage factors: θ3 depends on the potential at this stage, and θ4 is not influenced by the potential at this stage. The former is associated with the CuCl formation on the surface, while the latter is related to other corrosion products that do not have a transformation (e.g., Cu2O) in this section of the polarization results.
The coverage factor θ3 became higher at 250 mV bias potential than at Eocp because the anodic polarization increased the rate of reactions (4) (formation of CuCl) and (5) (bonding of CuCl with Cl to produce ). In this situation, constants and are in the same order of magnitude (10−4) due to the anodic polarization. Therefore, the coverage factor, θ3, is 0.19 for the Cu and 0.49 for the Cu-BNNS sample. The coverage factor θ3 between the two materials is high for Cu-BNNS. The trend is confirmed once again. It implies that the production of CuCl was increased because of the BNNS addition, which led to a different morphology in the SEM results (Figure 5). The coverage factor is supported by the energy-dispersive X-ray maps where the area of N is 0.5 linked to the BN at the coverage area; that is, the maximum area of the CuCl coverage could be 0.5, which corresponds with a value of θ3 around 0.5.
4. Conclusions
The model of adsorption was successfully applied in the corrosion modeling of Cu-base films because the mechanism has been associated with the formation of solid CuCl. The model is in accordance with the experimental observation, which resulted from cyclic voltammetry, polarization, and scanning electron microscopy.
The results at Eocp showed that the formation of CuCl was increased on the Cu-BNNS during the first hour of immersion, and then the value of k1 was lower in the impedance model. In contrast, this k1 is higher on Cu because CuCl was not formed during the first hour. This result was supported by the CV results; a small peak A1 associated with the CuCl was acquired for Cu-CBNNS, while a higher peak was obtained for Cu. In addition, the value of k3 was higher for Cu-BNNS. This result agrees with peak A3, which is related to the production of Cu2O from CuCl. This production was higher for Cu-BNNS due to the previous formation of CuCl, but smaller for Cu due to a slight presence of CuCl.
In the polarization, section III had a higher current for Cu-BNNS for the same reason. The coverage factor, θ1, related to CuCl was lower for Cu, but the coverage factor, θ2, related to the oxygen adsorption is higher. It was due to the mixed reaction-diffusion control in the cathodic reaction at Eocp. This fact is supported by polarization and the EIS, where the diffusion effect is more critical in the Cu-BNNS. Hence, the Warburg coefficient was double for Cu-BNNS.
At 250 mV, the corrosion behavior was controlled by the adsorption-diffusion of the CuCl. This behavior was recorded as a semicircle and a positive capacitive ringlet. The model included two coverage factors θ3 was related to the CuCl produced on the surface, while θ4 was associated with a formation of Cu2O or CuO that is not transformed at this potential. The coverage factor θ3 was 0.5 for CuBNNS, which was the maximum area available because the BNNS covers 50% of the area. In contrast, θ3 is 0.19 because the production of CuCl was less critical. The reaction constants k1 and k3 for the two materials increased significantly due to the increment in the bias potential.
Author Contributions
Conceptualization, J.I.B.-F. and E.L.-M.; Methodology, J.I.B.-F., M.G.-G. and H.C.-M.; Software, J.I.B.-F.; Validation, J.I.B.-F., M.G.-G. and H.C.-M.; Formal analysis, J.I.B.-F., E.L.-M., O.V.-G., M.G.-G., H.C.-M. and J.C.V.; Investigation, J.I.B.-F. and O.V.-G.; Resources, J.I.B.-F., E.L.-M. and O.V.-G.; Writing—original draft, J.I.B.-F.; Writing—review & editing, E.L.-M., O.V.-G., M.G.-G., H.C.-M. and J.C.V.; Visualization, J.I.B.-F., E.L.-M. and O.V.-G.; Supervision, J.I.B.-F.; Project administration, J.I.B.-F.; Funding acquisition, J.I.B.-F. All authors have read and agreed to the published version of the manuscript.
Funding
This research received no external funding.
Institutional Review Board Statement
Not applicable.
Informed Consent Statement
Not applicable.
Data Availability Statement
The data that support the findings of this study are available from the corresponding author, JIBF, upon reasonable request.
Conflicts of Interest
The authors declare no conflict of interest.
References
- Huang, Y.-C.; Lo, T.-Y.; Chao, C.-G.; Whang, W.-T. Anti-corrosion characteristics of polyimide/h-boron nitride composite films with different polymer configurations. Surf. Coat. Technol. 2014, 260, 113–117. [Google Scholar] [CrossRef]
- Husain, E.; Narayanan, T.N.; Taha-Tijerina, J.J.; Vinod, S.; Vajtai, R.; Ajayan, P.M. Marine Corrosion Protective Coatings of Hexagonal Boron Nitride Thin Films on Stainless Steel. ACS Appl. Mater. Interfaces 2013, 5, 4129–4135. [Google Scholar] [CrossRef] [PubMed]
- Li, L.H.; Xing, T.; Chen, Y.; Jones, R. Boron Nitride Nanosheets for Metal Protection. Adv. Mater. Interfaces 2014, 1, 1300132. [Google Scholar] [CrossRef]
- Liu, Z.; Gong, Y.; Zhou, W.; Ma, L.; Yu, J.; Idrobo, J.C.; Jung, J.; MacDonald, A.H.; Vajtai, R.; Lou, J.; et al. Ultrathin high-temperature oxidation-resistant coatings of hexagonal boron nitride. Nat. Commun. 2013, 4, 2541–2548. [Google Scholar] [CrossRef] [PubMed]
- MaCafferty, E. Introduction to Corrosion Science; Springer: New York, NY, USA, 2010. [Google Scholar]
- Macdonald, D.D. Reflections on the history of electrochemical impedance spectroscopy. Electrochim. Acta 2006, 51, 1376–1388. [Google Scholar] [CrossRef]
- Van Ingelgem, Y.; Tourwé, E.; Vereecken, J.; Hubin, A. Application of multisine impedance spectroscopy, FE-AES and FE-SEM to study the early stages of copper corrosion. Electrochim. Acta 2008, 53, 7523–7530. [Google Scholar] [CrossRef]
- Van Ingelgem, Y.; Hubin, A.; Vereecken, J. Investigation of the first stages of the localized corrosion of pure copper combining EIS, FE-SEM and FE-AES. Electrochim. Acta 2007, 52, 7642–7650. [Google Scholar] [CrossRef]
- Amin, M.A. Weight loss, polarization, electrochemical impedance spectroscopy, SEM and EDX studies of the corrosion inhibition of copper in aerated NaCl solutions. J. Appl. Electrochem. 2006, 36, 215–226. [Google Scholar] [CrossRef]
- Benedeti, A.; Sumodjo, P.; Nobe, K.; Cabot, P.; Proud, W. Electrochemical studies of copper, copper-aluminium and copper-aluminium-silver alloys: Impedance results in 0.5M NaCl. Electrochim. Acta 1995, 40, 2657–2668. [Google Scholar] [CrossRef]
- Khaled, K. Studies of the corrosion inhibition of copper in sodium chloride solutions using chemical and electrochemical measurements. Mater. Chem. Phys. 2011, 125, 427–433. [Google Scholar] [CrossRef]
- Epelboin, I.; Wiart, R. Mechanism of the Electrocrystallization of Nickel and Cobalt in Acidic Solution. J. Electrochem. Soc. 1971, 118, 1577–1582. [Google Scholar] [CrossRef]
- Keddam, M.; Mottos, O.R.; Takenouti, H. Reaction Model for Iron Dissolution Studied by Electrode Impedance: I. Experimental Results and Reaction Model. J. Electrochem. Soc. 1981, 128, 257–266. [Google Scholar] [CrossRef]
- Macdonald, D.D.; Real, S.; Smedley, S.I.; Urquidi-Macdonald, M. Evaluation of Alloy Anodes for Aluminum-Air Batteries: IV. Electrochemical Impedance Analysis of Pure Aluminum in 4m-Koh at 25 °C. J. Electrochem. Soc. 1988, 135, 2410–2414. [Google Scholar] [CrossRef]
- Yegin, C.; Nagabandi, N.; Feng, X.; King, C.; Catalano, M.; Oh, J.K.; Talib, A.J.; Scholar, E.A.; Verkhoturov, S.V.; Cagin, T.; et al. Metal–Organic–Inorganic Nanocomposite Thermal Interface Materials with Ultralow Thermal Resistances. ACS Appl. Mater. Interfaces 2017, 9, 10120–10127. [Google Scholar] [CrossRef]
- Lee, H.P.; Nobe, K. Kinetics and Mechanisms of Cu Electrodissolution in Chloride Media. J. Electrochem. Soc. 1986, 133, 2035–2043. [Google Scholar] [CrossRef]
- Braun, M.; Nobe, K. Electrodissolution Kinetics of Copper in Acidic Chloride Solutions. J. Electrochem. Soc. 1979, 126, 1666–1671. [Google Scholar] [CrossRef]
- Dhar, H.P.; White, R.E.; Burnell, G.; Cornwell, L.R.; Griffin, R.B.; Darby, R. Corrosion of Cu and Cu-Ni Alloys in 0.5M NaCl and in Synthetic Seawater. Corrosion 1985, 41, 317–323. [Google Scholar] [CrossRef]
- Kear, G.; Barker, B.; Walsh, F. Electrochemical corrosion of unalloyed copper in chloride media––A critical review. Corros. Sci. 2004, 46, 109–135. [Google Scholar] [CrossRef]
- Moreau, A. Etude du mecanisme d’oxydo-reduction du cuivre dans les solutions chlorurees acides—I. Systeme Cu-Cu Cl−2. Electrochim. Acta 1981, 26, 497–504. [Google Scholar] [CrossRef]
- Deslouis, C.; Tribollet, B.; Mengoli, G.; Musiani, M.M. Electrochemical behaviour of copper in neutral aerated chloride solution. I. Steady-state investigation. J. Appl. Electrochem. 1988, 18, 374–383. [Google Scholar] [CrossRef]
- Bard, J.A.; Faulkner, L.R. Electrochemical Methods: Fundamentals and Applications; John Wiley & Sons: Hoboken, NJ, USA, 2001. [Google Scholar]
- Li, J. Inhibition Film Formed by 2-mercaptobenzothiazole on Copper Surface and Its Degradation Mechanism in Sodium Chloride Solution. Int. J. Electrochem. Sci. 2016, 11, 10690–10705. [Google Scholar] [CrossRef]
- Betova, I.; Bojinov, M.; Lilja, C. Influence of chloride on the long-term interaction of copper with deoxygenated neutral aqueous solutions. Corros. Sci. 2013, 76, 192–205. [Google Scholar] [CrossRef]
- Zhao, Y.; Lin, C.; Li, Y.; Du, R.; Wang, J. Electrochemical Corrosion Behavior of Copper Clad Laminate in NaCl Solution. Acta Phys.-Chim. Sin. 2007, 23, 1342–1346. [Google Scholar] [CrossRef]
- Nakayama, S.; Notoya, T.; Osakai, T. Highly Selective Determination of Copper Corrosion Products by Voltammetric Reduction in a Strongly Alkaline Electrolyte. Anal. Sci. 2012, 28, 323–331. [Google Scholar] [CrossRef]
- Li, D.; Chen, S.; Zhao, S.; Ma, H. The corrosion inhibition of the self-assembled Au, and Ag nanoparticles films on the surface of copper. Colloids Surf. A Physicochem. Eng. Asp. 2006, 273, 16–23. [Google Scholar] [CrossRef]
- Deyab, M.; Keera, S. Cyclic voltammetric studies of carbon steel corrosion in chloride-formation water solution and effect of some inorganic salts. Egypt. J. Pet. 2012, 21, 31–36. [Google Scholar] [CrossRef]
- Satpati, A.K.; Reddy, A.V.R. Electrochemical Study on Corrosion Inhibition of Copper in Hydrochloric Acid Medium and the Rotating Ring-Disc Voltammetry for Studying the Dissolution. Int. J. Electrochem. 2011, 2011, 173462. [Google Scholar] [CrossRef]
- Zhang, D.-Q.; Cai, Q.-R.; He, X.-M.; Gao, L.-X.; Kim, G.S. The corrosion inhibition of copper in hydrochloric acid solutions by a tripeptide compound. Corros. Sci. 2009, 51, 2349–2354. [Google Scholar] [CrossRef]
- Epelboin, I.; Keddam, M.; Lestrade, J.C. Faradaic impedances and intermediates in electrochemical reactions. Faraday Discuss. Chem. Soc. 1973, 56, 264–275. [Google Scholar] [CrossRef]
- Macdonald, D.D. Transient Techniques in Electrochemistry; Springer: New York, NY, USA, 1977. [Google Scholar]
- Rosas, O.; Saunders, J.; Castaneda, H. Interfacial electrochemical analysis on LiCoO2/carbon nanotubes layers as cathode active composite in aqueous electrolytes. Electrochim. Acta 2013, 113, 77–86. [Google Scholar] [CrossRef]
- Macdonald, D.D. Application of Electrochemical Impedance Spectroscopy in Electrochemistry and Corrosion Science. In Techniques for Characterization of Electrodes and Electrochemical Processes; Varma, R., Selman, J.R., Eds.; Wiley: Hoboken, NJ, USA, 1991; pp. 515–580. ISBN 9780471824992. [Google Scholar]
- Hibbert, D.B.; Murphy, S.V. Kinetic Model of Iron Corrosion and Passivity. J. Electrochem. Soc. 1991, 138, L30–L32. [Google Scholar] [CrossRef]
- Baril, G.; Galicia, G.; Deslouis, C.; Pébère, N.; Tribollet, B.; Vivier, V. An Impedance Investigation of the Mechanism of Pure Magnesium Corrosion in Sodium Sulfate Solutions. J. Electrochem. Soc. 2007, 154, C108–C113. [Google Scholar] [CrossRef]
- Preston, G.; Bircumshaw, L.L.I. Studies on the oxidation of metals. Lond. Edinb. Dublin Philos. Mag. J. Sci. 1935, 20, 706–720. [Google Scholar] [CrossRef]
- Song, G.; Atrens, A.; John, D.; Wu, X.; Nairn, J. The anodic dissolution of magnesium in chloride and sulphate solutions. Corros. Sci. 1997, 39, 1981–2004. [Google Scholar] [CrossRef]
- Lal, H.; Thirsk, H.R. 538. The anodic behaviour of copper in neutral and alkaline chloride solutions. J. Chem. Soc. 1953, 2638–2644. [Google Scholar] [CrossRef]
- Cao, C.-N. On the impedance plane displays for irreversible electrode reactions based on the stability conditions of the steady-state—II. Two state variables besides electrode potential. Electrochim. Acta 1990, 35, 837–844. [Google Scholar] [CrossRef]
- Taylor, M.L. Technological Aspects of Corrosion Control in Metallic Systems. Ph.D. Thesis, The Pennsylvania State University, State College, PA, USA, 2012. [Google Scholar]
- Shao, H.; Wang, J.; Zhang, Z.; Zhang, J.; Cao, C. Electrochemical impedance spectroscopy analysis on the electrochemical dissolution of aluminum in an alkaline solution. J. Electroanal. Chem. 2003, 549, 145–150. [Google Scholar] [CrossRef]


Disclaimer/Publisher’s Note: The statements, opinions and data contained in all publications are solely those of the individual author(s) and contributor(s) and not of MDPI and/or the editor(s). MDPI and/or the editor(s) disclaim responsibility for any injury to people or property resulting from any ideas, methods, instructions or products referred to in the content. |
© 2023 by the authors. Licensee MDPI, Basel, Switzerland. This article is an open access article distributed under the terms and conditions of the Creative Commons Attribution (CC BY) license (https://creativecommons.org/licenses/by/4.0/).