Abstract
Surface-enhanced Raman scattering (SERS) spectroscopy is used to investigate a composition of wash swabs from the Cu-TiO2/TiO2-modified filters with disinfecting ability. Macroporous Si chips coated with conformal 800 nm thick Ni layer and Ag particles (Ag/Ni) are engineered to act as SERS-active substrates. Such substrates are characterized by a moderate reflection band in the visible range and provide an improved heat dissipation from contaminants in wash swabs during SERS study. This prevents thermal-induced destruction of analyzing media for reliable assessment of its composition. The anatase Cu-TiO2 and TiO2 nanoparticles are synthesized using the sol-gel method and characterized via Raman spectroscopy and X-ray diffractometry. The filters are modified with Cu-TiO2/TiO2 nanoparticles and embedded in three-valve facial masks that are worn by a volunteer to breathe for 4 h. Comparative SERS analysis of the filters shows that they slightly destroy chemical bonds in the molecules constituting airborne contaminations upon ceiling day lights, which can be associated with Cu-TiO2 photocatalytic activity. The filters additionally exposed to near-ultraviolet light prominently decrease the intensity of Raman signatures of airborne contaminant due to the presence of pure TiO2.
1. Introduction
Currently, methods for detecting pathogens at extremely low concentrations on a surface of personal protective equipment (PPE) are becoming increasingly important [1,2]. In this regard, surface-enhanced Raman scattering (SERS) spectroscopy, being an ultrasensitive molecular analysis technique, has attracted a reasonable attention [3,4]. On the other hand, we observe the intensification of seeking new approaches to improve PPE antibacterial activity since new dangerous microorganisms have appeared that can rapidly mutate to survive in aggressive environments [5,6]. Such microbes are capable of causing serious damage to health even in small amounts [7], so it is advisable to avoid contracting them at all. However, in public places and even in hospitals, it is difficult to maintain stable and long-term sterility of air at a sufficient level [8]. In this regard, the only easiest and most affordable way to protect a person from an infection is still an inexpensive facial mask such as a surgical mask or its analogue. Such masks are considered to passably protect people for 2–4 h but then they become a source of infection that can be easily spread by touching or via contact with surfaces in public places or hospitals [9,10]. Therefore, it is very desirable to develop masks possessing self-cleaning properties. Recently, a number of papers have reported the results of mask modification describing light-facilitated killing of the microorganisms [11] or to simply remove infected drops due to increase in their surface hydrophobicity [12].
Titanium dioxide (TiO2) is one of the most popular materials with photocatalytical activity that is known to provide irreversible chemical transformation of organic molecules [13,14,15]. TiO2 nanostructures can be synthesized using various methods including anodic oxidation [16], sol-gel [17,18], hydrothermal [19] and extraction pyrolytic [20] techniques. Therefore, different morphological forms have been actively used to improve disinfecting features of PPE [21]. The other relevant goal is to decrease the pore sizes in the mask filter for improved prevention of the nanoobject entry into the upper respiratory organs as well as to ensure sufficient air flow density for the user’s breathing. For example, in a previous study [22], we proposed the fabrication of polymer membrane with nanosized pores coated with silver and titanium dioxide nanostructures for filtering out nanoobjects of 100 nm diameter accompanied by the deactivation of bacteria upon external light exposure. An ability to stop passing organic contaminations was proved in the SERS spectroscopy study of the air pumped via the developed membrane. The resulting spectra collected on the Ag/porous silicon (Ag/PSi)-based SERS-active substrates previously reported (e.g., [23]) showed no bands typical for organic molecules in bacterial cells. In contrast, the SERS spectra of the air pumped through the surgical mask were characterized by the Raman signature of amorphous carbon, which is formed since the organic molecules adsorbed on the filter surface are burned in hot spots on the SERS-active substrate.
The objective of this study is to modify and test the self-cleaning capabilities of a slightly modified porous polymer membrane that has been embedded in a facial mask, worn by a volunteer for a few hours, and exposed to UV radiation. The modification implies introducing Cu-doped TiO2 nanoparticles in the functional coating of the filter instead of silver ones to impart photocatalytic activity upon visible light [24,25] and increase cost effectiveness of the filter fabrication. Detection of contaminations on the filter surface is carried out using SERS spectroscopy with the SERS-active substrates based on silver and macroporous silicon (macroPSi) with a continuous Ni interlayer. These substrates are designed to dissipate heat effectively from the laser spot via the Ni layer, preventing analyte burning and allowing for the collection of its characteristic bands.
2. Materials and Methods
2.1. Materials
A set of solutions «FunChrome Nickel» (FunChrome, Russian Federation) was used for electrochemical nickel deposition. Two polymers, SU-8 2015 (MicroChem, Newton, MA, USA) and polymethylmethacrylate (PMMA, Plexiglas XT 20070 MW approx. 155 kDa, Podolsk, Russia), were mixed to fabricate the basis for the filter. PMMA was cut in sheets of 2 mm thickness and 50 × 50 mm size. Acrylonitrile butadiene styrene (ABS) plastic (Shenzhen Esun Industrial Co., Ltd., Shenzhen, China) was used for 3D printing the filter holders, which then were embedded in a facial mask and UV cleaning device. Toluene (ACS reagent, ≥99.5%), acetone (ACS reagent, ≥99.5%), titanium(IV) isopropoxide (TTIP, ≥99.999%), isopropyl alcohol (IPA, 70% in H2O), hydrofluoric acid (48 wt.% in H2O), dimethyl sulfoxide (≥99.9%), 5,5-dithio-bis-(2-nitrobenzoic acid) (DTNB, 99.0%), silver nitrate (AgNO3, ACS reagent, ≥99.0%), sodium hydroxide (NaOH, ACS reagent, ≥97.0%), ammonia water (1 M NH3 in H2O), potassium sodium tartrate tetrahydrate (C4H4KNaO6·4H2O, ACS reagent, 99%) and copper(II) sulfate (CuSO4, ≥99.99%) were supplied by Sigma Aldrich and used without additional purification. Water was purified with the Milli-Q system (Millipore, Bedford, MA, USA).
2.2. Fabrication of SERS-Active Substrates
Single-crystal silicon wafers doped with boron with an orientation of 100 and a resistance of 12 Ohm·cm (“Kamerton” branch of JSC “Integral”, Pinsk, Belarus) were used as basic materials for the SERS-active substrate. Firstly, macroporous silicon (macroPSi) with pores of 1.0 ± 0.5 µm depth and diameter was formed by electrochemically anodizing the silicon sample at a current density of 8 mA/cm2 for 210 sec [26]. A solution of hydrofluoric acid (48%) and dimethyl sulfoxide mixed at a volume ratio of 10:46 was used to form macropores. The microporous layer, which is typically present on the walls of macropores [27,28], was removed by soaking the sample in the anodizing solution for 15 min.
Next, a conformal nickel film was deposited onto the macroPSi to serve as a heat dissipation layer. This was accomplished using the “FunChrome Nickel” protocol (FunChrome Company, Novozybkov, Russia), which allows for the formation of thin, continuous layers of nickel without the use of electric current. The process involves immersing the sample in custom liquid compositions, followed by heating in a nickel salt solution at 60 °C for 15 min. Such regimens make it possible to form a nickel film of 800 nm thickness. The SERS-active coating was then fabricated on the nickel-coated macroPSi using the “silver mirror” method, which has been described elsewhere [29]. A solution was prepared by mixing 0.07 M AgNO3, 0.2 M NaOH, 0.6 M NH3, C4H4KNaO6·4H2O, and ethanol in a volume ratio of 4:1:1. Each Ni-coated sample was immersed in the solution for 6 min, followed by rinsing with deionized water for 30 s after deposition.
2.3. Filter Membrane Fabrication
The fabrication of the polymer membrane and its modification with photocatalytically active particles followed a slightly modified procedure previously reported [22]. Cu-doped TiO2 nanoparticles were inserted in the spraying suspension instead of the silver ones. The Sol-gel method was selected to prepare the TiO2-based nanoparticles since it resulted in fabrication of the powder with higher photocatalytic activity [22], and this approach is generally more attractive for large-scale TiO2 production.
Firstly, TTIP was dissolved in a 70% isopropanol solution to obtain a 0.4 mM TTIP solution, which was stirred until suspension homogenization. Then deionized water was added to the solution and hydrolysis was carried out for 2 h. To obtain the Cu-doped TiO2 particles, copper salt (CuSO4) was added to the solution to reach a concentration of 14 mM. The resulting solution was stirred, and the gel was allowed to form for one day. Excess liquid was removed with ashless paper. After that, the gel was dried for 5 h at 80 °C and annealed at 400 °C for 30 min to remove organic contaminants.
2.4. Embedding the Polymer Membrane in Facial Mask and Device for UV Cleaning
To create holders for the filtering membrane to be embedded into the facial mask and UV-cleaning device, a 3D printer (Ender-3, Creality 3D Technology Co., Ltd., Shenzhen, China) was used. The Autodesk Inventor Professional 2020 program was used to design the holder and device models. The modelled and printed parts of the filtering membrane holder are shown in Figure 1a. A three-valve facial mask Y2K FFP1 (Briz-Kama, Moscow, Russia) was used as a base for the filter installation. As shown in Figure 1b,c, the silicone valves were replaced with the filters, which consisted of polymer membranes held in ABS holders. The mask itself is made of a non-porous material that does not let air through when breathing, i.e., air flows exclusively through the valves with filters. The UV cleaning device included holders for the filter and a UV torch, as depicted in Figure 1d.
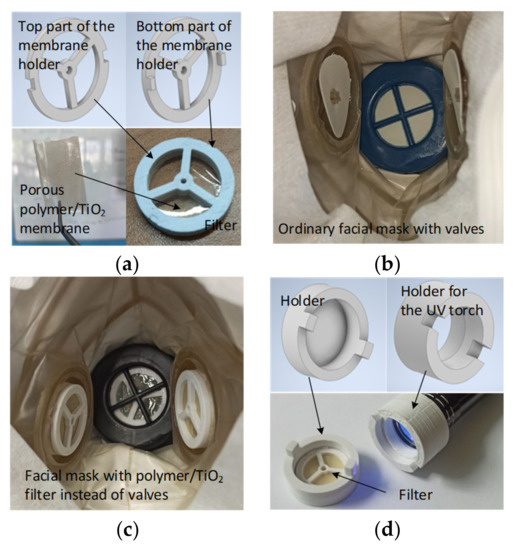
Figure 1.
Embedding filtering membrane in the facial mask and device for UV cleaning: (a) Models and 3D-printed versions of the filter with a porous polymer/TiO2 membrane; (b) Internal view of the ordinary facial mask with valves; (c) Internal view of the facial mask with filters embedded instead of valves; (d) Models and 3D-printed versions of the holders of device for the filter UV-sterilization.
2.5. Characterization of the Experimental Samples
The morphology of the experimental samples was analyzed using a scanning electron microscope (SEM) Hitachi S-4800 (Hitachi, Tokyo, Japan). Characterization of the polymer membranes was carried out with a 3D confocal Raman microscope-spectrometer Confotec Duo (SOL Instruments, Minsk, Belarus) equipped with a 532 nm laser using 100× objective (NA = 0.95). The TiO2 and Cu-doped TiO2 nanoparticles were studied with the TriVista 777 Raman spectrometer (Princeton Instruments, Trenton, NJ, USA) equipped with a 532 nm laser (power—2.3 mW, exposure time—1 s, temperature—295 K) and X-ray diffractometer (XRD, Cu-Kα, λ = 1.54 Å) Rigaku Miniflex 600 (Rigaku, Tokyo, Japan), respectively.
The reflectance spectra of the Ag/Ni/macroPSi substrates were measured using the Proscan MC122 spectrophotometer (Proscan Special Instruments, Minsk, Belarus) with a 2 nm step in the range of 200–1100 nm. Thermal characterization of both the control Ag/PSi (used in [22]) and Ag/Ni/macroPSi substrates was performed using the Thermal imager Testo 871 (Testo SE&Co., Baden-Württemberg, Germany). The substrates were exposed to a light emitting diode (LED) projector Elektrostandard Elementary 033 FL (Elektrostandard, Moscow, Russia) for 30 min, and the heating temperature of the substrates was measured before and after the light treatment. The room temperature was 20 ± 1 °C. It was kept constant during the experiments to prevent any influence on the temperature measurements.
2.6. Testing the Filters
The testing procedure involved SERS analysis of wash swabs from the filters coated with TiO2-based nanoparticles before and after being worn by a volunteer for 4 h under natural (just daylight from the windows) and artificial (day light lamp) light conditions. The wash swabs were taken from the entire surface of the filters. We did not test several different spots on the filters for statistics because their surface area was not so large (~3 cm2 per filter). The volunteer wore the mask during routine work in a laboratory room of 40 m2 area. Three other employees were in the room during the course of the filter testing. The filters from the worn masks were also exposed to the UV light (365 nm, 8 W) for 30 min and then wash-swabs from them were analyzed using SERS spectroscopy.
2.7. SERS Measurements
SERS spectra were measured with a 3D scanning laser Raman confocal microscope Confotec NR500 (SOL Instruments, Minsk, Belarus) using 473 and 633 nm lasers and a 100× objective (NA = 0.95). The SERS activity and detection limit of the Ag/Ni/macroPSi substrate were first studied using DTNB as a testing analyte. To determine the detection limit, the SERS-active substrates were immersed in ethanol solutions of the analyte at different concentrations. The arrays of spectra (800 in total) were recorded by scanning two spots of 337.5 μm × 337.5 μm size on the surface of the sample with a focused laser beam. The laser spot diameter was approx. 600 nm for 473 nm wavelength (approx. 800 nm for 633 nm wavelength). The exposure time for recording each spectrum in the array was 1 s.
3. Results and Discussion
3.1. Structural Properties of Filter Components
3.1.1. Pure and Cu-Doped Titanium Dioxide
Figure 2 presents the results of the structural characterization of undoped TiO2 and Cu-doped TiO2.
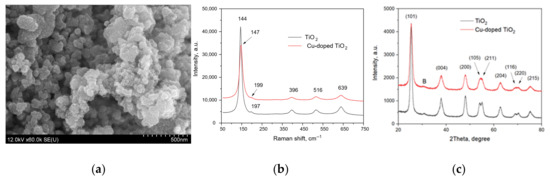
Figure 2.
The results of structural characterization of the TiO2-based nanoparticles: (a) SEM image of the pure TiO2 nanoparticles; (b) Raman spectra of the pure and Cu-doped TiO2 nanoparticles; (c) XRD patterns of the pure and Cu-doped TiO2 nanoparticles.
The SEM image is typical for both the powder samples, which are composed of spherical nanoparticles of sizes below 100 nm. The Raman spectra of TiO2-based samples are characterized by a strong band near 145 cm−1 (vibration mode Eg), three bands of lower intensity at 396, 516 and 639 cm−1 (modes Eg, B1g/A1g and Eg) and a hardly distinguished band at approx. 196 cm−1 that are typical for anatase [30]. However, the observed Raman spectra showed that the peaks of anatase nanoparticles are a bit blue-shifted (~5 cm−1) from those of the bulk sample reported elsewhere [31], which is associated with the quantum size effect [30]. Comparing the Raman spectra of the pure TiO2 and Cu-doped TiO2 samples also shows a blue shift of two Eg mode bands from 144 to 147 cm−1 and from 197 to 199 cm−1, respectively. This can indicate the copper incorporation into the TiO2 anatase lattice and presence of oxygen defects [32].
The XRD patterns also confirmed the anatase crystalline structure of the TiO2-based nanoparticles [20,31,33], with a weak peak at ~31 degrees (marked with B) possibly related to the existence of the brookite TiO2 in the samples [34].
3.1.2. Filtering Material
Figure 3 depicts the SEM images of the porous SU-8 membrane sample and the Raman spectra of pure SU-8 and PMMA as well as porous SU-8 formed after the PMMA removal. The porous SU-8 membrane exhibits a spongy morphology made of pores with a mean Feret’s diameter of 100 nm that was calculated using Image J software.
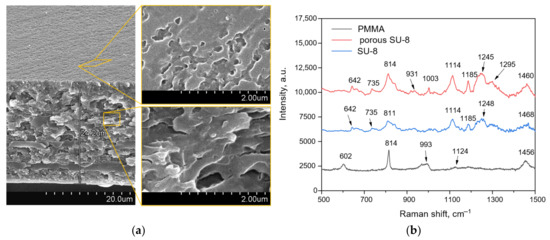
Figure 3.
The results of structural characterization of the polymer membranes: (a) SEM images of the porous SU-8 membrane; (b) Raman spectra of the bulk membranes of PMMA and SU-8 as well as porous SU-8 membrane after PMMA removal.
The Raman spectra of bulk polymers show typical bands of PMMA at 602 (C-COO, C-C-O), 814 (C-O-C), 993 (O-C), 1124 (C-C) and 1456 (O-CH3) cm−1 [35,36,37] and cured SU-8 at 642, 735 and 814 (C-S) [38], 931 (C-O-C), 1114 and 1185 (C-O, C-C-O, C-O-C), 1245 (CH3, C-C, C ring, O-CH2), 1295 (CH2, C-O-C, C ring), 1460 (CH3, CH2) cm−1 [39]. It should be noted that the porous SU-8 membrane is characterized by at least 1.5 times more intensive Raman spectra in contrast to its bulk version, which is supposed to be associated with an increased surface area of the porous sample providing the Raman photon scattering. The spectrum of the porous polymer does not contain the characteristic PMMA band at 602 cm−1, indicating its sufficient removal from the SU-8 membrane. It is worth noting the presence of the 1003 cm−1 band in the Raman spectrum of the porous SU-8 sample, which is characteristic, for example, for the amino acid phenylalanine [40]. The developed surface of the membrane may have adsorbed organic compounds from the air that contain the specific amino acid, resulting in its presence in the Raman spectrum.
3.2. Characterization of the Ag/Ni/macroPSi Samples
3.2.1. Structure, Optical and Thermal Properties of Ag/Ni/macroPSi Samples
In this work, we used PSi as a substrate for the formation of the SERS-active coating due to the fact that this material has proven itself as an adhesion improver and a provider of the stability of the morphology of plasmonic nanostructures deposited on it [41]. A number of studies utilizing SERS-active materials based on mesoporous silicon (mesoPSi) have been carried out [42,43,44], including our recent study devoted to the analysis of the efficiency of air cleaning using porous membranes made of polymer, titanium dioxide and silver nanoparticles [22]. However, due to the very strong heating associated with the trapping of electromagnetic radiation using plasmonic nanostructures on mesoPSi, such substrates can lead to analyte destruction. This prevents the confident analysis of the presence of microbial content in an analyzing media of unknown composition. Therefore, we decided to introduce a continuous Ni layer between PSi and SERS-active silver nanoparticles, based in particular on the results of improved heat dissipation due to the conformity of the metal coating, as described previously [29]. We rejected an idea of imparting greater continuity directly to the plasmonic coating because it quenches the SERS activity. We used thin macroPSi instead of mesoporous PSi, since the pore walls of the latter are more difficult to cover with a continuous Ni layer due to diffusion limitations in the pore channels with a large aspect ratio. Figure 4 shows SEM images of the Ni/macroPSi samples before and after the Ag deposition, as well as their reflection spectra and the EDX spectrum of the Ag/Ni-coated sample. The continuity of the Ni layer was not affected during the Ag deposition. However, its thickness negligibly decreases by 3 nm on average. Elemental analysis indicates that the sample after the deposition of nickel and silver contains both of these metals. In this case, the surface of the Ni layer is covered with small Ag nanoparticles with diameters below 200 nm, as well as with large Ag agglomerates up to 1.5 μm in size. Similar dimensions of Ag particles were typical for the control Ag/PSi substrates used previously [22,23]. An analysis of the reflection spectra shows that the Ni layer makes a greater contribution to the reflectance spectra in contrast to Ag coating. The surface plasmon resonance band typical for Ag nanoparticles is not observed in the silvered sample, which can be caused by low sensitivity of reflectance spectrophotometry. An absorbance spectra measurement could be more informative but the samples are not transparent to sufficiently use such a method.
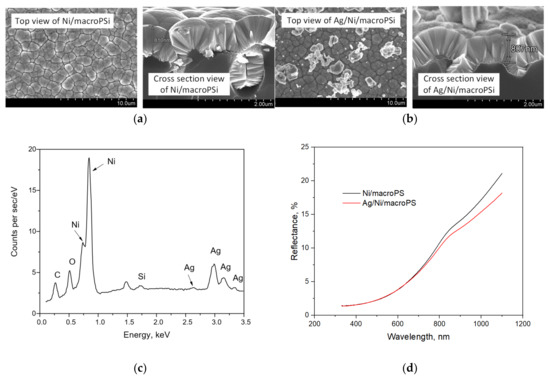
Figure 4.
The results of structural and optical characterization of the samples based on macroPSi: (a) SEM images of the Ni/macroPSi sample; (b) SEM images of the Ag/Ni/macroPSi sample; (c) EDX-spectrum of the Ag/Ni/macroPSi sample; (d) reflectance spectra of the samples.
Figure 5 presents optical and thermal images of the SERS-active substrates, which include Ag/PSi (used as a control substrate) and Ag/Ni/macroPSi. The substrate without the Ni layer exhibits a 4 °C higher temperature increase than the substrate with the heat-dissipating layer after exposure to the LED projector. It is important to note that, with the IR camera, we measure the total heating of the entire substrate, in contrast to the extremely small area on which the laser acts and in nanosized gaps (hot spots) between plasmonic nanoparticles. Local heating, as well as the difference in it for different substrates, can be much greater. Nevertheless, the result of the IR measurements is indirect evidence that, in the course of the SERS measurements, the laser heating will be less when using the Ni-containing substrate. We also considered that the reflectivity can cause lower heating of the sample containing the Ni layer. The reflection spectrum of the control Ag/PSi substrate reported elsewhere [23]) was compared with that of Ag/Ni/macroPSi. In general, the reflectance of the nickel-containing samples was observed to be even below the reflectance of the control Ag/PSi substrate in the 400–700 nm range (typical for LED projector). In more detail, the Ag/Ni/macroPSi reflectance varied in the range of 3–7% versus 3–18% of the control Ag/PSi. Therefore, we excluded the fact of the reflectance influence on the temperature difference.
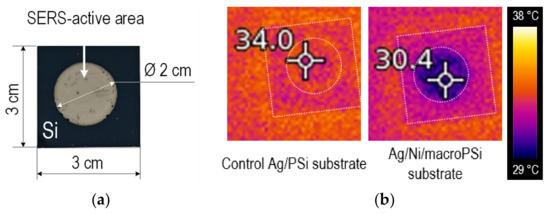
Figure 5.
The results of thermal characterization of the of the samples based on macroPSi: (a) Top view of the control Ag/PSi or Ag/Ni/macroPSi formed on the Si sample; (b) thermal images of the control Ag/PSi and Ag/Ni/macroPSi samples obtained using the IR camera after their LED projector exposure for 30 min.
3.2.2. SERS-Activity Study of Ag/Ni Samples
The SERS-activity study of the Ag/Ni/macroPSi substrates was carried out using the DTNB analyte due to its well recognizable Raman spectrum with three pronounced characteristic bands in the range of 1000–1600 cm−1 and a disulfide bond. As a rule, the S–S bond is broken in the presence of silver, resulting in the formation of two TNB2– ions chemisorbed on the substrate [45], which contributes to their uniform distribution on the surface of plasmonic nanostructures.
Figure 6a shows the SERS spectra of the analyte collected using 473 and 633 nm lasers. Both the spectra contain all the characteristic bands of the analyte [46], the highest intensity of which is at 1063, 1331 and 1557 cm−1. The intensity of the spectrum when excited with the red laser is five times less than that obtained with the blue one. This indirectly shows that the surface plasmon resonance of the substrate is in the blue range. Therefore, further SERS measurements were performed with the blue laser.
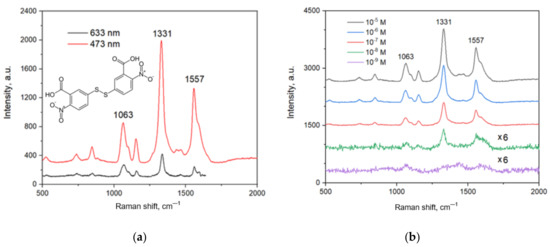
Figure 6.
SERS spectra of DTNB on Ag/Ni/macroPSi substrates: (a) DTNB concentration—10−5 M, excitation with 473 and 633 nm lasers; (b) DTNB concentration varied from 10−5 to 10−9 M, excitation with 473 nm laser.
Figure 6b shows a set of SERS spectra recorded to determine the detection limit of the analyte on the developed substrate. One can quite confidently identify the bands in the spectra at concentrations of 10−5–10−8 M. Also, in the spectra at 10−5–10−7 M the S-S bond (510 cm−1) is determined, indicating that not all DTNB molecules on the substrate surface decomposed into the TNB components. This is associated with a relatively high DTNB concentrations. The last spectrum at 10−9 M contains the characteristic bands of the analyte that intensity-to-noise ratio is somewhat less than 3 but they are still distinguished. Hence, we can conclude that the developed substrate exhibits a nanomolar limit of detection.
3.3. SERS Study of the Filters
Figure 7 shows the SERS spectra of the wash swabs collected from TiO2-modified polymer filters after wearing for 4 h in the dark and under the day light lamp irradiation. One of the samples was also kept in the UV-cleaning device. It can be seen that the patterns registered from samples worn in the dark are characterized by the highest intensity and bands typical for airborne bacteria such as Streptococcus pneumoniae, Streptococcus pyogenes to name a few [47,48] and dust [13]. In particular, bacteria-related bands 1003 (phenylalanine), 1245 (amide III) and 1640 (amide I), 1572 (DNA and RNA), and 1448, 2880 and 2935 (CH, CH2 and CH3) are present [48]. Other signatures of the constituent parts of bacteria, for example, lipids, proteins, carbohydrates can also be found. A SERS study of the filter embedded in the mask worn upon the day light lamps also resulted in similar spectra but their intensity is lower and the spectra of amorphous carbon are more frequent, indicating the destruction of the organic molecules probably due to the photocatalytic activity of Cu-doped TiO2. The last sample was worn upon the day light lamps and then kept under the UV light. This led to a pronounced degradation of organic components as seen from the SERS spectra since one can hardly detect their characteristic bands. In addition, the spectra intensity strongly decreased. At the same time, a prominent 510 cm−1 band appeared in the SERS spectra after the UV irradiation, which is associated with S–S bonds. Increasing the intensity of this band can be related to photo-induced fibrillization of the proteins in the wash swabs [49,50,51]. Therefore, we can conclude that modification of the porous polymer membrane with TiO2 and Cu-doped TiO2 imparts sterilizing properties to it. Self-cleaning is of moderate effectiveness when the filter is illuminated with day light lamps and is rather strong if exposed to UV light (365 nm). We can expect that the photocatalytic activity will be higher in sunlight than under daylight lamps, as the solar spectrum includes a strong UV component.

Figure 7.
SERS spectra of wash swabs collected from the TiO2-modified filter after breathing: (a) in the absence of day light lamp irradiation; (b) in the presence of day light lamp irradiation; (c) in the presence of day light lamp irradiation and then exposed to UV.
4. Conclusions
In this study, we investigated the self-cleaning property of a porous polymer membrane modified with anatase nanoparticles of TiO2 and Cu-doped TiO2. The membrane was used as filters embedded in the three-valve facial mask worn by a volunteer for a few hours in the dark, upon the day light lamp irradiation, and then exposed to UV light. Comparative analysis of the present results and those reported previously [13] showed that the modification of the functional coating of the filter with the Cu-doped TiO2 nanoparticles imparted moderate self-cleaning effects upon visible light while pure TiO2 facilitated an intensive destruction of the organic molecules adsorbed on the filter when treated in the UV cleaning device. We detected contaminations on the filter surface using SERS spectroscopy with SERS-active substrates based on silver and macroPSi with a continuous Ni interlayer. The use of macroPSi with the Ni interlayer provided effective heat dissipation from the laser spot, which prevented the burning of the molecules and enabled reliable detection of their characteristic bands.
Author Contributions
Conceptualization, H.B., S.P. and D.B.; methodology, K.G., A.B., E.O., A.M., A.P. and D.B.; software, A.B. and U.S. (Uladzislau Shapel); validation, A.B., K.G., A.P., D.B. and S.P.; formal analysis, A.B.; investigation, K.G., A.B., E.O., A.M., D.L., V.P. and A.P.; resources, H.B. and D.B.; data curation, K.G., U.S. (Utkirjon Sharopov) and V.P.; writing—original draft preparation, K.G. and H.B.; writing—review and editing, H.B., D.B. and S.P.; visualization, H.B. and K.G.; supervision, H.B., S.P. and D.B.; project administration, H.B. and D.B.; funding acquisition, H.B. and D.B. All authors have read and agreed to the published version of the manuscript.
Funding
This research was funded by the Latvian Scientific Council grant LZP-2021/1-0464 and Belarusian Republican Foundation for Fundamental Research, grant number T22TURK-005.
Institutional Review Board Statement
Not applicable.
Informed Consent Statement
Not applicable.
Data Availability Statement
No new data were created.
Conflicts of Interest
The authors declare no conflict of interest.
References
- Hirota, K. Air Contamination with SARS-CoV-2 in the Operating Room. J. Anesth. 2021, 35, 333–336. [Google Scholar] [CrossRef]
- Therkorn, J.; Drewry, D.; Andonian, J.; Benishek, L.; Billman, C.; Forsyth, E.R.; Garibaldi, B.T.; Nowakowski, E.; Rainwater-Lovett, K.; Sauer, L.; et al. Development and Comparison of Complementary Methods to Study Potential Skin and Inhalational Exposure to Pathogens during Personal Protective Equipment Doffing. Clin. Infect. Dis. 2019, 69, S231–S240. [Google Scholar] [CrossRef] [PubMed]
- Berry, M.E.; Kearns, H.; Graham, D.; Faulds, K. Surface Enhanced Raman Scattering for the Multiplexed Detection of Pathogenic Microorganisms: Towards Point-of-Use Applications. Analyst 2021, 146, 6084–6101. [Google Scholar] [CrossRef] [PubMed]
- Shapel, U.A.; Shapel, A.; Sharstniou, A.; Bandarenka, H. Plasmonic Nanovoids for Monitoring Sanitary Conditions of a Public Place by Surface-Enhanced Raman Spectroscopy. In Proceedings of the Frontiers in Biological Detection: From Nanosensors to Systems XIII; SPIE: Bellingham, WA, USA, 2021; Volume 11662, p. 116620L. [Google Scholar]
- Azzaya, D.; Gantuya, B.; Oyuntsetseg, K.; Davaadorj, D.; Matsumoto, T.; Akada, J.; Yamaoka, Y. High Antibiotic Resistance of Helicobacter Pylori and Its Associated Novel Gene Mutations among the Mongolian Population. Microorganisms 2020, 8, 1062. [Google Scholar] [CrossRef] [PubMed]
- Cherian, S.; Potdar, V.; Jadhav, S.; Yadav, P.; Gupta, N.; Das, M.; Rakshit, P.; Singh, S.; Abraham, P.; Panda, S.; et al. SARS-CoV-2 Spike Mutations, L452R, T478K, E484Q and P681R, in the Second Wave of COVID-19 in Maharashtra, India. Microorganisms 2021, 9, 1542. [Google Scholar] [CrossRef]
- Doron, S.; Gorbach, S.L. Bacterial Infections: Overview. In International Encyclopedia of Public Health; (Kris) Heggenhougen, H.K., Ed.; Academic Press: Oxford, UK, 2008; pp. 273–282. ISBN 978-0-12-373960-5. [Google Scholar]
- Dalstrom, D.J.; Venkatarayappa, I.; Manternach, A.L.; Palcic, M.S.; Heyse, B.A.; Prayson, M.J. Time-Dependent Contamination of Opened Sterile Operating-Room Trays. JBJS 2008, 90, 1022. [Google Scholar] [CrossRef]
- Zhiqing, L.; Yongyun, C.; Wenxiang, C.; Mengning, Y.; Yuanqing, M.; Zhenan, Z.; Haishan, W.; Jie, Z.; Kerong, D.; Huiwu, L.; et al. Surgical Masks as Source of Bacterial Contamination during Operative Procedures. J. Orthop. Transl. 2018, 14, 57–62. [Google Scholar] [CrossRef]
- Otter, J.A.; Donskey, C.; Yezli, S.; Douthwaite, S.; Goldenberg, S.D.; Weber, D.J. Transmission of SARS and MERS Coronaviruses and Influenza Virus in Healthcare Settings: The Possible Role of Dry Surface Contamination. J. Hosp. Infect. 2016, 92, 235–250. [Google Scholar] [CrossRef]
- Kumar, S.; Karmacharya, M.; Joshi, S.R.; Gulenko, O.; Park, J.; Kim, G.-H.; Cho, Y.-K. Photoactive Antiviral Face Mask with Self-Sterilization and Reusability. Nano Lett. 2021, 21, 337–343. [Google Scholar] [CrossRef]
- El-Atab, N.; Qaiser, N.; Badghaish, H.; Shaikh, S.F.; Hussain, M.M. Flexible Nanoporous Template for the Design and Development of Reusable Anti-COVID-19 Hydrophobic Face Masks. ACS Nano 2020, 14, 7659–7665. [Google Scholar] [CrossRef]
- Aïssa, B.; Isaifan, R.J.; Madhavan, V.E.; Abdallah, A.A. Structural and Physical Properties of the Dust Particles in Qatar and Their Influence on the PV Panel Performance. Sci. Rep. 2016, 6, 31467. [Google Scholar] [CrossRef]
- Trestsova, M.A.; Utepova, I.A.; Chupakhin, O.N.; Semenov, M.V.; Pevtsov, D.N.; Nikolenko, L.M.; Tovstun, S.A.; Gadomska, A.V.; Shchepochkin, A.V.; Kim, G.A.; et al. Oxidative C-H/C-H Coupling of Dipyrromethanes with Azines by TiO2-Based Photocatalytic System. Synthesis of New BODIPY Dyes and Their Photophysical and Electrochemical Properties. Molecules 2021, 26, 5549. [Google Scholar] [CrossRef]
- Shtyka, O.; Shatsila, V.; Ciesielski, R.; Kedziora, A.; Maniukiewicz, W.; Dubkov, S.; Gromov, D.; Tarasov, A.; Rogowski, J.; Stadnichenko, A.; et al. Adsorption and Photocatalytic Reduction of Carbon Dioxide on TiO2. Catalysts 2021, 11, 47. [Google Scholar] [CrossRef]
- Kamalov, R.; Vokhmintsev, A.; Dorosheva, I.; Kravets, N.; Weinstein, I. Synthesis of Composite Based on Carbon Nanotubes and Anodic Titania. Adv. Sci. Lett. 2016, 22, 688–690. [Google Scholar] [CrossRef]
- Dorosheva, I.B.; Petrova, S.A.; Weinstein, I.A.; Rempel, A.A. Synthesis, Modification and Characterization of Titania Nanostructures. AIP Conf. Proc. 2022, 2466, 030021. [Google Scholar] [CrossRef]
- Gaponenko, N.V.; Sergeev, O.V.; Misiewicz, J.; Gnaser, H.; Heiderhoff, R.; Cramer, R.M.; Balk, L.J.; Dunbar, A.; Hamilton, B. Erbium Photoluminescence in Sol-Gel-Derived Titanium Dioxide Films. In Proceedings of the International Conference on Solid State Crystals ’98: Epilayers and Heterostructures in Optoelectronics and Semiconductor Technology, Zakopane, Poland, 12–16 October 1998; SPIE: Bellingham, WA, USA, 1999; Volume 3725, pp. 239–242. [Google Scholar] [CrossRef]
- Volkova, L.S.; Tarasov, A.M.; Dubkov, S.V.; Gromov, D.G.; Ryazanov, R.M. Facile fabrication of a TiO2 NW-based glucose sensor by direct ink writing. St. Petersburg Polytech. Univ. J. Phys. Math. 2022, 58, 125–130. [Google Scholar] [CrossRef]
- Serga, V.; Burve, R.; Krumina, A.; Pankratova, V.; Popov, A.I.; Pankratov, V. Study of Phase Composition, Photocatalytic Activity, and Photoluminescence of TiO2 with Eu Additive Produced by the Extraction-Pyrolytic Method. J. Mater. Res. Technol. 2021, 13, 2350–2360. [Google Scholar] [CrossRef]
- Margarucci, L.M.; Gianfranceschi, G.; Romano Spica, V.; D’Ermo, G.; Refi, C.; Podico, M.; Vitali, M.; Romano, F.; Valeriani, F. Photocatalytic Treatments for Personal Protective Equipment: Experimental Microbiological Investigations and Perspectives for the Enhancement of Antimicrobial Activity by Micrometric TiO2. Int. J. Environ. Res. Public Health 2021, 18, 8662. [Google Scholar] [CrossRef]
- Burko, A.; Zavatski, S.; Baturova, A.; Kholiboeva, M.; Kozina, J.; Kravtsunova, K.; Popov, V.; Gudok, A.; Dubkov, S.; Khartov, S.; et al. Polymer Membrane Modified with Photocatalytic and Plasmonic Nanoparticles for Self-Cleaning Filters. Polymers 2023, 15, 726. [Google Scholar] [CrossRef]
- Girel, K.; Yantcevich, E.; Arzumanyan, G.; Doroshkevich, N.; Bandarenka, H. Detection of DNA Molecules by SERS Spectroscopy with Silvered Porous Silicon as an Active Substrate. Phys. Status Solidi 2016, 213, 2911–2915. [Google Scholar] [CrossRef]
- Leyland, N.S.; Podporska-Carroll, J.; Browne, J.; Hinder, S.J.; Quilty, B.; Pillai, S.C. Highly Efficient F, Cu Doped TiO2 Anti-Bacterial Visible Light Active Photocatalytic Coatings to Combat Hospital-Acquired Infections. Sci. Rep. 2016, 6, 24770. [Google Scholar] [CrossRef] [PubMed]
- Ouyang, K.; Dai, K.; Walker, S.L.; Huang, Q.; Yin, X.; Cai, P. Efficient Photocatalytic Disinfection of Escherichia Coli O157:H7 Using C70-TiO2 Hybrid under Visible Light Irradiation. Sci. Rep. 2016, 6, 25702. [Google Scholar] [CrossRef] [PubMed]
- Girel, K.; Burko, A.; Barysiuk, A.; Dubkov, S.; Gromov, D.; Bandarenka, H. Correlation of Surface Potential and SERS-Activity of Ag Particles Formed by Electroless Deposition on Si-Based Substrate. Curr. Appl. Phys. 2023, 49, 18–24. [Google Scholar] [CrossRef]
- Karachevtseva, L.A.; Lytvynenko, O.A.; Malovichko, E.A.; Sobolev, V.D.; Stronska, O.J. Electrical Properties of Macroporous Silicon Structures. Semicond. Phys. Quantum Electron. Optoelectron. 2001, 4, 40–43. [Google Scholar] [CrossRef]
- Bardyshev, N.I.; Mokrushin, A.D.; Puryaeva, T.P.; Serebryakova, N.V.; Starkov, V.V. Nanopores in Macroporous Silicon. Inorg. Mater. 2004, 40, 1127–1132. [Google Scholar] [CrossRef]
- Girel, K.; Burko, A.; Zavatski, S.; Barysiuk, A.; Litvinova, K.; Eganova, E.; Tarasov, A.; Novikov, D.; Dubkov, S.; Bandarenka, H. Atomic Layer Deposition of Hafnium Oxide on Porous Silicon to Form a Template for Athermal SERS-Active Substrates. Appl. Phys. A 2023, 129, 294. [Google Scholar] [CrossRef]
- Thuy, N.M.; Van, D.Q.; Hai, L.T.H. The Visible Light Activity of the TiO2 and TiO2:V4+ Photocatalyst. Nanomater. Nanotechnol. 2012, 2, 14. [Google Scholar] [CrossRef]
- Challagulla, S.; Tarafder, K.; Ganesan, R.; Roy, S. Structure Sensitive Photocatalytic Reduction of Nitroarenes over TiO2. Sci. Rep. 2017, 7, 8783. [Google Scholar] [CrossRef]
- Liu, B.; Wang, X.; Cai, G.; Wen, L.; Song, Y.; Zhao, X. Low Temperature Fabrication of V-Doped TiO2 Nanoparticles, Structure and Photocatalytic Studies. J. Hazard. Mater. 2009, 169, 1112–1118. [Google Scholar] [CrossRef]
- Dorosheva, I.B.; Adiyak, E.V.; Valeeva, A.A.; Rempel, A.A. Synthesis of Nonstoichiometric Titanium Dioxide in the Hydrogen Flow. AIP Conf. Proc. 2019, 2174, 020019. [Google Scholar] [CrossRef]
- Pottier, A.; Chanéac, C.; Tronc, E.; Mazerolles, L.; Jolivet, J.-P. Synthesis of Brookite TiO2 Nanoparticlesby Thermolysis of TiCl4 in Strongly Acidic Aqueous Media. J. Mater. Chem. 2001, 11, 1116–1121. [Google Scholar] [CrossRef]
- Chen, J.; Li, J.; Xu, L.; Hong, W.; Yang, Y.; Chen, X. The Glass-Transition Temperature of Supported PMMA Thin Films with Hydrogen Bond/Plasmonic Interface. Polymers 2019, 11, 601. [Google Scholar] [CrossRef]
- Thomas, K.J.; Sheeba, M.; Nampoori, V.P.N.; Vallabhan, C.P.G.; Radhakrishnan, P. Raman Spectra of Polymethyl Methacrylate Optical Fibres Excited by a 532 Nm Diode Pumped Solid State Laser. J. Opt. A: Pure Appl. Opt. 2008, 10, 055303. [Google Scholar] [CrossRef]
- Thakur, V.K.; Vennerberg, D.; Madbouly, S.A.; Kessler, M.R. Bio-Inspired Green Surface Functionalization of PMMA for Multifunctional Capacitors. RSC Adv. 2014, 4, 6677–6684. [Google Scholar] [CrossRef]
- Kumar, V.; Maheshwari, N.; Sharma, N.N. Self Assembled Monolayer Modified SU8 Surface for Electrowetting Application. Macromol. Symp. 2015, 357, 18–22. [Google Scholar] [CrossRef]
- Chen, Z.; Yao, J.; Xu, Q.; Wang, Z. Two-Photon Polymerization Fabrication and Raman Spectroscopy Research of SU-8 Photoresist Using the Femtosecond Laser. Optoelectron. Lett. 2017, 13, 210–213. [Google Scholar] [CrossRef]
- Tfaili, S.; Gobinet, C.; Angiboust, J.-F.; Manfait, M.; Piot, O. Raman Microimaging Using a Novel Multifiber-Based Device: A Feasibility Study on Pharmaceutical Tablets. Int. J. Spectrosc. 2012, 2012, e959235. [Google Scholar] [CrossRef]
- Khinevich, N.; Bandarenka, H.; Zavatski, S.; Girel, K.; Tamulevičienė, A.; Tamulevičius, T.; Tamulevičius, S. Porous Silicon—A Versatile Platform for Mass-Production of Ultrasensitive SERS-Active Substrates. Microporous Mesoporous Mater. 2021, 323, 111204. [Google Scholar] [CrossRef]
- Giorgis, F.; Descrovi, E.; Chiodoni, A.; Froner, E.; Scarpa, M.; Venturello, A.; Geobaldo, F. Porous Silicon as Efficient Surface Enhanced Raman Scattering (SERS) Substrate. Appl. Surf. Sci. 2008, 254, 7494–7497. [Google Scholar] [CrossRef]
- Zeiri, L.; Rechav, K.; Porat, Z.; Zeiri, Y. Silver Nanoparticles Deposited on Porous Silicon as a Surface-Enhanced Raman Scattering (SERS) Active Substrate. Appl. Spectrosc. 2012, 66, 294–299. [Google Scholar] [CrossRef]
- Mikac, L.; Ivanda, M.; Đerek, V.; Gotić, M. Influence of Mesoporous Silicon Preparation Condition on Silver Clustering and SERS Enhancement. J. Raman Spectrosc. 2016, 47, 1036–1041. [Google Scholar] [CrossRef]
- Bandarenka, H.V.; Khinevich, N.V.; Burko, A.A.; Redko, S.V.; Zavatski, S.A.; Shapel, U.A.; Mamatkulov, K.Z.; Vorobyeva, M.Y.; Arzumanyan, G.M. 3D Silver Dendrites for Single-Molecule Imaging by Surface-Enhanced Raman Spectroscopy. ChemNanoMat 2021, 7, 141–149. [Google Scholar] [CrossRef]
- Shrestha, Y.K.; Yan, F. Determination of Critical Micelle Concentration of Cationic Surfactants by Surface-Enhanced Raman Scattering. RSC Adv. 2014, 4, 37274–37277. [Google Scholar] [CrossRef]
- Smets, W.; Moretti, S.; Denys, S.; Lebeer, S. Airborne Bacteria in the Atmosphere: Presence, Purpose, and Potential. Atmos. Environ. 2016, 139, 214–221. [Google Scholar] [CrossRef]
- Dahms, M.; Eiserloh, S.; Rödel, J.; Makarewicz, O.; Bocklitz, T.; Popp, J.; Neugebauer, U. Raman Spectroscopic Differentiation of Streptococcus Pneumoniae From Other Streptococci Using Laboratory Strains and Clinical Isolates. Front. Cell. Infect. Microbiol. 2022, 12, 930011. [Google Scholar] [CrossRef]
- Wesełucha-Birczyńska, A.; Kozicki, M.; Czepiel, J.; Birczyńska, M. Raman Micro-spectroscopy Tracing Human Lymphocyte Activation. Analyst 2013, 138, 7157–7163. [Google Scholar] [CrossRef]
- Kurouski, D.; Washington, J.; Ozbil, M.; Prabhakar, R.; Shekhtman, A.; Lednev, I.K. Disulfide Bridges Remain Intact while Native Insulin Converts into Amyloid Fibrils. PLoS ONE 2012, 7, e36989. [Google Scholar] [CrossRef]
- Kurouski, D.; Lednev, I.K. The Impact of Protein Disulfide Bonds on the Amyloid Fibril Morphology. Int. J. Biomed. Nanosci. Nanotechnol. 2011, 2, 167–176. [Google Scholar] [CrossRef]


Disclaimer/Publisher’s Note: The statements, opinions and data contained in all publications are solely those of the individual author(s) and contributor(s) and not of MDPI and/or the editor(s). MDPI and/or the editor(s) disclaim responsibility for any injury to people or property resulting from any ideas, methods, instructions or products referred to in the content. |
© 2023 by the authors. Licensee MDPI, Basel, Switzerland. This article is an open access article distributed under the terms and conditions of the Creative Commons Attribution (CC BY) license (https://creativecommons.org/licenses/by/4.0/).