Article

Plasma-Pulsed GMAW Hybrid Welding Process of 6061 Aluminum and Zinc-Coated Steel

1
School of Mechanical and Automotive Engineering, Qingdao University of Technology, Qingdao 266520, China
2
School of Rongcheng, Harbin University of Science and Technology, Weihai 264300, China
3
Chengdu Advanced Metal Materials Industrial Technology Research Institute Co., Ltd., Chengdu 610305, China
4
State Key Laboratory of Advanced Welding and Joining, Harbin Institute of Technology, Harbin 150001, China
5
Shandong Classic Group Co., Ltd., Jining 272000, China
*
Author to whom correspondence should be addressed.
Crystals 2023, 13(5), 723; https://doi.org/10.3390/cryst13050723
Submission received: 30 March 2023 / Revised: 19 April 2023 / Accepted: 20 April 2023 / Published: 25 April 2023

Abstract

:
A novel plasma-pulsed GMAW hybrid welding (plasma-GMAW-P) process is proposed for joining 6061 aluminum and zinc-coated steel. The results show that the change in welding heat input has little effect on the microstructure of the joint and the composition of the intermetallic compounds (IMCs) but only changes the thickness of the reaction layer (increased from 5 μm to 12 μm). when the plasma arc current is 20 A and the MIG current is 80 A, the welded joint obtained has the highest tensile-shear force. With the optimal process parameters, the weld strength obtained by filling ER4043 welding wire is the highest, accounting for 65% of the tensile-shear force of the base material. The effect of the plasma arc acting on the joint properties is studied through the microstructure and a tensile-shearing test. The action position of the plasma arc plays a significant role in the Al/steel interface, which directly influences the strength of the welded joints. Regardless of the plasma-GMAW-P style used to obtain the joints, Fe-Al IMCs appear at the interface. When the plasma arc is in front of the welding direction and the GMAW-P arc is in the rear, the tensile-shear force reaches the maximum of 3322 N.

1. Introduction

Lightweight automobile has gradually become a research hotspot in the automotive field [1,2,3]. Al alloys were the most popular among the various lightweight alloys due to their features of high mechanical strength, good corrosion resistance, and affordable cost. To ensure quality, it was necessary to produce an Al–steel structure consisting of Al and steel parts [4,5,6]. Al–steel structures have high temperature resistance, ultra-low temperature resistance, good heat dissipation, and excellent electrical conductivity. They have been widely used in the fields of automobile manufacturing, metallurgy, and aerospace [7]. Due to the differences in their physical and chemical properties, the formation of brittle Fe–Al intermetallic compounds (IMCs) and weld properties appear at the interface and Al side [8,9,10]. Furthermore, different welding methods, including single fusion welding, laser-arc welding, friction stir welding, etc. [11,12,13], have been applied to join Al and steel to improve the interfacial reaction and optimize the thickness and distribution of IMCs [14,15,16]. However, these methods have stricter requirements for welding heat input [17], joint shape, and assembly conditions, which are difficult to meet given the need for rapid manufacturing in the industrial field [18,19,20].
Hybrid welding has been considered as one of the effective ways to improve welding quality and efficiency since it was proposed [21,22], and has gradually become a research hotspot in the field of welding [23,24]. Hybrid heat source is an effective method to solve practical problems, which conventional fusion welding could not [25,26]. In this study, 6061 aluminum and zinc-coated steel were innovatively welded with a plasma-pulsed GMAW (Plasma-GMAW-P) hybrid welding process. The plasma arc current, the MIG current and filler metal, and the different hybrid welding types were investigated. The aim of this work was to provide a new method for achieving efficient and high-quality welding of dissimilar metals.

2. Materials and Methods

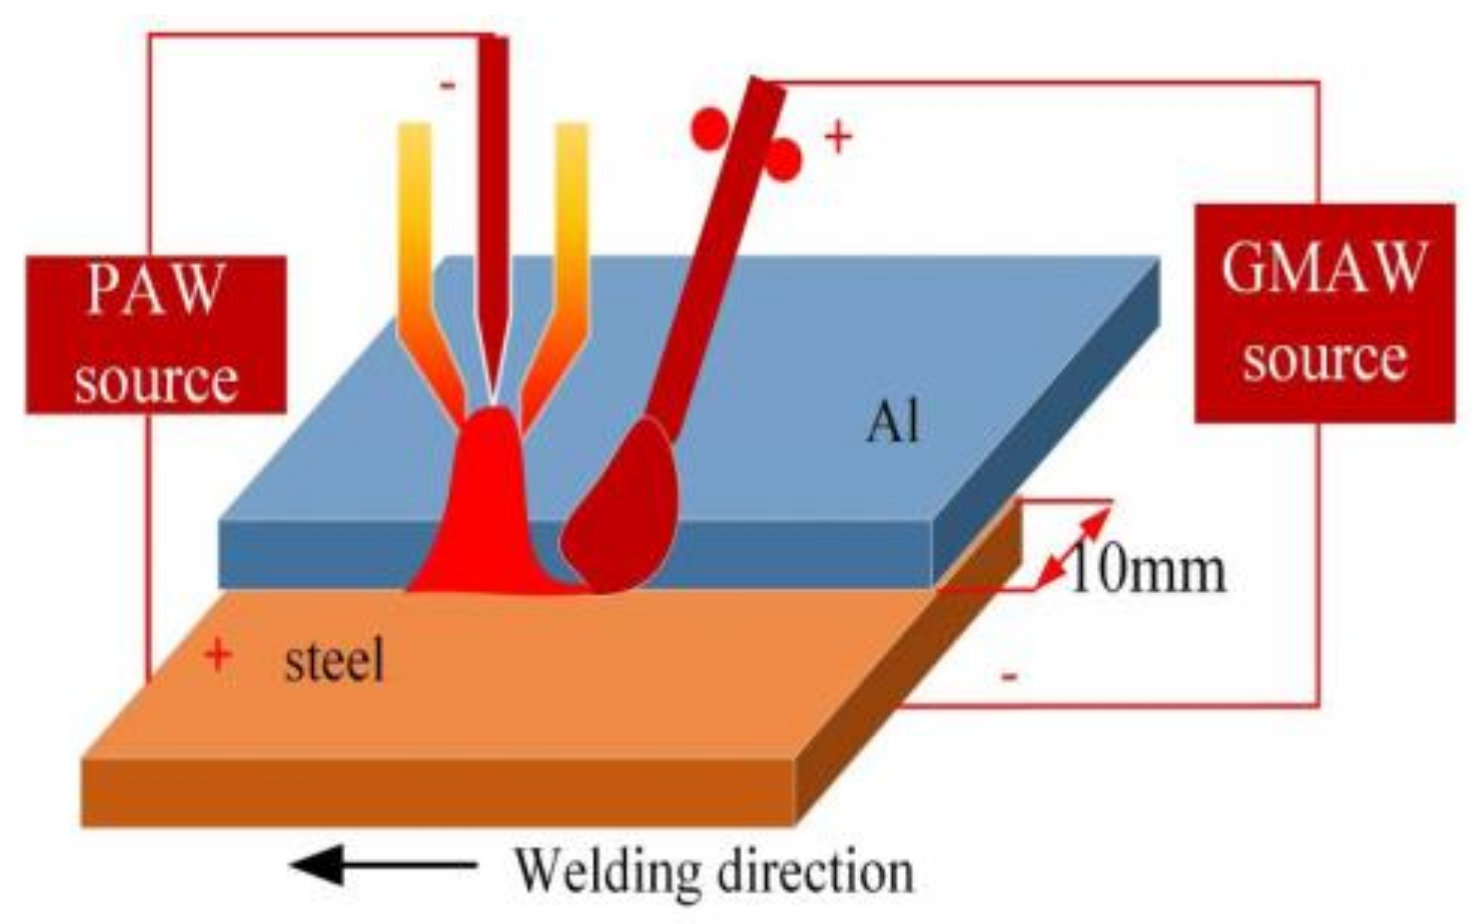
2.1. Welding Test System and Test Material
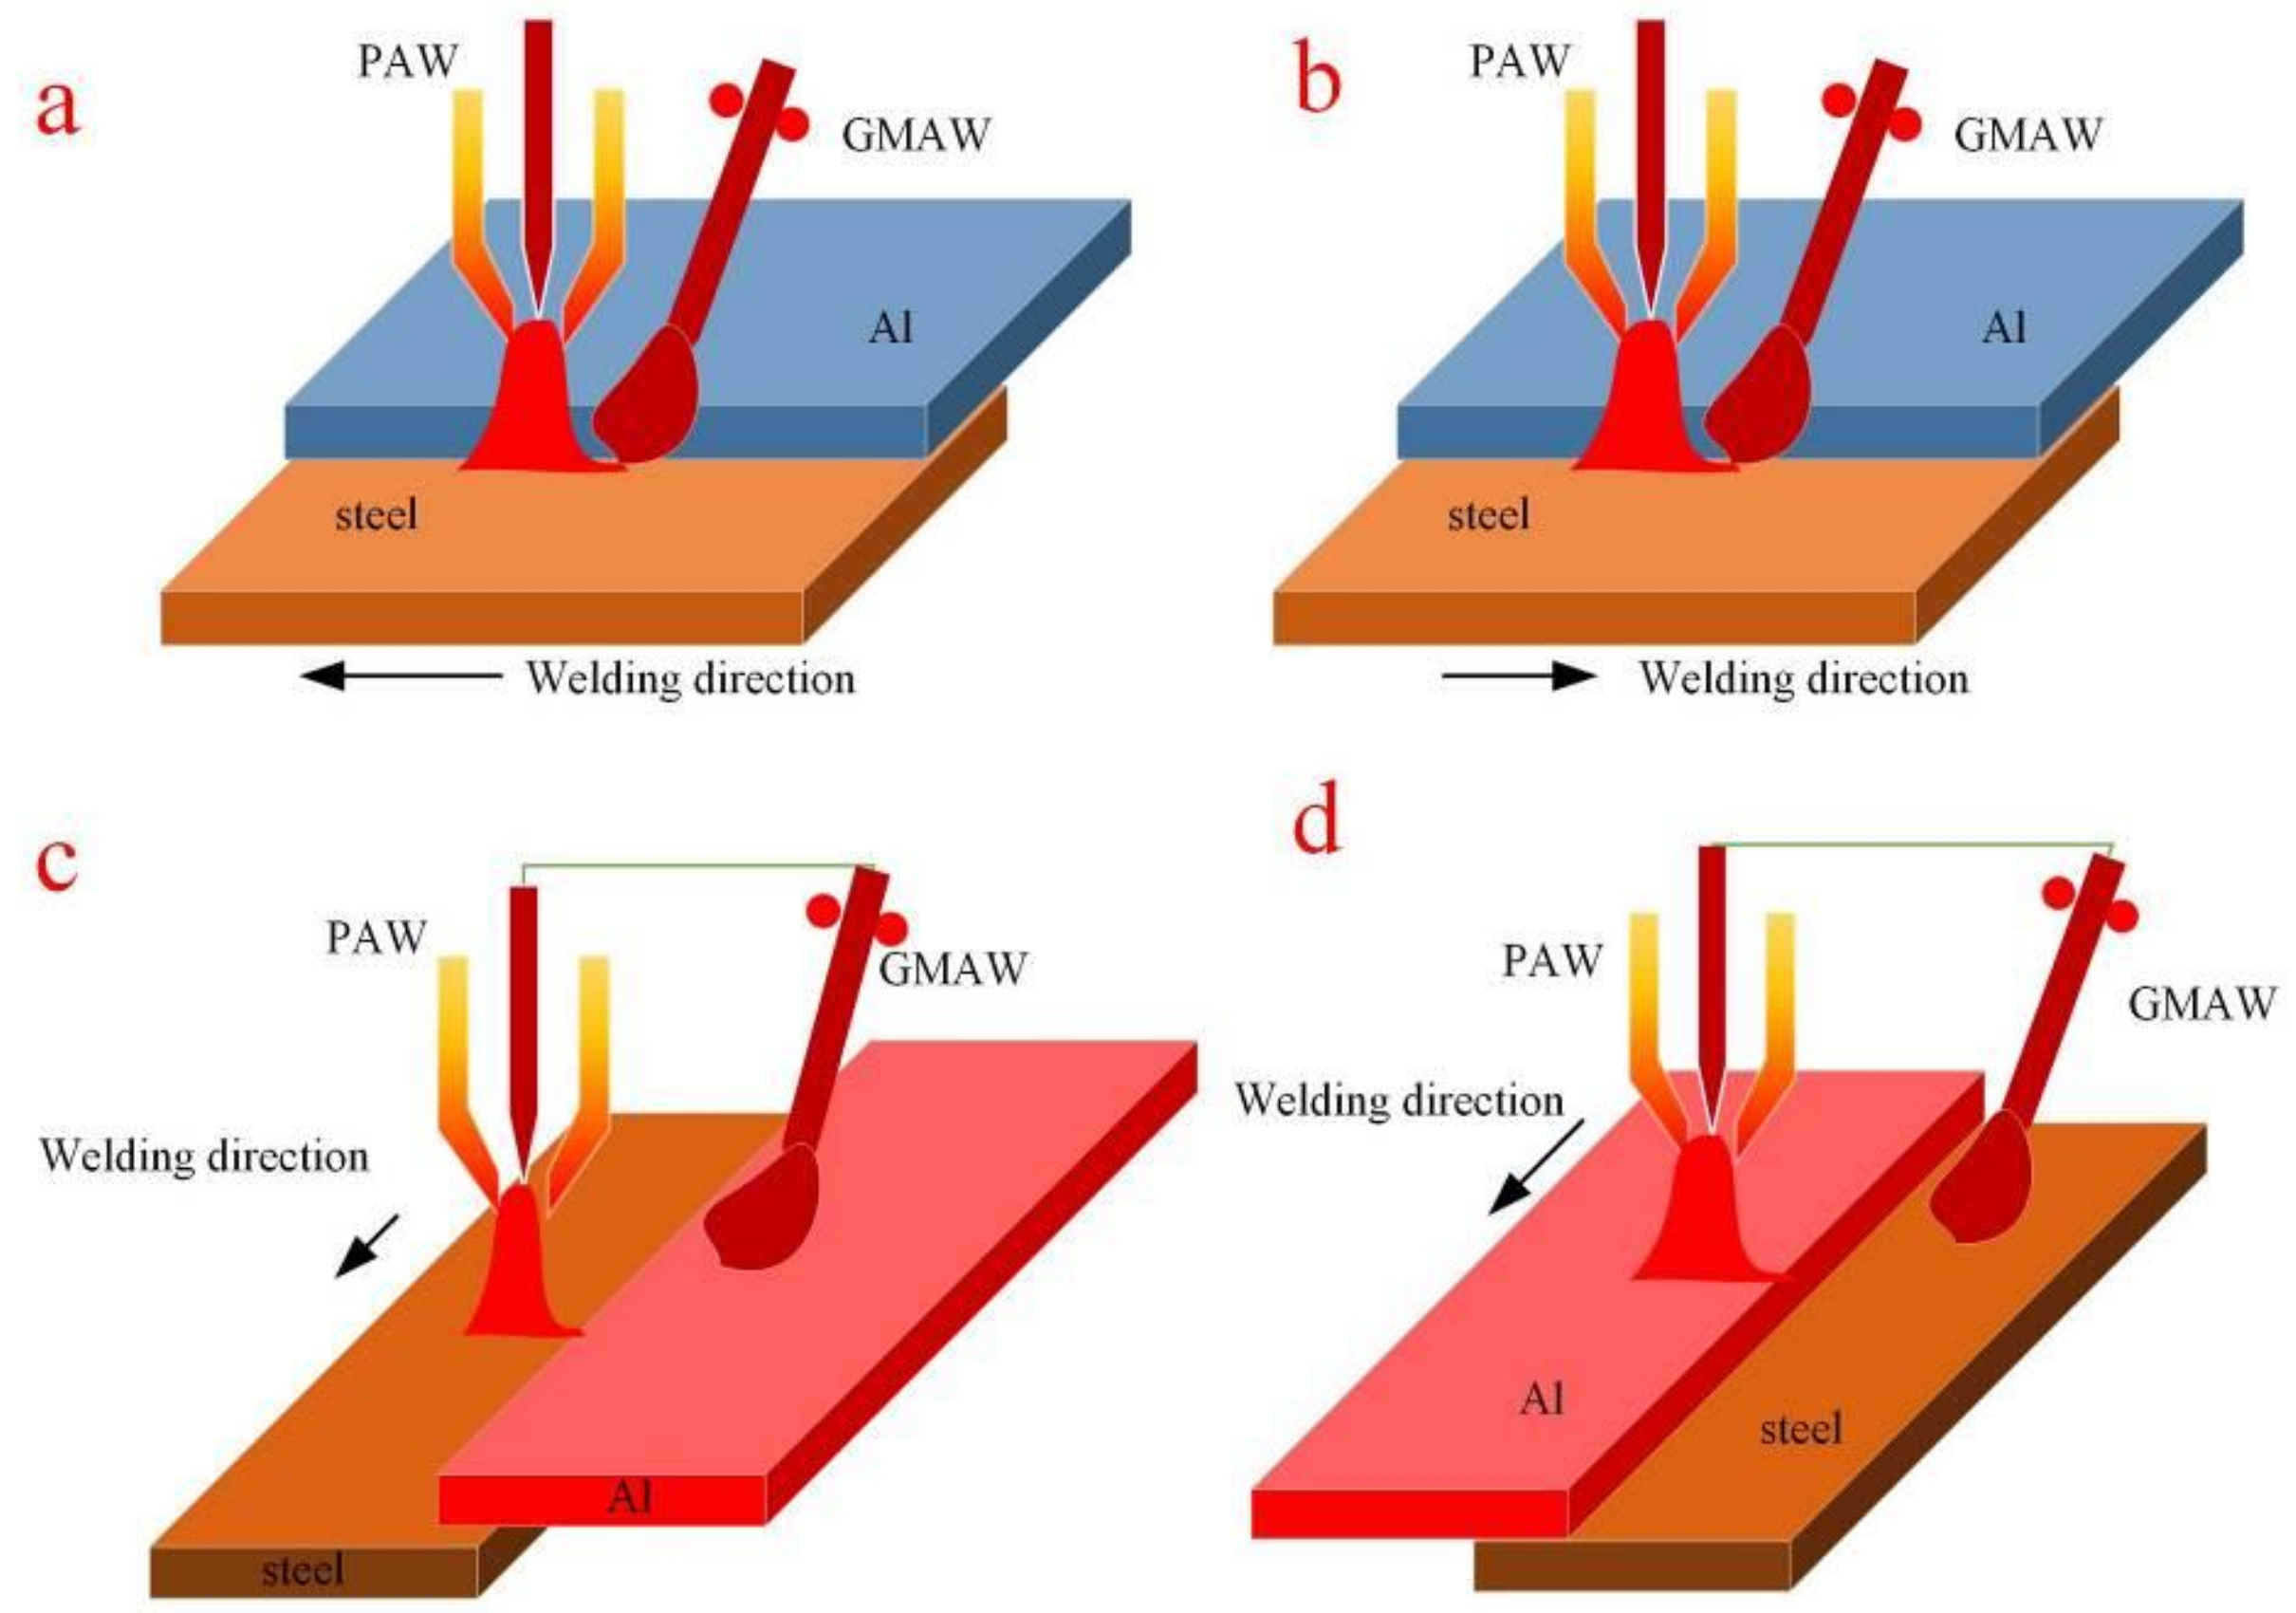
Figure 1 shows the physical and schematic diagram of the plasma-GMAW-P hybrid welding system. The system is mainly composed of the following parts: 1, welding robot; 2, self-designed plasma-GMAW-P hybrid welding gun; 3, MIG power supply; 4, PAW power supply; 5, magnetron power supply; 6, cooling system. The welding robot was a Shanghai Xinshida SRC2.4(SRC2.4) (Xinshida Robotics Co., Ltd., Shanghai, China). The models of PAW power supply, MIG power supply, and water chiller were a DC pulse LHM8-300 A (Chengdu Electric Welding Machine Research Institute, Chengdu, China), Panasonic YD-400GE (Panasonic Welding Systems (Tangshan) Co., Ltd., Tangshan, China), and CW-6000 (Guangzhou Teyu Electromechanical Co., Ltd., Guangzhou, China), respectively.
The zinc-coated steel was made of Q235 and the thickness of the zinc-coat was 11 microns. The whole materials were cut into pieces of 150 mm × 80 mm × 2 mm. The surface oxide film of the base materials was removed by steel brush and then cleaned with alcohol and acetone prior to the welding process.

2.2. Test Design

In order to explore the optimal process parameters for plasma-GMAW-P hybrid welding, welding tests were conducted using hybrid process parameters of different styles, as shown in Table 1. The schematic diagram of the assembled plasma-GMAW-P hybrid welding system is depicted in Figure 2. The Al alloy was placed on the top of the zinc-coated steel with an overlapping width of 10 mm. In the plasma-GMAW-P welding process, the angle between the plasma torch and the GMAW torch was 45°, and the distance between the sources was 7 mm. Plasma welding current, welding speed, nozzle height, plasma shielding gas flow rate, shielding gas flow rate, GMAW-P welding current, and magnetic current were recorded in detail. When the nozzle height was constant at 5 mm, the welding speed was 5 mm/s. Pure argon was used as a plasma shielding gas with a 3 L/min flow rate. The shielding gas, composed of argon (80 vol%) and carbon dioxide (20 vol%), was chosen at a volume flow rate of 12 L/min in all experiments. Moreover, to investigate the effect of the plasma welding arc on the joint, different styles plasma-GMAW-P hybrid welding were applied (Figure 3). Plasma welding current and GMAW-P welding current were 20 A and 80 A, respectively. The filler metal used in the plasma-GMAW-P welding process with different styles was ER4043 with a diameter of 1.2 mm. The chemical composition of the different welding wires is shown in Table 2.
The specimen dimensions were 12 mm × 10 mm, and the specimens’ surfaces were brushed with a buffing machine and then cleaned with acetone and alcohol, in turn. All the workpieces were polished to remove the surface oxidation film before welding and then cleaned with alcohol and acetone. All the metallographic specimens and tensile specimens were cut out from the weld joints by wire cutting after welding. After the metallographic specimens were ground, polished, and then etched, the metallographic test was conducted through an Olympus-DSX510 optical microscope and scanning electron microscope (SEM). A 110 mm × 10 mm overlap joint was removed by wire cutting as a tensile sample. Three sets of tensile specimens were selected for each set of parameters, and the average was taken as the final test results. The tensile tests were carried out with an electronic tensile testing machine (CSS-44400) with a travel speed of 0.5 mm/min.

3. Results and Discussion

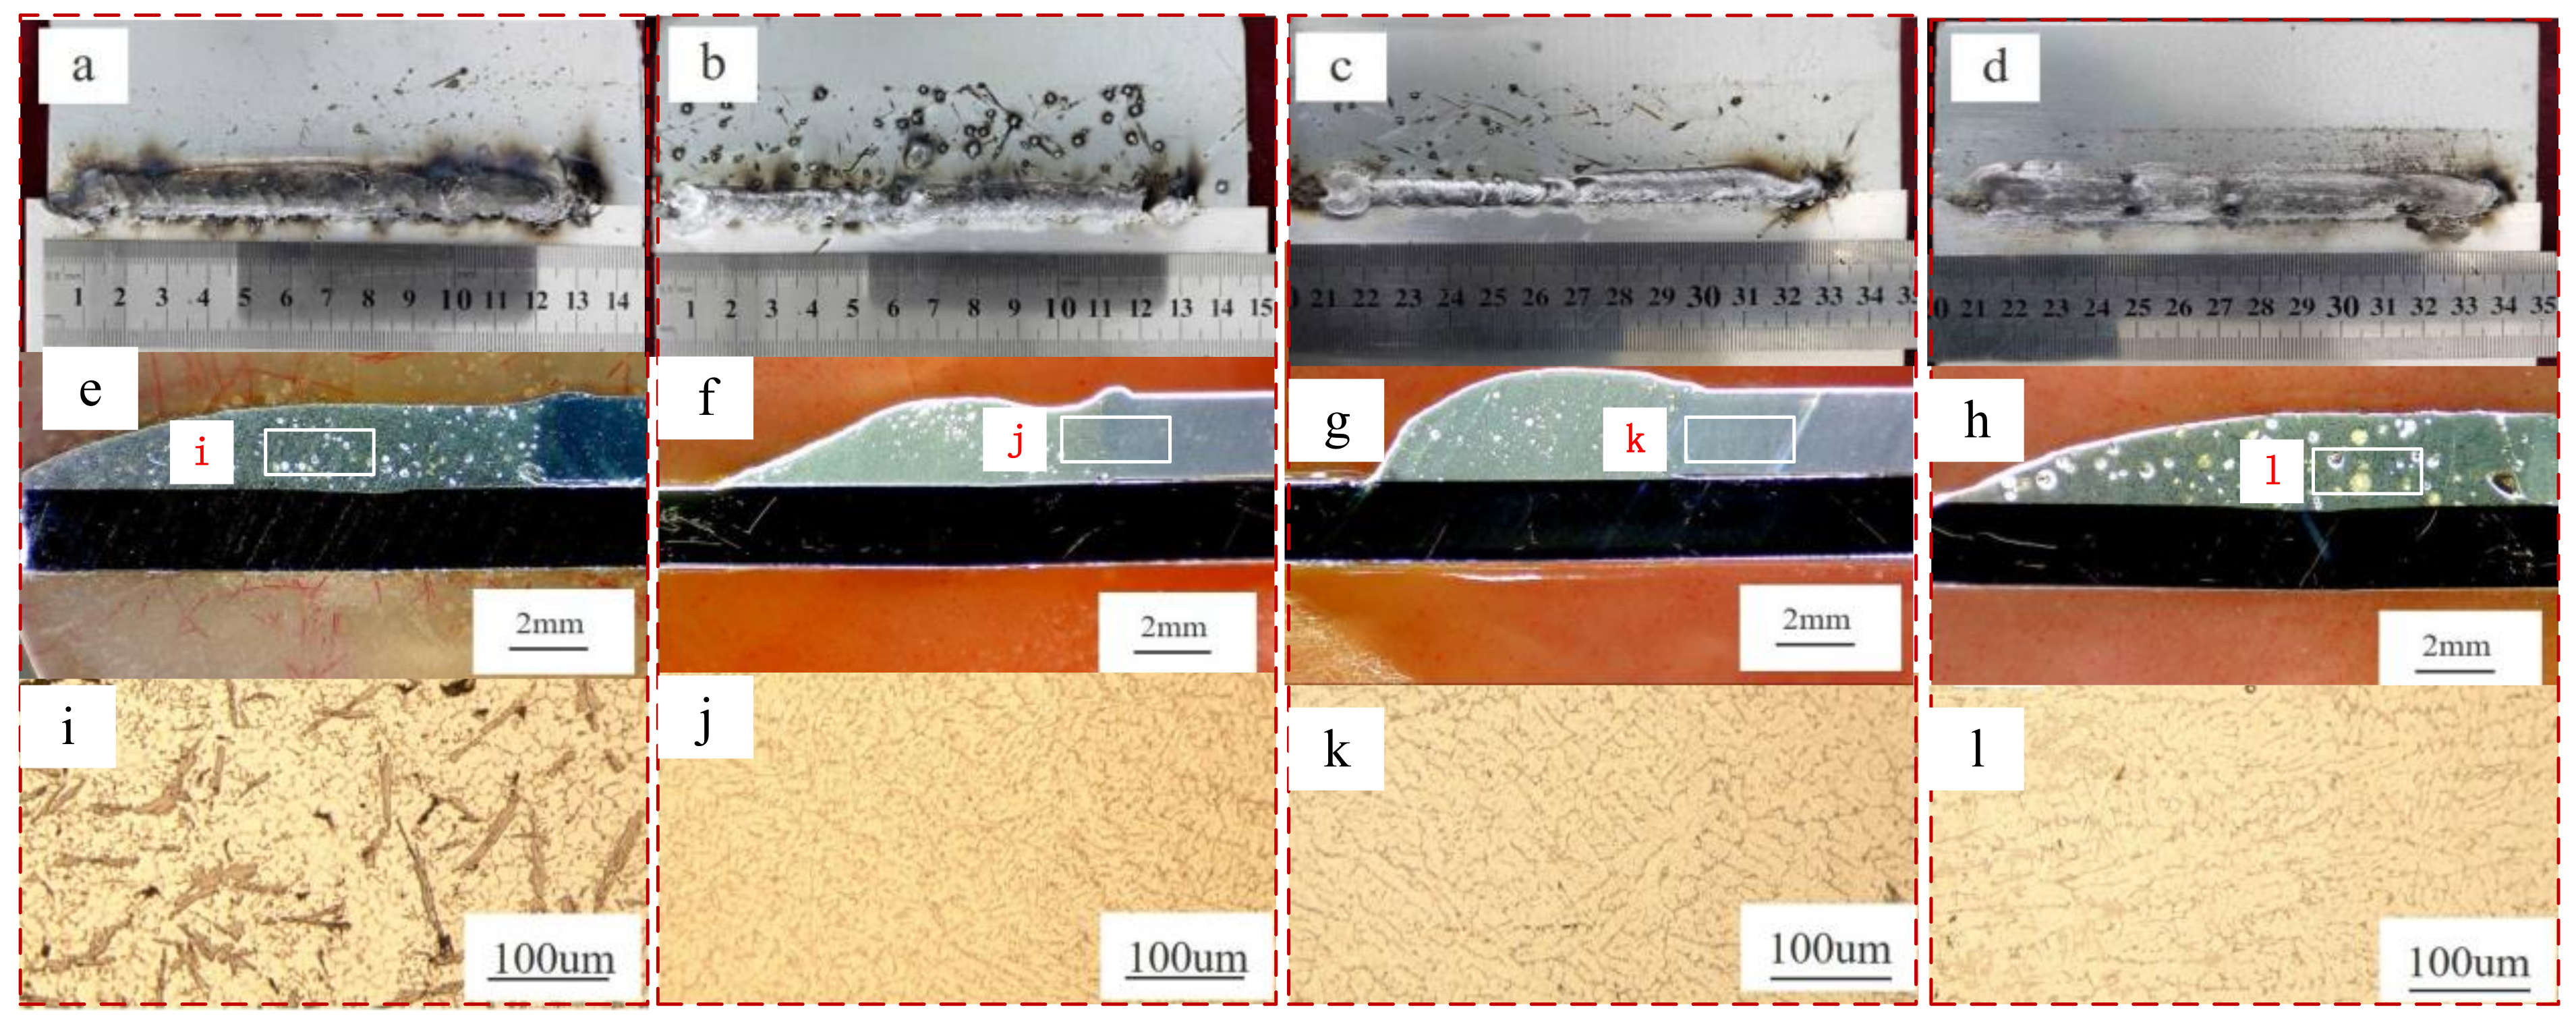
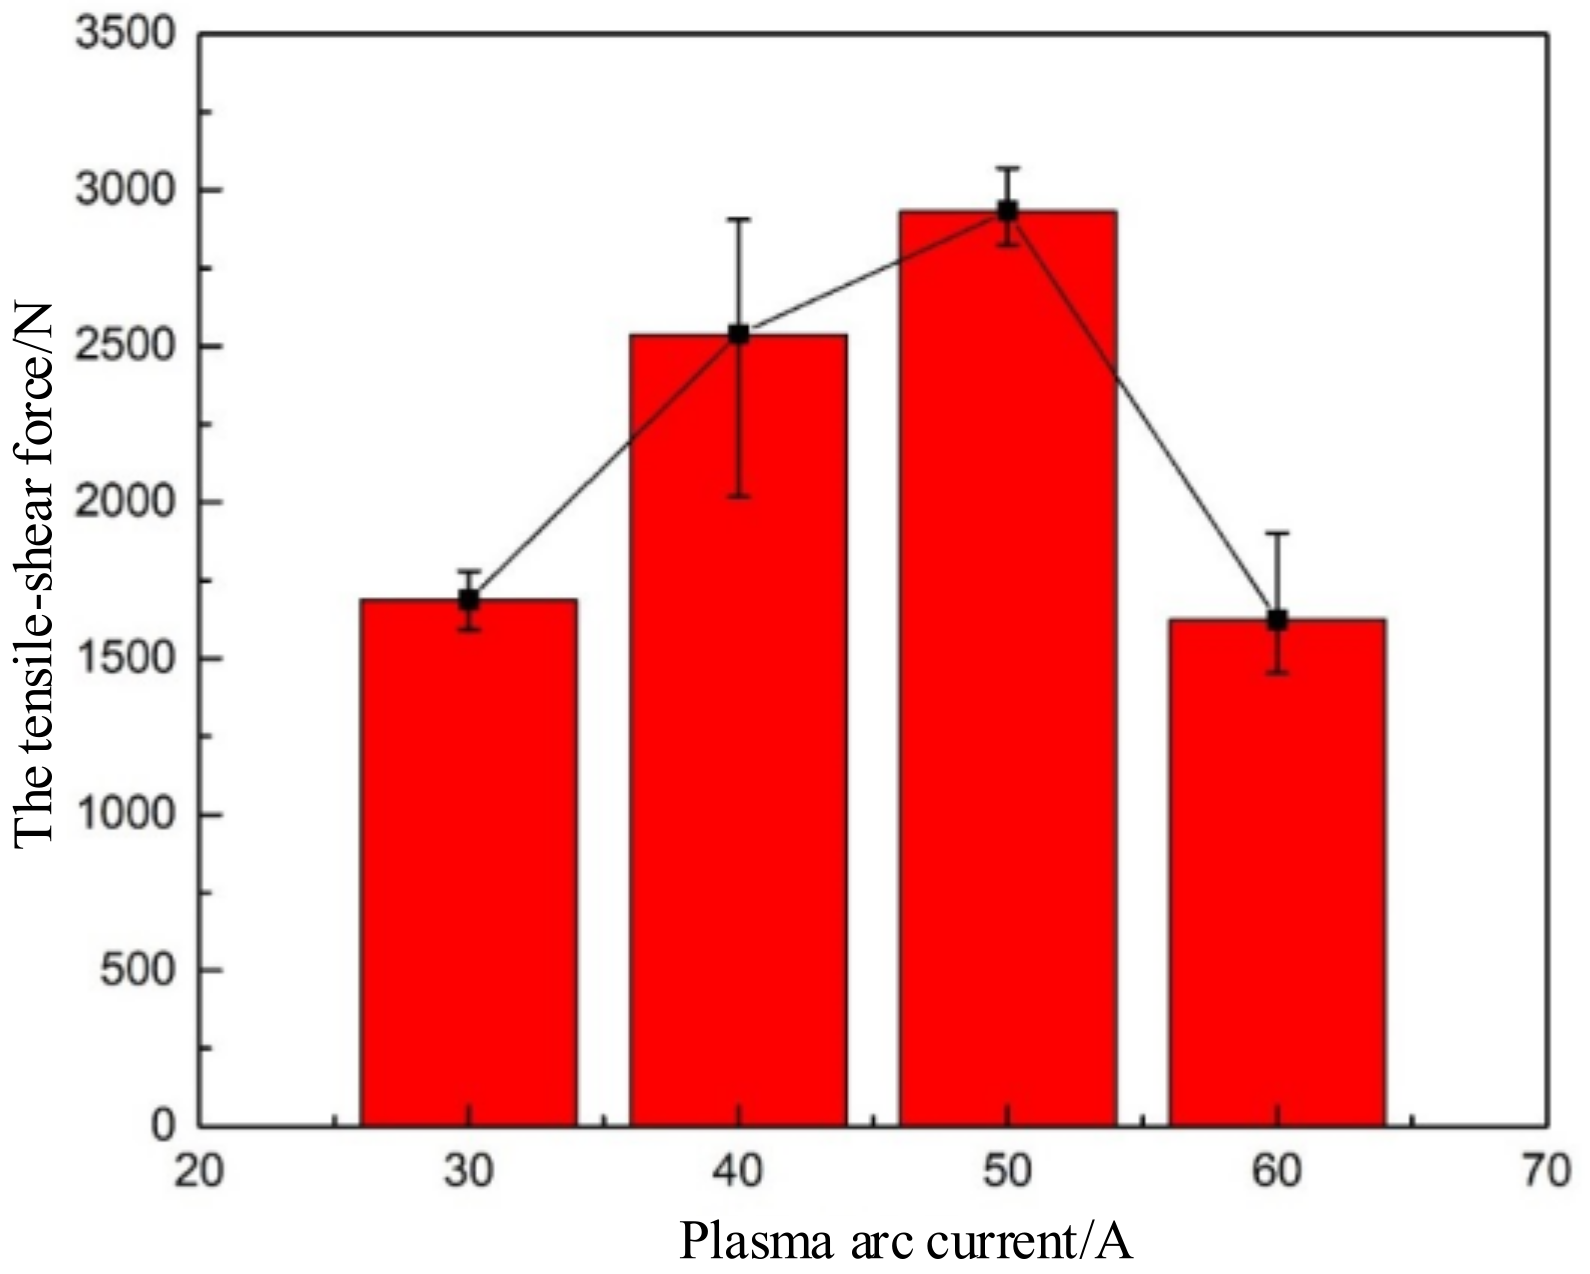
3.1. Effects of Plasma Arc Current and MIG Current on Microstructure and Mechanical Properties of Welded Joints

Figure 4 shows the weld formation and cross-sectional microstructure of #1 under different plasma arc currents when the MIG current was 60 A. As can be seen from Figure 4, the welded joint could be divided into a zinc-rich zone, an interface zone, and a weld zone. As the plasma arc current increased, the bead width decreased. This is because the increase in heat input accelerates the evaporation of the zinc coating. The wetting and spreading effect of zinc coating on aluminum is weakened.
The corresponding tensile-shear force and the fracture surface of the welded joint are shown in Figure 5 and Figure 6, respectively. It can be seen in Figure 5 and Figure 6 that with an increase in plasma arc current, the tensile-shear force of the welded joint increased, and the fracture basically occurred near the fusion line. This is because the increase in plasma current enhances the preheating effect, resulting in a slower rate of temperature increase. This change refines the grain size and improves the tensile-shear force.
Figure 7 shows the weld formation and optical microstructure of the welded joints of #2 with different plasma arc currents when the MIG current is was 70 A. Whether the plasma arc current is too small or too large, the welded joints showed porosity defects. The corresponding tensile-shear force and the fracture surface of the welded joint are shown in Figure 8 and Figure 9, respectively. As can be seen from the figure, with the increase in the plasma arc current, the tensile-shear force of the welded joint first increased and then decreased. The maximum value occurred when the plasma arc current was 50 A, and the maximum tensile-shear force was close to 3000 N. This was due to the increase in plasma arc current, which improved the wetting and spreading effect of aluminum on the steel surface. However, the weak spot of the weld was the heat-affected zone near the fusion line.
At the same time, Figure 7 shows that the melting zone was mainly composed of α-Al and Al-Si eutectic structure. As the plasma arc current increased, the grain size increased. When the plasma arc current was 40 A and 50 A, there were fewer porosity and crack defects in the joint. This was because the increase in the plasma arc current allowed more time for the gas in the weld pool to escape, especially hydrogen. This improved the porosity defects of the weld. However, excessive plasma arc current could accelerate the cooling speed of the weld, which increased the brittleness of the weld and decreased the tensile-shear force, as shown in Figure 8. Figure 9a,c shows that all fractures were located near the weld fusion line, while Figure 9b,d shows that some fractures were located on the boundary line.
Figure 10 shows the weld formation and cross-sectional microstructure of #3 with different plasma arc currents when the MIG current was 80 A. When the plasma arc current was 40 A, the bead width was larger than that of the other groups. The corresponding tensile-shear force and the fracture surface of the welded joint are shown in Figure 11 and Figure 12, respectively. As can be seen in Figure 11, with the increase in the plasma arc current, the tensile-shear force of the weld first increased and then decreased. When the plasma arc current was 20 A, the maximum tensile-shear force occurred, which was the maximum value for all groups of samples, accounting for 65% of the tensile-shear force of the base material. Except for that shown in Figure 12c, all fractures occurred near the weld fusion line.
The optical microstructure of the welded joints is shown in Figure 13. The melting zone mainly had an α-Al and Al-Si eutectic structure composition. With the increase in the plasma arc current, the grain size increased, but the microstructure morphology changed little. When the plasma arc current was 20 A and 30 A, there were fewer defects such as pores and cracks in the joint. Meanwhile, the microstructure of the joint interface area is shown in Figure 13. The reaction layer in the interface region was composed of Fe2Al5 that was dense near the steel side and FeAl3 that grew needle-like toward the aluminum side. Welding heat input had no significant impact on the type and morphology of interfacial compounds but only determined the thickness of the reaction layer. As the plasma arc current increased, the thickness of the reaction layer increased from 5 μm to 12 μm.
Suitable welding heat input can obtain good performance of the welded joints. According to tests #1–#3, when the plasma arc current was 20 A and the MIG current was 80 A, the welded joint obtained had the highest tensile-shear force.

3.2. Effect of Filler Metal on Microstructure and Mechanical Properties of Welded Joints

With the optimal welding process parameters, four different types of welding wires, ER4043, ER4047, ER1070, and ER5356, were selected for cladding, and good weld formation was obtained. The bead width obtained by filling ER4043 and ER4047 is larger. This is because the Si element in the filler metal promotes the wetting and spreading of aluminum on the steel surface, increasing the bead width. According to the XRD results, the obtained joints all contained the Fe0.905Si0.905 phase. The welded joints filled with different metals were observed by SEM and analyzed using EDS. The results are shown in Figure 14 and Table 3, Table 4, Table 5 and Table 6.
It can be seen in Figure 14 that the thickness of the intermetallic compound in the weld interface region obtained by filling ER4043 was 7 to 9 μm, and the weld pore diameter was 30~100 μm. According to the XRD results, the main IMC was Al0.5Fe3Si0.5. The melting zone located on the upper side of the interface zone mainly had of an α-Al and Al-Si eutectic structure composition. The base metal structure of galvanized steel is composed of α ferrite and fine carbide particles. The IMCs in the weld interface region obtained by filling ER4047 were acicular and diffuse toward the aluminum side. According to the XRD results, the main IMC was also Al0.5Fe3Si0.5.
The thickness of the reaction layer in the weld interface area obtained by filling ER1070 was 10–12 μm. It extended toward the steel side. The content of C near the reaction layer was large, and the element C in the galvanized steel diffused here, while the content of C in the melting zone above the reaction layer was very low. There were many welding joint defects obtained by filling ER5356 welding wire. Al, C, and O compounds with large grain sizes appeared on the aluminum side above the reaction layer.
The tensile-shear force and the fracture surface of the welded joints filled with different metals are shown in Figure 15 and Figure 16. The tensile-shear force obtained by filling ER4043 welding wire was the highest followed by that of ER4047, while ER5356 had the lowest force. They accounted for 65%, 56%, 46%, and 27% of the tensile-shear force of the base metal, respectively. The tensile-shear force of the weld filled with ER4047 welding wire was less than ER4043. This was because too much Si element in the ER4047 welding wire entered the molten pool during the welding process, increasing the viscosity of the weld pool. It increased the difficulty of gas escaping from the weld pool, resulting in porosity defects in the welded joint.
Figure 16 shows the fracture surface of a welded joint, where the fracture of the welded joint obtained by filling ER4043, ER4047, and ER5356 welding wires was located near the fusion line. However, the fracture of the welded joint filled with ER1070 welding wire was located at the interface. According to EDS analysis, there were high-C compounds near the interface region of the joint filled with ER1070 welding wire, which was the reason for the fracture of the sample at the interface.

3.3. The Effect of the Plasma Welding Arc on the Joint

The macromorphology of the welded joints obtained by plasma-GMAW-P hybrid welding with different styles is shown in Figure 17. As shown in Figure 17, the welding spatters were generated during the whole welding process but were located on the zinc-coated steel side. However, there was no effective connection between 6061 aluminum and zinc-coated steel in Figure 17b. Furthermore, the cross-section of the welded samples and the tensile-shear specimens could not be obtained. This is because model 2 did not take advantage of plasma arc preheating and MIG arc filling. The microstructure and joint properties via plasma-GMAW-P are compared with those of the other three styles below.
Figure 18 depicts the optical microstructure of the joints produced by plasma-GMAW-P with different styles. As shown in Figure 18a–c, the height of the fusion zone changed in different ways. The height of the fusion zone of the joints welded via plasma-GMAW-P with model 4 reached the maximum, but the wetting angle of the joints welded via plasma-GMAW-P with model 1 was the minimum. This was attributed to the plasma arc located on the Al side, where most of the generated heat melted the Al alloy. Furthermore, in comparison with Figure 18g–i, the microstructure of the fusion zone was mainly composed of an α-Al and Al-Si eutectic structure. The grain size of the welded joints in Figure 18h is smaller than that of the other two styles. This was attributed to the plasma arc mainly acting on the steel side in this model and the reduced heat distributed to the Al alloy side, resulting in grain refinement in the fusion zone. As shown in Figure 18d–f, there was no obvious difference in the interface structure.
The SEM images of the interface structure of the joints welded via Plasma-GMAW-P with different styles are shown in Figure 19, Figure 20 and Figure 21. As shown in Figure 19, the interface did not form a valid connection between the Al alloy and the zinc-coated steel via plasma-GMAW-P with model 1. The pores with different sizes appeared in the fusion zone. According to the EDS results, FeAl2 and FeAl3 IMCs were formed at interface.
Figure 20 shows the SEM image of the interface structure obtained via plasma-GMAW-P with model 3. As shown in Figure 20b, a transverse crack was formed at the interface, which did not achieve a valid connection. An obvious reaction layer was formed on the Al side. This proved that the Fe elements and Al elements diffused each other. According to the EDS results, FeAl2 and FeAl3 IMCs were formed at the interface.
Figure 21 shows the SEM image of the interface structure via plasma-GMAW-P with model 4. As shown in Figure 21b, an obvious reaction layer was formed at the interface, which achieved a valid connection. According to the EDS results, FeAl2 IMC was formed at the interface.
The tensile-shear force and the fracture surface of the welded joints by plasm-GMAW-P with different styles are shown in Figure 22 and Figure 23. As shown, the tensile-shear force of the joint made by plasma-GMAW-P with model 1 reached a maximum of 3322 N, and a fracture occurred at the weld seam. Moreover, the fracture of the joints welded by plasma-GMAW-P with model 3 occurred at the weld seam. However, the fracture of the joints welded by plasma-GMAW-P with model 4 occurred at the interface, which reached the minimum tensile-shear force of 2236 N, attributed to the IMCs’ thickness.

4. Conclusions

Novel plasma-GMAW-P hybrid welding was applied to join 6061 aluminum and zinc-coated steel. The following conclusions were obtained:
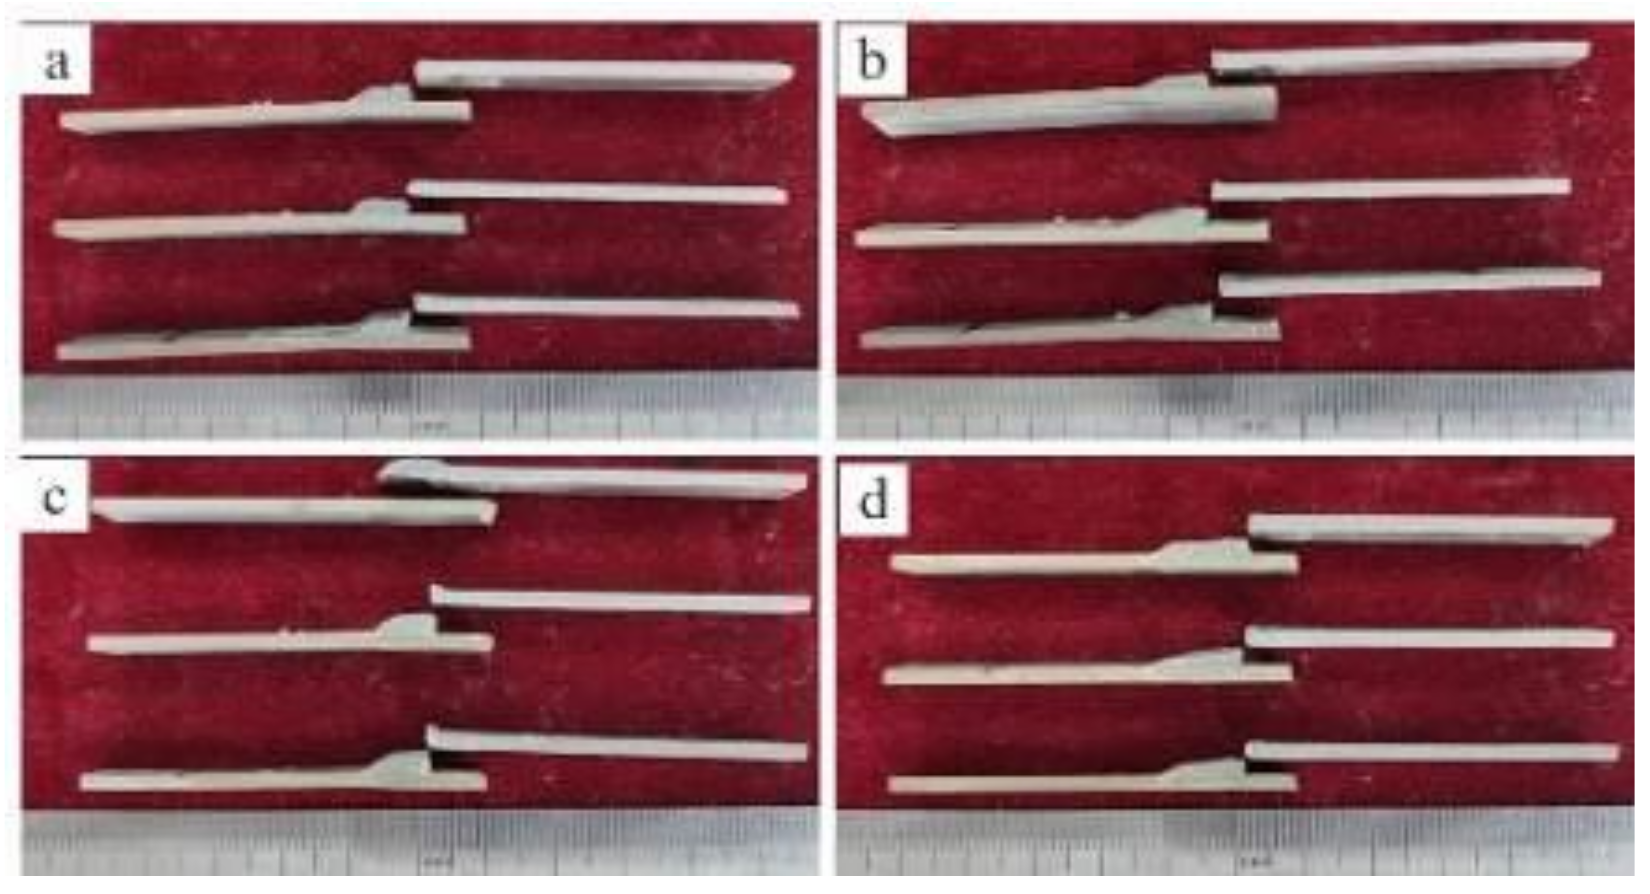
  • According to the microstructure characteristics, the welded joint can be divided into a zinc-rich zone, an interface zone, and a weld zone. When the heat input is approximately equal, the combination of the lower plasma arc current and the higher MIG current can achieve a higher tensile-shear force and a good weld microstructure. When the plasma arc current is 20 A and the MIG current is 80 A, the specimen with the highest tensile-shear force is obtained, reaching 65% of the 6061 aluminum base material.
  • The welding test conducted with the optimal process parameters showed that the weld strength obtained by filling ER4043 welding wire was the highest, followed by that obtained with ER4047, ER1070, and ER5356, accounting for 65%, 56%, 46%, and 27% of the tensile-shear force of the base material, respectively. The joint samples obtained by filling only ER1070 welding wires were fractured at the boundary line, while the rest of the samples were fractured near the fusion line. According to the EDS results, there were high-C compounds near the interface region of the ER1070 welding wire sample, which was the reason for the fracture at the interface. In the ER4047 welding wire joint, excessive Si elements entered the weld pool, increasing the viscosity of the weld pool and the difficulty of gas escape and resulted in more porosity defects. This also led to a lower tensile-shear force of the joint with ER4047 than ER4043.
  • The action position of the plasma arc played a significant role in the Al/steel interface, which directly influenced the strength of the welded joints. Regardless of the style of plasma-GMAW-P used to obtain the joints, Fe-Al IMCs appeared at the interface. When the plasma arc was in front of the welding direction and GMAW-P arc was in the rear, the tensile-shear force reached a maximum of 3322 N.

Author Contributions

Conceptualization, H.Z. (Hongchang Zhang) and H.Z. (Hongtao Zhang); methodology, H.Z. (Hongchang Zhang); software, J.G.; validation, W.H. and Z.S.; formal analysis, W.H.; investigation, H.Z. (Hongtao Zhang); resources, J.Y.; data curation, J.G.; writing—original draft preparation, H.Z. (Hongchang Zhang); writing—review and editing, Y.L.; visualization, W.H.; supervision, Y.L.; project administration, H.Z. (Hongtao Zhang); funding acquisition, H.Z. (Hongtao Zhang) and Y.L. All authors have read and agreed to the published version of the manuscript.

Funding

This work was sponsored by the National Natural Science Foundation of China (No. U22B20127), the National Natural Science Foundation of China (No. 52175305), and Jining City Global List of Major Projects (No. 2022JBZP004).

Data Availability Statement

Not applicable.

Conflicts of Interest

The authors declare no conflict of interest.

References

  1. Zhou, L.; Luo, L.Y.; Tan, C.W.; Li, Z.Y.; Song, X.G.; Zhao, H.Y.; Huang, Y.X.; Feng, J.C. Effect of Welding Speed on Microstructural Evolution and Mechanical Properties of Laser Welded-Brazed Al/Brass Dissimilar Joints. Opt. Laser Technol. 2018, 98, 234–246. [Google Scholar] [CrossRef]
  2. Lu, Y.; Sage, D.D.; Fink, C.; Zhang, W. Dissimilar Metal Joining of Aluminium to Zinc-Coated Steel by Ultrasonic plus Resistance Spot Welding–Microstructure and Mechanical Properties. Sci. Technol. Weld. Join. 2020, 25, 218–227. [Google Scholar] [CrossRef]
  3. Lu, Y.; Walker, L.; Kimchi, M.; Zhang, W. Microstructure and Strength of Ultrasonic Plus Resistance Spot Welded Aluminum Alloy to Coated Press Hardened Boron Steel. Met. Mater. Trans. A 2020, 51, 93–98. [Google Scholar] [CrossRef]
  4. Li, Y.; Geng, S.; Zhu, Z.; Wang, Y.; Mi, G.; Jiang, P. Effects of Heat Source Configuration on the Welding Process and Joint Formation in Ultra-High Power Laser-MAG Hybrid Welding. J. Manuf. Process. 2022, 77, 40–53. [Google Scholar] [CrossRef]
  5. Kaushik, P.; Dwivedi, D.K. Effect of Tool Geometry in Dissimilar Al-Steel Friction Stir Welding. J. Manuf. Process. 2021, 68, 198–208. [Google Scholar] [CrossRef]
  6. Zhang, G.; Su, W.; Zhang, J.; Wei, Z. Friction Stir Brazing: A Novel Process for Fabricating Al/Steel Layered Composite and for Dissimilar Joining of Al to Steel. Met. Mater Trans. A 2011, 42, 2850–2861. [Google Scholar] [CrossRef]
  7. Ge, Y.; Xia, Y. Mechanical Characterization of a Steel-Aluminum Clinched Joint under Impact Loading. Thin-Walled Struct. 2020, 151, 106759. [Google Scholar] [CrossRef]
  8. Su, Y.; Hua, X.; Wu, Y. Effect of Input Current Modes on Intermetallic Layer and Mechanical Property of Aluminum–Steel Lap Joint Obtained by Gas Metal Arc Welding. Mater. Sci. Eng. A 2013, 578, 340–345. [Google Scholar] [CrossRef]
  9. Lu, Y.; Mayton, E.; Song, H.; Kimchi, M.; Zhang, W. Dissimilar Metal Joining of Aluminum to Steel by Ultrasonic plus Resistance Spot Welding—Microstructure and Mechanical Properties. Mater. Des. 2019, 165, 107585. [Google Scholar] [CrossRef]
  10. Yazdipour, A.; Heidarzadeh, A. Dissimilar Butt Friction Stir Welding of Al 5083-H321 and 316L Stainless Steel Alloys. Int. J. Adv. Manuf. Technol. 2016, 87, 3105–3112. [Google Scholar] [CrossRef]
  11. Su, Y.; Hua, X.; Wu, Y. Influence of Alloy Elements on Microstructure and Mechanical Property of Aluminum–Steel Lap Joint Made by Gas Metal Arc Welding. J. Mater. Process. Technol. 2014, 214, 750–755. [Google Scholar] [CrossRef]
  12. Wan, L.; Huang, Y. Microstructure and Mechanical Properties of Al/Steel Friction Stir Lap Weld. Metals 2017, 7, 542. [Google Scholar] [CrossRef]
  13. Xia, H.; Tao, W.; Li, L.; Tan, C.; Zhang, K.; Ma, N. Effect of Laser Beam Models on Laser Welding–Brazing Al to Steel. Opt. Laser Technol. 2020, 122, 105845. [Google Scholar] [CrossRef]
  14. Zhang, G.; Chen, M.; Shi, Y.; Huang, J.; Yang, F. Analysis and Modeling of the Growth of Intermetallic Compounds in Aluminum–Steel Joints. RSC Adv. 2017, 7, 37797–37805. [Google Scholar] [CrossRef]
  15. Das, A.; Shome, M.; Goecke, S.-F.; De, A. Numerical Modelling of Gas Metal Arc Joining of Aluminium Alloy and Galvanised Steels in Lap Joint Configuration. Sci. Technol. Weld. Join. 2016, 21, 303–309. [Google Scholar] [CrossRef]
  16. Yu, F.; Wei, Y.; Ji, Y.; Chen, L.-Q. Phase Field Modeling of Solidification Microstructure Evolution during Welding. J. Mater. Process. Technol. 2018, 255, 285–293. [Google Scholar] [CrossRef]
  17. Miranda-Pérez, A.F.; Rodríguez-Vargas, B.R.; Calliari, I.; Pezzato, L. Corrosion Resistance of GMAW Duplex Stainless Steels Welds. Materials 2023, 16, 1847. [Google Scholar] [CrossRef]
  18. Figner, G.; Vallant, R.; Weinberger, T.; Enzinger, N.; Schröttner, H.; Paśič, H. Friction Stir Spot Welds between Aluminium and Steel Automotive Sheets: Influence of Welding Parameters on Mechanical Properties and Microstructure. Weld World 2009, 53, R13–R23. [Google Scholar] [CrossRef]
  19. Yang, M.; Ma, H.; Shen, Z.; Chen, D.; Deng, Y. Microstructure and Mechanical Properties of Al-Fe Meshing Bonding Interfaces Manufactured by Explosive Welding. Trans. Nonferrous Met. Soc. China 2019, 29, 680–691. [Google Scholar] [CrossRef]
  20. Fujii, H.T.; Goto, Y.; Sato, Y.S.; Kokawa, H. Microstructure and Lap Shear Strength of the Weld Interface in Ultrasonic Welding of Al Alloy to Stainless Steel. Scr. Mater. 2016, 116, 135–138. [Google Scholar] [CrossRef]
  21. Kanemaru, S.; Sasaki, T.; Sato, T.; Era, T.; Tanaka, M. Study for the Mechanism of TIG-MIG Hybrid Welding Process. Weld World 2015, 59, 261–268. [Google Scholar] [CrossRef]
  22. Chen, J.; Wu, C.S.; Chen, M.A. Improvement of Welding Heat Source Models for TIG-MIG Hybrid Welding Process. J. Manuf. Process. 2014, 16, 485–493. [Google Scholar] [CrossRef]
  23. Kanemaru, S.K.; Sasaki, T.; Sato, T.; Mishima, H.; Tashiro, S.; Tanaka, M. Study for the Arc Phenomena of TIG-MIG Hybrid Welding Process by 3D Numerical Analysis Model. Querterly J. Jpn. Weld. Soc. 2012, 30, 323–330. [Google Scholar] [CrossRef]
  24. Cai, D.T.; Han, S.G.; Zheng, S.D.; Yan, D.J.; Luo, J.Q.; Liu, X.L.; Luo, Z.Y. Plasma-MIG Hybrid Welding Process of 5083 Marine Aluminum Alloy. In Proceedings of the Materials Science Forum, Salt Lake City, UT, USA, 23–27 October 2016. [Google Scholar]
  25. Ding, M.; Liu, S.S.; Zheng, Y.; Wang, Y.C.; Li, H.; Xing, W.Q.; Yu, X.Y.; Dong, P. TIG–MIG Hybrid Welding of Ferritic Stainless Steels and Magnesium Alloys with Cu Interlayer of Different Thickness. Mater. Des. 2015, 88, 375–383. [Google Scholar] [CrossRef]
  26. Jiang, H.; Liao, Y.; Gao, S.; Li, G.; Cui, J. Comparative Study on Joining Quality of Electromagnetic Driven Self-Piecing Riveting, Adhesive and Hybrid Joints for Al/Steel Structure. Thin-Walled Struct. 2021, 164, 107903. [Google Scholar] [CrossRef]
Figure 1. The physical and schematic diagram of plasma-GMAW-P hybrid welding system, (a) the physical diagram of plasma-GMAW-P hybrid welding system, and (b) the schematic diagram of plasma-GMAW-P hybrid welding system.
Crystals 13 00723 g001
Figure 2. Schematic diagram of plasma−GMAW−P hybrid welding.
Crystals 13 00723 g002
Figure 3. Schematic diagram of plasma−GMAW−P hybrid welding with different types: (a) model 1 (plasma arc was in front and GMAW arc was in rear), (b) model 2 (GMAW arc was in front and plasma arc was in rear), (c) model 3 (plasma arc was located on steel side and GMAW arc was located on Al side), and (d) model 4 (plasma arc was located on Al side, and GMAW arc was located on steel side).
Crystals 13 00723 g003
Figure 4. The weld formation and the cross-sectional microstructure with different plasma arc currents when the MIG current is 60 A. (a) Plasma arc current is 40 A; (b) plasma arc current is 50 A; (c) plasma arc current is 60 A.
Crystals 13 00723 g004
Figure 5. The tensile-shear force of the welded joint with different plasma arc currents when the MIG current is 60 A.
Crystals 13 00723 g005
Figure 6. The fracture surface of the welded joint with different plasma arc currents when the MIG current is 60 A. (a) Plasma arc current is 40 A; (b) plasma arc current is 50 A; (c) plasma arc current is 60 A.
Crystals 13 00723 g006
Figure 7. The weld formation and optical microstructure of the welded joints with different plasma arc currents when the MIG current is 70 A. (a,e,i) plasma arc current is 30 A; (b,f,j) plasma arc current is 40 A; (c,g,k) plasma arc current is 50 A; (d,h,l) plasma arc current is 60 A.
Crystals 13 00723 g007
Figure 8. The tensile-shear force of the welded joint by plasma-GMAW-P with different plasma arc currents when the MIG current is 70 A.
Crystals 13 00723 g008
Figure 9. The fracture surface of the welded joint by plasma-GMAW-P with different plasma arc currents when the MIG current is 70 A. (a) Plasma arc current is 30 A; (b) plasma arc current is 40 A; (c) plasma arc current is 50 A; (d) plasma arc current is 60 A.
Crystals 13 00723 g009
Figure 10. The weld formation of the welded joints with different plasma arc currents when the MIG current is 80 A. (a) Plasma arc current is 10 A; (b) plasma arc current is 20 A; (c) plasma arc current is 30 A; (d) plasma arc current is 40 A.
Crystals 13 00723 g010
Figure 11. The tensile-shear force of the welded joint.
Crystals 13 00723 g011
Figure 12. The fracture surface of the welded joint. (a) Plasma arc current is 10 A; (b) plasma arc current is 20 A; (c) plasma arc current is 30 A; (d) plasma arc current is 40 A.
Crystals 13 00723 g012
Figure 13. Optical microstructure of the welded joints. (a,c,e) plasma arc current is 10 A; (b,d,f) plasma arc current is 20 A; (g,i,k) plasma arc current is 30 A; (h,j,l) plasma arc current is 40 A.
Crystals 13 00723 g013
Figure 14. The SEM microstructure of the overall image and the enlargement image of zone X with different types of welding wires. (a) ER4043; (b) ER4047; (c) ER1070; (d) ER5356.
Crystals 13 00723 g014
Figure 15. The tensile-shear force of the welded joints filled with different metals.
Crystals 13 00723 g015
Figure 16. The fracture surface of the welded joints filled with different metals. (a) ER4043; (b) ER4047; (c) ER1070; (d) ER5356.
Crystals 13 00723 g016
Figure 17. Surface appearances of plasma-GMAW-P with different styles. (a) model 1; (b) model 2; (c) model 3; (d) model 4.
Crystals 13 00723 g017
Figure 18. Optical microstructure of the joints welded via plasma-GMAW-P with different styles. (a,d,g) model 1; (b,e,h) model 3; (c,f,i) model 4.
Crystals 13 00723 g018
Figure 19. The SEM microstructure of joints via plasma-GMAW-P with model 1. (a) The overall image; (b) the enlargement image of zone X.
Crystals 13 00723 g019
Figure 20. The SEM microstructure of joints formed via plasma-GMAW-P with model 3. (a) The overall image; (b) the enlargement image of zone X.
Crystals 13 00723 g020
Figure 21. The SEM microstructure of joints formed via plasma-GMAW-P with model 4. (a) The overall image; (b) the enlargement image of zone X.
Crystals 13 00723 g021
Figure 22. The tensile-shear force of the joint welded by plasma-GMAW-P with different styles.
Crystals 13 00723 g022
Figure 23. The fracture surface of the joint welded by plasma-GMAW-P with different styles. (a) model 1; (b) model 3; (c) model 4.
Crystals 13 00723 g023
Table 1. The hybrid process parameters of different styles.
Parameter SetPlasma Arc CurrentMIG CurrentFiller Metal
#140, 50, 6060ER4043
#230, 40, 50, 6070ER4043
#310, 20, 30, 4080ER4043
#42080ER4047, ER1070, ER5356
Table 2. The chemical compositions of different welding wires (wt.%).
Welding WireSiCuFeMnTiZnMgAl
ER40434.50–6.000.300.800.050.200.100.05Bal.
ER404711.0–13.00.300.800.15-0.200.10Bal.
ER10700.3-0.3----Bal.
ER53560.250.100.400.05–0.200.06–0.200.104.50–5.50Bal.
Table 3. The EDS results of joints filled with ER4043.
Elements (at.%)FeAlSi.CuO
A198.480.200.261.06-
A238.9057.912.370.82-
A323.6571.314.400.64-
A43.5788.946.280.28-
A50.3298.10-0.240.24
Table 4. The EDS results of joints filled with ER4047.
Elements (at.%)FeAlSi.CuZn
A110.9572.8715.890.29-
A29.7266.6023.410.27-
A39.8966.6022.957.33-
A48.9878.2411.43-1.35
A513.2663.8621.36-1.52
Table 5. The EDS results of joints filled with ER1070.
Elements (at.%)FeAlCAuOMg
A176.95-20.861.16--
A21.9797.48----
A378.02-20.490.70--
A40.8289.756.95-0.750.98
A577.63-21.37---
Table 6. The EDS results of joints filled with ER5356.
Elements (at.%)FeAlCMgOZn
A12.1371.0420.643.841.24-
A2-76.3717.413.851.71-
A3-29.938.291.2051.956.23
A40.6864.3616.861.366.4510.28
A567.1711.9320.23---
A674.49-24.62---
A774.30-23.41---
A80.5133.4118.862.8437.056.04
A90.7136.8810.432.4438.978.75
A1022.3157.9519.74---
Disclaimer/Publisher’s Note: The statements, opinions and data contained in all publications are solely those of the individual author(s) and contributor(s) and not of MDPI and/or the editor(s). MDPI and/or the editor(s) disclaim responsibility for any injury to people or property resulting from any ideas, methods, instructions or products referred to in the content.

