Abstract
In order to extend their use, controlled SiOH SiO2 surfaces were fabricated and investigated. A study of the effect of heat treatment on the structural and surface changes of a natural flint SiO2 aggregate subjected to chemical treatment was carried out. The obtained samples were subjected to thermal treatment at three different temperatures: 500, 700, and 1000 °C. The samples were investigated using different techniques. X-ray diffractions (XRD) were used to follow the structure’s evolution with the heat treatment. The decrease in the FWHM of the SiO2-(101) peak showed that the crystalline quality improved upon heating. This result was confirmed by Fourier transform infrared spectroscopy (FTIR). The morphology of the SiO2 samples was characterized using a Variable Pressure scanning electron microscope (VP-SEM), revealing the presence of disordered needles of nanometric sizes (∼500 nm) on the surface of the grains, which could be eliminated by heating at higher temperatures. Furthermore, FTIR spectroscopy also confirmed that heating caused a reduction in OH groups on the surface. Thermogravimetry (TG) was used as the reference method to determine the hydroxyl group content. The OH groups found on the surface of the sample without and with heat treatment at 500, 700, and 1000 °C were 0.83, 0.44, 0.28, and 0.2 mmol/g, respectively. This study allowed us to obtain a controlled SiO2 surface and provides new insights into the use of SiO2 flint surfaces for new applications as a functional filler in polymers/asphalts composites.
1. Introduction
The valorization of natural resources is more and more requested. This demand is greater when the resources do not have a negative impact on the environment compared to nanoparticles that are used as fillers in composites and have harmful consequences for the recycling of these materials. Natural silica aggregates are one of the best options. In addition, some valorizations of solid waste use advanced thermo-chemical processes [1]. In this case, their recycling after use is even facilitated and leads to the development of new circular economy models [2,3,4,5,6,7,8,9,10] if the surface changes are controlled. The many matrix composites with fillers are finding increasingly widespread applications in the industrial and academic research sectors. In fact, silica fillers are widely used in industries as fillers, catalysts, adsorbents, chromatographic, and so on [11,12,13,14,15,16,17,18]. The adsorption, adhesion, chemical, and catalytic properties of silica particles depend on the chemistry of the particle’s surface. The surface chemistry of silica has become a focus of study for many practical applications. Both “chemisorption” and “physical adsorption” of water has been reported to exist on the surface of silica [18,19,20,21,22]. According to De Farias and Airoldi [19,23] and S. Ek [20,24], three types of hydroxyl group, including isolated silanols, germinal, and vicinal silanols, exist in silica particles, whose concentration and type depend on the temperature of treatment under vacuum or gas flow, as confirmed by thermal gravity analyses. Hydroxyl groups play the main role in various processes at the surface [25,26,27,28].
The surface of silica dehydrates as the temperature of the thermal treatment increases. Dehydration is produced by the removal of the adsorbed water and the thermal dehydration reaction, where two neighboring silanols condense to form a water molecule and a siloxane bridge (Si-OH + HO-Si ↔ Si-O-Si + H2O). This process is known as dehydroxylation. Zhuravlev determined that physisorbed water is completely removed at 190 ± 10 °C, after which dehydroxylation begins to occur.
According to P. Schmidt et al. [28,29,30] and M. Domanski et al. [30,31], heat treatment of natural silica (flint) improves the material crystallinity by reducing silanols defects and increasing the crystallite size. However, to avoid the fracturing aggregate phenomenon and to maximize the evaporation of silanols, some parameters such as temperature, speed, and duration of the heat treatment should be optimized.
Silanols begin to be lost at 200 °C and are completely removed between 550 and 600 °C [30]. The pressure level rises with increasing temperature, which causes the appearance of isolated fractures, allowing water molecules to drain from the pores [31].
The heat treatment speed is another factor that affects the fracturing temperature. When this speed is high enough, it leads to the appearance of a temperature gradient between the interior and exterior of the grain during heat treatment, resulting in an heterogeneous thermal expansion and therefore to fracture [32]. The process of dehydration of flint is related to the duration of heat treatment [33].
Infrared (FT-IR) spectroscopy, Raman spectroscopy, and thermogravimetric analysis (TGA), as well as chemical methods such as titration and nuclear magnetic resonance (NMR) were used to determine the surface structure (especially OH groups) of silica [34,35]. FT-IR spectroscopy is most commonly used for monitoring the surface hydroxylation of silica [36]. Furthermore, thermal analysis coupled with other methods is often used to study dehydroxylation and estimate the number of OH groups on the surface because it does not require complicated sample preparation [37].
This study deals with the fabrication of controlled SiOH SiO2 surfaces and the study of the effect of heat treatment on the structural and surface changes of a natural flint SiO2 aggregate submitted to chemical treatment. After the reaction, the SiO2 surfaces were subjected to heat treatment at three different temperatures, 500, 700, and 1000 °C. Moreover, different techniques such as X-ray diffractions (XRD), Variable Pressure Scanning Electron Microscopy (VP-SEM), Fourier Transform Infrared Spectroscopy (FTIR), and thermo-gravimetric analysis (TGA) were used.
2. Materials and Methods
2.1. Samples Preparation
The aggregate studied in this work is a natural flint from the north of France. X-ray fluorescence analysis gave a SiO2 content close to 99%, and X-ray diffraction only detected quartz in this aggregate [38]. The aggregate was subjected to a procedure that has been previously described [39] but is briefly summarized here. The chemical reaction was carried out following the protocol below: 1 g of crushed flint was introduced in the autoclave in an oven at 80 °C. After 30 min of preheating, 10 mL KOH solution of 0.79 mol/L was added. The mix was then put in an oven for reaction under controlled temperature and reaction time. After the reaction time, the autoclave was immersed in frozen water for 5 min to stop the reaction. The soluble reaction products were removed by selective acid treatment and filtration. The acid attack was done using 250 mL cold 0.5 M HCl solution. The sample was dried by acetone and diethyl ether treatment after the filtration and then kept inside dried atmosphere.
The sample obtained (called r-SiO2) was subjected to thermal treatment at 500 °C, 700 °C, and 1000 °C. Figure 1 shows the heat treatment procedure. The heating of the sample was carried out in porcelain crucibles. The description of the sample is summarized in Table 1.
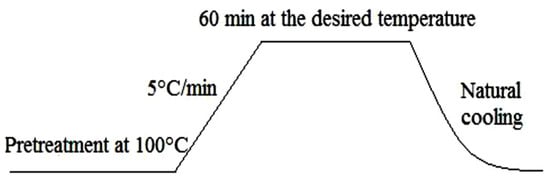
Figure 1.
The procedure of heat treatment.

Table 1.
Sample description.
2.2. Characterization
The reacted powder and heated samples were characterized by X-ray diffraction (XRD), Variable Pressure Scanning electronic microscopy (VP-SEM), Infrared Fourier transformed spectroscopy (FTIR), and thermogravimetry analysis (TGA) for which experimental details are now briefly described.
2.2.1. X-ray Diffraction
XRD measurements were performed in the reflection mode using a Bruker D8 Advance diffractometer (Cu-K λ radiation = 1.5418 A˚) operating at 40 kV and 40 mA. Data were recorded in the range of 25°–75° in the 2θ scale with a step size of 0.02° and a counting time of 0.5 s/step. The diffraction pattern of each sample was obtained by plotting the intensity of diffraction versus double Bragg angle. Exploitations were performed with «HighScore 5.1» software.
2.2.2. Environmental Scanning Electron Microscopy
The morphology of surface silica samples was characterized with a scanning electron microscopy (SEM) VEGA 3 instrument model, produced by TESCAN (Brno, Czech Republic) and equipped with an Energy Dispersive Spectrometer (EDS) Microanalysis system. The instrument has a tungsten filament and the accelerating voltage was 10 kV.
2.2.3. FT-IR Spectra
FTIR spectra of the silica samples were acquired with a Brucker VERTEX 70 spectrometer (Mannheim, Germany) in reflection mode. They were recorded by collecting 100 scans at 4 cm−1 resolution in the range of 400–4000 cm−1.
2.2.4. Thermo-Gravimetric Analysis
Thermo-gravimetric Analysis curves were recorded with a Setaram-Labsys TGA instrument. The samples (26–30 mg) were heated in an Al2O3 crucible at 10 °C/min of the heating rate under flowing argon at 10 mL/min with an initial treatment at 25 °C and further annealing up to 900 °C.
3. Results
3.1. Structural Analysis
The X-ray diffraction patterns of unheated and heated flint at 500, 700 °C, and 1000 °C are shown in Figure 1. The peaks related to SiO2 crystalline phase can be found in the file [PDF-01-085-0794]. Whatever the thermal treatment up to 1000 °C, the hexagonal structure is maintained and no changes in symmetry are observed after the high temperature treatment. Indeed, as it can be seen in Figure 2, after each thermal treatment, the diffraction peaks are shifted towards higher 2θ values. The shift may indicate contraction of the silica network. These results will be confirmed below.
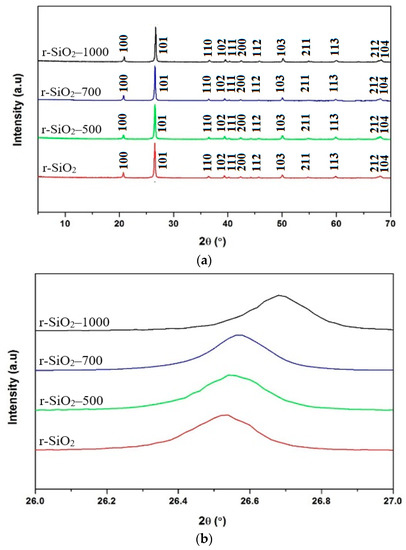
Figure 2.
XRD patterns of (a) unheated and heated flint at 500 °C, 700 °C, and 1000 °C, (b) evolution of the main peak (101).
To obtain more information from the XRD patterns regarding the crystallinity of the samples, the Full Width at Half Maximum (FWHM) evolution of the main peak (101) of the samples was determined as a function the heating temperature and reported in Figure 3. We noticed that the FWHM decreases with the temperature. This result indicates that the heat treatment improves the crystallinity of the samples. In fact, we observed two significant changes inferred from X-ray diffraction experiments as a function of temperature: (i) the structure of SiO2 simultaneously undergoes a contraction and (ii) there is an improvement in its crystallinity when the temperature increases.
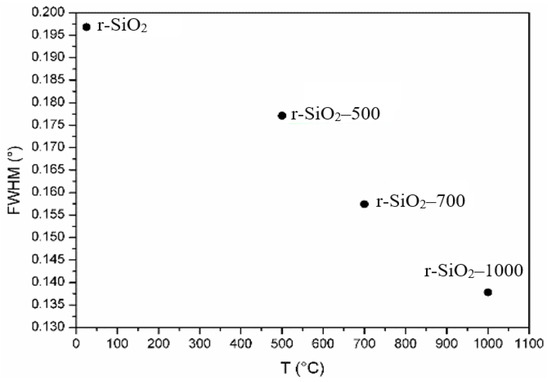
Figure 3.
Full Width at Half Maximum (FWHM) of the main peak (101) of unheated and heated flint at 500 °C, 700 °C, and 1000 °C.
The lattice parameters were determined from the XRD data using the UnitCell program. In addition, the crystallite size was calculated from the (1 0 1) XRD peak using the Debye-Sherrer’s equation [40]. The results for all the samples are given in Table 2. A decrease in the volume when the thermal treatment increased was observed. This decrease in volume could be related to the contraction of the silica structure in agreement with the shift of the main peak observed in Figure 2. In addition, the average crystallite size increased with increasing annealing temperature, revealing a fine nano-crystalline grain structure.

Table 2.
The structure parameters of SiO2 flint heated at 500, 700, and 1000 °C.
The XRD peak broadening also has a contribution from the self-induced strain (ε) developed in the crystallites during heat treatment. Thus, the crystallite size and strain for all samples were calculated, taking into account the contribution of the crystallites and strain to the peak broadening. The Williamson–Hall (W–H) formalism [41] is used:
where is the wavelength of the X-rays, β is the full width at half maxima, is the diffraction peak angle, DW−H is the crystallite size, and is the strain present in the materials. Figure 4 shows plots of versus (W–H plot) for the unheated and heated flint at different temperatures (500, 700, and 1000 °C). It is possible to observe that the straight line intercepts all the points, indicating a homogeneous crystallite size distribution and the presence of a homogeneous micro strain in comparison with other studies other [42,43]. The results revealed that the estimated crystallite size was about 41.5 ± 0.3 nm for the unheated flint. However, the size of the crystallite increased from 47.9 ± 0.3 to 64.0 ± 0.4 nm with the temperature treatment, increasing from 500 to 1000 °C.
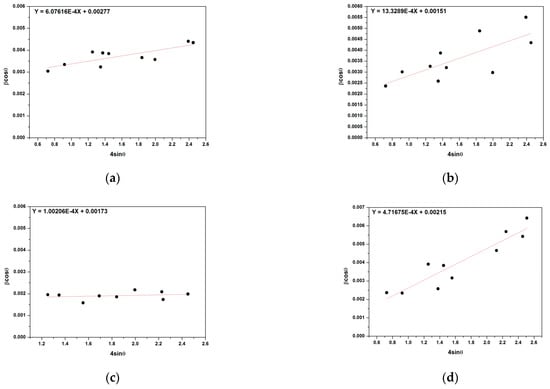
Figure 4.
Plots of β cosθ versus sinθ (W–H plot) for the unheated (a) and heated flint at different temperatures 500 °C (b), 700 °C (c), and 1000 °C (d).
The lattice micro strain of each sample obtained using the Williamson–Hall method showed a positive value, indicating a lattice expansion in agreement with other studies [43]. We also observed that the micro strain decreases with increasing temperature treatment, showing a reduction with higher temperature. The micro strain value obtained for the unheated flint sample, as presented in Table 3, was approximately 13.3289 × 10⁻⁴, which gradually decreased, varying from 6.0761 × 10⁻⁴ to 1.0021 × 10⁻⁴ at increasing temperature treatment from 500 to 1000 °C. To successfully understand this behavior, it was essential to link it to an improvement of the crystallinity of the SiO2 structure under heat treatment, as shown in Table 2.

Table 3.
Crystallite size and micro strain values obtained from the Williamson–Hall plot for flint samples as a function of the temperature treatment.
3.2. Surface Morphological Analysis
Figure 5 displays a micrograph obtained with VP-SEM of the unheated aggregate r-SiO2 Figure 5a and the aggregate r-SiO2 heated at 500 °C Figure 5b, 700 °C Figure 5c, and 1000 °C Figure 5d. The SiO2 nanoparticles exhibited different shapes and particle sizes.
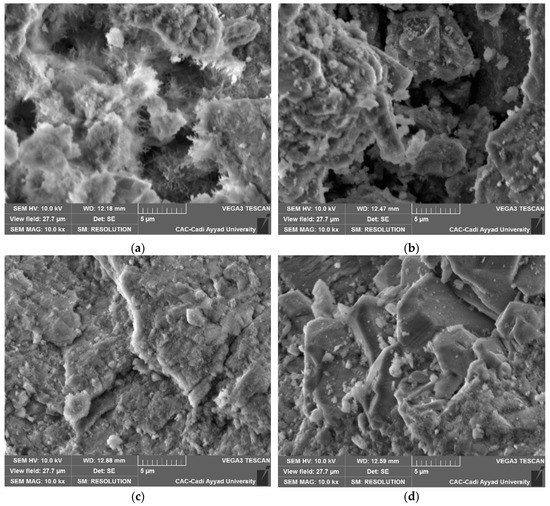
Figure 5.
Variable Pressure Scanning Electron Microscopy of the SiO2 aggregate without heat treatment (a) and heated at 500 °C (b), 700 °C (c), and 1000 °C (d).
From Figure 5a, disordered needles of nanometric sizes (∼500 nm) are observed on the surface of the grains before heating. Indeed, the origin of these forms may be associated with the formation of silanol groups due to the breaking of siloxane bonds by the attack of hydroxide ions. However, important modifications are produced after heating. The grains have a well-defined shape with a relatively smooth surface as shown in Figure 5b–d, respectively. Moreover, grains of different sizes ranging from hundred nanometers to a few micrometers, with angular sides that characterize the angles of quartz can be seen in Figure 4d. These observations confirm and are in agreement with the XRD results. Indeed, as shown in Table 2, the average of the crystallite size increases with the temperature.
The EDS analysis presented in Figure 6 shows that the samples are composed of silicon and oxygen elements, which is characteristic of the SiO2 compound. The presence of carbon is attributed to the sample holder. This analysis shows the success of the treatment process developed in this study.
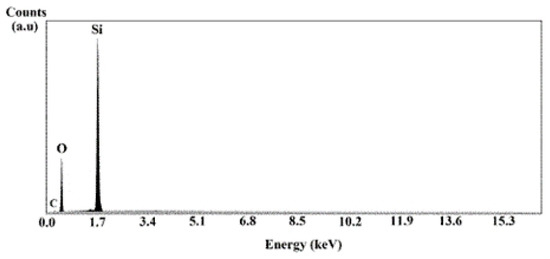
Figure 6.
The EDS analysis of the SiO2 aggregate without heat treatment.
3.3. FTIR Spectral Analysis
Fourier transform infrared (FT-IR) spectroscopy was used to confirm the changes in the silica surface groups versus the temperature. FT-IR is a useful technique for probing surface groups and has been extensively used to examine the surface chemistry of silica [44,45]. The spectra obtained in the three heated samples compared to the unheated one in the spectral range of 400 and 4000 cm−1, are shown in Figure 7.
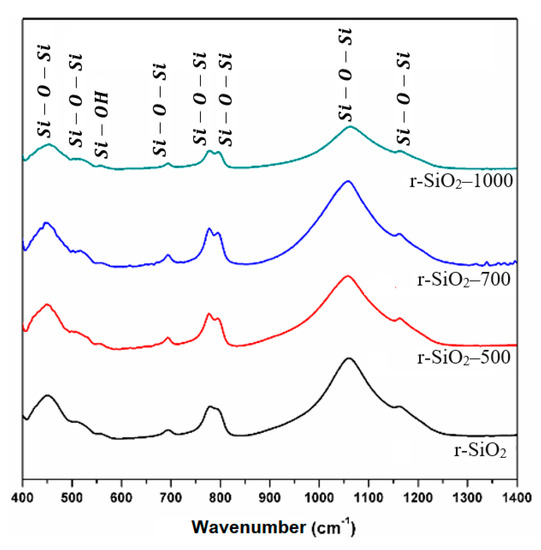
Figure 7.
FTIR spectra of the SiO2 aggregate without heat treatment and heated at 500 °C, 700 °C, and 1000 °C.
The infrared spectrum of unheated flint r-SiO2 shows a broad band between 1000 and 1300 cm−1. This band consists of two strong peaks located at 1078 cm−1 and 1163 cm−1, which are associated with the stretching vibration of Si-O-Si as indicated in different studies [33,34,35,36,37]. In addition, in the spectrum, the bending vibrations attributed to Si-O-Si [31,32,33,39,40,41,42,43,44,45,46] located at 455 cm−1, 509 cm−1, 778 cm−1, and 800 cm−1, are observed.
The bands located at 555 cm−1 and 950 cm−1 are assigned to the bending and stretching vibration of the free Si-OH hydroxyl groups that occur at the surface of the attacked flint as shown in other works [47,48,49].
The spectrum of the samples heated at 500 °C, 700 °C, and 1000 °C shows a reduction of bands at 555 cm−1, an increased intensity of the bands located at 800 cm−1, and a shift of the main band from 1078 cm−1 to 1082 cm−1. The position of this band is related to the structural order in the SiO2 samples. The shift in the observed position of the band from 1078 cm−1 to 1082 cm−1 may be attributed to an improvement in the structural order versus temperature in agreement with previous studies [35,46]. The more ordered the structure is, the more this band is located at large wave numbers. Similarly, the reduction bands at 555 cm−1 can be attributed to the evaporation of silanols groups SiOH with the temperature. This behavior is consistent with a thermal activation and is in agreement with the XRD results.
The evolution of the intensity ratio between the Si-OH band around 555 cm−1 and the structural band around 500 cm−1 are shown in Figure 8. We observed that the intensity ratio between the Si-OH and Si-O-Si bands decreases with the temperature. This evolution demonstrates the evaporation of the hydroxyl groups Si-OH due to condensation and the change of the SiO2 surface. This result confirms the surface silica change observed by the VP-SEM analysis.
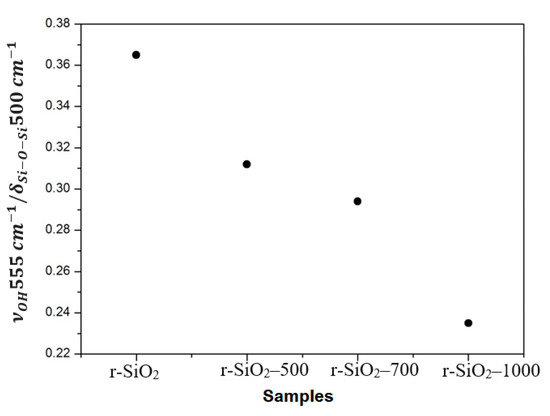
Figure 8.
The evolution of the intensity ratio between the Si-OH band located around 555 cm−1 and the structural band located around 500 cm−1.
3.4. Thermal Analysis
Thermogravimetric measurements were carried out for unheated and heated silica samples. The SiO2 samples were heated by TGA in a temperature range of 25–900 °C under an argon environment. The curves of the thermograms of the studied samples SiO2 are represented in Figure 9. As it has been well established, there are two distinct mass loss steps in the thermo-grams of silicas [50]. The first step (below 200 °C) is abrupt and is attributed to the removal of physical water from the silica surface. The second step in the temperature range from 200 °C (T1) to 900 °C (T2) is broader and is considered to correspond to the slow condensation of silanol groups as [51]:
-Si-OH + OH-Si- ↔ Si-O-Si
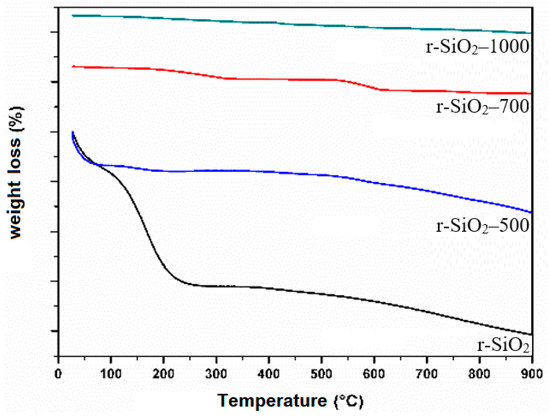
Figure 9.
TGA spectra of the SiO2 aggregate without heat treatment and heated at 500 °C, 700 °C, and 1000 °C.
From the literature [52], it is known that upon heating silica, hydrogen-bonded hydroxyls are first released quickly in the temperature range 200–400 °C and isolated hydroxyls more slowly at higher temperatures. Unfortunately, the removal of different types of hydroxyls, isolated and hydrogen-bonded, occurs during a continuous mass loss step. For this reason, it is difficult to distinguish them from thermograms.
In order to calculate qualitatively the Si-OH hydroxyl groups on the SiO2 surfaces, the total weight loss experienced during their dehydroxylation by TGA was measured. The total hydroxyl group content in the silica was calculated from the second total weight loss, which starts from the point where all physisorbed water is removed and ends at the end point of the measurement (Tfinal = 900 °C). The hydroxide group content , determined as moles of hydroxyls left per gram of silica (mole/g), was calculated as follows [24,44]:
where is the weight loss in the temperature region and the molar mass of water. The total hydroxyl group content of the silicas calculated using Equation (2) in the temperature range from 200 to 900 °C is presented in Table 4 and Figure 10.

Table 4.
The mass loss and hydroxyl group content obtained from Equation (2) for the samples from 200 to 900 °C.
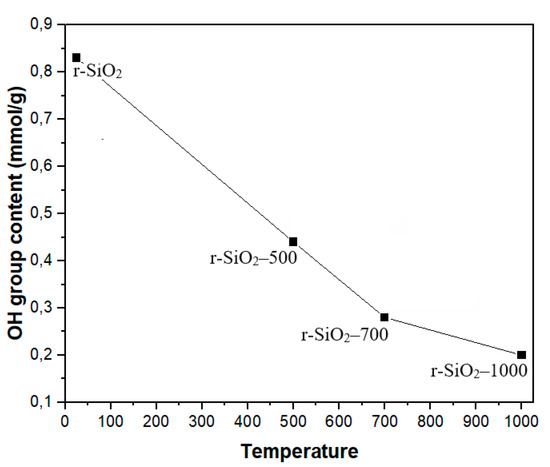
Figure 10.
The evolution of the hydroxyl group content of the SiO2 aggregate without heat treatment and heated at 500 °C, 700 °C, and 1000 °C.
From Table 4, it should be noted that the hydroxyl group content on the silica surface decreased from 0.83 to 0.2 mmol/g when the temperature of thermal treatment increased from 25 to 1000 °C. Consequently, this result indicates that heating causes the condensation of silanol groups resulting in a reduction of the hydroxyl group content. In addition, the increase in the average crystallite size with the heat treatment showing a fine nano-crystalline grain structure is accompanied by a substantial change in the surface behavior, as showed by VP-SEM micrographs and the decrease in silanols, which are also characteristic of the surface.
4. Conclusions
The present study shows that there is an immense potential for research of natural SiO2 aggregates for the development of the environmentally friendly composite materials with controlled surface-interface interactions. The following conclusions have been drawn from this study:
- -
- The thermal treatment of silica particles has a significant effect on the structure and surface of silica.
- -
- The XRD analysis showed that the FWHM of the SiO2-(101) peak decreased with the heat treatment at higher temperature, showing an improvement in crystalline quality.
- -
- The VP-SEM and FTIR analyses confirmed the decrease of the silanols Si-OH defects in the aggregate under heat treatment.
- -
- Thermogravimetry confirmed that as the temperature increases, the hydroxyl group content on the silica surface decreases, which means the silanol groups on the surface dehydrate producing siloxane bridges according to the dehydroxylation phenomenon.
- -
- Natural SiO2 aggregates have desirable properties for the development of high and controlled strength composites.
- -
- The improvement and quantification of the use of natural SiO2 aggregates allows to optimize the circular reuse of the composites obtained.
- -
- Based on these results, an experiment using controlled SiO2 surface as a filler in some composites such as polymers and asphalts is being carried out.
Author Contributions
Conceptualization, L.K.; methodology, L.K. and A.O.; software, L.K. and A.O.; validation, L.K. and A.O.; formal analysis, A.O.; investigation, L.K. and A.O.; resources, L.K.; data curation, L.K. and A.O.; writing—original draft preparation, L.K. and A.O.; writing—review and editing, L.K. and A.O.; visualization, L.K. and A.O.; supervision, L.K. and A.O.; project administration, L.K.; funding acquisition, L.K. All authors have read and agreed to the published version of the manuscript.
Funding
Part of this research was funded by FEDER, Institut Chevreul USTL-France, and Analysis and Characterization Center (CAC)-Morocco.
Data Availability Statement
Analytical data will be provided upon reasonable request to the corresponding author.
Acknowledgments
The authors thank M. Elaatmani and A. Zegzouti for the discussion.
Conflicts of Interest
The authors declare no conflict of interest.
References
- Bhatt, M.; Chakinala, A.G.; Joshi, J.B.; Sharma, A.; Pant, K.; Shah, K.; Sharma, A. Valorization of solid waste using advanced thermo-chemical process: A review. J. Environ. Chem. Eng. 2021, 9, 105434. [Google Scholar] [CrossRef]
- Wang, Q.; Bian, H.; Li, M.; Dai, M.; Chen, Y.; Jiang, H.; Zhang, Q.; Dong, F.; Huang, J.; Ding, Z. Effects of a Water-Glass Module on Compressive Strength, SizenEffect and Stress–Strain Behavior of Geopolymer Recycled Aggregate Concrete. Crystals 2022, 12, 218. [Google Scholar] [CrossRef]
- Oliveira, K.A.; Simao, L.; Rebouças, L.B.; Hotza, D.; Montedo, O.R.K.; de Oliveira, A.P.N.; Raupp-Pereira, F. Ceramic shell waste valorization: A new approach to increase the sustainability of the precision casting industry from a circular economy perspective. Waste Manag. 2023, 157, 269–278. [Google Scholar] [CrossRef] [PubMed]
- Qiang, T.; Zhu, R. Bio-templated synthesis of porous silica nano adsorbents to wastewater treatment inspired by a circular economy. Sci. Total Environ. 2022, 819, 152929. [Google Scholar] [CrossRef] [PubMed]
- Poranek, N.; Łaźniewska-Piekarczyk, B.; Lombardi, L.; Czajkowski, A.; Bogacka, M.; Pikoń, K. Green Deal and Circular Economy of Bottom Ash Waste Management in Building Industry—Alkali (NaOH) Pre-Treatment. Materials 2022, 15, 3487. [Google Scholar] [CrossRef] [PubMed]
- Falini, G.; Basile, M.L.; Gandolfi, S.; Carella, F.; Guarini, G.; Esposti, L.D.; Iafisco, M.; Adamiano, A. Natural calcium phosphates from circular economy as adsorbent phases for the remediation of textile industry waste-waters. Ceram. Int. 2023, 49, 243–252. [Google Scholar] [CrossRef]
- Martínez-Martínez, S.; Pérez-Villarejo, L.; Eliche-Quesada, D.; Sánchez-Soto, P.J. New Types and Dosages for the Manufacture of Low-Energy Cements from Raw Materials and Industrial Waste under the Principles of the Circular Economy and Low-Carbon Economy. Materials 2023, 16, 802. [Google Scholar] [CrossRef]
- Li, J.; Song, G.; Cai, M.; Bian, J.; Mohammed, B.S. Green environment and circular economy: A state-of-the-art analysis. Sustain. Energy Technol. Assess. 2022, 52, 102106. [Google Scholar] [CrossRef]
- Mohan, L.; Archana, P.; Varma, M.M.; Kocherla, M.; Sreedhar, K.; Sreekanth, K.; Sivasubramanian, G. Micro circular economy conceptualized though the sustainable synthesis of a valuable opaline silica based microcidal, non-cytotoxic and free radical scavenging, composite from the dung of vechur cattle—A rare breed of bos taurus indicus. Mater. Today Proc. 2021, 46, 2960–2968. [Google Scholar] [CrossRef]
- Vieira, G.L.; Schiavon, J.Z.; Borges, P.M.; da Silva, S.R.; Andrade, J. influence of recycled aggregate replacement and fly ash content in performance of pervious concrete mixtures. J. Clean. Prod. 2020, 271, 122665. [Google Scholar] [CrossRef]
- Hung, K.-C.; Wu, J.-H. Effect of SiO2 Content on the Extended Creep Behavior of SiO2-Based Wood-Inorganic Composites Derived via the Sol–Gel Process Using the Stepped Isostress Method. Polymers 2018, 10, 409. [Google Scholar] [CrossRef]
- Hosseini, S.B. A Review: Nanomaterials as a Filler in Natural Fiber Reinforced Composites. J. Nat. Fibers 2016, 14, 311–325. [Google Scholar] [CrossRef]
- Khouchaf, L.; Oufakir, A. Fabrication, Design and Characterization of 1D Nano-Fibrous SiO2 Surface by a Facile and Scalable Method. Crystals 2022, 12, 531. [Google Scholar] [CrossRef]
- Wembe, J.T.; Ngueyep, L.L.M.; Moukete, E.E.A.; Eslami, J.; Pliya, P.; Ndjaka, J.-M.B.; Noumowe, A. Physical, mechanical properties and microstructure of concretes made with natural and crushed aggregates: Application in building construction. Clean. Mater. 2023, 7, 100173. [Google Scholar] [CrossRef]
- Mack, P.; White, R.G.; Wolstenholme, J.; Conard, T. The use of angle resolved XPS to measure the fractional coverage ofhigh-k dielectric materials on silicon and silicon dioxide surfaces. Appl. Surf. Sci. 2006, 252, 8270–8276. [Google Scholar] [CrossRef]
- Wu, K.; Bailey, T.C.; Willson, C.G.; Ekerdt, J.G. Surface Hydration and Its Effect on Fluorinated SAM Formation on SiO2 Surfaces. Langmuir 2005, 21, 11795–11801. [Google Scholar] [CrossRef] [PubMed]
- Ghosh, K.; Bashadi, S.; Lehmler, H.J.; Rankin, S.E.; Knutson, B.L. Pore size engineer- ing in fluorinated surfactant templated mesoporous silica powders through supercritical carbon dioxide processing. Micropor. Mesopor. Mater. 2008, 113, 106–113. [Google Scholar] [CrossRef]
- Söderberg, O.; Ge, Y.; Haimi, E.; Heczko, O.; Oja, M.; Laine, J.; Suhonen, T.; Aaltonen, A.; Kalliokari, K.; Borak, B.; et al. Morphology of ferromagnetic sol–gel submicron silica powders doped with iron and nickel particles. Mater. Lett. 2007, 61, 3171–3173. [Google Scholar] [CrossRef]
- Kellum, G.E.; Smith, R.C. Determination of water, silanol, and strained siloxane on silica surfaces. Anal. Chem. 1967, 39, 341–345. [Google Scholar] [CrossRef]
- Mueller, R.; Kammler, H.K.; Wegner, K.; Pratsinis, S.E. OH surface density of SiO2 and TiO2 by thermogravimetric analysis. Langmuir 2003, 19, 160–165. [Google Scholar] [CrossRef]
- Shioji, S.; Hanada, M.; Hayashi, Y.; Tokami, K.; Yamamoto, H. Kinetic study of alkoxylation and rehydroxylation reactions on silica surfaces. Adv. Powder Technol. 2007, 18, 467–483. [Google Scholar] [CrossRef]
- Takei, T.; Eriguchi, E.; Fuji, M.; Watanabe, T.; Chikazawa, M. Heat of immersion of amorphous and crystalline silicas in water: Effect ofcrystallinity. Thermochim. Acta 1998, 308, 139–145. [Google Scholar] [CrossRef]
- De Farias, R.F.; Airoldi, C. Thermogravimetry as a Reliable tool to Estimate the Density of Silanols on a Silica Gel Surface. J. Therm. Anal. Calorim. 1998, 53, 751–756. [Google Scholar] [CrossRef]
- Ek, S.; Root, A.; Peussa, M.; Niinisto, L. Determination of the hydroxyl group content in silica by thermogravimetry and a comparison with 1H MAS NMR results. Thermochim. Acta 2001, 379, 201–212. [Google Scholar] [CrossRef]
- Legrand, A.P. (Ed.) The Surface Properties of Silica; Wiley: Chichester, UK, 1998. [Google Scholar]
- Armistead, C.G.; Tyler, A.J.; Hambleton, F.H.; Mitchell, S.A.; Hockey, J.A. Surface hydroxylation of silica. J. Phys. Chem. 1969, 73, 3947. [Google Scholar] [CrossRef]
- Iler, R.K. The Chemistry of Silica. Solubility, Polymerization, Colloid and Surface Properties and Biochemistry; Wiley-Interscience: New York, NY, USA, 1979. [Google Scholar]
- Zhuravlev, L.T. Concentration of hydroxyl groups on the surface of amorphous silicas. Langmuir 1987, 3, 316–318. [Google Scholar] [CrossRef]
- Schmidt, P.; Badou, A.; Fröhlich, F. Detailed FT near-infrared study of the behavior of water and hydroxyl in sedimentary length-fast chalcedony, SiO2, upon heat treatment. Spectrochim. Acta Part A 2011, 81, 552–559. [Google Scholar] [CrossRef]
- Schmidt, P.; Masse, S.; Laurent, G.; Slodczyk, A.; Le Bourhis, E.; Perrenoud, C.; Livage, J.; Fröhlich, F. Crystallographic and structural transformations of sedimentary chalcedony in flint upon heat treatment. J. Archaeol. Sci. 2012, 39, 135–144. [Google Scholar] [CrossRef]
- Domański, M.; Webb, J.; Glaisher, R.; Gurba, J.; Libera, J.; Zakościelna, A. Heat treatment of Polish flints. J. Archaeol. Sci. 2009, 36, 1400–1408. [Google Scholar] [CrossRef]
- Fukuda, J.; Nakashima, S. Water at high temperatures in a microcrystalline silica (chalcedony) by in-situ infrared specroscopy: Physicochemical states and dehydration behavior. J. Mineral. Petrol. Sci. 2008, 103, 112–115. [Google Scholar] [CrossRef]
- Gilpin, R.K.; Gangoda, M.E.; Jaroniec, M. Preparation and characterization of silica–carbon hybrids. Carbon 1997, 35, 133–139. [Google Scholar] [CrossRef]
- Schmidt, P.; Fröhlich, F. Temperature dependent crystallographic transformations in chalcedony, SiO2, assessed in mid infrared spectroscopy. J. Spectrochim. Acta A 2011, 78, 1476–1481. [Google Scholar] [CrossRef]
- Crupi, V.; Interdonato, S.; Longo, F.; Majolino, D.; Migliardo, P.; Venuti, V. A new insight on the hydrogen bonding structures of nanoconfined water: A Raman study. J. Raman Spectrosc. 2008, 39, 244–249. [Google Scholar] [CrossRef]
- Ramos, M.; Gil, M.; Schacht, E.; Matthys, G.; Mondelaers, W.; Figueiredo, M. Physical and chemical characterisation of some silicas and silica derivatives. Powder Technol. 1998, 99, 79–85. [Google Scholar] [CrossRef]
- Curthoys, G.; Davydov, V.; Kiselev, A.; Kiselev, S.; Kuznetsov, B. Hydrogen bonding in adsorption on silica. J. Colloid Interface Sci. 1974, 48, 58–72. [Google Scholar] [CrossRef]
- Khouchaf, L.; Boinski, F. Environmental Scanning Electron Microscope study of SiO2 heterogeneous material with helium and water vapor. Vacuum 2007, 81, 599–603. [Google Scholar] [CrossRef]
- Tavakoli, D.; Dehkordi, R.S.; Divandari, H.; de Brito, J. Properties of roller-compacted concrete pavement containing waste aggregates and nano SiO2. Constr. Build. Mater. 2020, 249, 118747. [Google Scholar] [CrossRef]
- Studenikin, A.; Golego, N.; Cocivera, M. Fabrication of green and orange photoluminescent, undoped ZnO films using spray pyrolysis. J. Appl. Phys. 1998, 84, 2287–2294. [Google Scholar] [CrossRef]
- Williamson, G.; Hall, W. X-ray line broadening from filed aluminium and wolfram. Acta Metall. Mater. 1953, 1, 22–31. [Google Scholar] [CrossRef]
- Zak, A.K.; Majid, W.A.; Abrishami, M.; Yousefi, R. X-ray analysis of ZnO nanoparticles by Williamson-Hall and size-strain plot methods. Solid State Sci. 2011, 13, 251–256. [Google Scholar]
- Gonçalves, N.; Carvalho, J.; Lima, Z.; Sasaki, J. Size–strain study of NiO nanoparticles by X-ray powder diffraction line broadening. Mater. Lett. 2012, 72, 36–38. [Google Scholar] [CrossRef]
- Kim, J.M.; Chang, S.M.; Kong, S.M.; Kim, K.-S.; Kim, J.; Kim, W.-S. Control of hydroxyl group content in silica particle synthesized by the sol-precipitation process. Ceram. Int. 2009, 35, 1015–1019. [Google Scholar] [CrossRef]
- Zhuravlev, L.T. The surface chemistry of amorphous silica. Zhuravlev model. Colloids Surf. A Physicochem. Eng. Asp. 2000, 173, 1–38. [Google Scholar] [CrossRef]
- Nawrocki, J. The silanol group and its role in liquid chromatography. J. Chromatogr. A 1997, 779, 29–71. [Google Scholar] [CrossRef]
- Garnica-Romo, M.G.; Yanez-Limon, J.M.; Villicana, M.; Perez-Robles, J.F.; Zamorano-Ulloa, R.; Gonzalez-Hernandez, J. Structural evolution of sol–gel SiO2 heated glasses containing silver particles. J. Phys. Chem. Solids. 2004, 65, 1045–1052. [Google Scholar] [CrossRef]
- Barbosa, G.N.; Oliveira, H.P. Synthesis and characterization of V2O5–SiO2 xerogel composites prepared by base catalysed sol–gel method. J. Non-Cryst. Solids 2006, 352, 3009–3014. [Google Scholar] [CrossRef]
- Kim, H.U.; Rhee, S.W. Electrical properties of bulk silicon dioxide and SiO2/Si interface formed by tetraethyl orthosilicate-ozone chemical vapor deposition. J. Electrochem. Soc. 2000, 147, 1473–1476. [Google Scholar] [CrossRef]
- Chen, Z.L.; Shen, P. Thermally activated sintering–coarsening–coalescence-polymerization of amorphous silica nanoparticles. J. Ceram. Int. 2012, 39, 2365–2373. [Google Scholar] [CrossRef]
- Jung, K.T.; Chu, Y.H.; Haam, S.; Shul, Y.G. Synthesis of mesoporous silica fiber using spinning method. J. Non-Cryst. Solids 2002, 298, 193–201. [Google Scholar] [CrossRef]
- El Rassy, H.; Pierre, A.C. NMR and IR spectroscopy of silica aerogels with different hydrophobic characteristics. J. Non-Cryst. Solids 2005, 351, 1603–1610. [Google Scholar] [CrossRef]
Disclaimer/Publisher’s Note: The statements, opinions and data contained in all publications are solely those of the individual author(s) and contributor(s) and not of MDPI and/or the editor(s). MDPI and/or the editor(s) disclaim responsibility for any injury to people or property resulting from any ideas, methods, instructions or products referred to in the content. |
© 2023 by the authors. Licensee MDPI, Basel, Switzerland. This article is an open access article distributed under the terms and conditions of the Creative Commons Attribution (CC BY) license (https://creativecommons.org/licenses/by/4.0/).
