Article

Exploring Volatile Precursors: Synthesis, Characterization and Thermal Properties of Thulium Fluoroacetylacetonate Complexes

Fakultät für Chemie und Mineralogie, Universität Leipzig, Johannisallee 29, D-04103 Leipzig, Germany
*
Author to whom correspondence should be addressed.
Crystals 2023, 13(10), 1467; https://doi.org/10.3390/cryst13101467
Submission received: 31 August 2023 / Revised: 4 October 2023 / Accepted: 5 October 2023 / Published: 7 October 2023
(This article belongs to the Special Issue Polymer-Nanomaterial Composites for Bioinspired Sensing)

Abstract

:
Five trifluoroacetylacetonate (tfaa) complexes [Tm(tfaa)3(H2O)]2, [Tm(tfaa)3(H2O)2], [Tm(tfaa)3(H2O)2] · diglyme, [Tm(tfaa)3(DME)] (DME = 1,2-dimethoxyethane) and [TmCl2(tfaa)(diglyme)] (diglyme = bis(2-methoxyethyl) ether) of thulium have been synthesized and characterized by X-ray single-crystal structure analysis and spectroscopic techniques. Thermoanalytical studies at elevated temperatures provide information about their volatility. The results are compared with the hexafluoroacetylacetonate (hfaa) complexes of thulium known in the literature, which were reported as volatile precursors for CVD application. The reported high volatility of [Tm(hfaa)3(DME)] was confirmed and compared with those of the aqueous complexes which show a lower transport rate. In addition, the new crystal structures of the hexafluoroacetylacetonate complexes [Tm(hfaa)3(H2O)2], [Tm(hfaa)2(tfa)(H2O)2]2 (tfa = trifluoroacetate), [Tm(hfaa)3(DME)NaCl]2 and Na[Tm(hfaa)4] are presented.

1. Introduction

Chemical Vapor Deposition (CVD) and Atomic Layer Deposition (ALD) are very powerful techniques in industry to produce thin films. The incorporation of lanthanide atoms in solid-state structures has been extensively investigated due to their superior optical emission properties [1,2,3,4]. The oldest known classes of volatile precursors for lanthanoids are alkoxides with additional functional groups like ether or amine groups to complete the coordination sphere of the lanthanoid ion and to stabilize mononuclear complexes [5,6]. Another class of volatile lanthanoid complexes are tris-acetylacetonate (β-diketonate) complexes. Complexes based on 2,2,6,6-tetramethylheptane-3,5-dione (Htmhd) have been proven as volatile and usable precursors for the deposition of lanthanoid oxide films [7,8,9,10] and are known as “first-generation” precursors. The main issues of the tmhd complexes are their low vapor pressures, high decomposition temperatures and instability in air and at higher temperatures, which are necessary to achieve adequate vapor pressures. Significant amounts of residues were observed in commercial bubblers [11]. Due to the large ionic radii of the lanthanoid ions Ln3+, the coordination sphere is not complete with only three acetylacetonate ligands, and usually water molecules coordinate additionally. The elimination of water from the acetylacetonate complexes at higher temperatures leads to the formation of cluster-like molecules with bridging β-diketonate ligands, which lowers their volatility significantly [12]. Replacing water molecules with stronger bonded multidentate ligands and the use of fluorinated acetylacetonates allowed the synthesis of mononuclear, volatile and thermally stable complexes known as “second-generation” precursors [13]. Fluorinated acetylacetonate complexes have been synthesized for all stable lanthanoids [14,15,16,17,18,19,20,21,22].
Thulium is the rarest element (except radioactive promethium) of the lanthanoids in the earth’s crust. Few applications for thulium are known, mainly in lasers for medical applications [23,24], superconductors [25] or dosimeters [26]. Thulium hexafluoroacetylacetonate (hfaa) complexes have already been used in CVD experiments [27,28,29,30,31]. The presence of two molecules of coordinating water in the as-synthesized acetylacetonate complexes has been detected by gravimetric methods [32], but the crystal structures have not been reported so far. Only the X-ray structure analysis of one hexafluoroacetylacetonate (hfaa) complex of thulium (and other lanthanoids) with dimethoxyethane (DME) as a co-ligand has been published in 2012 [33]. The complex has been proven as volatile in sublimation studies and appears promising for CVD applications.
Among the hfaa complexes of thulium, the trifluoroacetylacetonate (tfaa) complexes are of great interest due to the lower price of the trifluoroacetylacetone as a starting material, the lower molar mass of the complex and less potentially corrosive fluorine content. The synthesis of one tfaa complex of thulium has already been described in the literature and its vapor pressure has been reported [34], but no structural or spectroscopic characterization has been performed. Herein we present our results of the synthesis, structural characterization as well as volatility studies of the hexafluoro- and trifluoroacetylacetonate complexes of thulium with coordinating water molecules as well as anhydrous complexes with polyether co-ligands.

2. Materials and Methods

For syntheses of the water-free complexes 59, the Schlenk technique and an MBRAUN UniLab glove box with N2 as inert gas were applied. Solvents for the syntheses of 59 were dried according to common methods, distilled prior to use and stored over a molecular sieve 4 Å. For the syntheses of 14, solvents were used without an additional drying step. Hexafluoracetylacetone (Hhfaa) and trifluoroacetylacetone (Htfaa) were purchased from TCI Deutschland GmbH and distilled prior to use, metallic thulium was purchased from ONXYMET Poland. Tm(OH)3 was obtained by reaction of thulium in 37% HCl followed by precipitation with 20% NaOH solution [35], filtration and vacuum drying. TmCl3 · 6 H2O was obtained by reaction of Tm(OH)3 with an excess of 10 wt% HCl and drying in vacuo. Anhydrous TmCl3 was obtained by refluxing TmCl3 · 6 H2O in an excess of SOCl2 for 5 days followed by drying in vacuo. Na(hfaa) and Na(tfaa) were synthesized by the slow addition of H(hfaa) or H(tfaa), respectively, to a suspension of NaH (60% in mineral oil) in dry THF, followed by filtration and washing of the colorless product with dry n-pentane.
NMR spectra were measured using a Bruker Avance III HD 400 spectrometer (Billerica, MA, USA) with 400 MHz proton frequency in dried and distilled CDCl3 or C6D6 as solvents. MestReNova [36] was used as software for data processing. 1H NMR spectra were referenced to the solvent residual signal (7.16 ppm for C6D5H; 7.26 ppm for CHCl3). Heteronuclear NMR spectra were referenced using the Ξ-scale [37]. IR spectra were measured on a Bruker TENSOR 27 spectrometer. ESI-MS spectra were measured with a Bruker Esquire 3000Plus spectrometer and MestReNova [36] as software for data analysis. Elemental analyses (C, H, N) were measured with a Heraeus Vario EL, TG/DTA analyses with a Netzsch STA 449 F1 coupled to an Aëolus QMS 403 D mass spectrometer (Selb, Germany). Netzsch Proteus software [38] was used for data analysis. For the sublimation experiments, a Schlenk tube was loaded with approx. 200 mg of the sample and placed in a tube furnace. An NMR tube filled with solvent and cooled in liquid nitrogen was attached to collect volatile species. The setup is shown in Figure S29 (see Supplementary Materials).

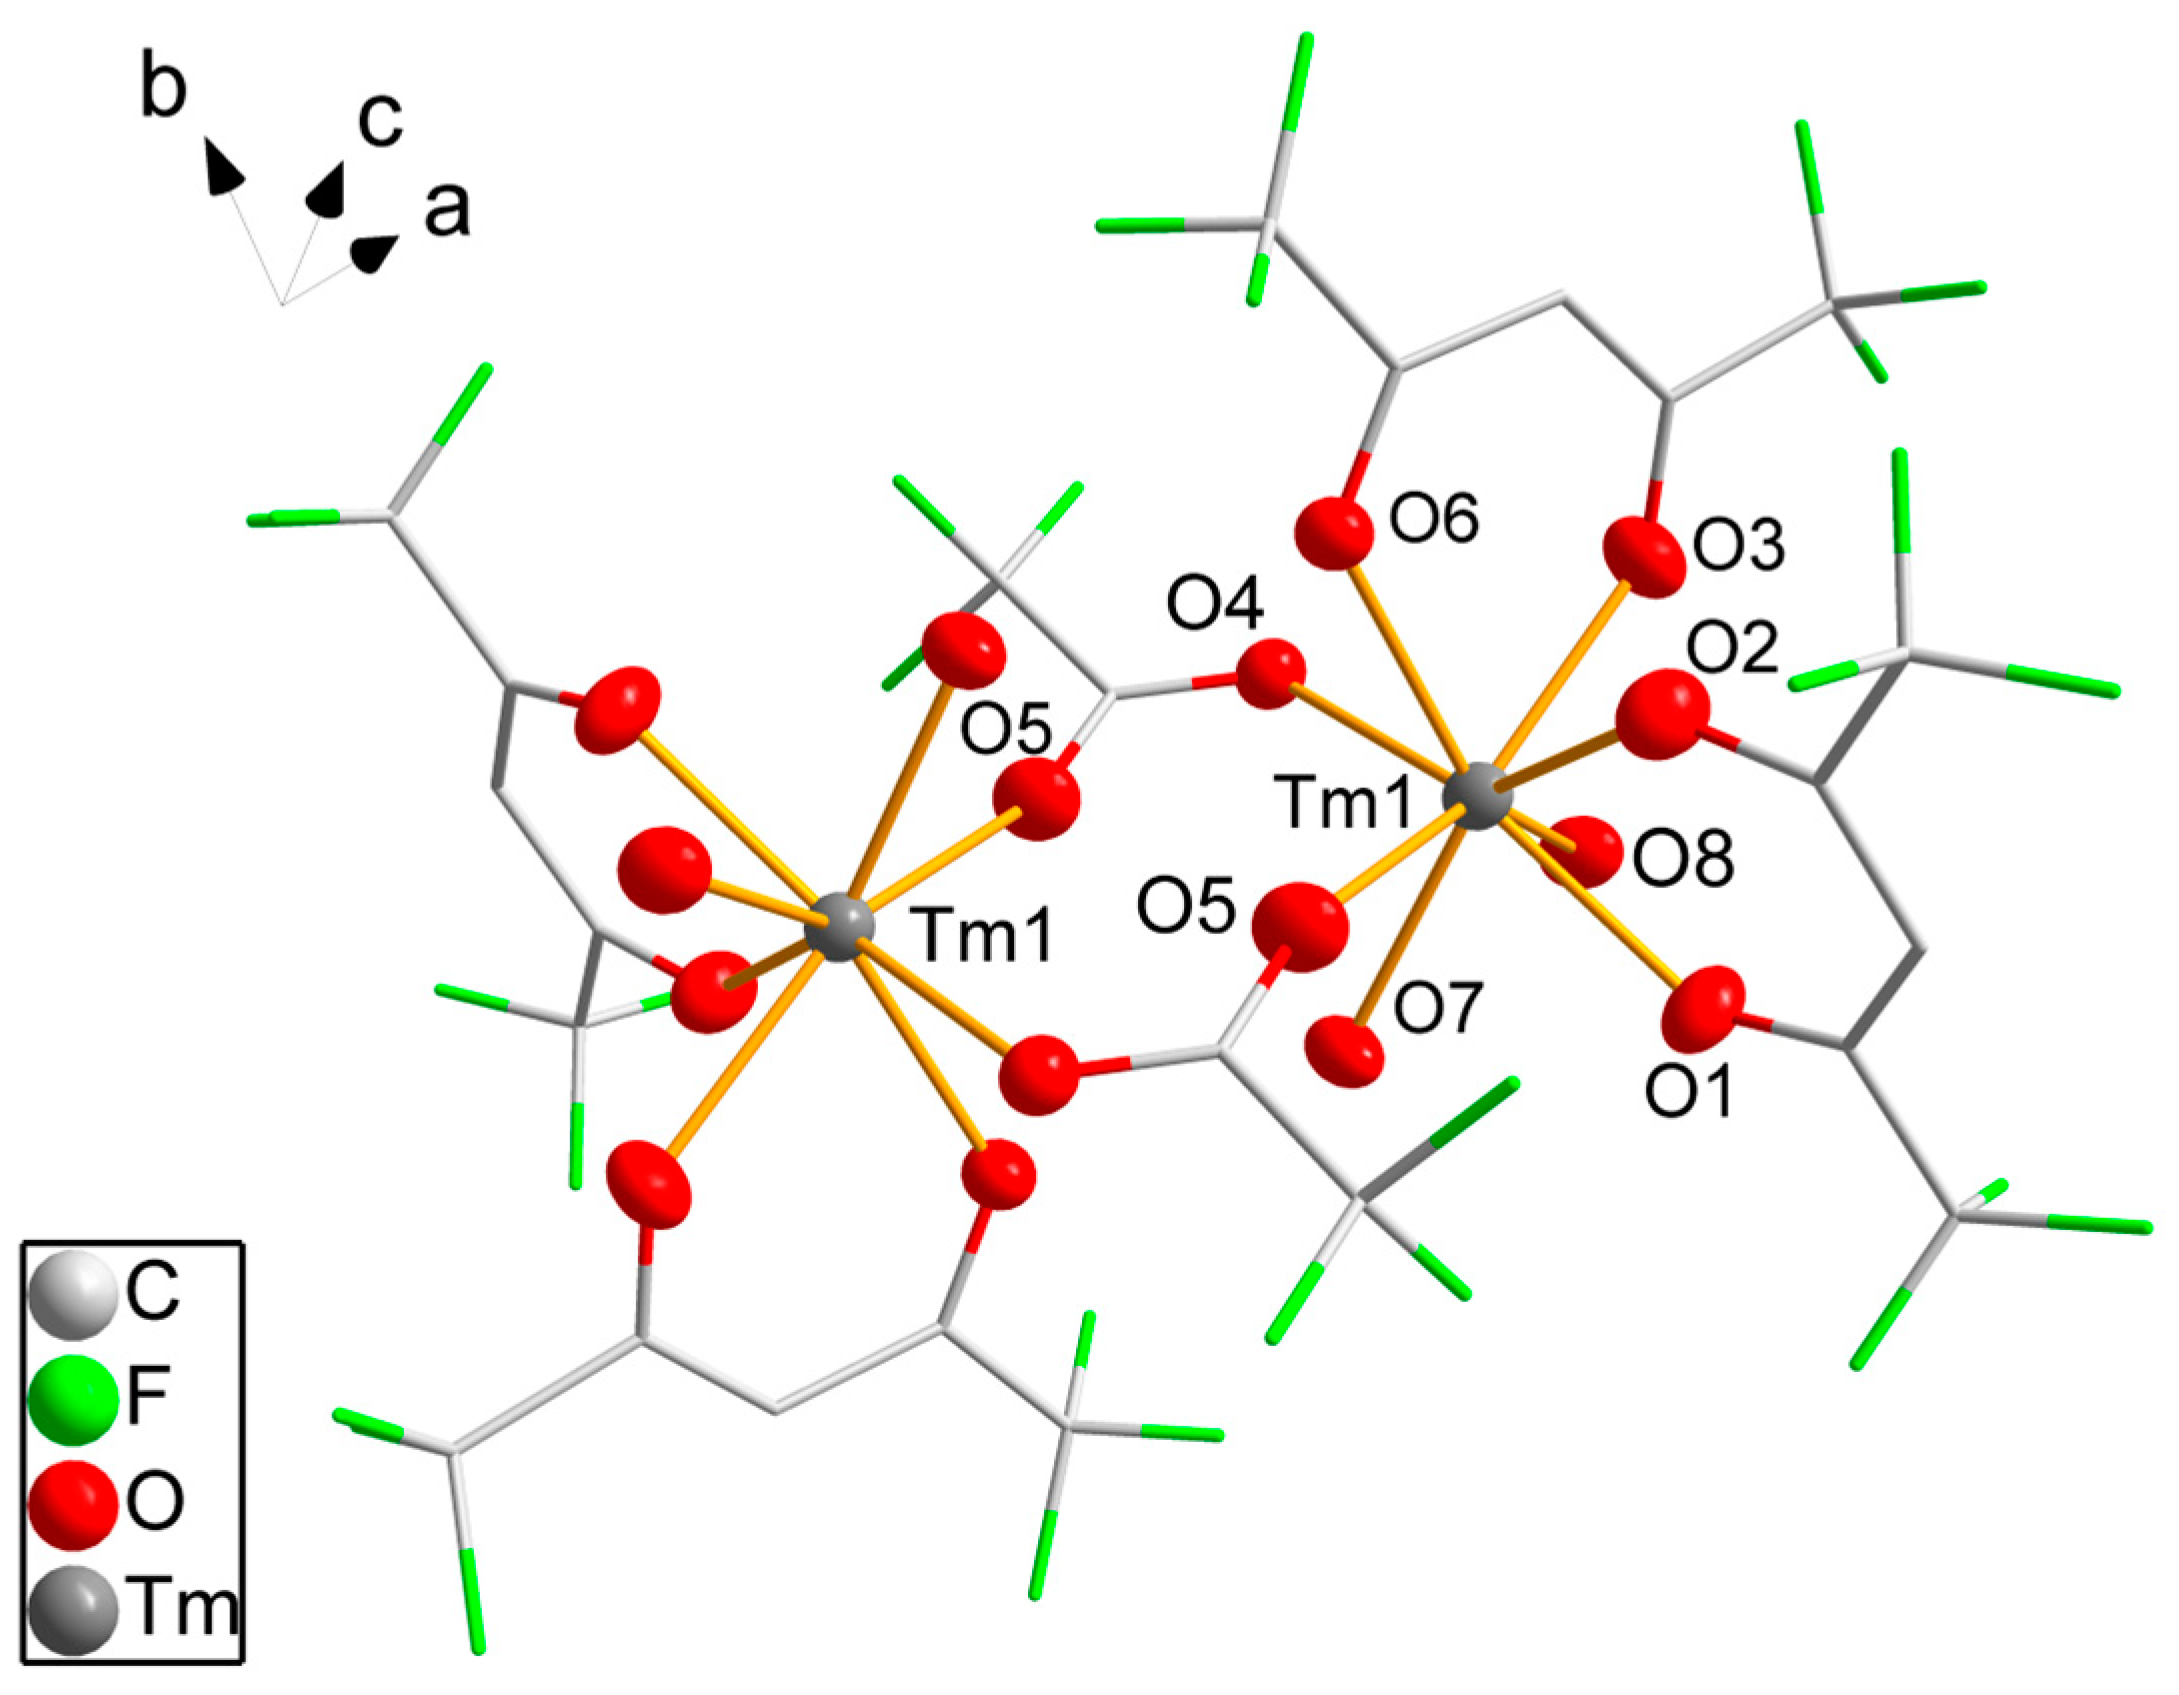
2.1. Synthesis of [Tm(tfaa)3(H2O)]2 (1)

A total of 0.53 g (2.4 mmol) of Tm(OH)3 was suspended in 100 mL n-hexane, and 0.87 mL (1.19 g, 7.2 mmol) H(tfaa) was added slowly. The suspension was heated under reflux until a clear solution was formed (approx. 4 h). Minor amounts of solid were removed by hot filtration. Storing the solution for two days at room temperature gave colorless needles, which were separated by filtration and dried in vacuo. The solution was reduced to half the volume. Storing for 2 days at 2 °C gave further colorless needles, which were combined with the first fraction of crystals. In total, 1.05 g (1.6 mmol; 67%) of colorless needles of 1 was obtained. 1H NMR (C6D6, 400 MHz, 26 °C): δ/ppm = −71.0 (br, 3H, tfaa-CH); −4.6 (br, 9H, tfaa-CH3); 100.0 (very br, 4H, H2O). 19F{1H} NMR (C6D6, 377 MHz, 26 °C): δ/ppm = −115.0 (br); −107.0 (br); −76.3 (br). Elemental analysis of CH found (calculated for C15H14F9O7Tm): C 28.2 (27.1), H 1.8 (2.2). IR (KBr, cm−1): 3516 (m), 3146 (m), 1635 (vs), 1594 (m), 1541 (s), 1465 (s), 1365 (m), 1269 (vs), 1233 (s), 1187 (s), 1140 (vs), 1023 (w), 1001 (w), 950 (w), 857 (m), 791 (m), 728 (m), 564 (m), 520 (w).

2.2. Synthesis of [Tm(tfaa)3(H2O)2] (2a)

A total of 0.53 g (2.4 mmol) Tm(OH)3 was suspended in 100 mL n-hexane, and 0.5 mL (28 mmol) of water and 0.87 mL (1.19 g, 7.2 mmol) H(tfaa) were added slowly. The suspension was heated under reflux until a clear solution was formed (approx. 3 h). Minor amounts of solid were removed by hot filtration. Storing the solution for one day at room temperature gave colorless needles, which were separated by filtration and air-dried. The solution was reduced to half the volume. Storing it for 8 h at 2 °C gave further colorless needles, which were combined with the first fraction of crystals. In total, 0.88 mg (1.3 mmol; 55%) of colorless needles of 2a were obtained. 1H NMR (C6D6, 400 MHz, 26 °C): δ/ppm = −71.0 (br, 3H, tfaa-CH); −7.9 (br, 9H, tfaa-CH3); 56.0 (very br, 4H, H2O). 19F{1H} NMR (C6D6, 377 MHz, 26 °C): δ/ppm = −115.0 (br); −107.0 (br); −76.3 (br). Elemental analysis of CH found (calculated for C15H14F9O7Tm—composition of 1 due to water elimination): C 27.8 (27.1), H 1.9 (2.2). IR (KBr, cm−1): 3516 (m), 3146 (m), 1635 (vs), 1594 (m), 1541 (s), 1465 (s), 1365 (m), 1269 (vs), 1233 (s), 1187 (s), 1140 (vs), 1023 (w), 1001 (w), 950 (w), 857 (m), 791 (m), 728 (m), 564 (m), 520 (w).

2.3. Synthesis of [Tm(tfaa)3(H2O)2] · Diglyme (2b)

A total of 2.20 g (10 mmol) Tm(OH)3 was suspended in 200 mL n-hexane, and 1.43 mL (1.34 g, 10 mmol) diglyme and 3.64 mL (4.62 g, 30 mmol) H(tfaa) were added slowly. The suspension was heated under reflux until a clear solution was formed (approx. 2 h). The volume of the solution was reduced to approx. 100 mL, and the solution was stored for one week at 2 °C. A total of 2.30 g (2.9 mmol; 29%) colorless needles of 2b was obtained. 1H NMR (C6D6, 400 MHz, 26 °C): δ/ppm = −65.0 (br, 3H, tfaa-CH); −7.9 (br, 9H, tfaa-CH3); 26.4 (very br, 4H, H2O). 19F{1H} NMR (C6D6, 377 MHz, 26 °C): δ/ppm = −115.0 (very br); −107.0 (very br); −76.3 (br). Elemental analysis of CH found (calculated for [Tm(tfaa)3(H2O)2] · 0.5 diglyme C18H23F9O9.5Tm): C 29.5 (29.6), H 2.4 (3.2); the low C and H values indicate partial loss of diglyme during drying of 2b. IR (KBr, cm−1): 3365 (vs), 2947 (w), 1630 (vs), 1530 (s), 1469 (s), 1361 (m), 1300 (vs), 1222 (m), 1191 (s), 1138 (vs), 1085 (m), 1040 (m), 953 (w), 876 (w), 855 (m), 780 (m), 728 (m), 563 (m).

2.4. Synthesis of [Tm(hfaa)3(H2O)2] (3) and [Tm(hfaa)2(tfa)(H2O)2]2 (4)

A total of 0.40 g (1.8 mmol) Tm(OH)3 was suspended in 100 mL n-hexane, and 0.76 mL (1.12 g, 5.4 mmol) H(hfaa) was added slowly. The suspension was stirred at room temperature for 12 h and heated under reflux for a further 2 h. Minor amounts of solid were removed by hot filtration. Storing the solution for two days at room temperature gave colorless crystals, which were separated by filtration and dried in vacuo. The solution was reduced to half the volume. Storing for two days at 2 °C gave further colorless crystals, which were combined with the first fraction of crystals. In total 0.79 g of 3 as block-like crystals with small amounts of 4 as small rod-like crystals was obtained. Recrystallization from toluene at 70 °C gave 0.69 g (0.84 mmol; 47%) pure 3. 1H NMR (C6D6, 400 MHz, 26 °C): δ/ppm = −61.0 (br, 3H, hfaa-CH). 19F{1H} NMR (C6D6, 377 MHz, 26 °C): δ/ppm = −107.0 (br). Elemental analysis of CH found (calculated for C15H7F18O8Tm): C 31.0 (31.6), H 1.5 (0.9). IR (KBr, cm−1): 3516 (m), 1640 (vs), 1623 (s), 1567 (s), 1542 (s), 1476 (s), 1433 (m), 1260 (vs), 1227 (vs), 1139 (vs), 1101 (s), 811 (s), 773 (w), 745 (m), 664 (s), 589 (s), 530 (m).

2.5. Synthesis of [Tm(tfaa)3(DME)] (5)

A total of 0.68 g (3.9 mmol) Na(tfaa) and 0.30 g (1.1 mmol) TmCl3 were stirred in 20 mL DME for 6 h. The orange suspension was filtered, and the solvent was removed in vacuo. A total of 10 mL of n-pentane was added, and volatile components were removed in vacuo. This procedure was repeated three times. Finally, 50 mL of n-pentane was added. Traces of solids were removed by filtration. The yellow solution was reduced to half the volume in vacuo. Storing the solution for three days at 2 °C gave 0.53 g (0.74 mmol; 67%) colorless rods of 5. 1H NMR (C6D6, 400 MHz, 26 °C): δ/ppm = −72.6 (br, 3H, tfaa-CH); −8.9 (br, 9H, tfaa-CH3), −97.0 (very br, 8H, DME). 19F{1H} NMR (C6D6, 377 MHz, 26 °C): δ/ppm = −127.0 (br). Elemental analysis of CH found (calculated for C19H22F9O8Tm): C 31.0 (31.8), H 2.8 (3.1). IR (KBr, cm−1): 2949 (w), 2844 (w), 1630 (vs), 1533 (s), 1457 (m), 1362 (s), 1295 (vs), 1227 (m), 1185 (s), 1130 (vs), 1055 (m), 946 (w), 874 (m), 864 (m), 780 (m), 726 (m), 607 (w), 562 (m), 517 (w).

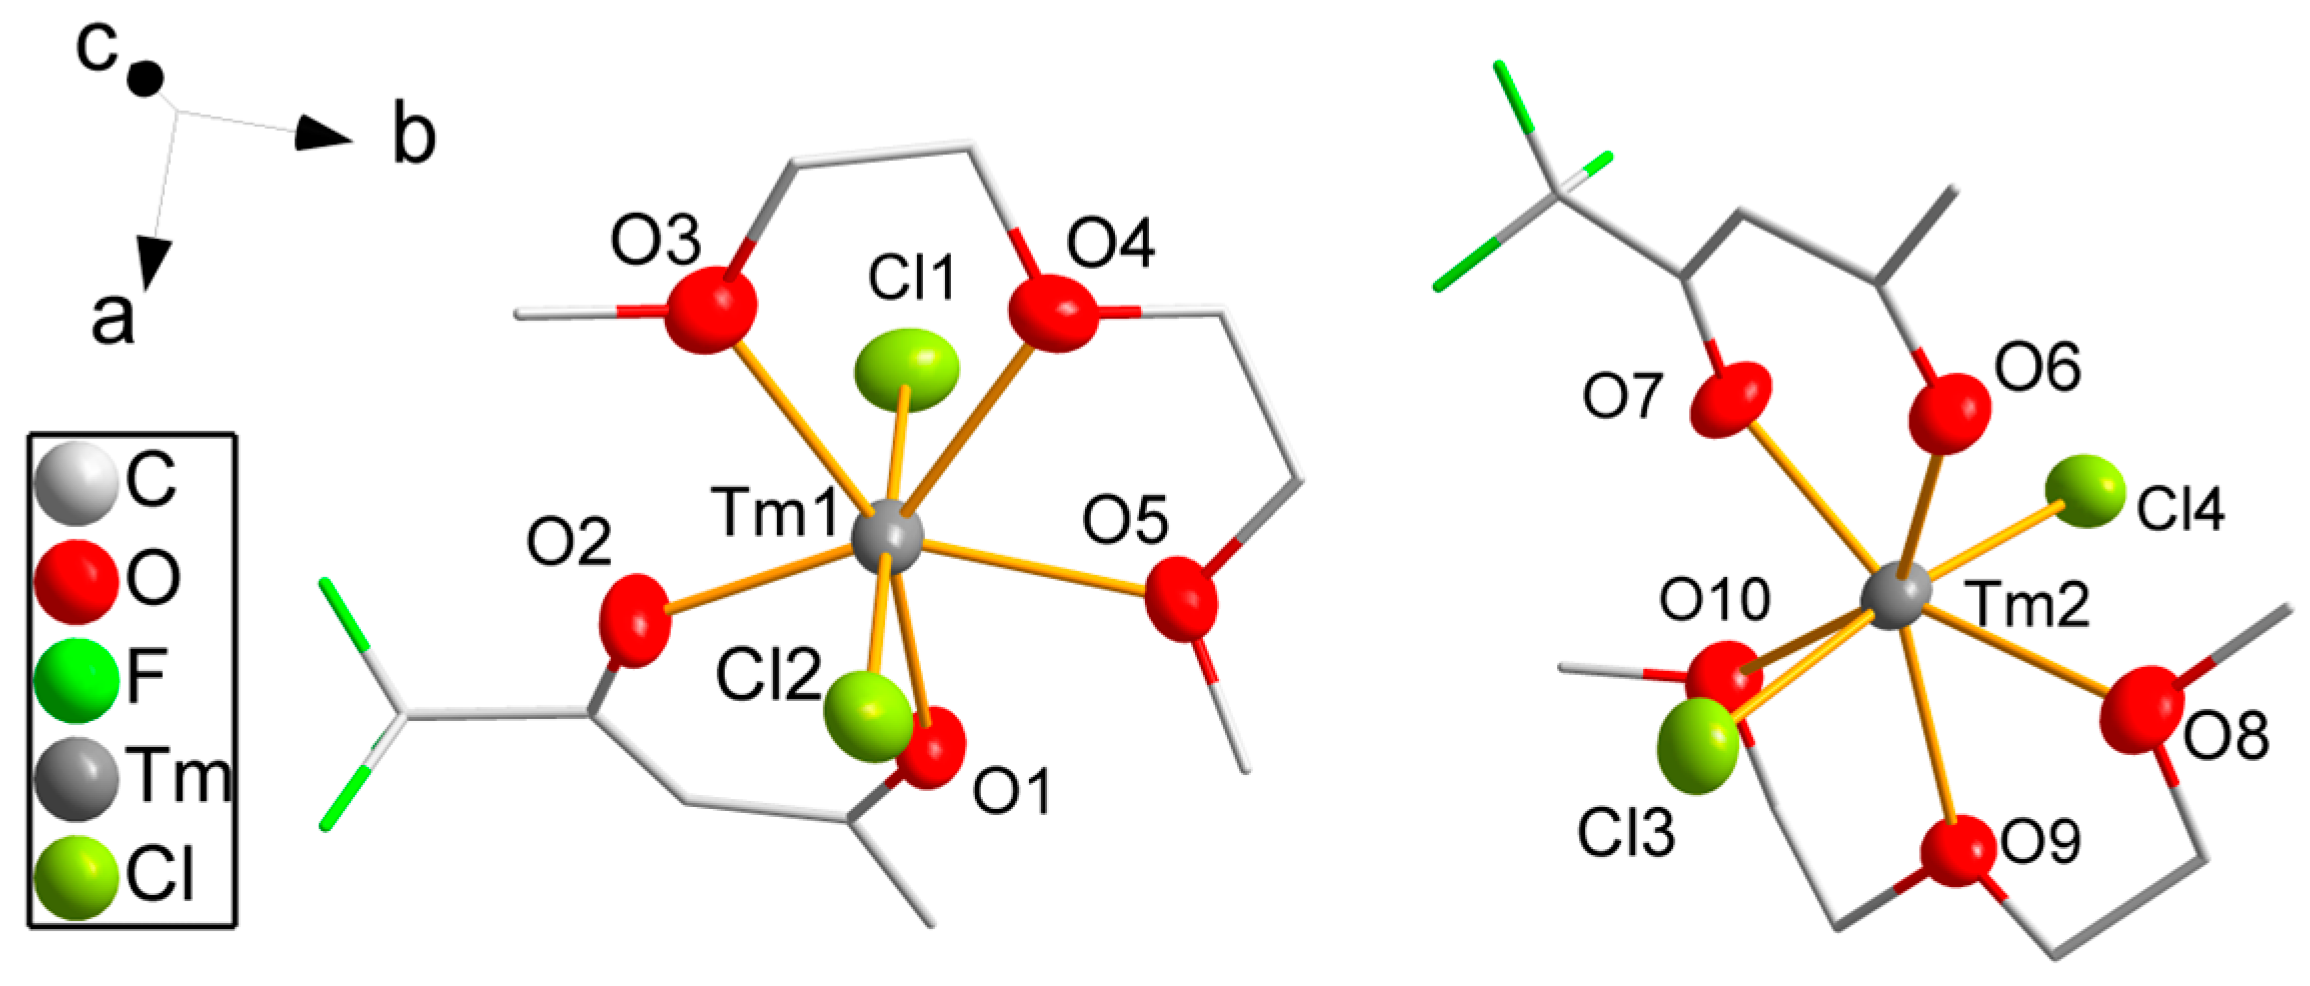
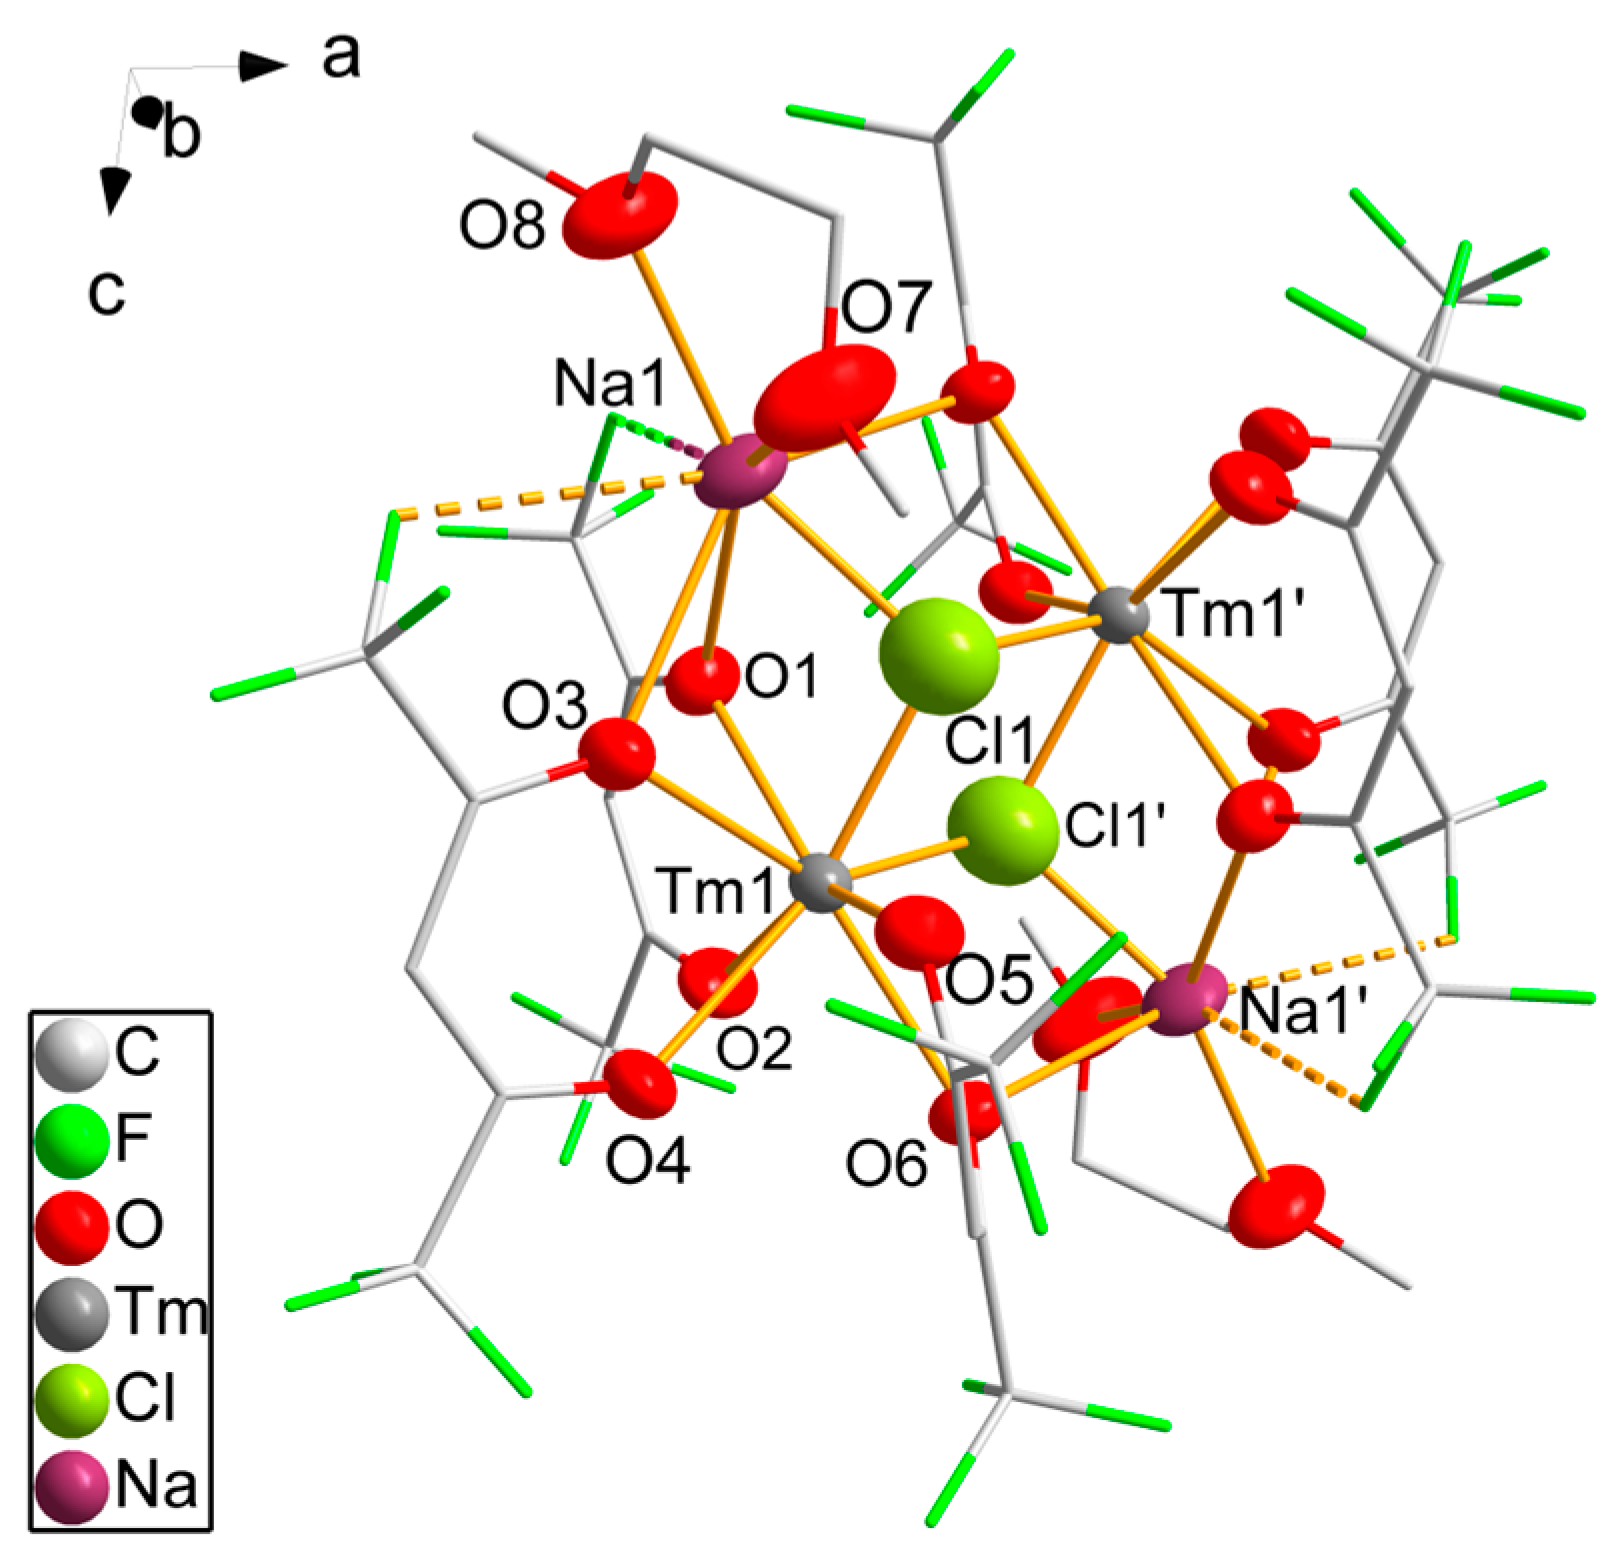
2.6. Synthesis of [TmCl2(tfaa)(diglyme)] (6)

A total of 0.27 g (1.5 mmol) Na(tfaa) and 0.41 g (1.5 mmol) TmCl3 were stirred in 15 mL diglyme for three days. The red suspension was filtered and reduced to half the volume. Storing the solution for one day at 2 °C gave 0.65 g (1.23 mmol; 82%) of colorless blocks of 6. 1H NMR (C6D6, 400 MHz, 26 °C): δ/ppm = −115.0 (br, 1H, tfaa-CH); −111.0 (very br, 1H, diglyme), −79.5 (very br, 1H, diglyme), −11.2 (br, 3H, tfaa-CH3), −37.6 (very br, 0.5H, diglyme). 19F{1H} NMR (C6D6, 377 MHz, 26 °C): δ/ppm = −107.0 (br). Elemental analysis of CH found (calculated for C19H22F9O8Tm): C 31.0 (31.8), H 2.8 (3.1). IR (KBr, cm−1): 3390 (vs), 2943 (w), 2849 (w), 1625 (vs), 1529 (s), 1473 (s), 1365 (m), 1295 (vs), 1221 (m), 1191 (s), 1143 (vs), 1084 (m), 1040 (m), 953 (w), 855 (w), 780 (m), 855 (m), 728 (m), 563 (m).

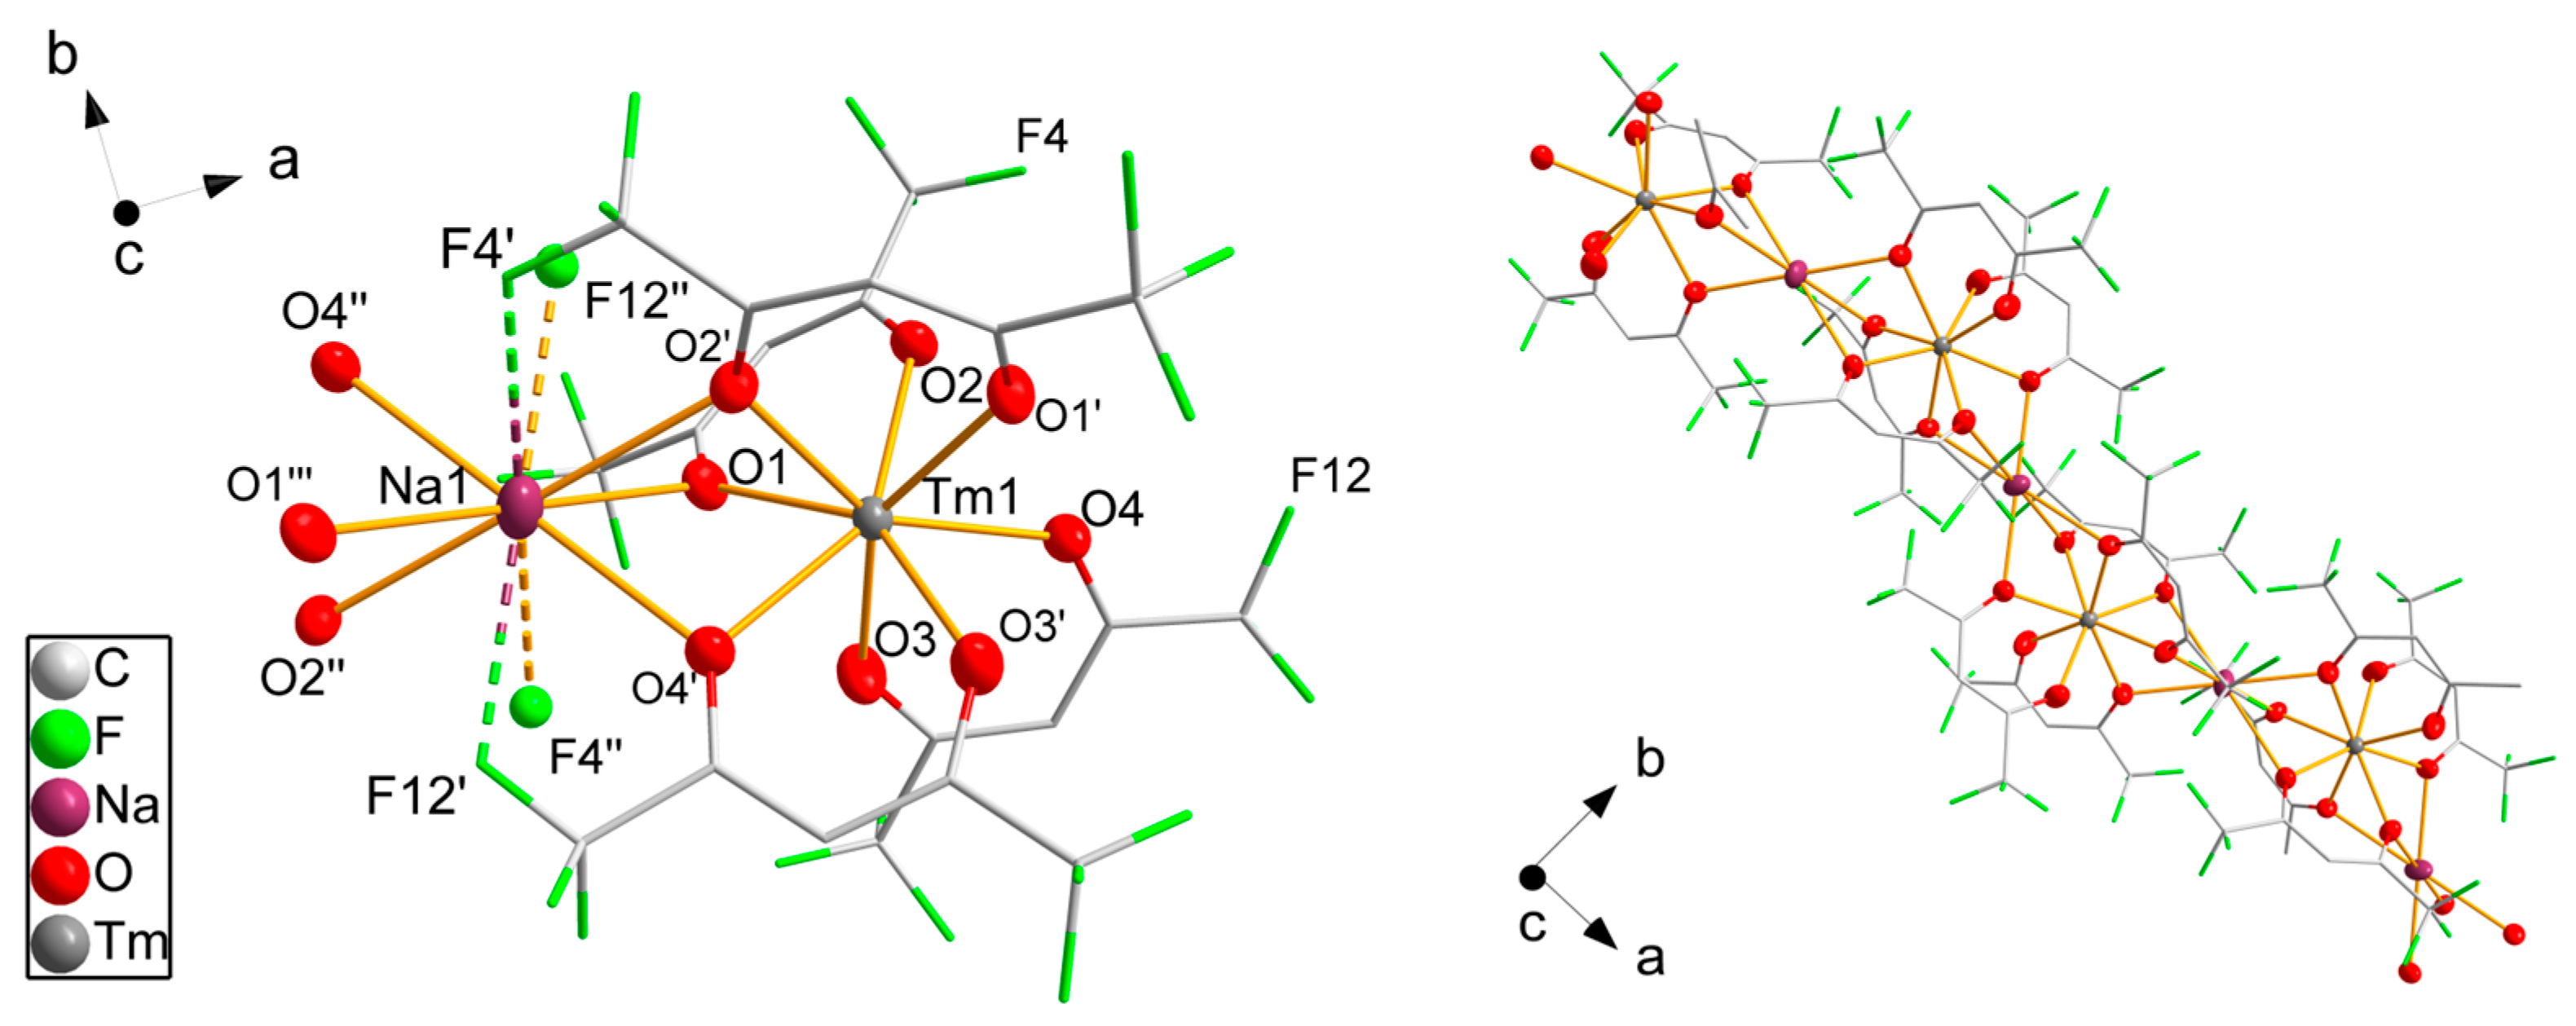
2.7. Synthesis of [Tm(hfaa)3(DME)] (7), [Tm(hfaa)3(DME)(NaCl)]2 (8) and Na[Tm(hfaa)4] (9)

A total of 0.74 g (3.2 mmol) Na(hfaa) and 0.28 g (1.0 mmol) TmCl3 were stirred in 25 mL DME for three days. The suspension was filtered, and the solvent was removed in vacuo. A total of 10 mL of n-pentane was added, and all volatile components were removed in vacuo. This procedure was repeated three times. Finally, 10 mL of n-pentane was added. Traces of solids were removed by filtration. The yellow solution was reduced to half the volume in vacuo. Storing the solution for one day at 2 °C gave 0.70 g colorless needles of 7 and 8 as well as a minor amount of octahedral crystals of 9. The product mixture was filled into a glass crucible and placed in a nitrogen-flushed 70 cm long glass tube. A 20 cm tube furnace was heated to 100 °C, and the glass tube was placed in the oven to heat the sample under a continuous nitrogen stream. After 12 h, 0.40 g (0.44 mmol, 44%) pure 7 was collected in the glass tube outside the heated zone. δ/ppm = −59.5 (br, 3H, hfaa-CH); 47.0 (br, 4H, DME-CH2), 100.0 (br, 6H, DME-CH3). 19F{1H} NMR (C6D6, 377 MHz, 26 °C): δ/ppm = −103.0 (br). Elemental analysis of CH found (calculated for C19H13F18O8Tm): C 25.4 (25.9), H 1.2 (1.5). IR (KBr, cm−1): 1649 (vs), 1611 (w), 1566 (s), 1541 (s), 1504 (s), 1472 (m), 1353 (m), 1261 (vs), 1218 (vs), 1152 (vs), 1100 (s), 1047 (m), 952 (w), 870 (m), 806 (s), 771 (w), 743 (m), 665 (s), 589 (s), 530 (w).

2.8. X-ray Crystal Structure Analyses

Crystallographic data are given in Table 1 and Table 2. Measurements were performed using a STOE IPDS 2T (Stoe & Cie. GmbH, Darmstadt, Germany) image plate diffractometer system equipped with a sealed Mo X-ray tube and a graphite monochromator crystal (λ(Mo-Kα) = 71.073 pm) or a STOE STADIVARI (Stoe & Cie. GmbH, Darmstadt, Germany), equipped with an X-ray micro-source (Cu-Kα, λ = 154.186 pm) and a DECTRIS Pilatus 300k detector (Baden, Switzerland). Data reduction and numerical absorption correction were completed with STOE X-AREA software [39]. All structures were solved by direct methods using SHELXS-2018 and refined with SHELXL-2018 [40] using WinGX [41] as a graphical frontend. All non-hydrogen atoms (except disordered C and F atoms) were refined with anisotropic thermal parameters; hydrogen atoms were included in idealized positions by applying the riding model. Diamond 4.6.8 was used for visualization of the crystal structures [42]. CCDC 2292075–2292077 and 2292079–2292084 contain the supplementary crystallographic data for this paper. These data can be obtained free of charge via http://www.ccdc.cam.ac.uk/conts/retrieving.html (accessed on 30 August 2023; or from the CCDC, 12 Union Road, Cambridge CB2 1EZ, UK; Fax: +44-1223-336033; E-mail: [email protected]).
The X-ray powder diffraction (PXRD) measurements were carried out on a STOE STADI-P diffractometer (Stoe & Cie. GmbH, Darmstadt, Germany) equipped with a sealed Cu X-ray tube, a germanium (111) monochromator crystal (λ(Cu-Kα1) = 154.060 pm) and a DECTRIS Mythen 1K detector (Baden, Switzerland). Samples were ground, filled in glass capillaries (Hilgenberg, outer diameter 0.3 mm or 0.5 mm) and measured in the Debye–Scherrer mode. Air-sensitive complexes were prepared in a glove box under an N2 atmosphere, and capillaries were sealed prior to the measurement. Rietveld analyses of the diffraction patterns were performed with Bruker TOPAS 5 software [43] using the fundamental parameter approach. Powder diffraction data for TmF3 were obtained from powder diffraction file 32-1352 (JCPDS International Centre for Diffraction Data).

3. Results and Discussion

3.1. Syntheses

According to the literature reports, lanthanum β-diketonate complexes can be synthesized by a reaction of La2O3 with hexafluoroacetylacetone [17,44]. In contrast, Tm2O3 does not react with acetylacetones. Therefore, Tm(OH)3 was chosen as the starting material for the synthesis of the H2O-containing complexes (Scheme 1). The reaction of Tm(OH)3 with trifluoroacetylacetone in a n-hexane solution gave two different products: a dinuclear monoaquo complex [Tm(tfaa)3(H2O)]2 (1) and a mononuclear diaqua complex [Tm(tfaa)3(H2O)2] (2a). A coordination number of eight is common for the late lanthanoid acetylacetonates. The presence of two water molecules in freshly prepared thulium tris-acetylacetonates was already found by elemental analysis in 1968 [14]. Complex 2a is not stable and loses one molecule of water. The open coordination site of thulium is occupied by μ2-coordination of a β-diketonate oxygen atom of a second molecule under the formation of the dinuclear complex 1. Air-dried crystals of 2a already show the powder diffraction pattern of 1 and only weak reflections belonging to the structure of 2a. After a one-week drying period, only reflections corresponding to the crystal structure of 1 were detected. For the early lanthanoids with larger ionic radii, the diglyme complexes are known [22]. However, all attempts to synthesize a diglyme complex of Tm(tfaa)3 starting from Tm(OH)3 failed. Only the crystallization of [Tm(tfaa)3(H2O)2diglyme (2b) with one molecule of diglyme in the structure without coordination to thulium was possible. The reaction of Tm(OH)3 with hexafluoroacetylacetone yields the mononuclear dihydrate complex [Tm(hfaa)3(H2O)2] (3) with [Tm(hfaa)2(tfa)(H2O)2]2 (4) (tfa = trifluoroacetate) as a minor side-product. Formation of 4 has already been observed by Richardson et al. [14] and analyzed by elemental analysis. Phase-pure 3 was obtained by recrystallization from toluene. The loss of an aquo ligand and the formation of a complex analogous to 1 was not observed for 3.
The anhydrous synthesis of thulium acetylacetones starting from TmCl3 and the sodium salts Na(tffa) and Na(hffa) in DME gave phase-pure [Tm(tfaa)3(DME)] (5) and [Tm(hfaa)3(DME)] (7), respectively. For the latter reaction, two crystalline side-products could be characterized as [Tm(hfaa)3(DME)NaCl]2 (8) and Na[Tm(hfaa)4] (9). Phase-pure 7 was obtained after transport in a nitrogen stream at 100 °C. Attempts to synthesize the thulium tris(trifluoroacetylacetonate) complex with diglyme as a co-ligand under water-free conditions were not successful and always led to the crystallization of the complex [TmCl2(tfaa)(diglyme)] (6).

3.2. Single-Crystal Structure Analyses

All complexes were obtained as crystals suitable for single-crystal structure analysis. Crystallographic details are summarized in Table 1 and Table 2. While the coordination of thulium by three β-diketonate ligands and two oxygen donor atoms is the same in 2a, 3 and 5 (Figure 1), compound 1 forms a dimeric complex in the solid state. All four complexes crystallize in the triclinic space group P 1 ¯ . The complex 2a crystallizes isomorphous to other late lanthanoid hexafluoroacetylacetonate complexes, e.g., with erbium [21] or holmium [45] as central atoms. The dinuclear molecule of 1 is generated crystallographically by the inversion center from half the molecule. Complexes 2a, 3 and 5 crystallize with two formula units per unit cell, while 2b crystallizes with four molecules per unit cell in the acentric monoclinic space group Ic. The coordination number of the Tm3+ ions is eight in the four complexes. Tm-O bond distances are summarized in Table 3. The dinuclear molecule 1 is formed by the bridging atom O5 and its symmetry equivalent, O5′. The Tm-O bond distances are significantly longer for the μ2-coordinating oxygen atom O5 with 242.1(4) pm and 247.5(4) pm than for the singly coordinating oxygen atoms. In 2a, 2b, 3 and 5, each acetylacetonate ligand chelates only one thulium atom. The Tm-O bond distances to the acetylacetonate ligands vary only slightly, probably due to intermolecular steric interactions. Intermolecular interactions are likely for the aquo complexes. For example, the protons of the water molecules are oriented in the direction of neighboring fluorine atoms with O···F distances of 299(2) pm in 2a, 292(2) pm and 295(1) pm in 3 or to the co-crystallizing diglyme molecule with O···O 278(2) pm in 2b, which makes hydrogen bonding likely. The Tm-O bond distances to the coordinating water molecules are similar for all complexes. Longer Tm-O distances with 243.4(3) pm and 249.9(3) pm are noticeable in the DME complex 5 as also observed in complex 7, which is known in the literature. In 1, 2a, 2b, 3 and 5, the thulium atoms are close to an ideal tetragonal-antiprismatical coordination geometry as confirmed by SHAPE [46] analysis. All O-Tm-O bond angles are close to the ideal angles of 73° and 78°. Only small deviations from the ideal angles are observed (3° in 1, 2a and 2b). In 3 with the sterically more demanding hexafluoroacetylyacetonate ligands, the deviation is slightly higher at 6°. Due to the steric constraints in 5, the bond angle O-Tm-O of the chelating DME molecule is small at 65.08(9)° while other O-Tm-O bond angles are widened up to 85.30(10)°.
The dinuclear molecule 4 (Figure 2) is generated by inversion symmetry with the inversion center between the thulium atoms. Each thulium atom is coordinated by two hfaa ligands with varying Tm-O bond lengths from 226.9(4) pm to 237.2(4) pm. Two water molecules bind to the metal atom with slightly longer Tm-O distances. The coordination number of eight is achieved by two additional trifluoroacetate (tfa) ligands bridging both thulium atoms. The tfa ligand shows asymmetric coordination with a shorter Tm-O distance of 226.9(4) pm and a C-O-Tm angle of 162.5(5)° and a longer bond (238.5(4) pm) with a 119.8(4)° bond angle. The coordination of the thulium atom is distorted with a wide O5-Tm1-O6 angle between the tfa ligands of 104.7(2)° and smaller angles varying from 70.0(2)° to 79.1(2)°. According to SHAPE [46] analysis, the coordination mode is better described as triangular dodecahedral.
Compound 6 crystallizes in the monoclinic space group P21/c. Two crystallographically independent but similar complex molecules form the asymmetric unit (Figure 3), and eight molecules (Z = 8) are located in the unit cell. The coordination number of thulium is reduced to seven. A diglyme molecule forms a chelate complex by coordination of the three oxygen atoms with bond distances varying slightly from 237.8(3) pm to 240.5(4) pm for both molecules, which are shorter than for the chelating DME molecules due to the lower coordination number of the thulium atom. Only one tfaa ligand is coordinating with shorter Tm-O bond distances between 220.4(3) pm and 224.7(3) pm than for eightfold coordinated thulium. The coordination sphere is completed by two chlorine atoms with bond distances varying from 255.9(2) pm to 257.4(2) pm coordinating linearly with a Cl-Tm-Cl angle of 177.06(5)° and 172.61(5)° for the first and for the second molecule, respectively. The coordination geometry of the thulium atoms is close to pentagonal bipyramidal with the Cl atoms in the axial position, equal bond angles for the oxygen atoms of the diglyme ligands from 66.3(2)° to 67.5(2)° and slightly larger bond angles for the tfaa ligands varying from 73.8(2) pm to 78.6(2)°.
The structure of 8 reveals the monoclinic space group P21/n. It forms dinuclear complex molecules; half a molecule corresponds to the asymmetric unit; the complete molecule is generated by inversion symmetry (Figure 4). The thulium atom is coordinated by three hfaa ligands. The oxygen atoms of each hfaa ligand interact with the thulium atom differently. One oxygen atom is terminally coordinated with Tm-O distances ranging from 230.4(8) pm to 232.0(7) pm. The second oxygen atom connects a thulium atom to a sodium atom in the μ2-bridging mode with Tm-O distances varying from 232.0(6) pm to 238.0(6) pm and Na-O distances from 257.0(8) pm to 271.7(8) pm. Notably, shorter Tm-O distances correspond to longer Na-O distances. The eightfold coordination of the thulium atoms is achieved by the coordination of two symmetry-equivalent chlorine atoms. With 220.9(5) pm and 221.9(5) pm, the Tm-Cl distances are significantly shorter than observed in 5. The chlorine atoms are μ3-coordinating, bridging both thulium atoms of the dinuclear molecule and a sodium atom (Na–Cl 225.1(6) pm). The coordination sphere of the sodium atom is completed by the coordination of one DME molecule with equal Na-O distances of 233.0(8) pm and 233.2(9) pm. The sixfold coordination of the sodium atom is heavily distorted with a small bond angle to two hfaa oxygen atoms of 61.5(3)° and very wide angles up to 138.3(3)° between the DME oxygen atoms and hfaa oxygen atoms. Two fluorine atoms of the two hfaa ligands of the neighboring complexes are directed toward the free space of the sodium’s coordination sphere. Na···F distances of 286(2) pm and 299(2) pm are smaller than the sum of the van der Waals radii [47] of both elements of 374 pm, which makes a weak attractive interaction likely. According to SHAPE [46] analysis, the coordination of the thulium atom is again close to square antiprismatic, with bond angles varying from 68.2(3)° to 81.3(3)°.
Compound 9 is a one-dimensional polymer crystallizing in the monoclinic space group I2/c (Figure 5). The crystal structures of cesium salts of erbium, neodymium and ytterbium diketonates are known in the literature [48] and their structures are similar. The asymmetric unit contains two molecules of hexafluoroacetylacetonate, one sodium atom on an inversion center and one thulium atom located on the twofold rotational axis. Two additional hfaa molecules generated by rotational symmetry coordinate the thulium atom. The negative charge of the [Tm(hfaa)4] anion is balanced by a sodium cation. The coordination geometry of the thulium atom is close to tetragonal-antiprismatic with only a 2° deviation from the ideal angles. The shortest Tm-O distance is 226.5(4) pm to O3, which is the oxygen atom coordinating to thulium only. Oxygen atoms O1, O2 and O4 have longer bond distances to thulium varying from 231.1(3) pm to 236.5(3) pm due to a second bond to the sodium atom with two shorter distances of 258.8(3) pm to O1 and 255.1(3) pm to O4 and a longer distance of 271.4(3) pm to O2. The sodium atom also binds to the oxygen atoms of the adjacent [Tm(hfaa)4] unit, generating the one-dimensional polymeric structure along the crystallographic a direction. The octahedral environment around Na1 is severely distorted with bond angles of 117.0(1)° and 63.0(1)°. Four fluorine atoms are close to the sodium atom with distances of 277.7(4) pm for F12′ and the symmetry equivalent F12″ and 294.5(4) pm to F4′ and F4″, which are again shorter than the sum of the van der Waals radii [47] of both elements of 374 pm. Additionally, the thermal parameters of both fluorine atoms F4 and F12 are significantly smaller than for the other fluorine atoms, supporting the interpretation as Na···F interactions. According to SHAPE [46] analysis, the coordination sphere of Na1 is best described as a pentagonal antiprismatic.

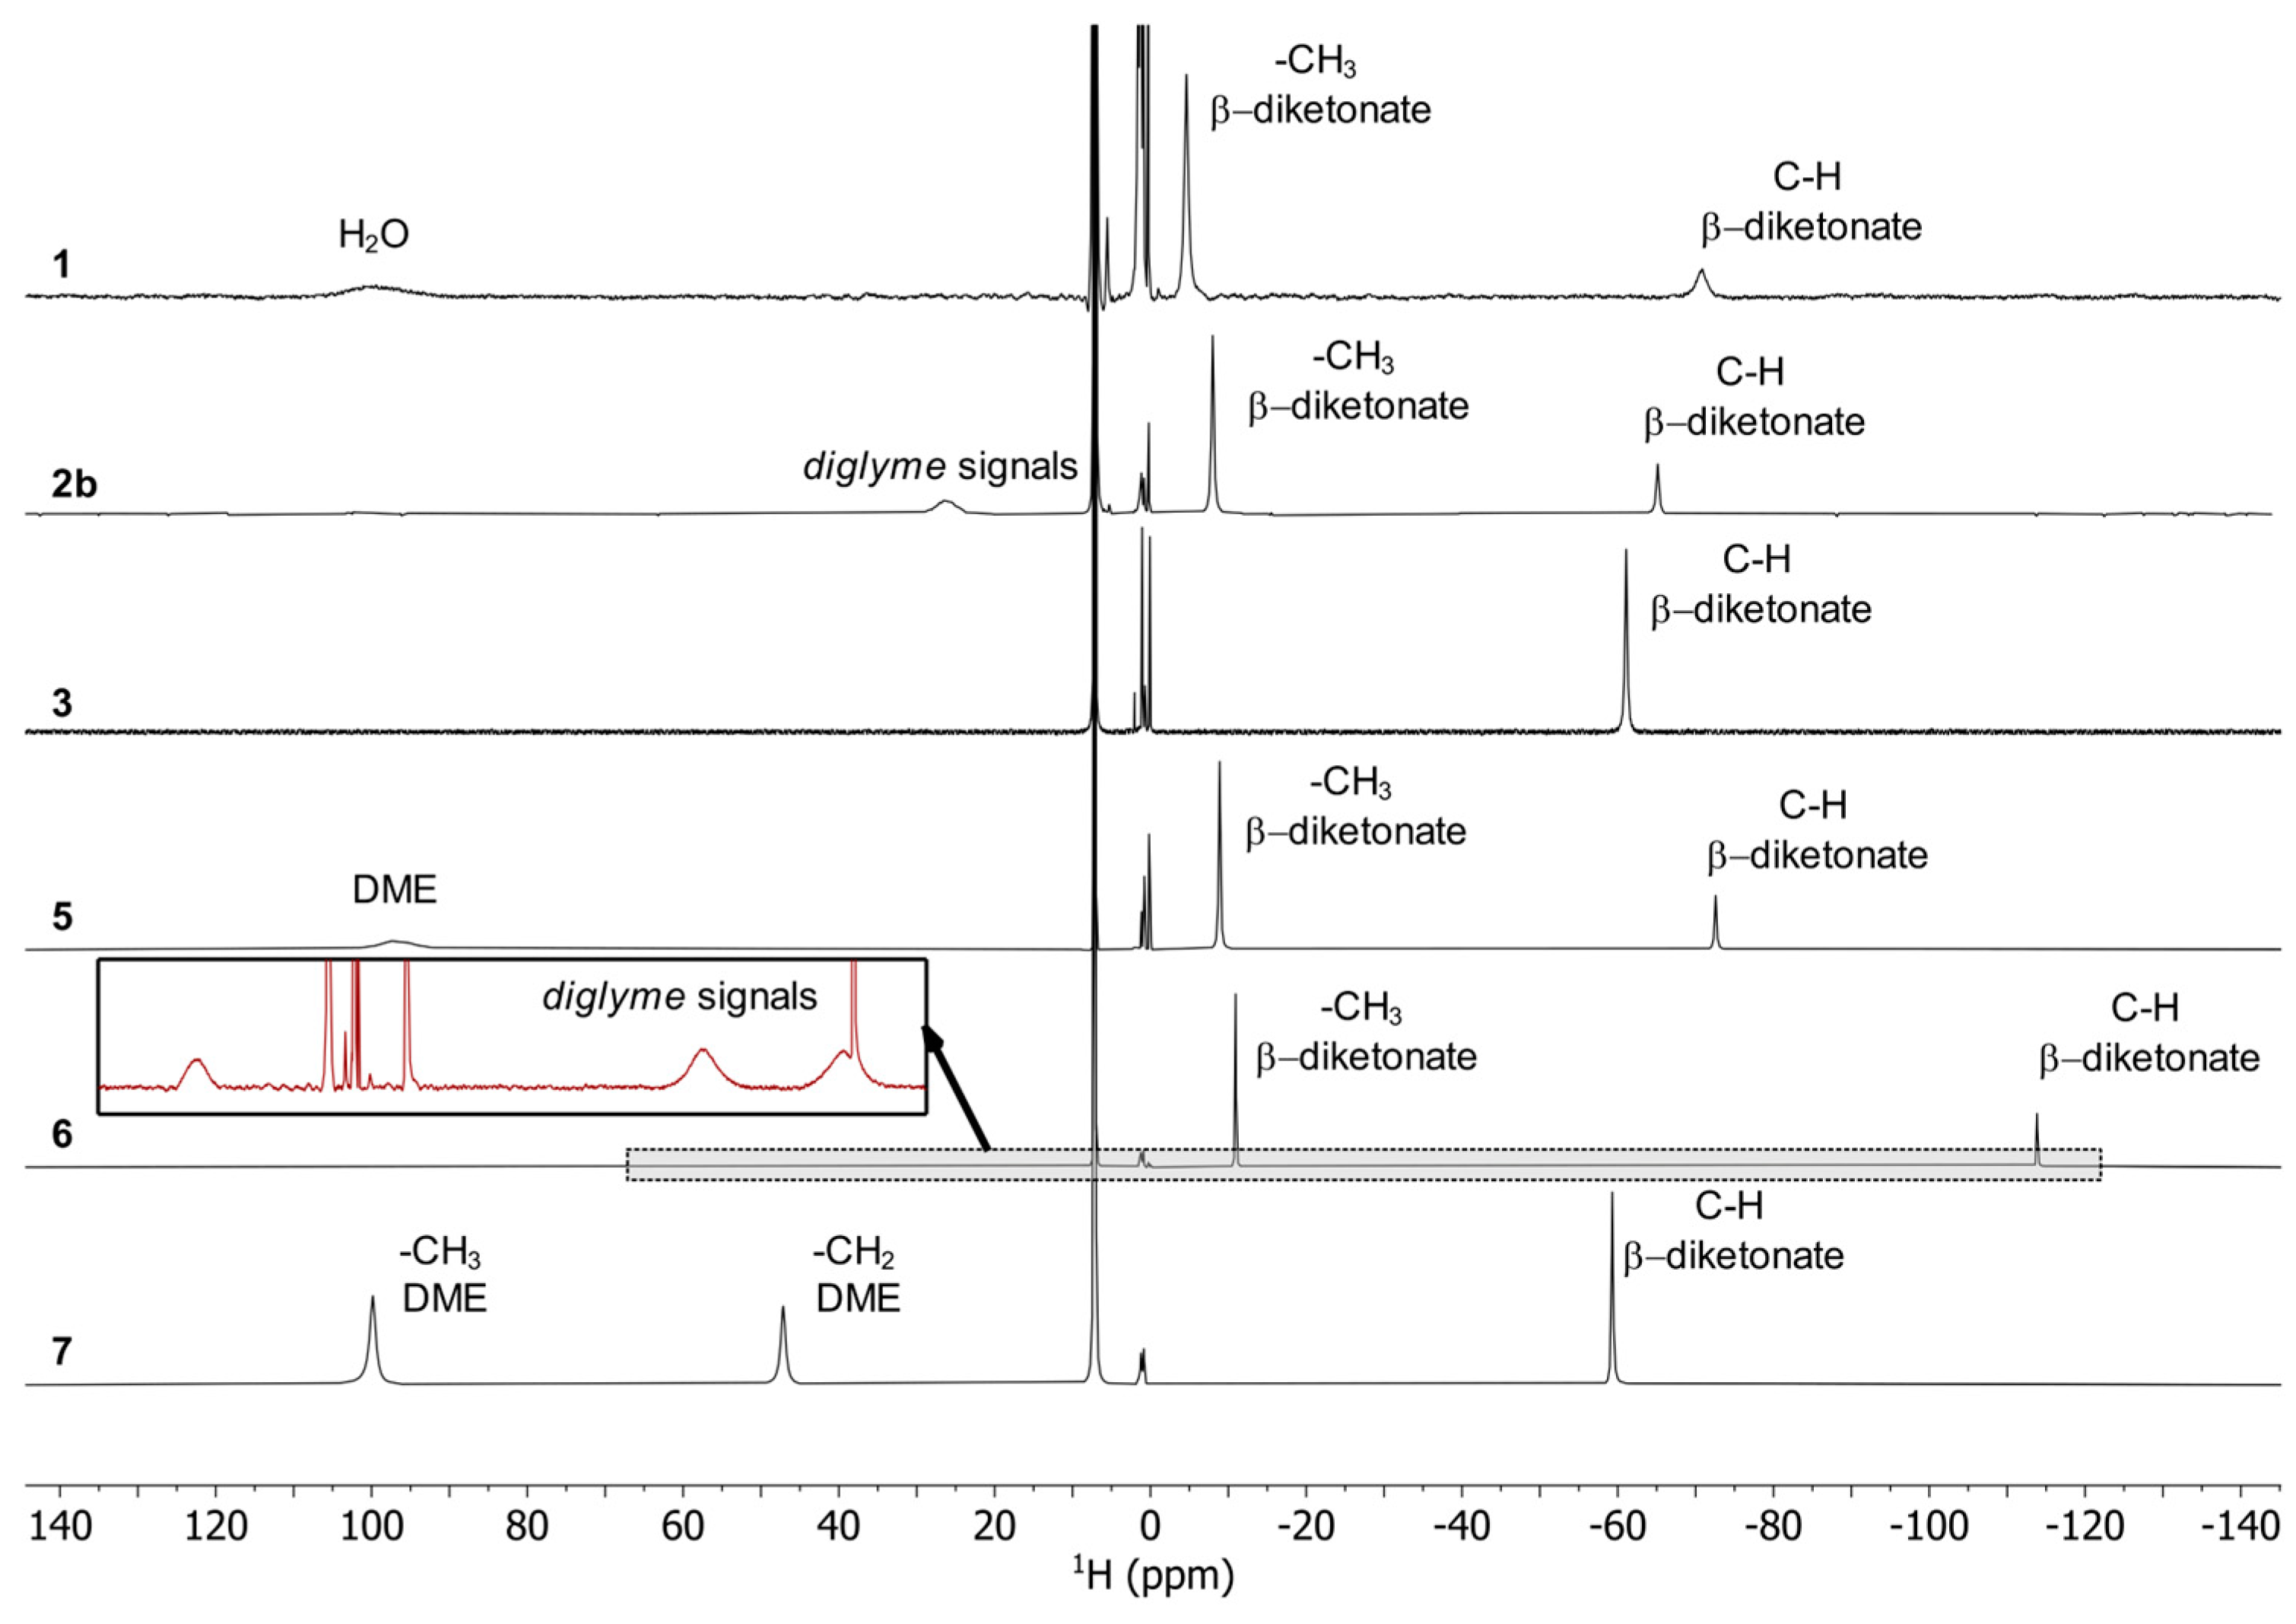
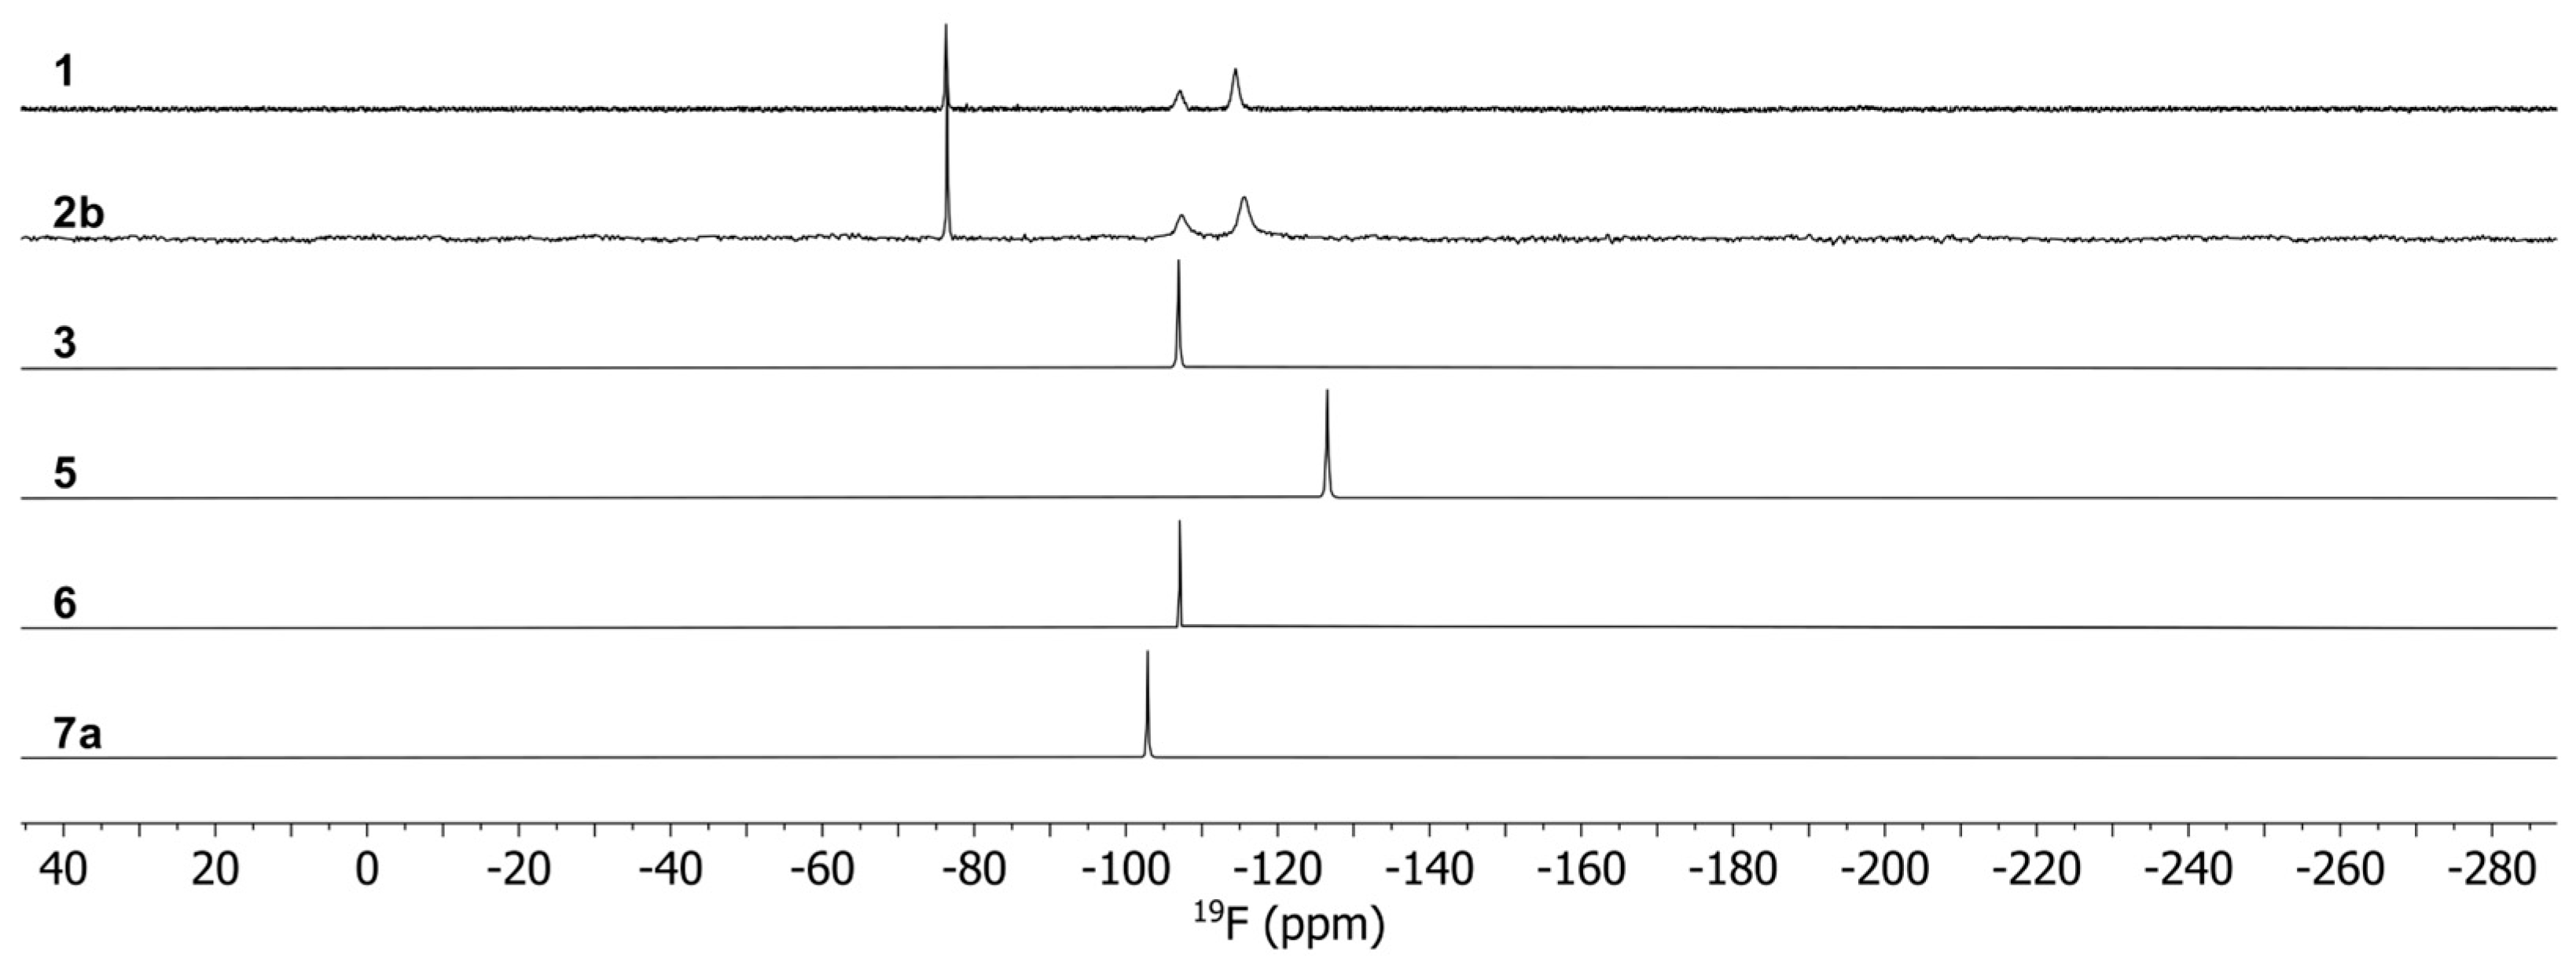
3.3. Spectroscopic Characterization of the Complexes

The complexes that were obtained phase pure have been analyzed by NMR spectroscopy in C6D6 or CDCl3 as non-coordinating solvents. Due to Tm3+ ions being paramagnetic, the NMR signals are shifted and broadened and the signals for the co-ligands (water, DME or diglyme) especially reveal a diverging behavior. The latter-mentioned specificity of NMR signals stemming from paramagnetic systems results from a substantial impact of the unpaired electrons to the chemical shielding of the nuclear spin and its coupling with the electron spin (hyperfine coupling). Whereas the chemical shielding impact is the reason for the NMR signals being shifted by hundreds of ppm (in some cases), the coupling to the unpaired electron induces extensive line broadening, which is due to increased nuclear spin relaxation rates (shortened spin-spin relaxation time T2) [49]. Both mentioned characteristics of paramagnetic NMR spectra are strongly distance-depended and hamper the interpretation of the NMR data, which in particular is true for the acquired 1H NMR data, as the increased relaxation rate also reduces the reliability of the obtained relative signal intensities (integrals). The latter is one reason for strong deviations of the proton integrals given in the analytical dataset of each synthesized compound. Additionally, chemical exchange processes may also have an impact on the signal intensities.
According to the single-crystal analysis, the transformation of 2a in 1 was also confirmed by NMR spectroscopy with identical spectra for 2a and 1. The 19F NMR spectra (Figure 6) of the complexes show a single peak for 3, 5, 6 and 7 as expected for mononuclear complexes, which are shifted upfield in comparison to Na(tfaa) and Na(hfaa) with signals around -77 ppm. Also, the 1H spectra (Figure 7) are consistent with signals for the acetylacetonate protons at very low chemical shifts between −114 ppm and −61 ppm due to the shorter distance to the paramagnetic center than for the methyl protons at −9 ppm in 5 and −11 pm in 6. While a single very broad signal is present for the DME protons at 97 ppm in 5, two signals for DME are clearly separated in the 1H spectrum of 7 with 47 ppm for the methylene groups and 100 ppm for the methyl groups. Three very broad signals for diglyme can be observed in the 1H spectrum of 6. The spectra are more complex for compounds 1 and 2b with dynamic effects in solution. Different concentrations of the same sample gave different spectra with two or three 19F signals. Two 19F signals can be expected for the known dimeric crystal structure of 1 with terminal and bridging tfaa ligands. In the 1H spectra, both signals are present for the tfaa ligands. The positions of these signals vary with different sample concentrations. The X-ray powder diffraction (PXRD) pattern of a vacuum-dried sample of 2b shows additional reflections of an unknown phase with slowly increasing intensities. A slow release of the diglyme from the crystal structure is likely and matches with low intensities of the diglyme signals in the 1H spectrum. The 19F NMR spectrum of 2b is identical with that of 1. The presence of the same thulium species in the solution is very likely.
ESI-MS (Figures S2 and S3) has been applied to the complexes. However, none of the compounds are stable under these conditions. Even soft ionization techniques resulted in mass spectra with multiple signals for several mono- and dinuclear species with one or two acetylacetonate ligands.
The IR spectra of the tfaa complexes are very similar. Both spectra of as-synthesized 1 and 2a are identical, the loss of water and transformation of 2a to 1 is confirmed by IR spectroscopy. Spectra of the diglyme containing complexes 2b and 6 are similar to the aqueous complexes with some additional bands, e.g., the stretching vibrations for CH3 and CH2 groups around 2900 cm−1. Both complexes are very hygroscopic and show strong O-H vibrations after sample preparation. Weak CH3 and CH2 stretching vibrations are also observed in spectra of the DME complex 5. Both spectra of the hfaa complexes 3 and 7 are identical and no bands for DME were observed in the spectrum of 7. However, a low-intensity band for O–H vibrations around 3400 cm−1 is already present, probably due to slow decomposition in ambient atmosphere under the elimination of DME. The DME complexes 5 and 7 should be stored under dry conditions. The stretching vibrations for the C=O bonds ranging between 1625 cm−1 and 1649 cm−1 for all complexes are in agreement with previously reported lanthanoid-based β-diketonate complexes [11,45], in contrast to the non-coordinated ligand with vibrations around 1700 cm−1.

3.4. Thermal Analysis

Thermal analyses of the most promising complexes, 1, 3, 5 and 7, have been performed by three different methods: thermogravimetric analyses up to 600 °C with a constant heating rate of 10 K min−1 (Figures S11–S14), isothermal thermogravimetric analyses at 100 °C (Figures S14–S17) and sublimation experiments as described in the Section 2. The sublimation products and residues were analyzed by NMR spectroscopy (Figures S26–S28) and X-ray diffraction (Figures S18–S24). The results are summarized in Table 4.
In the sublimation experiment of 1, a thulium-containing species has been transported. NMR spectra of the transported product are identical with those of crystals of 1, but powder diffraction showed an unknown phase. Water has been detected by NMR spectroscopy as volatile species. The residue after the 2 h sublimation experiment has been analyzed by PXRD and NMR spectroscopy and confirmed the structure of 1 with minor traces of decomposition products. In a thermogravimetric experiment in the temperature range from r.t. to 600 °C, a clear plateau appears between 120 °C and 200 °C, and mass spectrometry shows a quite intense water signal (m/z 18). A further dehydration to [Tm(tfaa)3] is very likely. Additionally, traces of fluorine-containing volatile species have been detected, which proves a partial decomposition of the thulium complex 1.
In the sublimation experiment of 3, the PXRD pattern and NMR spectra of the transported species are identical with those of the product obtained directly from synthesis. This proves the volatility of 3 at 100 °C. The non-transported material after the 2 h experiment is mainly crystalline 3, but minor traces of decomposition products have been identified. Additionally, small quantities of volatile fluorine-containing species in the gaseous phase have been detected by NMR spectroscopy. Complex 3 slowly decomposes at 100 °C in vacuo.
For compound 5, under these conditions, only decomposition under the elimination of DME and fluorine-containing species was observed, but no volatile thulium species were detected. Thus, 5 is not a suitable volatile precursor material.
Surprisingly, in a first sublimation experiment in vacuo with the mixture of 7, 8 and 9, 8 was also transported. However, a pure sample of 7 could be obtained by a transport experiment at normal pressure in the nitrogen stream whereas 8 was not transported.
The thermochemical properties of 7 are excellent as has already been reported for other lanthanoid complexes [13]. A high transport rate was confirmed in sublimation and thermogravimetric experiments. Complex 7 remains stable during transport as proven by PXRD and NMR spectroscopy. After 2 h at 100 °C, the non-transported residue showed no sign for decomposition.
The formation of TmF3 as a solid thermolysis product was observed by X-ray powder diffraction for all complexes (Figure S25). In simultaneous thermolysis experiments coupled with mass spectrometry (Figure S12), identical mass fragments were recorded as published by Meng et al. [50]. The complexes decompose with the transfer of one fluorine atom to thulium under the elimination of CO and the formation of F2C=CH–C(O)–CF3 [18,51].

4. Conclusions

Thulium fluoroacetylacetonate complexes with nine new crystal structures have been synthesized and characterized. While aqueous hexafluoroacetylacetonate complexes are known in the literature, their crystal structures have not been reported so far. [Tm(hfaa)3(H2O)2] (3) crystallizes isomorphous to the known holmium, erbium and ytterbium complexes. The complex is volatile and can be transported in the gas phase. A side-product, [Tm(hfaa)2(tfa)(H2O)2]2 (4), has been identified by single-crystal structure analysis. The most promising volatile thulium complex for CVD or ALD applications is [Tm(hfaa)3(DME)] (7).
Two side-products, [Tm(hfaa)3(DME)NaCl]2 (8) and Na[Tm(hfaa)4] (9), have been characterized by single-crystal structure analysis. In both complexes, sodium cations are present due to the reaction route starting from sodium β-diketonates and TmCl3. In contrast to 3, the tfaa diaquo complex [Tm(tfaa)3(H2O)2] (2a) is unstable. The crystals lose one molecule of water under the formation of [Tm(tfaa)3(H2O)]2 (1). This complex is less volatile, the transport rate is significantly lower than for the hexafluoroacetylacetonate complexes and the crystal structure of the transported species differs from that of the synthesized complex. Replacing the water molecules by DME is possible, and [Tm(tfaa)3(DME)] (5) has been characterized. However, the transport experiments were not successful, and only the evaporation of the DME molecule was detected by spectroscopic methods. All attempts to replace the aquo ligands by a diglyme molecule were not successful. In [Tm(tfaa)3(H2O)2)] · diglyme (2a), the diglyme molecule crystallizes as a solvent molecule without bonding to the thulium atom. In [TmCl2(tfaa)(diglyme)] (6), the diglyme molecule chelates the thulium atom, but only one chlorine ion of the TmCl3 starting compound has been replaced by a trifluoroacetylacetonate ligand.

Supplementary Materials

The following supporting information can be downloaded at: https://www.mdpi.com/article/10.3390/cryst13101467/s1, Figure S1: ESI-MS spectrum of 1 in MeCN solution; Figure S2: ESI-MS spectrum of 3 in MeCN solution; Figure S3: X-ray powder diffraction pattern (λ = 154.060 pm) obtained from the crystals of [Tm(tfaa)3(H2O)]2 (1) (black) and simulated diffraction pattern based on single-crystal data of 1 (purple); Figure S4: X-ray powder diffraction pattern (λ = 154.060 pm) obtained from the crystals of [Tm(tfaa)3(H2O)2] (2a) (black) and simulated diffraction pattern based on single-crystal data of 1 (purple); Figure S5: X-ray powder diffraction pattern (λ = 154.060 pm) obtained from the crystals of [Tm(tfaa)3(H2O)2] · diglyme (2b) (black) and simulated diffraction pattern based on single-crystal data of 2b (purple). There are additional reflections indicating a phase transition or decomposition; Figure S6: X-ray powder diffraction pattern (λ = 154.060 pm) obtained from the crystals of [Tm(hfaa)3(H2O)2] (3) (black) and simulated diffraction pattern based on single-crystal data of 3 (purple); Figure S7: X-ray powder diffraction pattern (λ = 154.060 pm) obtained from the crystals of [Tm(tfaa)3(DME)] (5) (black) and simulated diffraction pattern based on single-crystal data of 5 (purple); Figure S8: X-ray powder diffraction pattern (λ = 154.060 pm) obtained from the crystals of [TmCl2(tfaa)(diglyme)] (6) (black) and simulated diffraction pattern based on single-crystal data of 6 (purple). There are additional reflections indicating a phase transition or decomposition. Figure S9: X-ray powder diffraction pattern (λ = 154.060 pm) obtained from the crystals of [Tm(hfaa)3(DME)] (7) after transport in nitrogen stream (black) and simulated diffraction pattern based on single-crystal data of 7 (purple); Figure S10: TG curve (black) and DTA curve (blue) for the thermolysis of 1 at temperatures up to 600 °C; Figure S11: TG curve (black) and DTA curve (blue) for the thermolysis of 3 at temperatures up to 600 °C; Figure S12: TG curve (black), DTA curve (blue) and selected ion curves (m/z 15 CH3+; m/z 19 F+; m/z 43 CH3(CO)+; m/z 63 F2C=CH+; m/z 69 CF3+; m/z 85 CF3O+) for the thermolysis of 5 at temperatures up to 600 °C; Figure S13: TG curve (black) and DTA curve (blue) for the thermolysis of 7 at temperatures up to 600 °C; Figure S14: TG curve (black), DTA curve (blue) and temperature curve (red) for the isothermal treatment of 1 at 100 °C; Figure S15: TG curve (black), DTA curve (blue) and temperature curve (red) for the isothermal treatment of 3 at 100 °C; Figure S16: TG curve (black), DTA curve (blue) and temperature curve (red) for the isothermal treatment of 5 at 100 °C; Figure S17: TG curve (black), DTA curve (blue) and temperature curve (red) for the isothermal treatment of 7 at 100 °C; Figure S18: X-ray powder diffraction pattern (λ = 154.060 pm) obtained from the non-transported residue of 1 after 2 h sublimation experiment (black) and simulated diffraction pattern based on single-crystal data of 1 (blue); Figure S19: X-ray powder diffraction pattern (λ = 154.060 pm) obtained from the transported species of 1 after 2 h sublimation experiment (black) and simulated diffraction pattern based on single-crystal data of 1 (blue); Figure S20: X-ray powder diffraction pattern (λ = 154.060 pm) obtained from the non-transported residue of 3 after 2 h sublimation experiment (black) and simulated diffraction pattern based on single-crystal data of 3 (blue); Figure S21: X-ray powder diffraction pattern (λ = 154.060 pm) obtained from the transported species of 3 after 2 h sublimation experiment (black) and simulated diffraction pattern based on single-crystal data of 3 (blue); Figure S22: X-ray powder diffraction pattern (λ = 154.060 pm) obtained from the non-transported residue of 5 after 2 h sublimation experiment (black) and simulated diffraction pattern based on single-crystal data of 5 (blue); Figure S23: X-ray powder diffraction pattern (λ = 154.060 pm) obtained from the non-transported residue of 7 after 2 h sublimation experiment (black) and simulated diffraction pattern based on single-crystal data of 7 (blue); Figure S24: X-ray powder diffraction pattern (λ = 154.060 pm) obtained from the transported species of 7 after 2 h sublimation experiment (black) and simulated diffraction pattern based on single-crystal data of 7 (blue); Figure S25: X-ray powder diffraction pattern (λ = 154.060 pm) obtained from the product of a thermolysis experiment of 3 at 600 °C. Reflection positions of TmF3 (taken from PDFII database entry 32-1352) are shown as red lines; Figure S26: 1H NMR spectrum at 400 MHz (bottom) and 19F NMR spectrum at 377 MHz (top) at 26 °C for the transported species of 1 in 2 h sublimation experiment. The 19F spectrum is identical with that of the as-synthesized sample of 1. And the 1H NMR spectrum shows the same signals as 1 with a small (5 ppm) shift of the β-diketonate CH-signal; Figure S27: 1H NMR spectrum at 400 MHz (bottom) and 19F NMR spectrum at 377 MHz (top) at 26 °C for the transported species of 5 after the 2 h sublimation experiment. There is no signal typical for a (paramagnetic) thulium or a fluorinated species; Figure S28: 1H NMR spectrum at 400 MHz (bottom) and 19F NMR spectrum at 377 MHz (top) at 26 °C for the trapped volatile species in the 2 h sublimation experiment of 5. There is no signal typical for a thulium species. DME and a CF3-group containing non-paramagnetic species were trapped from the gas phase; Figure S29: Setup of the sublimation experiments; Figure S30: IR spectrum of 1 as KBr disc; Figure S31: IR spectrum of 2a as KBr disc; Figure S32: IR spectrum of 2b as KBr disc; Figure S33: IR spectrum of 3 as KBr disc; Figure S34: IR spectrum of 5 as KBr disc; Figure S35: IR spectrum of 6 as KBr disc; Figure S36: IR spectrum of 7 as KBr disc.

Author Contributions

Writing—original draft preparation, D.F.; investigation, K.K., M.K. and D.F.; formal analysis, M.I.; project administration, H.K. All authors have read and agreed to the published version of the manuscript.

Funding

This research was funded by Universität Leipzig (strategic research area “Intelligent Methods and Materials”, research profile area “complex matter”).

Data Availability Statement

CCDC 2292075–2292077 and 2292079–2292084 contain the crystallographic data for this paper. These data can be obtained free of charge from The Cambridge Crystallographic Data Centre via www.ccdc.cam.ac.uk/data_request/cif (accessed on 30 August 2023). Powder diffraction data, NMR data and thermogravimetry analyses are included in the article or Supplementary Materials.

Acknowledgments

We thank Katrin Hoffmann and Katrin Steinke for measuring the NMR spectra, Ramona Oehme for the MS analyses and Manuela Roßberg for the CHN analyses.

Conflicts of Interest

The authors declare no conflict of interest.

References

  1. Hebbink, G.A.; Grave, L.; Woldering, L.A.; Reinhoudt, D.N.; van Veggel, F.C.J.M. Unexpected Sensitization Efficiency of the Near-Infrared Nd3+, Er3+, and Yb3+ Emission by Fluorescein Compared to Eosin and Erythrosin. J. Phys. Chem. A 2003, 107, 2483–2491. [Google Scholar] [CrossRef]
  2. Armelao, L.; Quici, S.; Barigelletti, F.; Accorsi, G.; Bottaro, G.; Cavazzini, M.; Tondello, E. Design of luminescent lanthanide complexes: From molecules to highly efficient photo-emitting materials. Coord. Chem. Rev. 2010, 254, 487–505. [Google Scholar] [CrossRef]
  3. Bünzli, J.-C.G.; Comby, S.; Chauvin, A.-S.; Vandevyver, C.D. New Opportunities for Lanthanide Luminescence. J. Rare Earth 2007, 25, 257–274. [Google Scholar] [CrossRef]
  4. Bettencourt-Dias, A. Lanthanide-based emitting materials in light-emitting diodes. Dalton Trans. 2007, 2007, 2229–2241. [Google Scholar] [CrossRef] [PubMed]
  5. Herrmann, W.A.; Anwander, R.; Denk, M. Lanthanoiden-Komplexe, III. Flüchtige Neodym- und Yttrium-Alkoxide mit neuen sperrigen Chelatliganden. Chem. Berichte 1992, 125, 2399–2405. [Google Scholar] [CrossRef]
  6. Aspinall, H.C.; Bickley, J.F.; Gaskell, J.M.; Jones, A.C.; Labat, G.; Chalker, P.R.; Williams, P.A. Precursors for MOCVD and ALD of rare earth oxides-complexes of the early lanthanides with a donor-functionalized alkoxide ligand. Inorg. Chem. 2007, 46, 5852–5860. [Google Scholar] [CrossRef]
  7. Weber, A.; Suhr, H. Thin lanthanum oxide and rare-earth oxide films by PECVD of β-diketonate chelate complexes. Mod. Phys. Lett. B 1989, 3, 1001–1008. [Google Scholar] [CrossRef]
  8. Lo Nigro, R.; Toro, R.G.; Malandrino, G.; Raineri, V.; Fragalà, I.L. A Simple Route to the Synthesis of Pr2O3 High-k Thin Films. Adv. Mater. 2003, 15, 1071–1075. [Google Scholar] [CrossRef]
  9. Chevalier, S.; Bonnet, G.; Larpin, J.P. Metal-organic chemical vapor deposition of Cr2O3 and Nd2O3 coatings. Oxide growth kinetics and characterization. Appl. Surf. Sci. 2000, 167, 125–133. [Google Scholar] [CrossRef]
  10. Holzschuh, H.; Oehr, C.; Suhr, H.; Weber, A. Thin Films of Barium, Yttrium, Europium, Erbium, and Copper Oxides Prepared by Plasma-Enhanced CVD. Mod. Phys. Lett. B 1988, 2, 1253–1257. [Google Scholar] [CrossRef]
  11. Drake, S.R.; Lyons, A.; Otway, D.J.; Slawin, A.M.Z.; Williams, D.J. Lanthanide β-diketonate glyme complexes exhibiting unusual coordination modes. J. Chem. Soc. Dalton 1993, 1993, 2379–2386. [Google Scholar] [CrossRef]
  12. Xu, G.; Wang, Z.-M.; He, Z.; Lü, Z.; Liao, C.-S.; Yan, C.-H. Synthesis and structural characterization of nonanuclear lanthanide complexes. Inorg. Chem. 2002, 41, 6802–6807. [Google Scholar] [CrossRef] [PubMed]
  13. Malandrino, G.; Fragalà, I.L. Lanthanide “second-generation” precursors for MOCVD applications: Effects of the metal ionic radius and polyether length on coordination spheres and mass-transport properties. Coord. Chem. Rev. 2006, 250, 1605–1620. [Google Scholar] [CrossRef]
  14. Richardson, M.F.; Wagner, W.F.; Sands, D.E. Rare-earth trishexafluoroacetylacetonates and related compounds. J. Inorg. Nucl. Chem. 1968, 30, 1275–1289. [Google Scholar] [CrossRef]
  15. Malandrino, G.; Bettinelli, M.; Speghini, A.; Fragalà, I.L. Europium “Second Generation” Precursors for Metal-Organic Chemical Vapor Deposition: Characterization and Optical Spectroscopy. Eur. J. Inorg. Chem. 2001, 2001, 1039–1044. [Google Scholar] [CrossRef]
  16. Bradley, D.C.; Chudzynska, H.; Hursthouse, M.B.; Motevalli, M.; Wu, R. Volatile fluorinated tertiary alkoxides of some lanthanides, tris-hexafluoro-tertiary butoxides of lanthanum, praseodymium and europium. Polyhedron 1994, 13, 7–14. [Google Scholar] [CrossRef]
  17. Malandrino, G.; Licata, R.; Castelli, F.; Fragala, I.L.; Benelli, C. New Thermally Stable and Highly Volatile Precursors for Lanthanum MOCVD: Synthesis and Characterization of Lanthanum β-Diketonate Glyme Complexes. Inorg. Chem. 1995, 34, 6233–6234. [Google Scholar] [CrossRef]
  18. Pollard, K.D.; Jenkins, H.A.; Puddephatt, R.J. Chemical Vapor Deposition of Cerium Oxide Using the Precursors [Ce(hfac)3(glyme)]. Chem. Mater. 2000, 12, 701–710. [Google Scholar] [CrossRef]
  19. Katagiri, S.; Tsukahara, Y.; Hasegawa, Y.; Wada, Y. Energy-Transfer Mechanism in Photoluminescent Terbium(III) Complexes Causing Their Temperature-Dependence. Bull. Chem. Soc. Jpn. 2007, 80, 1492–1503. [Google Scholar] [CrossRef]
  20. Baxter, I.; Drake, S.R.; Hursthouse, M.B.; Abdul Malik, K.M.; McAleese, J.; Otway, D.J.; Plakatouras, J.C. Effect of Polyether Ligands on Stabilities and Mass Transport Properties of a Series of Gadolinium(III) β-Diketonate Complexes. Inorg. Chem. 1995, 34, 1384–1394. [Google Scholar] [CrossRef]
  21. Ye, H.-Q.; Peng, Y.; Li, Z.; Wang, C.-C.; Zheng, Y.-X.; Motevalli, M.; Wyatt, P.B.; Gillin, W.P.; Hernández, I. Effect of Fluorination on the Radiative Properties of Er3+ Organic Complexes: An Opto-Structural Correlation Study. J. Phys. Chem. C 2013, 117, 23970–23975. [Google Scholar] [CrossRef]
  22. Valore, A.; Cariati, E.; Righetto, S.; Roberto, D.; Tessore, F.; Ugo, R.; Fragalà, I.L.; Fragalà, M.E.; Malandrino, G.; Angelis, F.; et al. Fluorinated β-diketonate diglyme lanthanide complexes as new second-order nonlinear optical chromophores: The role of f electrons in the dipolar and octupolar contribution to quadratic hyperpolarizability. J. Am. Chem. Soc. 2010, 132, 4966–4970. [Google Scholar] [CrossRef]
  23. Pirri, A.; Maksimov, R.N.; Li, J.; Vannini, M.; Toci, G. Achievements and Future Perspectives of the Trivalent Thulium-Ion-Doped Mixed-Sesquioxide Ceramics for Laser Applications. Materials 2022, 15, 2084. [Google Scholar] [CrossRef] [PubMed]
  24. McComb, T.S.; Sims, R.A.; Willis, C.C.C.; Kadwani, P.; Sudesh, V.; Shah, L.; Richardson, M. High-power widely tunable thulium fiber lasers. Appl. Opt. 2010, 49, 6236–6242. [Google Scholar] [CrossRef] [PubMed]
  25. Neumeier, J.J.; Dalichaouch, Y.; Ferreira, J.M.; Hake, R.R.; Lee, B.W.; Maple, M.B.; Torikachvili, M.S.; Yang, K.N.; Zhou, H. Thulium barium copper oxide: A 90-K superconductor with a potential 1-MG upper critical field. Appl. Phys. Lett. 1987, 51, 371–373. [Google Scholar] [CrossRef]
  26. Prokić, M. Development of highly sensitive CaSO4:Dy/Tm and MgB4O7:Dy/Tm sintered thermoluminescent dosimeters. Nucl. Instrum. Methods 1980, 175, 83–86. [Google Scholar] [CrossRef]
  27. Hsu, C.-T. Growth of ZnS:Tm thin films by MOCVD. J. Cryst. Growth 2000, 208, 259–263. [Google Scholar] [CrossRef]
  28. Hara, K.; Tominaga, S.; Takano, A.; Dantani, K.; Yoshino, J.; Kukimoto, H. Preparation of ZnS:Tm Films by Metalorganic Chemical Vapor Deposition Using Thulium β-Diketonates as Dopants. Jpn. J. Appl. Phys. 1992, 31, L1661. [Google Scholar] [CrossRef]
  29. Forissier, S.; Roussel, H.; Jimenez, C.; Chaix, O.; Pereira, A.; Bensalah-Ledoux, A.; Deschanvres, J.-L.; Moine, B. Thulium and ytterbium-doped titania thin films deposited by MOCVD. Energy Procedia 2011, 10, 192–196. [Google Scholar] [CrossRef]
  30. Pellegrino, A.L.; Cortelletti, P.; Pedroni, M.; Speghini, A.; Malandrino, G. Nanostructured CaF2:Ln3+ (Ln3+ = Yb3+/Er3+, Yb3+/Tm3+) Thin Films: MOCVD Fabrication and Their Upconversion Properties. Adv. Mater. Interfaces 2017, 4, 1700245. [Google Scholar] [CrossRef]
  31. Pellegrino, A.L.; La Manna, S.; Bartasyte, A.; Cortelletti, P.; Lucchini, G.; Speghini, A.; Malandrino, G. Upconverting tri-doped calcium fluoride-based thin films: A comparison of the MOCVD and sol–gel preparation methods. J. Mater. Chem. C 2020, 8, 3865–3877. [Google Scholar] [CrossRef]
  32. Murthy, K.S.R.; Anjaneyulu, Y. Thermogravimetric and Gas Chromatographic Studies on Fluorinated β-diketone Chelates of Lanthanides. World App. Sci. J. 2014, 32, 939–944. [Google Scholar]
  33. Fatila, E.M.; Hetherington, E.E.; Jennings, M.; Lough, A.J.; Preuss, K.E. Syntheses and crystal structures of anhydrous Ln(hfac)3(monoglyme). Ln = La, Ce, Pr, Sm, Eu, Gd, Tb, Dy, Er, Tm. Dalton Trans. 2012, 41, 1352–1362. [Google Scholar] [CrossRef] [PubMed]
  34. Matsubara, N.; Kuwamoto, T. Vapor pressures and enthalpies of sublimation and evaporation of trifluoroacetylacetonates in helium and helium containing the ligand vapor. Inorg. Chem. 1985, 24, 2697–2701. [Google Scholar] [CrossRef]
  35. Mullica, D.F.; Milligan, W.O.; Beall, G.W. Crystal structures of Pr(OH)3, Eu(OH)3 and Tm(OH)3. J. Inorg. Nucl. Chem. 1979, 41, 525–532. [Google Scholar] [CrossRef]
  36. Mestrelab Research SL. MestReNova Version 14.1.0-24037; Mestrelab Research SL: Santiago de Compostela, Spain, 2019. [Google Scholar]
  37. Harris, R.K.; Becker, E.D.; Cabral de Menezes, S.M.; Goodfellow, R.; Granger, P. NMR nomenclature. Nuclear spin properties and conventions for chemical shifts (IUPAC Recommendations 2001). Pure Appl. Chem. 2001, 73, 1795–1818. [Google Scholar] [CrossRef]
  38. NETZSCH-Gerätebau GmbH. Proteus Analysis Version 5.0.1; NETZSCH-Gerätebau GmbH: Selb, Germany, 2009. [Google Scholar]
  39. STOE & Cie GmbH. X-Area Version 1.70; STOE & Cie GmbH: Darmstadt, Germany, 2014. [Google Scholar]
  40. Sheldrick, G.M. A short history of SHELX. Acta Crystallogr. A 2008, 64, 112–122. [Google Scholar] [CrossRef]
  41. Farrugia, L.J. WinGX and ORTEP for Windows: An update. J. Appl. Crystallogr. 2012, 45, 849–854. [Google Scholar] [CrossRef]
  42. Brandenburg, K.; Putz, H. Diamond Version 3.2k; Crystal Impact: Bonn, Germany, 2014. [Google Scholar]
  43. Bruker AXS. TOPAS Version 5; Bruker AXS: Karlsruhe, Germany, 2014. [Google Scholar]
  44. Malandrino, G.; Benelli, C.; Castelli, F.; Fragalà, I.L. Synthesis, Characterization, Crystal Structure and Mass Transport Properties of Lanthanum β-Diketonate Glyme Complexes, Volatile Precursors for Metal−Organic Chemical Vapor Deposition Applications. Chem. Mater. 1998, 10, 3434–3444. [Google Scholar] [CrossRef]
  45. Kang, S.-J.; Jung, Y.S.; Suh, I.-H. Synthesis and Characterization of Thermally Stable Ln(hfa)3(monoglyme) (Ln = Ho, Y, hfa = hexafluoroacetylacetone) Complexes. Bull. Korean Chem. Soc. 1999, 20, 95–98. [Google Scholar]
  46. Alvarez, S.; Alemany, P.; Casanova, D.; Cirera, J.; Llunell, M.; Avnir, D. Shape maps and polyhedral interconversion paths in transition metal chemistry. Coord. Chem. Rev. 2005, 249, 1693–1708. [Google Scholar] [CrossRef]
  47. Van der Bondi, A. Waals Volumes and Radii. J. Phys. Chem. 1964, 68, 441–664. [Google Scholar] [CrossRef]
  48. Tan, R.H.C.; Motevalli, M.; Abrahams, I.; Wyatt, P.B.; Gillin, W.P. Quenching of IR luminescence of erbium, neodymium, and ytterbium β-diketonate complexes by ligand C-H and C-D bonds. J. Phys. Chem. B 2006, 110, 24476–24479. [Google Scholar] [CrossRef] [PubMed]
  49. Pell, A.J.; Pintacuda, G.; Grey, C.P. Paramagnetic NMR in solution and the solid state. Prog. Nucl. Magn. Reson. Spectrosc. 2019, 111, 1–271. [Google Scholar] [CrossRef]
  50. Meng, Q.; Witte, R.J.; May, P.S.; Berry, M.T. Photodissociation and Photoionization Mechanisms in Lanthanide-based Fluorinated β-Diketonate Metal−Organic Chemical-Vapor Deposition Precursors. Chem. Mater. 2009, 21, 5801–5808. [Google Scholar] [CrossRef]
  51. Talaga, D.S.; Hanna, S.D.; Zink, J.I. Luminescent Photofragments of (1,1,1,5,5,5-Hexafluoro-2,4-pentanedionato) Metal Complexes in the Gas Phase. Inorg. Chem. 1998, 37, 2880–2887. [Google Scholar] [CrossRef]
Scheme 1. Syntheses of the thulium acetylacetonate complexes 19.
Crystals 13 01467 sch001
Figure 1. Molecular structure of 1 (a), 2a (b), 3 (c) and 5 (d). Thulium and oxygen atoms are drawn as 50% probability ellipsoids; carbon and fluorine atoms are drawn as sticks; for disordered fluorine atoms, only the main component is shown; hydrogen atoms are omitted for clarity. Symmetry codes: (′) 1 − x, 1 − y, 1 − z.
Crystals 13 01467 g001
Figure 2. Molecular structure of 4. Thulium and oxygen atoms are drawn as 50% probability ellipsoids; carbon and fluorine atoms are drawn as sticks; for the disordered fluorine atoms, only the main component is shown; hydrogen atoms are omitted for clarity. Symmetry codes: (′) 1 − x, 1 − y, 1 − z.
Crystals 13 01467 g002
Figure 3. Molecular structure of 6. Thulium, chlorine and oxygen atoms are drawn as 50% probability ellipsoids; carbon and fluorine atoms are drawn as sticks; for the disordered fluorine atoms, only the main component is shown; hydrogen atoms are omitted for clarity.
Crystals 13 01467 g003
Figure 4. Molecular structure of 8. Thulium, chlorine, sodium and oxygen atoms are drawn as 50% probability ellipsoids; carbon and fluorine atoms are drawn as sticks; for the disordered fluorine atoms, only the main component is shown; hydrogen atoms are omitted for clarity. Symmetry codes: (′) 1 − x, −y, 2 − z.
Crystals 13 01467 g004
Figure 5. Fragments of the polymeric structure of 9. Thulium, sodium and oxygen atoms are drawn as 50% probability ellipsoids; carbon and fluorine atoms are drawn as sticks; for the disordered fluorine atoms, only the main component is shown; hydrogen atoms are omitted for clarity. Symmetry codes: (′) −x, y, 1/2 − z; (″) −1/2 + x, 3/2 − y, z; (‴) −1/2 − x, 3/2 − y, 1/2 − z.
Crystals 13 01467 g005
Figure 6. 19F NMR spectra for complexes 1, 2b, 3, 5, 6 and 7.
Crystals 13 01467 g006
Figure 7. 1H NMR spectra for 1, 2b, 3, 5, 6 and 7 in C6D6 at 400 MHz and 26 °C.
Crystals 13 01467 g007
Table 1. Crystal structure data of 14.
12a2b *34
formulaC30H28F18O14Tm2C15H16F9O8TmC21H30F9O11TmC15H7F18O8TmC24H12F30O16Tm2
molar mass M/g mol−11293.38664.21798.38826.141464.20
temperature/K200(2)180(2)180(2)120(2)180(2)
wavelength/pm71.073154.186154.186154.186154.186
crystal color and shapecolorless needlecolorless needlecolorless needlecolorless blockcolorless rod
crystal size/mm0.04·0.11·0.240.45·0.07·0.100.04·0.07·0.130.07·0.08·0.090.05·0.07·0.11
crystal systemtriclinictriclinicmonoclinictriclinictriclinic
space groupP 1 ¯ P 1 ¯ IcP 1 ¯ P 1 ¯
a/pm815.99(8)1018.69(4)1339.28(4)991.1(2)894.14(2)
b/pm1102.04(8)1022.57(4)1444.32(3)1153.6(2)1066.73(2)
c/pm1213.9(1)1273.97(4)1645.70(5)1229.0(2)1221.65(3)
α65.335(6)87.962(3)9067.931(9)69.838(2)
β72.933(8)74.854(3)108.453(2)73.717(9)88.985(2)
γ77.278(5)63.565(3)9076.073(9)74.814(2)
V/106 pm31019.9(2)1142.02(8)3019.7(2)1235.4(3)1052.23(4)
Z12421
calc. density/g cm−32.101.921.762.222.31
absorption coefficient µ/mm−14.478.336.498.439.56
θ range/°2.6–26.03.6–70.04.1–70 3.9–70.53.9–63.3
measured reflections722619,22224,65220,67114,741
independent reflections (Rint)3891 (0.0651)4245 (0.0296)4904 (0.0311)4584 (0.0290)3352 (0.0159)
observed reflections (I > 2σ(I))30253566452240163150
parameters296304401386345
R1 (observed reflections)0.04600.04960.02270.04290.0364
wR2 (all data)0.13460.13530.04800.11700.0952
max./min. residual e density/10−6 pm−31.0 and −1.61.0 and −0.80.3 and −0.41.7 and −1.21.2 and −0.9
CCDC no.22920752292076229207722920792292080
* Refined as inversion twin, ratio 0.538:0.462.
Table 2. Crystal structure data of 59.
568 *9
formulaC19H22F9O8TmC11H18Cl2F3O5TmC38H26Cl2F36Na2O16Tm2C20H4F24NaO8Tm
molar mass M/g mol−1718.29527.081877.331020.15
temperature/K180(2)180(2)200(2)200(2)
wavelength/pm154.186154.18671.07371.073
crystal color and shapecolorless blockcolorless blockcolorless octahedroncolorless rod
crystal size/mm0.09·0.10·0.110.10·0.11·0.120.16·0.17·0.180.08·0.16·0.25
crystal systemtriclinicmonoclinicmonoclinicmonoclinic
space groupP 1 ¯ P21/cP21/nI2/c
a/pm779.94(3)1549.44(4)1257.94(6)1425.46(10)
b/pm1056.03(3)1564.79(3)1905.95(8)1207.07(10)
c/pm1706.90(5)1513.08(4)1283.96(6)1802.92(13)
α73.210(3)909090
β79.121(3)100.365(2)95.772(4)94.749(6)
γ76.174(3)909090
V/106 pm31296.06(8)3608.7(2)3062.8(2)3091.5(4)
Z2824
calc. density/g cm−31.841.942.042.19
absorption coefficient µ/mm−17.4012.373.153.07
θ range/°4.4–702.9–70.52.3–25.82.2–27
measured reflections21,93333,84428,0179701
independent reflections (Rint)4759 (0.0213)6798 (0.0311)28,017 (0.0508)3367 (0.0313)
observed reflections (I > 2σ(I))42285344192012838
parameters337401426244
R1 (observed reflections)0.02950.03670.05580.0355
wR2 (all data)0.08060.08980.15540.0896
max./min. residual e density/10−6 pm−31.0 and −0.91.2 and −0.51.5 and −1.61.1 and −1.0
CCDC no.2292081229208222920832292084
* The structure of 8 was refined as twinned crystal (hklf5 data).
Table 3. Bond lengths/pm for the molecular structure of 19. (* bond distances of bridging oxygen or chlorine atoms; 1 first molecule in asymmetric unit; 2 second molecule in asymmetric unit).
12a2b34567 [33]89
Tm-O(keto)229.4(6)233.4(5)236.0(4)234.2(4)226.9(4)228.8(3)224.4(3) 1228.5(5)238.0(6)231.1(3)
222.9(7)230.2(5)231.8(3)226.7(4)230.2(4)228.8(3)220.4(3) 1228.7(5)230.3(7)233.7(3)
234.4(6)233.8(5)230.7(4)231.5(4)228.3(4)229.3(3)224.7(3) 2229.1(5)234.1(6)226.5(4)
227.0(6)225.9(5)227.4(4)231.9(4)237.2(4)228.9(3)220.6(3) 2229.5(5)232.0(6)236.5(3)
243.2(9) *232.6(4)231.7(4)234.1(4) 230.4(3) 230.5(5)231.3(6)
247.8(5) *231.4(5)229.(4)234.2(4) 226.8(2) 230.7(5)232.0(6)
232.5(6)
Tm-O(H2O)232.6(5)235.7(4)233.6(4)233.7(4)235.2(4)
233.1(4)238.6(4)231.2(4)237.2(4)
Tm-O(DME) 243.4(3) 2.396(6)
246.9(3) 2.431(6)
Tm-O(tfa) 226.9(4)
238.5(4)
Tm-O(diglyme) 239.7(3) 1
237.8(3) 1
239.8(4) 1
240.5(4) 2
238.8(3) 2
240.3(4) 2
Tm-Cl 256.0(2) 1 220.9(5) *
257.4(2) 1 221.9(5) *
255.9(2) 2
256.1(2) 2
Na-O(keto) 257.1(7)258.8(3)
260.7(8)255.1(3)
271.7(7)271.4(3)
Na-O(DME) 233.2(9)
233.0(8)
Na-Cl 225.1(6)
Na-F 277.7(4)
294.5(4)
Table 4. Summary of the thermal analysis data for 1, 3, 5 and 7.
1
[Tm(tfaa)3(H2O)]2
3
[Tm(hfaa)3(H2O)2]
5
[Tm(tfaa)3(DME)]
7
[Tm(hfaa)3(DME)]
Isothermal thermogravimetric analysis at 100 °C
Mass loss within 3 h/%0.281.372.804.4
Calculated Tm transport rate/nmol cm−3 min−1417-91
Thermogravimetric analysis up to 600 °C
Melting point/°C1221208569 (lit.: 71–72) [33]
Total experimental mass loss/%58.089.565.397.5
Calculated 1 experimental mass loss/%65.072.668.674.4
Thermolysis productTmF3TmF3TmF3TmF3
Sublimation experiment at 100 °C in vacuo for 2 h
Residue in starting zone1 with traces of decomposition products3 with traces of decomposition productsDecomposition products onlyPure 7
Sublimation productPure 1 according to NMR spectra, but different crystal structurePure 3DME and decomposition products onlyPure 7
1 for complete thermolysis to TmF3.
Disclaimer/Publisher’s Note: The statements, opinions and data contained in all publications are solely those of the individual author(s) and contributor(s) and not of MDPI and/or the editor(s). MDPI and/or the editor(s) disclaim responsibility for any injury to people or property resulting from any ideas, methods, instructions or products referred to in the content.

