Abstract
One of the challenges for azobenzene-based materials in fabricating rewritable surface relief gratings is the long response time in the procedure of holographic recording, making it inefficient in real-time applications. In this study, a small molecule azobenzene compound with a facile fabrication route is presented. By a total recording intensity of 200 mW/cm2, a surface relief grating with the modulation depth of 758 nm can be formed in 5 min. The ±1st order diffraction was observed immediately after the holographic recording, and the ±2nd order diffraction was produced in two seconds. Such a short response time makes it possible for use in real-time applications.
1. Introduction
Azobenzene-based materials have long been designed and developed for applications in holographic storage [1,2,3] and 3D image display [4]. Due to the essence of repeatable photoisomerization in the cis-trans molecular interconversion, they are advantageous in fabricating rewritable surface relief gratings (SRGs) [5]. However, such forms of data recording or erasing processes generally take a long illumination time with a high optical power [6], making azobenzene-based materials inefficient in real-time applications.
The azobenzene-based compound consists of the azobenzene and the matrix material. The side-chain polymers [7] are widely used as the matrix materials. However, the cross-linked matrix might make a restrained environment for photoisomerization [8,9]. The chain entanglement might further produce a hindrance in the procedure of making the SRGs [10]. It generally takes a long illumination time and a high illumination power to form a grating with a low modulation depth [6]. Meanwhile, the bonding between the azobenzene and the matrix can be categorized into three types: covalent bonding, ionic bonding, and hydrogen bonding [9]. The force of hydrogen bonding is relatively weak. The weak connection between the azobenzene and the matrix might lead to a long illumination time for making the SRGs [11]. It seems that a matrix with a small molecule weight and a strong bonding force between the azobenzene and the matrix can reduce the illumination time or illumination power. H. Nakano et al. presented a couple of azobenzene materials, such as BFlAB and BBMAB [12]. The molecule weights of their matrixes were relatively low. The bonding type between the azobenzene and the matrix was covalent bonding. For the BFlAB amorphous film, an SRG with a modulation depth of 470 nm could be formed in 10 min. For the BBMAB amorphous film, the SRG with a modulation depth of 90–100 nm could be formed in 2 min.
In this study, the bis(3-aminopropyl)amine (BAA) with a molecule weight of only 131.22 g/mol was selected as the matrix material. The small molecule weight of the matrix makes it possible to reduce the illumination time for making the SRG. The bounding type between the azobenzene and the matrix is ionic bounding. There are two functional groups in BAA. Compared to those using one functional group to sustain the connection with the azobenzene, it supplies more opportunities in the reaction of photoisomerization, making it more desirable to form a surface relief grating with a large modulation depth. An SRG with a modulation depth of 758 nm could be formed in 5 min. The manufacturing process is simple and can be performed by a one-shot procedure [13,14,15].
2. Materials and Methods
2.1. Materials and synthesis
Figure 1a presents the chemical structure of MR and BAA and Figure 1b presents the ionic bonding process between MR and BAA, depicting the molecule structures used to form the azobenzene-based compound. The molecular weight of azobenzene (2-{[4-(dimethylamino)phenyl]diazenyl} benzoic acid (methyl red, MR)), which is 269.30 g/mol, was utilized to perform the reaction of photoisomerization. All the materials in this work were purchased from Sigma-Aldrich (St. Louis, Missouri, United States) and used as received. The bis(3-aminopropyl)amine (BAA) with a molecule weight of 131.22 g/mol was chosen as the matrix material.
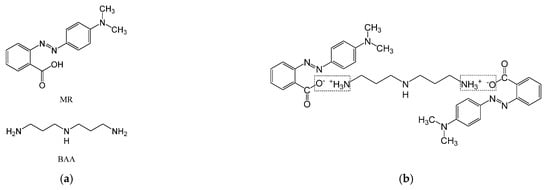
Figure 1.
(a) The chemical structure of MR and BAA. (b) Ionic bonding process between MR and BAA.
The carboxylic group -COOH can be deprotonated in the protic solvent and turned into a carboxylate anion -COO−. On the other hand, the amino functional group -NH2 can be protonated in the protic solvent and turned into a positive ion -NH3+. When a proton exchange reaction occurred in the protic solvent, an ionic bond between the carboxylate anion and the protonated amino group was formed [16,17,18,19,20,21]. Hence, two MR molecules can be bonded to one BAA molecule, as illustrated in Figure 1a, which presents the chemical structure of MR and BAA, and Figure 1b, which represents the ionic bonding process between MR and BAA. Such chemical characteristics were analyzed by the Fourier transform infrared spectroscopy (FTIR) and the 1H nuclear magnetic resonance spectroscopy (1H NMR), as illustrated in Section 3.1.
A colorless solution was obtained by mixing BAA (0.061 g) with an appropriate quantity of methanol (5.35 g) in an ultrasonic oscillator. With the additive of MR (0.243 g, molar ratio of BAA/MR = 1/2), the mixture turned rapidly from colorless to orange. Followed by evaporation at 40 °C for 2 days, undesired impurities and precipitates were removed by a PTFE syringe filter. The viscous extraction was then uniformly spin-coated onto a quartz glass substrate (2.5 cm × 2.5 cm × 0.1 cm). After the process of desiccation in vacuum, the MR–BAA compound in the form of a thin film was obtained.
2.2. Optical Characterization
The surface relief grating was formed by the process of holographic recording onto the MR–BAA compound. Figure 2 shows the setup for the holographic recording and reading. In the recording procedure, a DPSS 532 nm laser (with a linear polarization normal to the figure plane) was used as the light source. The laser beam with a power of 30 mW in a profile of the Gaussian distribution was divided by the beam splitter into two parts. The power density of each part was approximately 100 mW/cm2. These two beams interfered with each other in the MR–BAA compound, and a surface relief grating was produced. The angle between the 2 beams was about 7°, resulting in a grating with a period of 4.35 µm. To evaluate the performance of diffraction, a He-Ne laser with an incident power of 10mW was employed for the holographic reading. A power meter from Thorlabs (Model PM100D) was used to identify the diffracted power. The diffraction efficiency of the nth order was obtained by the ratio of Pd/Pt, where Pd is the power of the nth order diffracted power and Pt is the power of the incident beam.
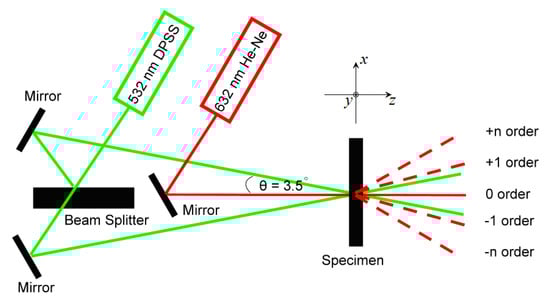
Figure 2.
Optical setup for the MR–BAA inscription.
An atomic force microscopy (AFM) from Veeco Digital Instrument (Model D3100) was used to measure the surface profile of the SRG.
3. Results and Discussions
3.1. Ionic bonding formation
The 1H nuclear magnetic resonance spectroscopy (1H NMR) from Jeol (Model ECZ600R) was employed to identify the compounds. The specimens were dissolved in deuterated solvent CDCl3. In the section of Supplementary Materials S2, 1H NMR, spectra for MR, BAA, and MR–BAA compound with chemical shifts in ppm on the horizontal axis are presented. Figure 3a shows a close-up view for characteristic shifts represented for the terminal amine (CH2NH2) in BAA and for those in the MR–BAA compound. The terminal amine (CH2NH2) in MR–BAA was protonated. The protons in the methylene group adjacent to the terminal amine were situated in a de-shielded chemical environment. Consequently, a downfield displacement with peak broadening was presented in the NMR spectrum of MR–BAA [11,22]. Figure 3b shows a characteristic shift at 14.3 ppm represented for the carboxylic acid (COOH) in MR. Such a shift could not be detected in the 1H NMR spectrum of MR–BAA. It illustrates that the carboxylic acid (COOH) in MR was deprotonated.
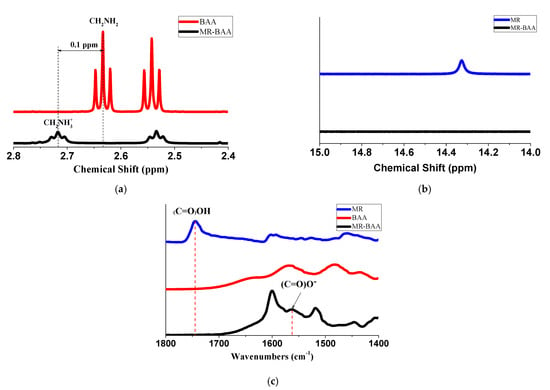
Figure 3.
(a) 1H NMR spectra of the methylene group attached to the terminal amine groups; (b) 1H NMR spectra of the carboxylate group; and (c) FTIR spectra in the range of the carbonyl and carboxylate groups.
The Fourier transform infrared spectroscopy (FTIR) from Bruker (Model T-27) was utilized to determine the bonding type. The inspected specimens were preprocessed by KBr pellet method. A detail illustration of FTIR spectra for MR, BAA, and MR–BAA compound are shown in the section of Supplementary Materials S1. Figure 3c shows a close-up view of the spectra of carbonyl (C=O) and carboxylate (C=O)O− groups. In the spectrum obtained from MR, the signal peak at 1743 cm−1 represented for the carboxylic group was detected. Such a peak vanished in the spectrum of the MR–BAA compound, and, instead, a peak at 1560 cm−1 was detected. It indicates that the (C=O)OH group was deprotonated in the MR–BAA compound, and, instead, the ionic bonding between (COO)−(NH3+) was formed [11,22,23,24].
3.2. Bonding Stability
The bonding stabilities of MR, BAA, and MR–BAA compound were investigated via the thermal gravimetric analyzer (TGA, from TA Instruments, Model Q50, New Castle, DE, USA). Figure 4a illustrates their TGA curves. MR is a solid compound with a melting point at 180 °C. As shown in Figure 4a, it starts to degrade at 205 °C. By contrast, BAA is a liquid compound with a boiling point at 151 °C. Mass losses of 5 and 15 wt% could be observed at 120 °C and 180 °C, respectively. The mass loss of MR–BAA was situated between those of MR and BAA. Evidently, the intermolecular force in the MR–BAA compound was stronger than that in BAA and weaker than that in MR. It starts to decompose at 125 °C and the decomposition procedure carries on until about 450 °C.
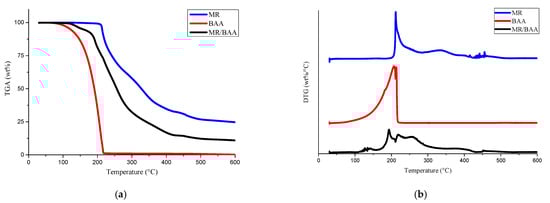
Figure 4.
(a) Thermogravimetric analysis (TGA) curves for MR, BAA, and MR–BAA compounds, and (b) the first derivative of the TGA curves (i.e., DTA curves).
Figure 4b shows the first derivative of the TGA curves. For the curve of MR, an upward peak at 210 °C is presented. Such kinds of peaks can always be observed in aromatic compounds [25,26]. On the other hand, for the MR–BAA compound, distinguishable peaks at 190 and 220 °C can be observed, implying that the bonding in the MR–BAA compound starts to break at 190 °C.
3.3. Surface Relief Grating Morphology and Diffraction Efficiency
A couple of MR–BAA compounds in the form of thin films were made using the method described in Section 2.1. A film analyzer from N&K Technology (Model 1280) (San Jose, CA, USA) was employed to identify their thicknesses. They ranged from 750 nm to 900 nm. With the setup illustrated in Figure 2, one of the MR–BAA compounds was illuminated in the interference of the DPSS laser, and a surface relief grating was fabricated. In the procedure of the SRG fabrication, the He-Ne laser was employed to perform the diffraction measurements. Figure 5a shows the diffraction efficiencies for all diffraction orders at various illumination time. A close-up view of the various orders (except for the zero order) is illustrated in Figure 5b. The diffraction efficiencies of all the orders rose with increasing the recording time and were finally saturated with specific values. In general, the formation of SRGs is accomplished when the diffraction efficiency of the highest order no longer increases with increasing the recording time. In our setup, the highest diffraction order was n = ±9, with a diffraction angle as high as ±75°. It was saturated in 5 min, implying that the surface relief grating was formed in 5 min. However, the molecule weight of the matrix was low, making the SRG sensitive to thermal disturbances. The SRG was heated by the illumination of the DPSS laser, resulting in a diffraction fluctuation to each order. The more heat accumulated in the compound, the more disturbances to the diffracted intensities. One solution to cope with this problem was simply shutting down the illumination power, waiting for a while until the heat being released, and then illuminating the same interference again in a short time interval. The grating could be reshaped. Figure 5c shows an appearance of the diffraction from the reshaped grating, in which the intensities of the +nth order and −nth order were approximately the same.
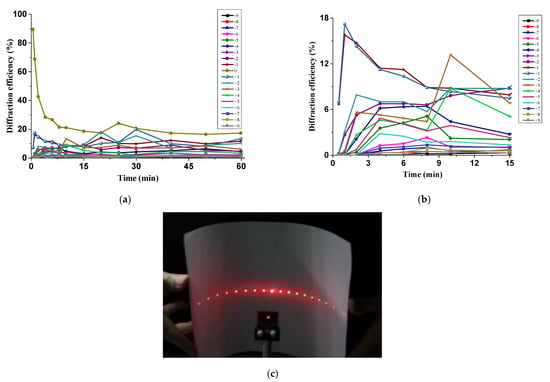
Figure 5.
(a) Diffraction measurements for the surface relief grating at various recording time. (b) A close-up view for (a). (c) An appearance of diffractions from the reshaped surface relief grating.
The file “Holographic Inscrption.mp4” in the Supplementary Materials illustrates the diffractions produced from another SRG. A flat screen instead of the power meters was utilized to evaluate the diffraction performance. Some high order diffractions were outside the screen because their diffracted angles were too large. The absorption coefficient of the MR–BAA compound at 532 nm was larger than that at 632.8 nm. Hence, the diffracted intensity of the He-Ne laser was higher that of the DPSS laser. In the procedure of diffraction measurements, the ±1st order diffraction was observed immediately after the holographic recording. Subsequently, the ±2nd order diffraction was produced in two seconds. As described in S2, in the Supplementary Materials, there is the implication that an SRG with a modulation depth approximately 60 nm was formed in 2 s. The fast response time made it a promising device in real-time applications.
In the S2 Section, we further show that intensities of high order diffractions might be higher than those of low order diffractions. Such behavior could be observed in the video, with the recording time of more than 2 min. Meanwhile, the intensity of the +nth order diffraction was always larger than that of the –nth one. It indicates that the grating’s surface profile in each period was not symmetric. The reason was mainly the result of the MR–BAA compound that was posited with a slight tilt and not perfectly normal to the interfered illumination.
A MR–BAA compound with a thickness of approximately 762 nm was employed for the holographic recording. With an illumination time of 6 min, a surface relief grating was formed. Figure 6a shows the surface profile detected by the atomic force microscopy. Its 1D profile distribution is shown in Figure 6b. The modulation depth was approximately 758 nm.
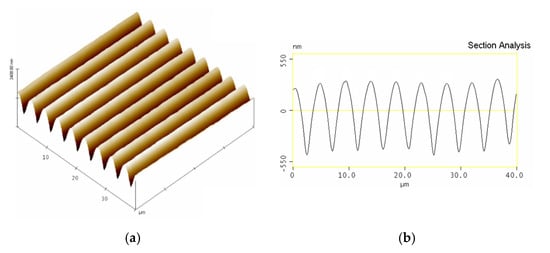
Figure 6.
AFM analysis of MR–BAA with topological (a) and cross-sectional (b) profiles.
3.4. Comments
A comparison of various azobenzene compounds with their film thicknesses (L) and corresponding surface relief gratings with their modulation depths (ΔL) is depicted in Table 1. The bonding type between the azobenzene and the matrix, molecular weight (MW), total illuminating power density (I), and fabrication time (T) are listed as well. In Table 1, Th is used to denote the recording time when the intensity of the highest order diffraction was turned from the increment into a status of insignificant changes. In our experiments, Th was approximately 5 min, and the modulation depth ΔL was approximately 758 nm.

Table 1.
A list of SRGs made of various azobenzene compounds with the featured parameters.
The SRG that formed from the MR–BAA compound was sensitive to thermal disturbances. The more the heat accumulated in the compound, the greater the uncertainty surrounding the attainment of the desired SRG. Consequently, with the power density 100 mW/cm2 for each beam, it is suggested that the formation of SRGs is accomplished in 5–6 min. On the other hand, the high sensitivity in the thermal disturbance further provides a convenient way to reshape (or erase) the SRGs. An example of this is illustrated in Figure 5c.
In the procedure of the holographic recording, a slight tilt of the MR–BAA compound might make the grating’s surface profile in one period not symmetric. As shown in “Holographic Inscrption.mp4”, the diffraction pattern presented a higher intensity on the right side. Further studies on the asymmetric diffraction caused by the tilted holographic inscription are needed. It might provide a convenient way to fabricate a blazed transmission grating.
One limitation is that the MR–BAA compound is a salt. The MR–BAA compound is highly likely be surrounded by the dissociated hydroxide or hydrogen ions from the moisture, thus becoming a hydrated complex molecule. This hydrated complex molecule is still embedded in the MR–BAA compound and, to a certain degree, produces some negative effects during the formation process of surface relief gratings. For example, the photoisomerization could be constrained since the hydrated complex MR–BAA molecule would no longer be efficiently photo-responsive.
4. Conclusions
An MR–BAA compound with a facile fabrication method was presented to form the surface relief grating by means of a holographic recording. Its chemical characteristics were analyzed by the Fourier transform infrared spectroscopy (FTIR) and the 1H nuclear magnetic resonance spectroscopy (1H NMR). The bonding stability was examined via the thermal gravimetric analyzer. The challenge of the crosslinked matrix, such as entanglements in the side-chain polymers does not occur in the matrix BAA. There are two MR molecules bonded to one BAA molecule. Compared to those using one functional group to sustain the connection with the azobenzene, it provides more opportunities in the reaction of photoisomerization. The SRG with a modulation depth of 758 nm could be formed in 5 min. The ±1st order diffraction was observed immediately after the holographic recording, and the ±2nd order diffraction was produced in two seconds. The fast response time makes it a promising device in real-time applications. However, it was sensitive to thermal disturbance. The limitations of the MR–BAA compound are described in Section 3.4.
Supplementary Materials
The following are available online at https://www.mdpi.com/article/10.3390/cryst12030397/s1, Figure S1: Full 1H-NMR spectrum from 0 ppm to 15 ppm, Figure S2. Full FTIR spectrum from 400 cm−1 to 4000 cm−1, Table S1: A list of SRGs made of various azobenzene compounds with the featured parameters. “Reference [1] is cited in the supplementary materials”.
Author Contributions
Conceptualization, W.-H.S., T.-C.H. and F.-Y.L.; data curation, L.-Y.W.; funding acquisition, W.-H.S.; investigation, T.-C.H., L.-Y.W. and F.-Y.L.; project administration, W.-H.S.; supervision, W.-H.S.; writing—original draft, F.-Y.L.; writing—review and editing, W.-H.S., T.-C.H. All authors have read and agreed to the published version of the manuscript.
Funding
This research was funded by the Ministry of Science and Technology, Taiwan (MOST) (109-2221-E-110-070-MY3).
Institutional Review Board Statement
Not applicable.
Informed Consent Statement
Not applicable.
Data Availability Statement
Not applicable.
Acknowledgments
We are grateful for the financial support from the MOST grant.
Conflicts of Interest
The authors declare no conflict of interest.
References
- Daisuke, S.; Kenji, H.; Daisuke, B.; Takashi, F. Chemical Etching Using KOH Aqueous Solution for Corona-Charge Micropatterning of Soda-Lime Glass. Jpn. J. Appl. Phys. 2013, 52, 036701. [Google Scholar]
- Jiang, X.L.; Li, L.; Kumar, J.; Kim, D.Y.; Tripathy, S.K. Unusual Polarization Dependent Optical Erasure of Surface Relief Gratings on Azobenzene Polymer Films. Appl. Phys. Lett. 1998, 72, 2502–2504. [Google Scholar] [CrossRef]
- Várhegyi, P.; Kerekes, Á.; Sajti, S.; Ujhelyi, F.; Koppa, P.; Szarvas, G.; Lőrincz, E. Saturation Effect in Azobenzene Polymers Used for Polarization Holography. Appl. Phys. A 2003, 76, 397–402. [Google Scholar]
- Zhou, P.; Li, Y.; Li, X.; Liu, S.; Su, Y. Holographic Display and Storage Based on Photo-Responsive Liquid Crystals. Liq. Cryst. Rev. 2016, 4, 83–100. [Google Scholar] [CrossRef]
- Yager, K.G.; Barrett, C.J. All-Optical Patterning of Azo Polymer Films. Curr. Opin. Solid State Mater. Sci. 2001, 5, 487–494. [Google Scholar] [CrossRef]
- Sakhno, O.; Goldenberg, L.; Wegener, M.; Stumpe, J. Deep Surface Relief Grating in Azobenzene-Containing Materials Using a Low-Intensity 532 Nm Laser. Opt. Mater. X 2019, 1, 100006. [Google Scholar] [CrossRef]
- Natansohn, A.; Rochon, P. Photoinduced Motions in Azo-Containing Polymers. Chem. Rev. 2002, 102, 4139–4176. [Google Scholar] [CrossRef]
- Ueda, M.; Kim, H.B.; Ikeda, T.; Ichimura, K. Photoisomerization of an Azobenzene in Sol-Gel Glass Films. Chem. Mater. 1992, 4, 1229–1233. [Google Scholar] [CrossRef]
- Vapaavuori, J.; Bazuin, C.G.; Priimagi, A. Supramolecular Design Principles for Efficient Photoresponsive polymer–azobenzene Complexes. J. Mater. Chem. C 2018, 6, 2168–2188. [Google Scholar] [CrossRef] [Green Version]
- Kijima, M.; Se, K.; Fujimoto, T. Photochemical Isomerization of p,p′-bis(chloromethyl)azobenzene Incorporated in poly(tertiary aminostyrene)s by Cross Linkage. Polymer 1992, 33, 2402–2407. [Google Scholar] [CrossRef]
- Wang, X.; Vapaavuori, J.; Wang, X.X.; Sabat, R.G.; Pellerin, C.; Bazuin, C.G. Influence of Supramolecular Interaction Type on Photoresponsive Azopolymer Complexes: A Surface Relief Grating Formation Study. Macromolecules 2016, 49, 4923–4934. [Google Scholar] [CrossRef]
- Nakano, H.; Takahashi, T.; Kadota, T.; Shirota, Y. Formation of a Surface Relief Grating Using a Novel Azobenzene-Based Photochromic Amorphous Molecular Material. J. Adv. Mater. 2002, 14, 1157–1160. [Google Scholar] [CrossRef]
- Kulikovska, O.; Goldenberg, L.; Kulikovsky, L.; Stumpe, J. Smart Ionic Sol−Gel-Based Azobenzene Materials for Optical Generation of Microstructures. Chem. Mater. 2008, 20, 3528–3534. [Google Scholar] [CrossRef]
- Kulikovska, O.; Goldenberg, L.M.; Stumpe, J. Supramolecular Azobenzene-Based Materials for Optical Generation of Microstructures. Chem. Mater. 2007, 19, 3343–3348. [Google Scholar] [CrossRef]
- Kulikovsky, L.; Kulikovska, O.; Goldenberg, L.; Stumpe, J. Phenomenology of Photoinduced Processes in the Ionic Sol−Gel-Based Azobenzene Materials. ACS Appl. Mater. Interfaces 2009, 1, 1739–1746. [Google Scholar] [CrossRef]
- Livingston, R.; Pariser, R. The Chlorophyll-Sensitized Photoöxidation of Phenylhydrazine by Methyl Red. II. Reactivity of the Several Forms of Methyl Red1. J. Am. Chem. Soc. 1948, 70, 1510–1515. [Google Scholar] [CrossRef]
- Negi, A.S.; Anand, S.C. A Textbook of Physical Chemistry; Wiley Eastern: New Delhi, India, 1985; p. 584. [Google Scholar]
- Ramette, R.W.; Kelly, P.W.; Dratz, E.A. Acid-Base Equilibria of Methyl Red. J Phys Chem-Us 1962, 66, 527–532. [Google Scholar] [CrossRef]
- Atkins, P.W.; De Paula, J. Elements of Physical Chemistry, 5th ed.; Oxford University Press: Oxford, NY, USA, 2009; p. 185. [Google Scholar]
- Tobey, S.W. The Acid Dissociation Constant of Methyl Red. A Spectrophotometric Measurement. J. Chem. Educ. 1958, 35, 514. [Google Scholar] [CrossRef]
- Zhang, J.-H.; Liu, Q.; Chen, Y.-M.; Liu, Z.-Q.; Xu, C.-W. Determination of Acid Dissociation Constant of Methyl Red by Multi-Peaks Gaussian Fitting Method Based on UV-Visible Absorption Spectrum. Acta Phys.-Chim. Sin. 2012, 28, 1030–1036. [Google Scholar]
- Hernández-Ainsa, S.; Alcalá, R.; Barberá, J.; Marcos, M.; Sánchez, C.; Serrano, J.L. Ionic Photoresponsive Azo-Codendrimer With Room Temperature Mesomorphism and High Photoinduced Optical Anisotropy. Macromol. 2010, 43, 2660–2663. [Google Scholar] [CrossRef]
- Kaur, G.; Jain, S.; Tiwary, A.K. Investigations on microbially triggered system for colon delivery of budesonide. Asian J. Pharm. Sci. 2010, 5, 96–105. [Google Scholar]
- Yuen, S.-M.; Ma, C.-C.M.; Chiang, C.-L.; Teng, C.-C. Morphology and Properties of Aminosilane Grafted MWCNT/Polyimide Nanocomposites. J. Nanomater. 2008, 2008, 1–15. [Google Scholar] [CrossRef] [Green Version]
- Mohamed, M.M.; Adel, E.-D. Structural, thermal, spectroscopic, and spectral dispersion studies of nanocrystalline methyl red thin films. Japanese. Int. J. Appl. Phys. 2018, 57, 042401. [Google Scholar]
- Tian, Y.; Wang, G.; Li, F.; EvansD, G. Synthesis and Thermo-Optical Stability of O-Methyl Red-Intercalated Ni–Fe Layered Double Hydroxide Material. Mater. Lett. 2007, 61, 1662–1666. [Google Scholar] [CrossRef]
- Nedelchev, L.; Mateev, G.; Strijkova, V.; Salgueiriño, V.; Schmool, D.S.; Berberova-Buhova, N.; Stoykova, E.; Nazarova, D. Tunable Polarization and Surface Relief Holographic Gratings in Azopolymer Nanocomposites with Incorporated Goethite (α-FeOOH) Nanorods. Photonics 2021, 8, 306. [Google Scholar] [CrossRef]
- Nakano, H.; Tanino, T.; Takahashi, T.; Ando, H.; Shirota, Y. Relationship between molecular structure and photoinduced surface relief grating formation using azobenzene-based photochromic amorphous molecular materials. J. Mater. Chem. 2008, 18, 242–246. [Google Scholar] [CrossRef]
- Goldenberg, L.M.; Kulikovsky, L.; Kulikovska, O.; Tomczyk, J.; Stumpe, J. Thin Layers of Low Molecular Azobenzene Materials With Effective Light-Induced Mass Transport. Langmuir 2010, 26, 2214–2217. [Google Scholar] [CrossRef]
- Zarins, E.; Balodis, K.; Ruduss, A.; Kokars, V.; Ozols, A.; Augustovs, P.; Saharovs, D. Molecular glasses of azobenzene for holographic data storage applications. Opt. Mater. 2018, 79, 45–52. [Google Scholar] [CrossRef]
- Priimagi, A.; Lindfors, K.; Kaivola, M.; Rochon, P. Efficient Surface-Relief Gratings in Hydrogen-Bonded Polymer−Azobenzene Complexes. ACS Appl. Mater. Interfaces 2009, 1, 1183–1189. [Google Scholar] [CrossRef]
- Vapaavuori, J.; Priimagi, A.; Kaivola, M. Photoinduced Surface-Relief Gratings in Films of Supramolecular polymer–bisazobenzene Complexes. J. Mater. Chem. 2010, 20, 5260–5264. [Google Scholar] [CrossRef]
- Koskela, J.E.; Vapaavuori, J.; Ras, R.H.A.; Priimagi, A. Light-Driven Surface Patterning of Supramolecular Polymers With Extremely Low Concentration of Photoactive Molecules. ACS Macro Lett. 2014, 3, 1196–1200. [Google Scholar]
- Sobolewska, A.; Bartkiewicz, S.; Priimagi, A. High-Modulation-Depth Surface Relief Gratings Using s–s Polarization Configuration in Supramolecular Polymer–Azobenzene Complexes. J. Phys. Chem. C 2014, 118, 23279–23284. [Google Scholar] [CrossRef]
- Zhang, Q.; Wang, X.; Barrett, C.J.; Bazuin, C.G. Spacer-Free Ionic Dye−Polyelectrolyte Complexes: Influence of Molecular Structure on Liquid Crystal Order and Photoinduced Motion. Chem. Mater. 2009, 21, 3216–3227. [Google Scholar] [CrossRef]
Publisher’s Note: MDPI stays neutral with regard to jurisdictional claims in published maps and institutional affiliations. |
© 2022 by the authors. Licensee MDPI, Basel, Switzerland. This article is an open access article distributed under the terms and conditions of the Creative Commons Attribution (CC BY) license (https://creativecommons.org/licenses/by/4.0/).