3.1. Number and Size of Inclusions
The chemical compositions of the 55SiCr steels are shown in
Table 3.
The T.O and [Al]s contents increased from 0.0016 wt.% to 0.0023 wt.% and from 0.0012 wt.% to 0.0015 wt.%, respectively, as the content of Al2O3 increased from 3 wt.% to 12 wt.%. In contrast, the T.O content decreased from 0.0020 wt.% to 0.0015 wt.% as the basicity increased from 0.5 to 1.2.
The number and size distribution of inclusions in the 1
#~7
# steel samples is shown in
Table 4. Obviously, the quantity density gradually increased from 8.81 to 8.96, while the percentage of inclusions with sizes smaller than 5 μm increased from 61% to 77% with increasing Al
2O
3. In contrast, the quantity density gradually decreased from 8.92 to 8.54, while the percentage of inclusions with a size smaller than 5 μm decreased from 76% to 55% as the basicity increased.
The size distribution of the inclusions in the 1
#~7
# steel samples is shown in
Table 5. For the 1
#~4
# samples with different Al
2O
3 contents, the percentage of inclusions with a diameter larger than 10 μm decreased from 13% to 4%. In contrast, the percentage of inclusions with a diameter smaller than 2 μm increased from 20% to 33%. For the 2
#, 5
#, 6
# and 7
# samples with different basicities, the percentage of inclusions with a diameter larger than 10 μm increased from 6% to 19%. In contrast, the percentage of inclusions with a diameter smaller than 2 μm increased from 31% to 17%.
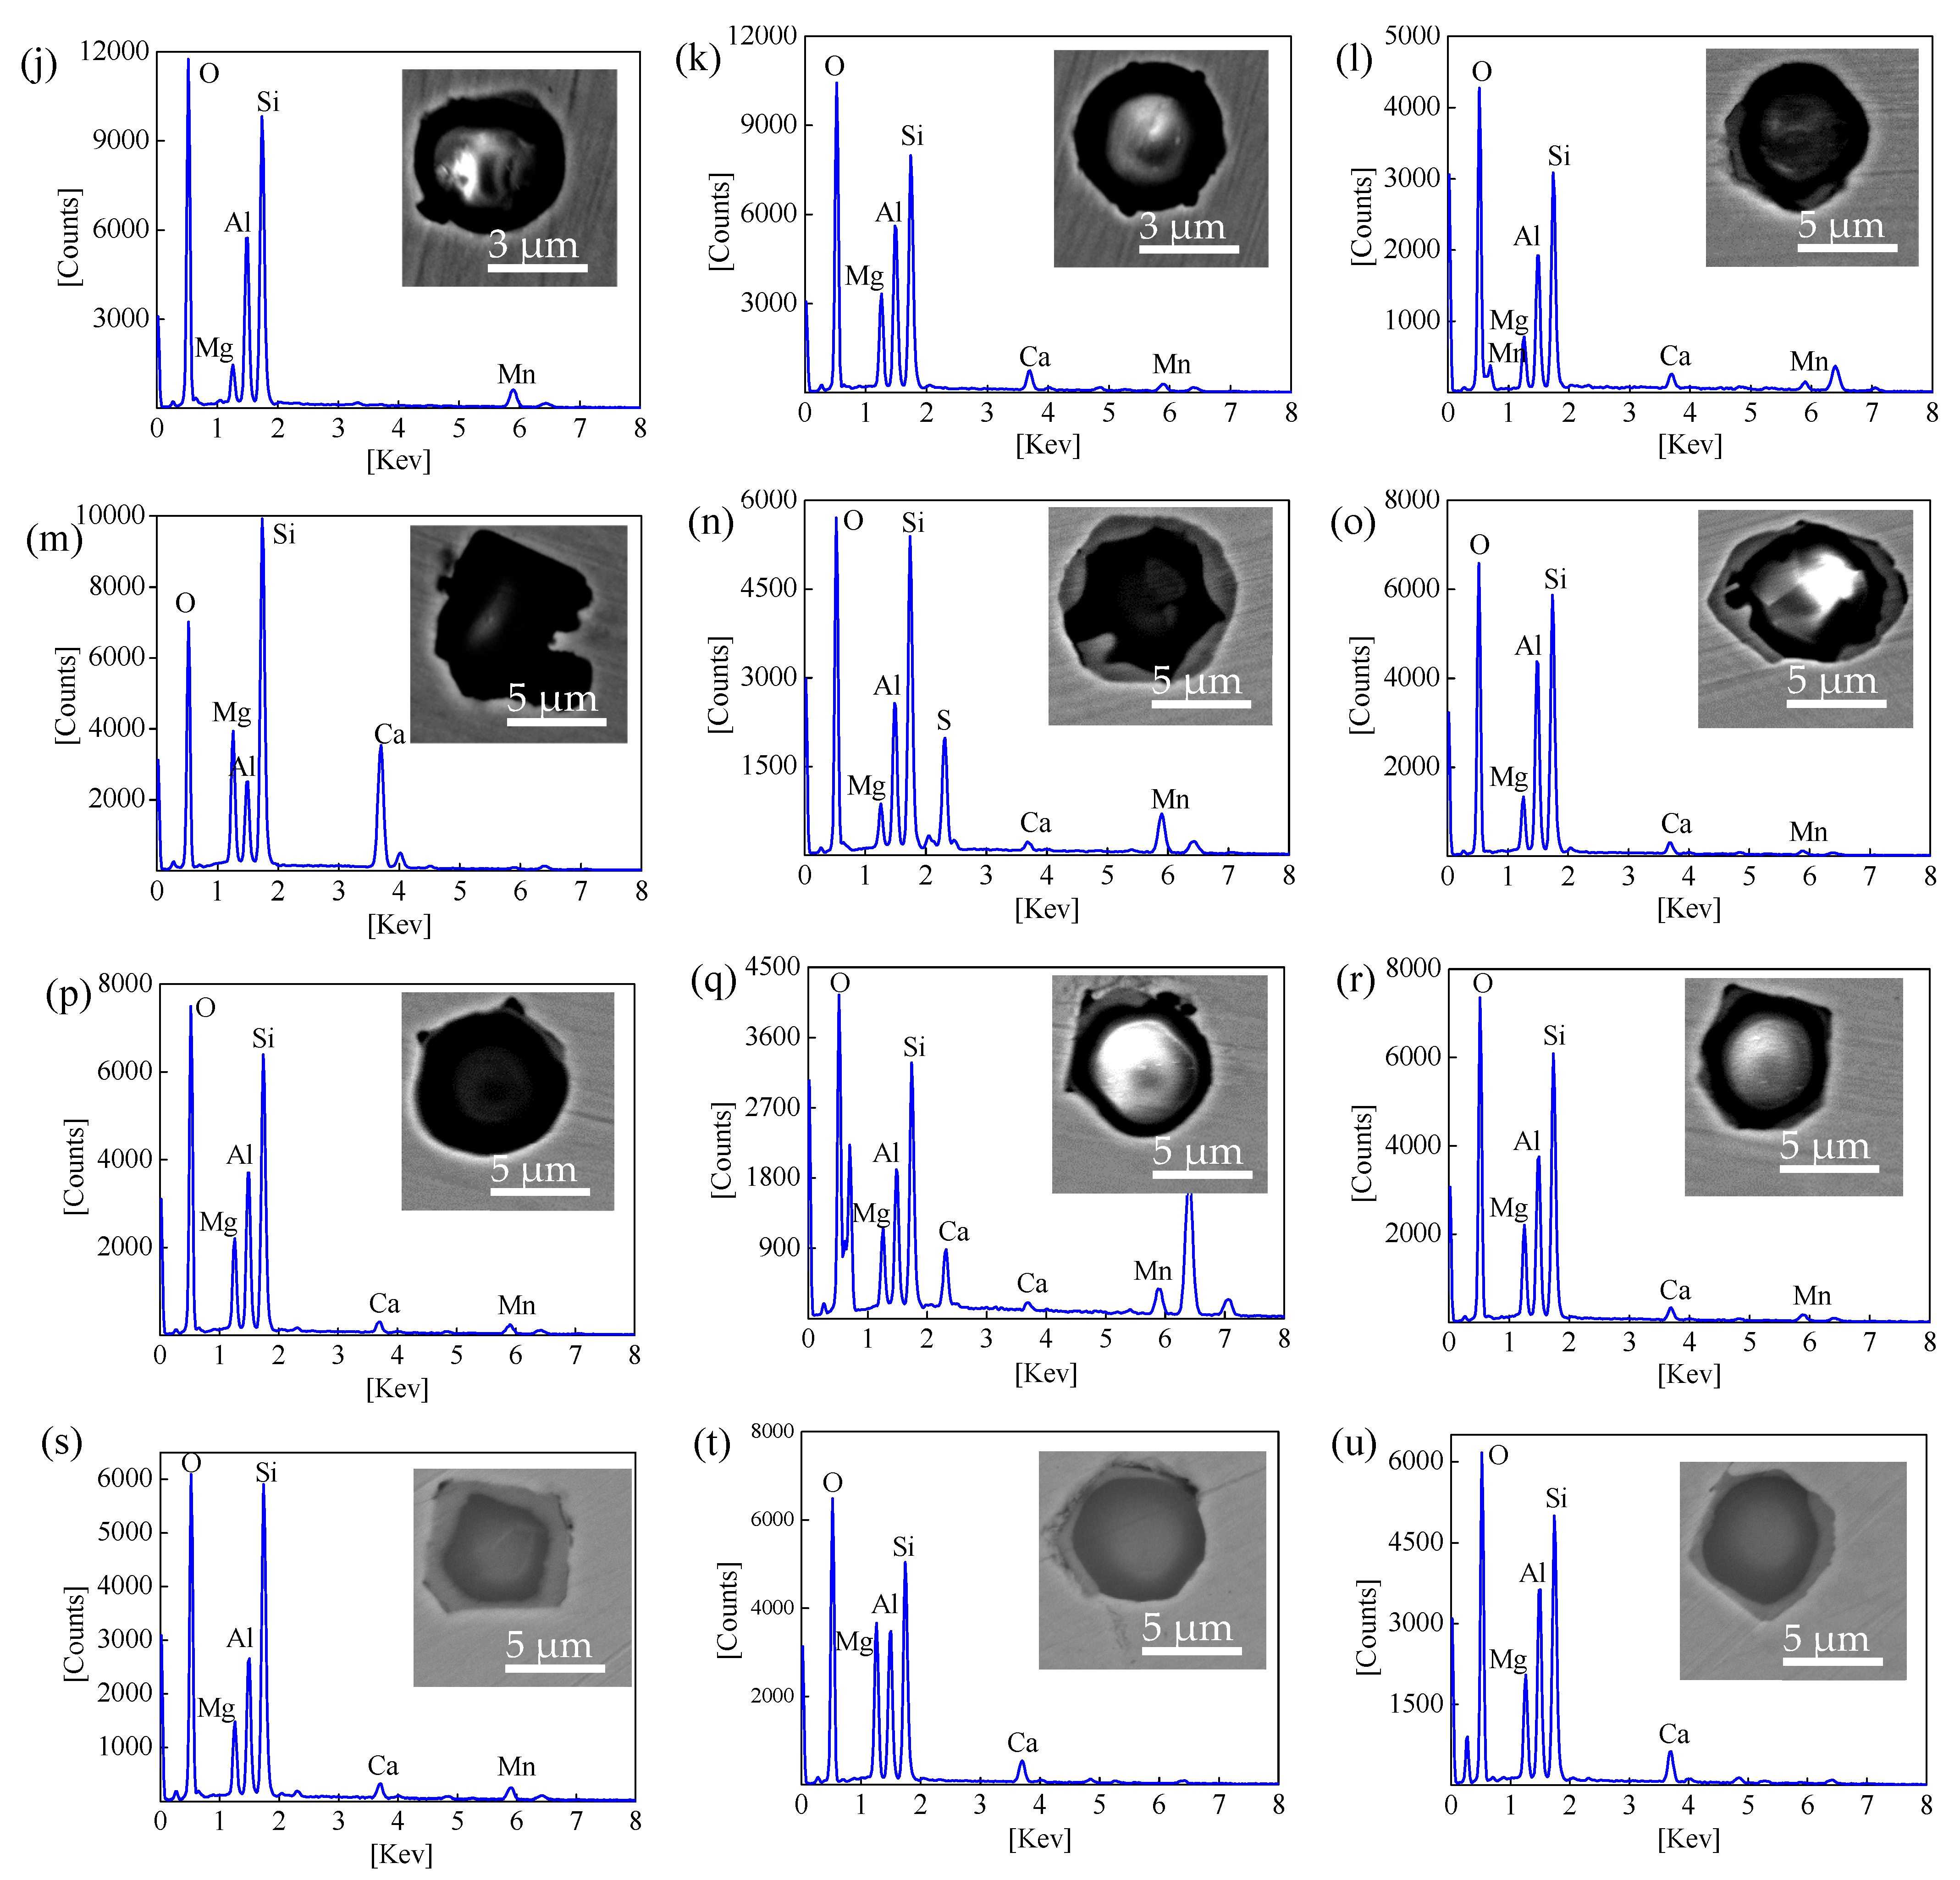
3.2. Composition and Morphology of Typical Inclusions
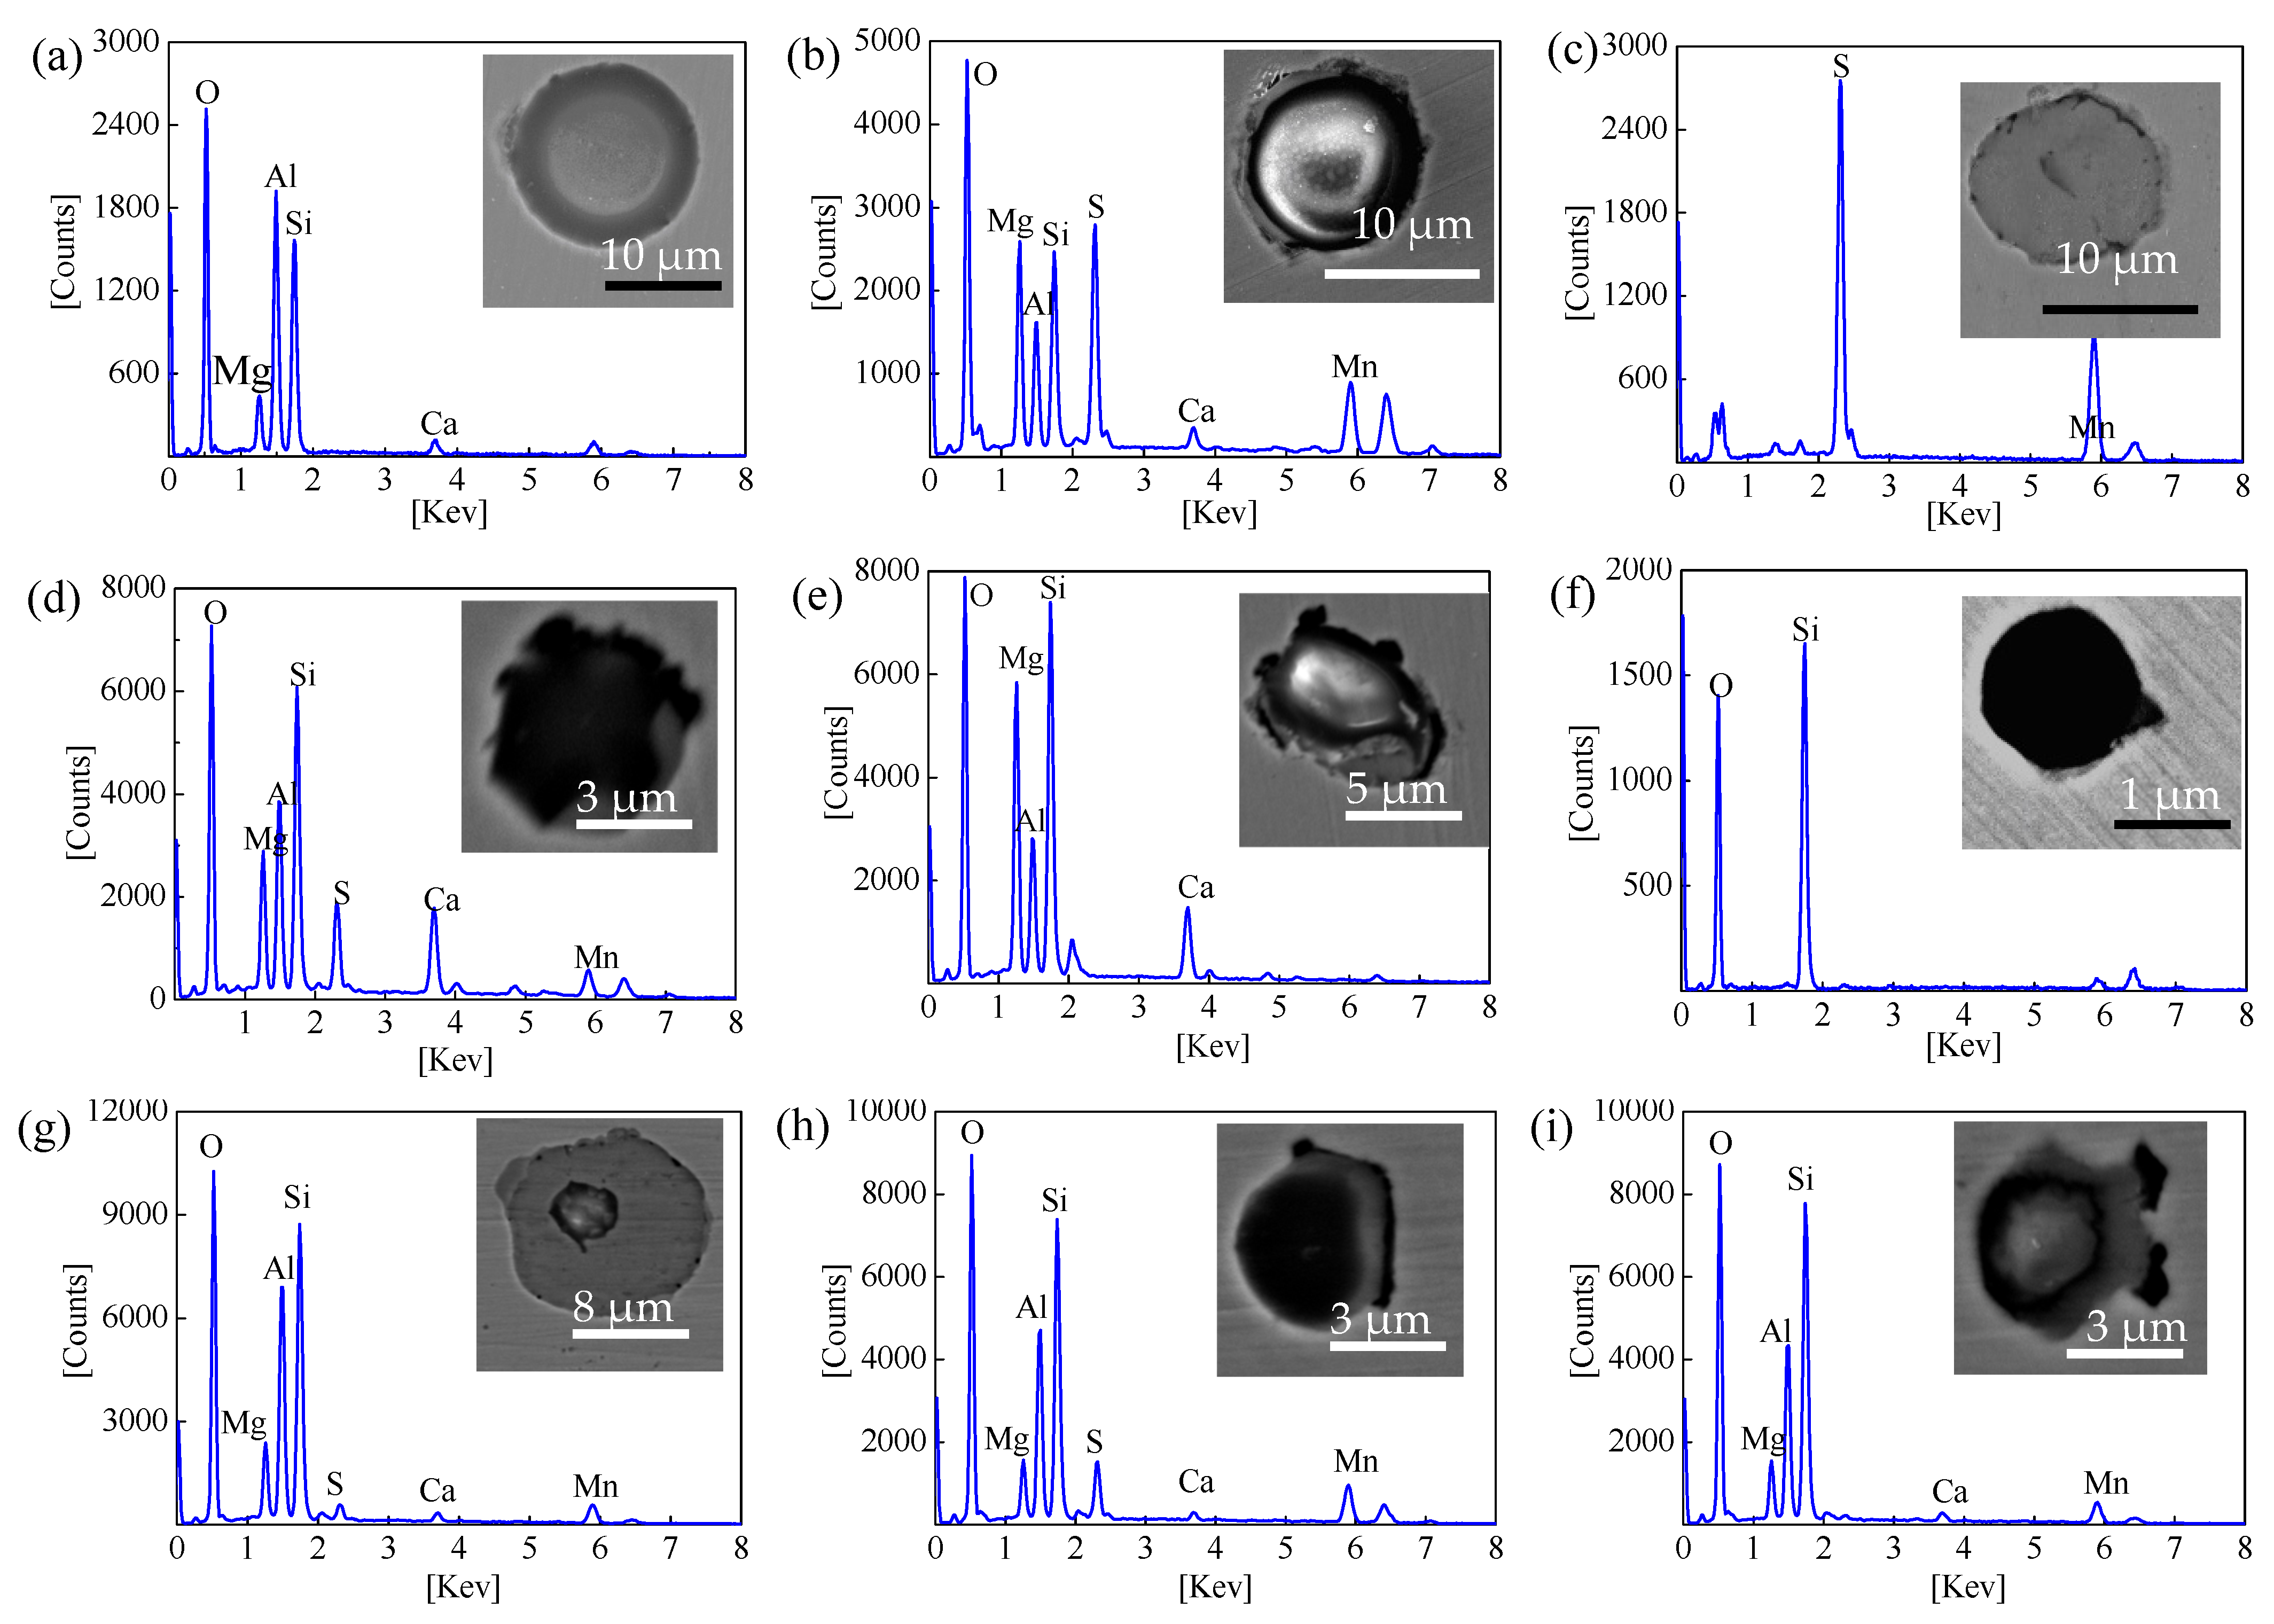
SEM-EDS was selected to analyze the composition and morphology of the inclusions. Several randomly selected inclusions were tested and analyzed regarding the composition of the inclusions. The mapping method of typical composite inclusions was carried out to accurately analyze the elemental distribution and structure of the structural inclusions. According to the results, four kinds of typical inclusions were observed in the steel samples, namely, CaO–SiO
2–Al
2O
3–MgO, CaO–SiO
2–Al
2O
3–MgO–MnS, MnS, and SiO
2, as shown in
Figure 4.
Most of the compounds contained oxide inclusions, especially the CaO–SiO2–Al2O3–MgO inclusions with a diameter of 10 μm. The MnS inclusions generally formed during solidification with a diameter larger than 5 μm. In contrast, the SiO2 inclusions had a smaller diameter of approximately 1 μm.
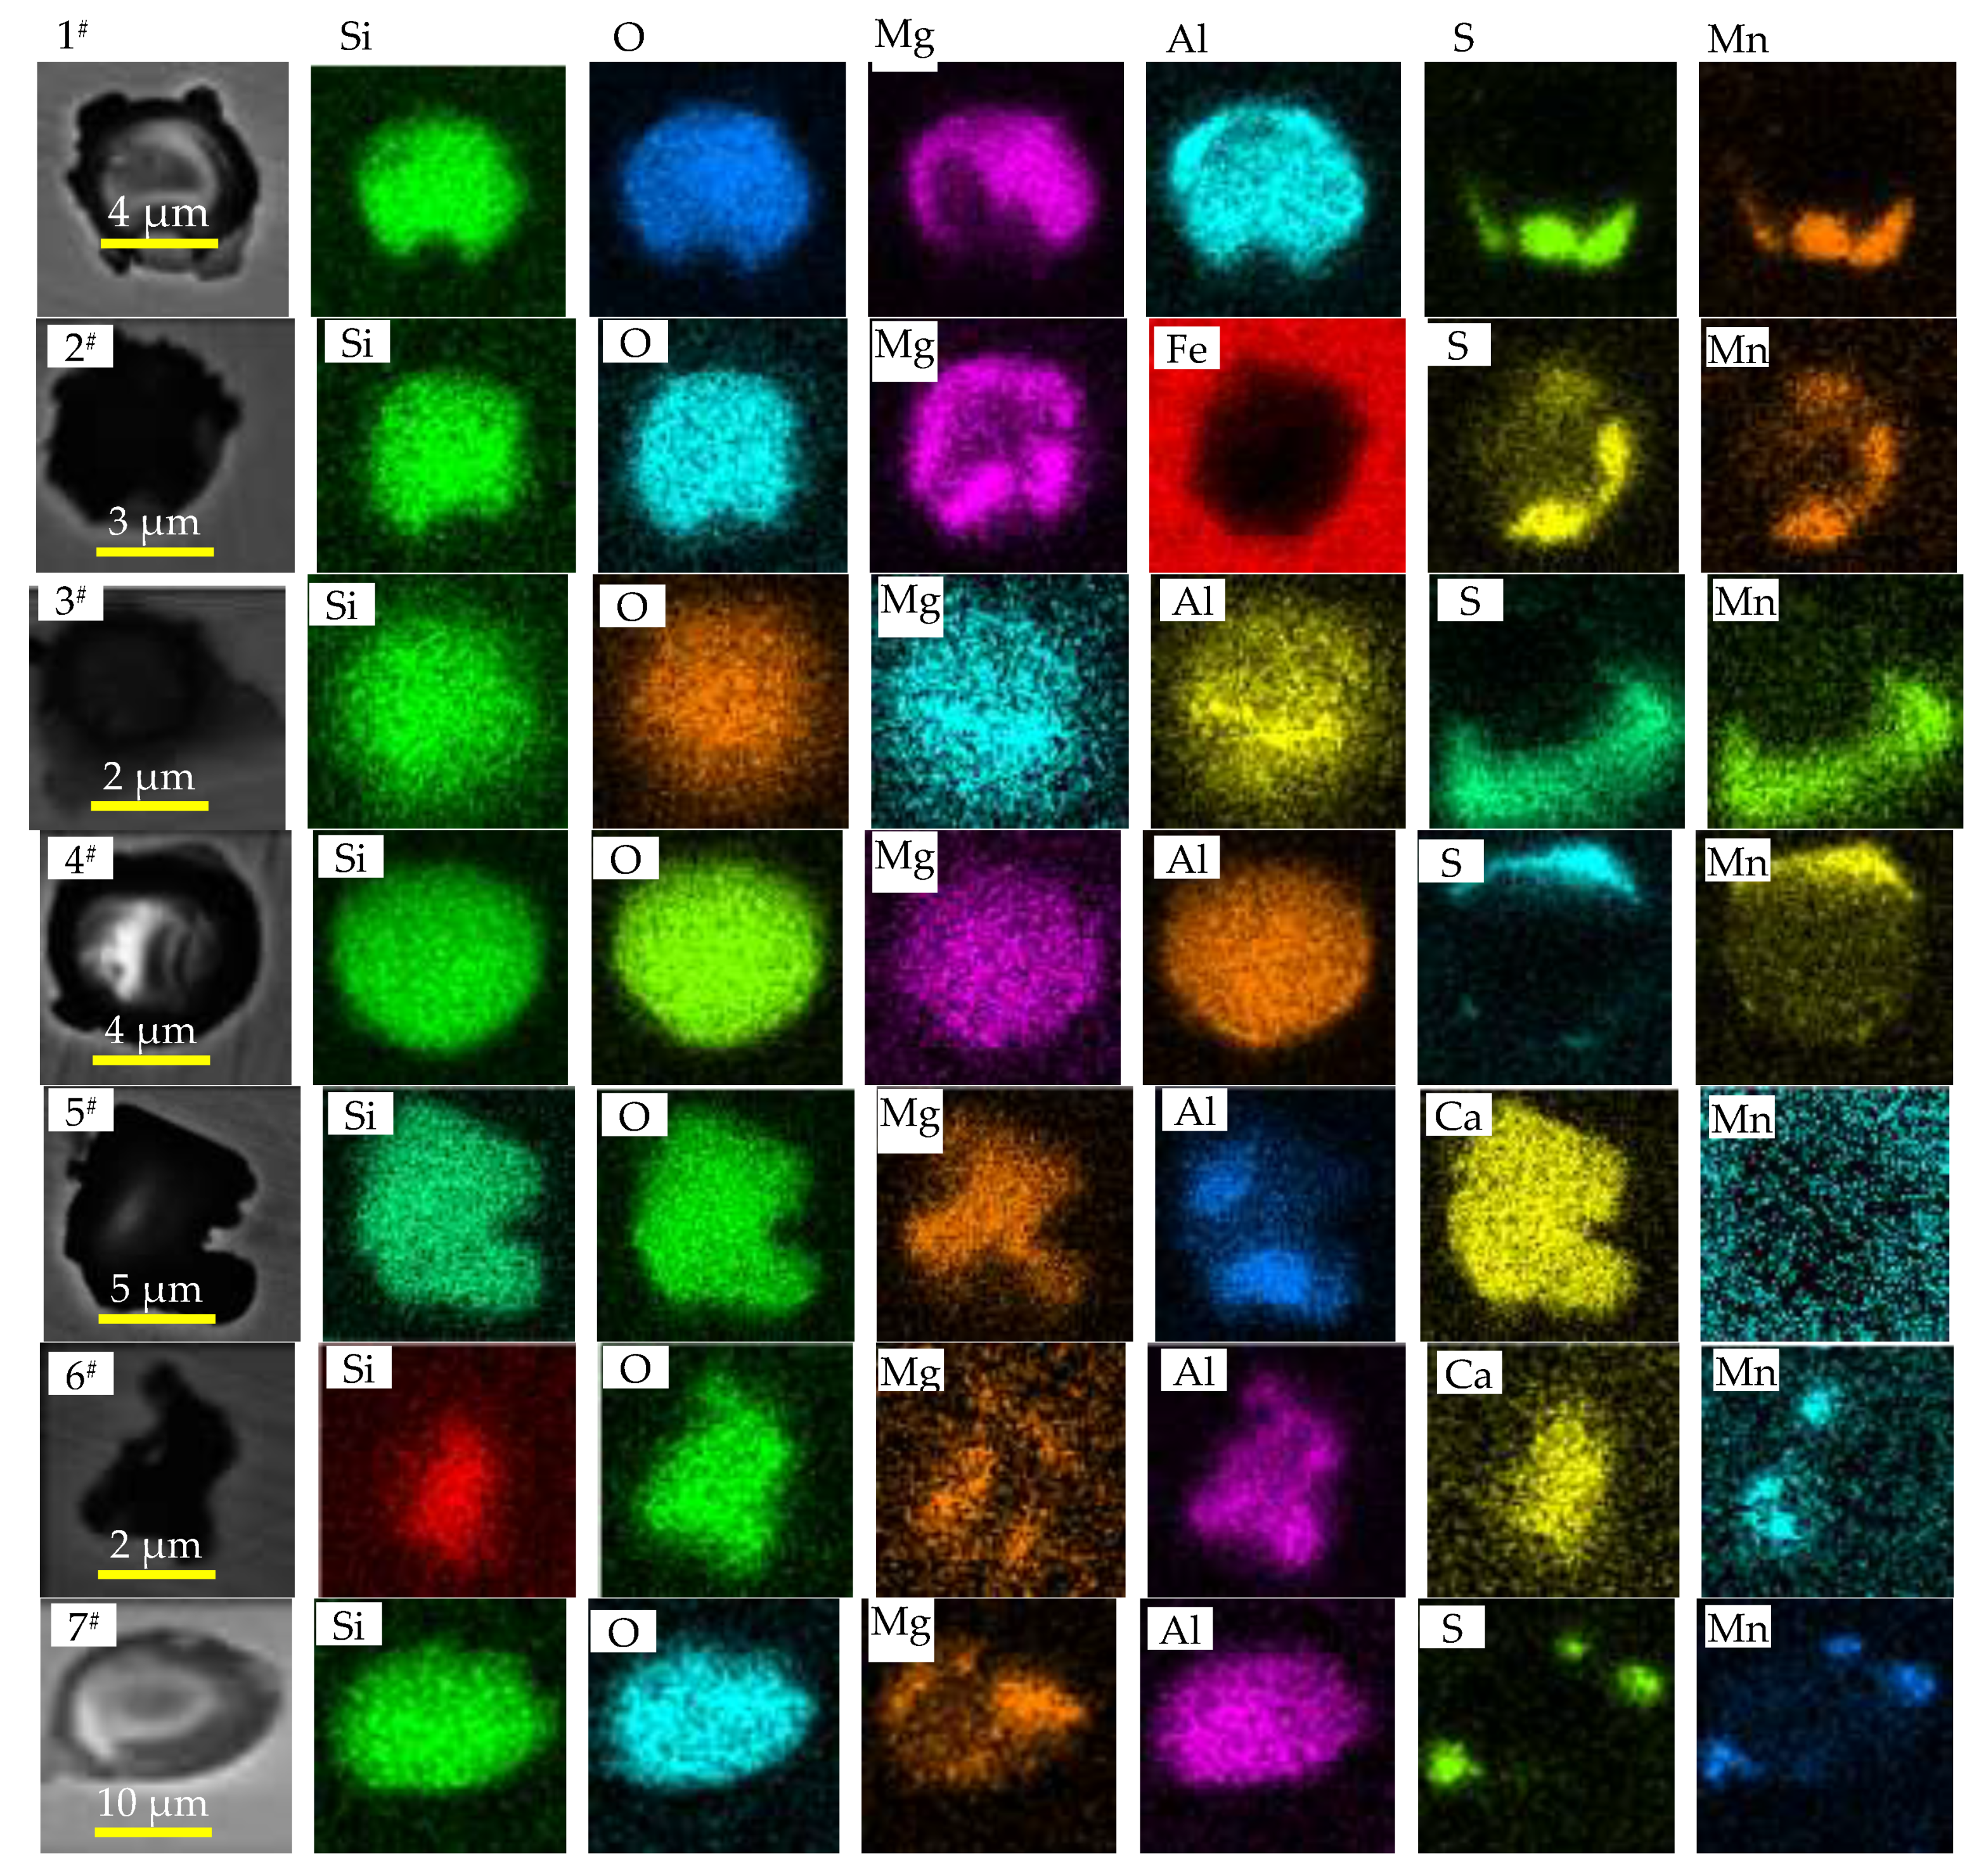
The multi-component composite inclusions were generally uniform; that is, the elements in the inclusions were evenly distributed in the whole inclusion without delamination, as shown in
Figure 5. Generally, these inclusions would not cause obvious harm to spring steel. In addition, the structure of the layered composite inclusions was usually a homogeneous composite with a layer of MnS inclusions wrapped around the edges. This kind of inclusion will be separated during the hot rolling and cold drawing of spring steel due to the composition and plasticity of the inner and outer layers being different; they would appear as long strips along the rolling direction or drawing direction.
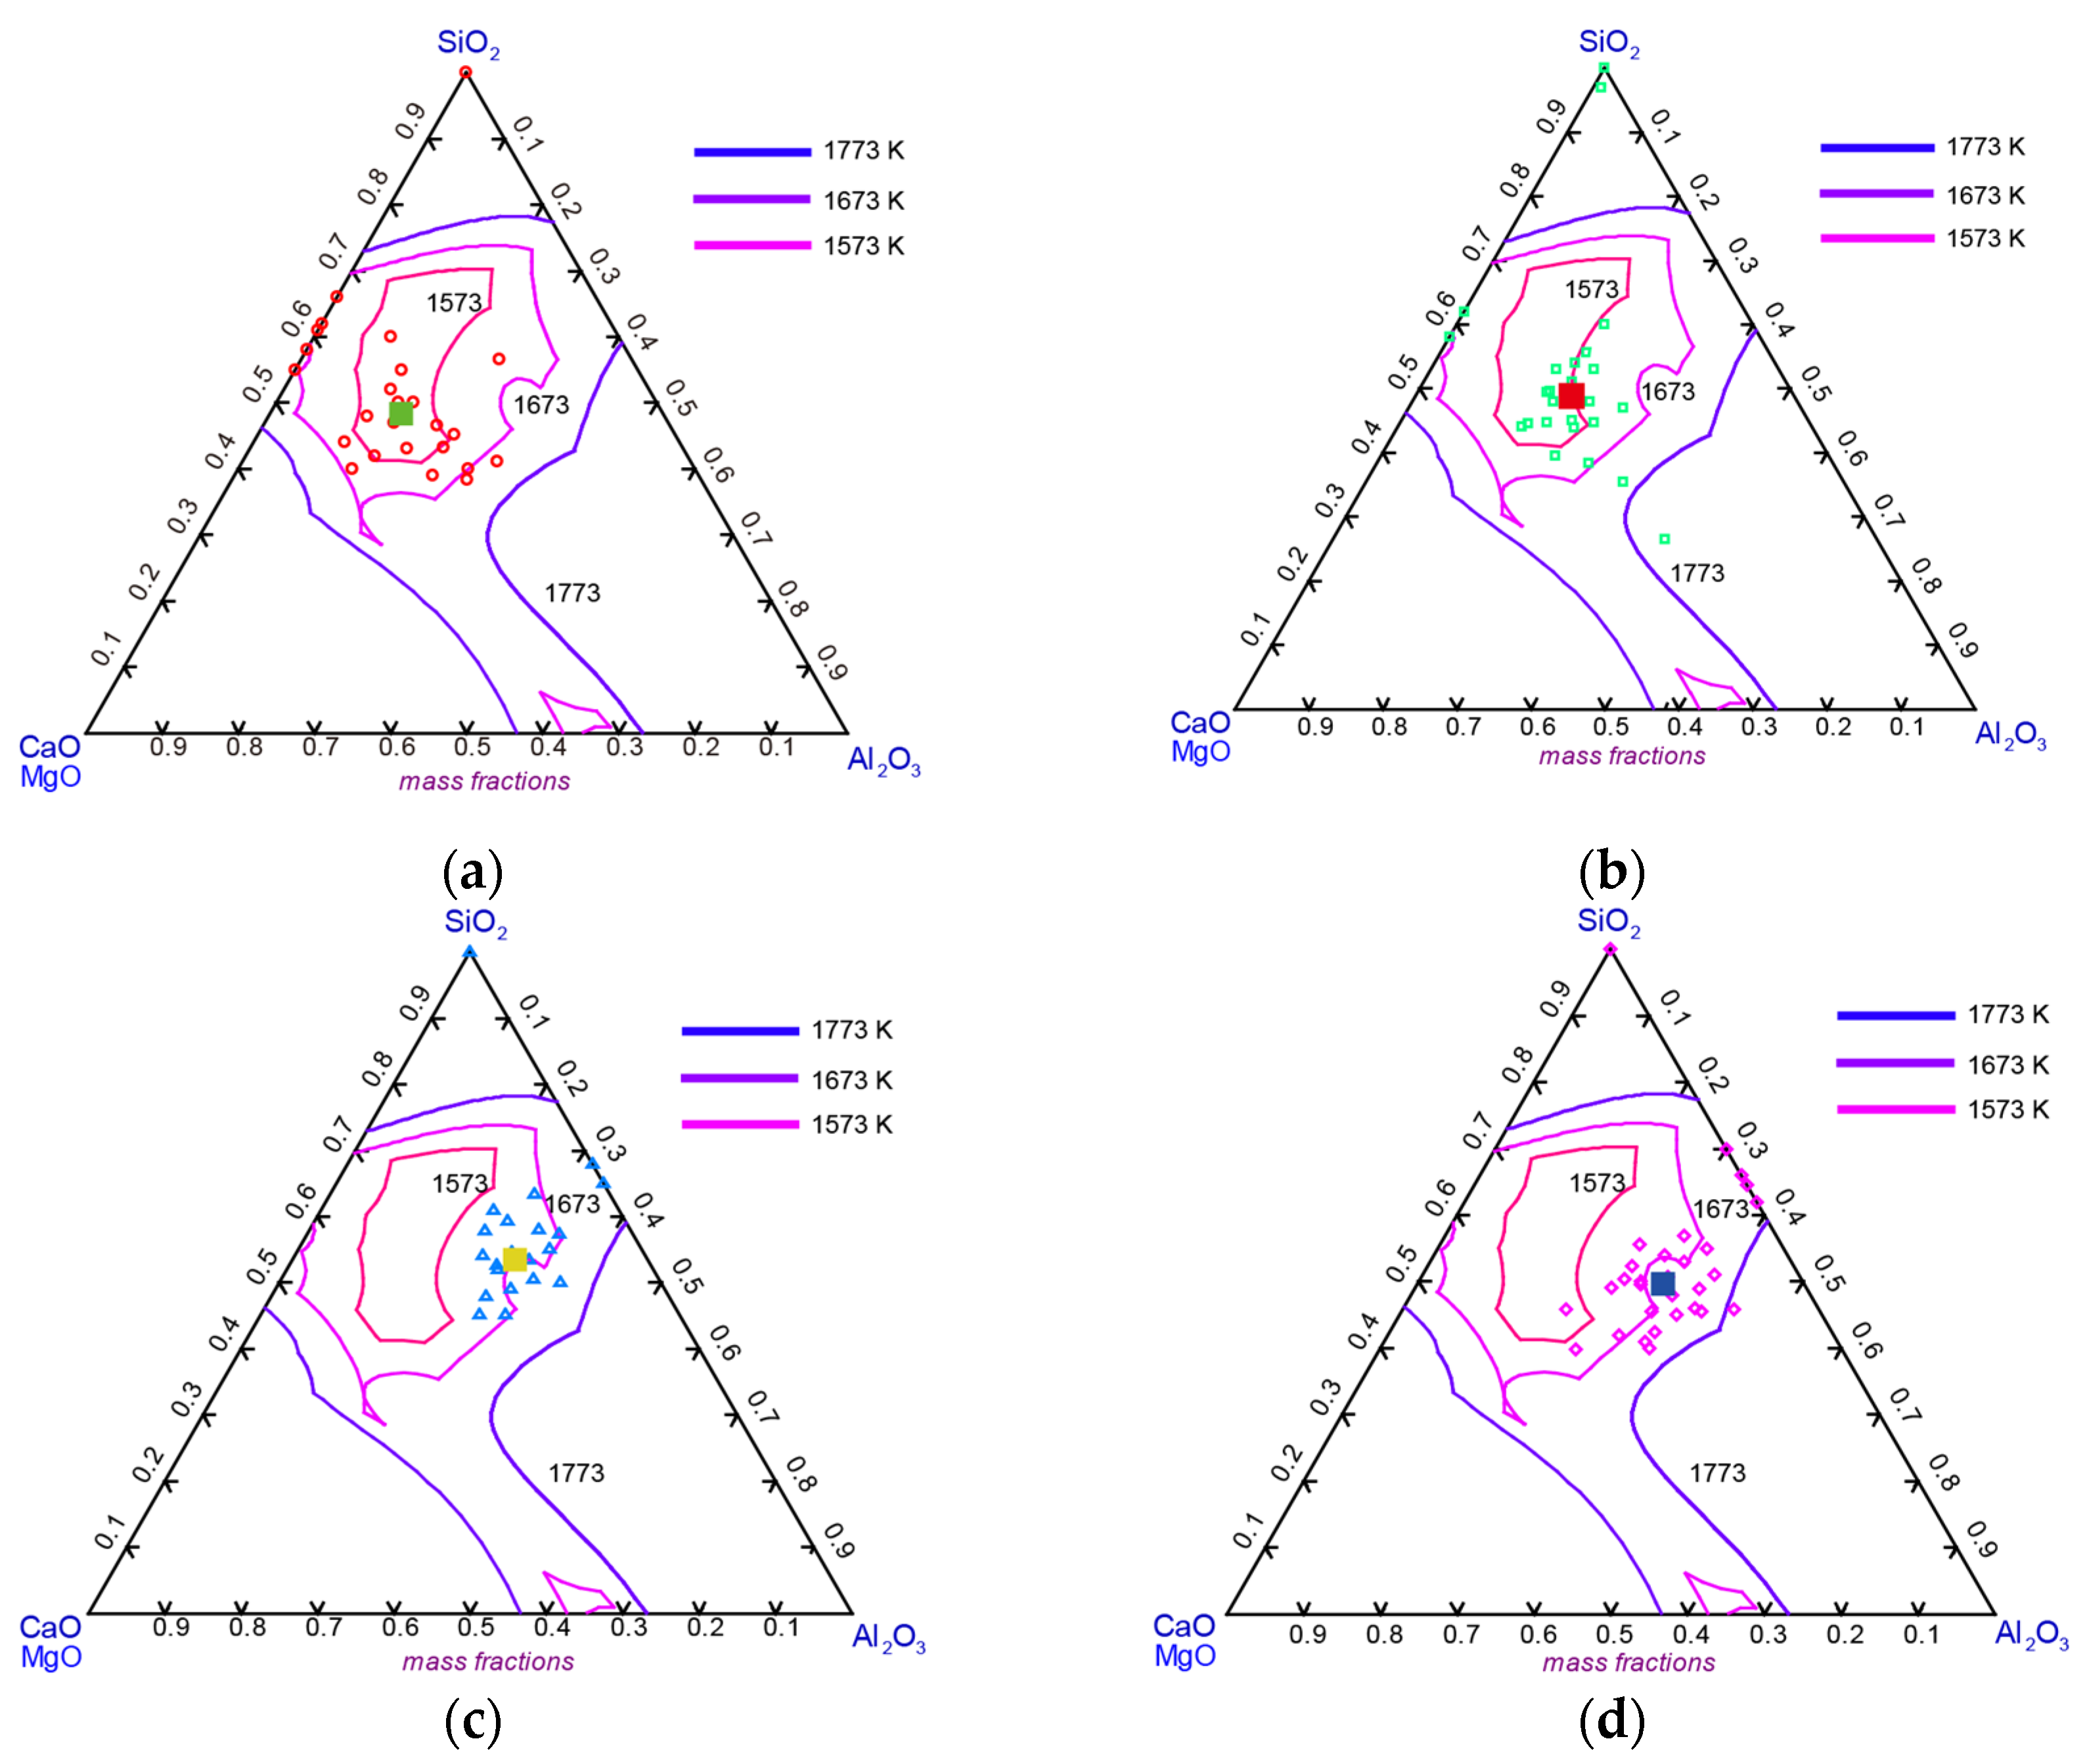
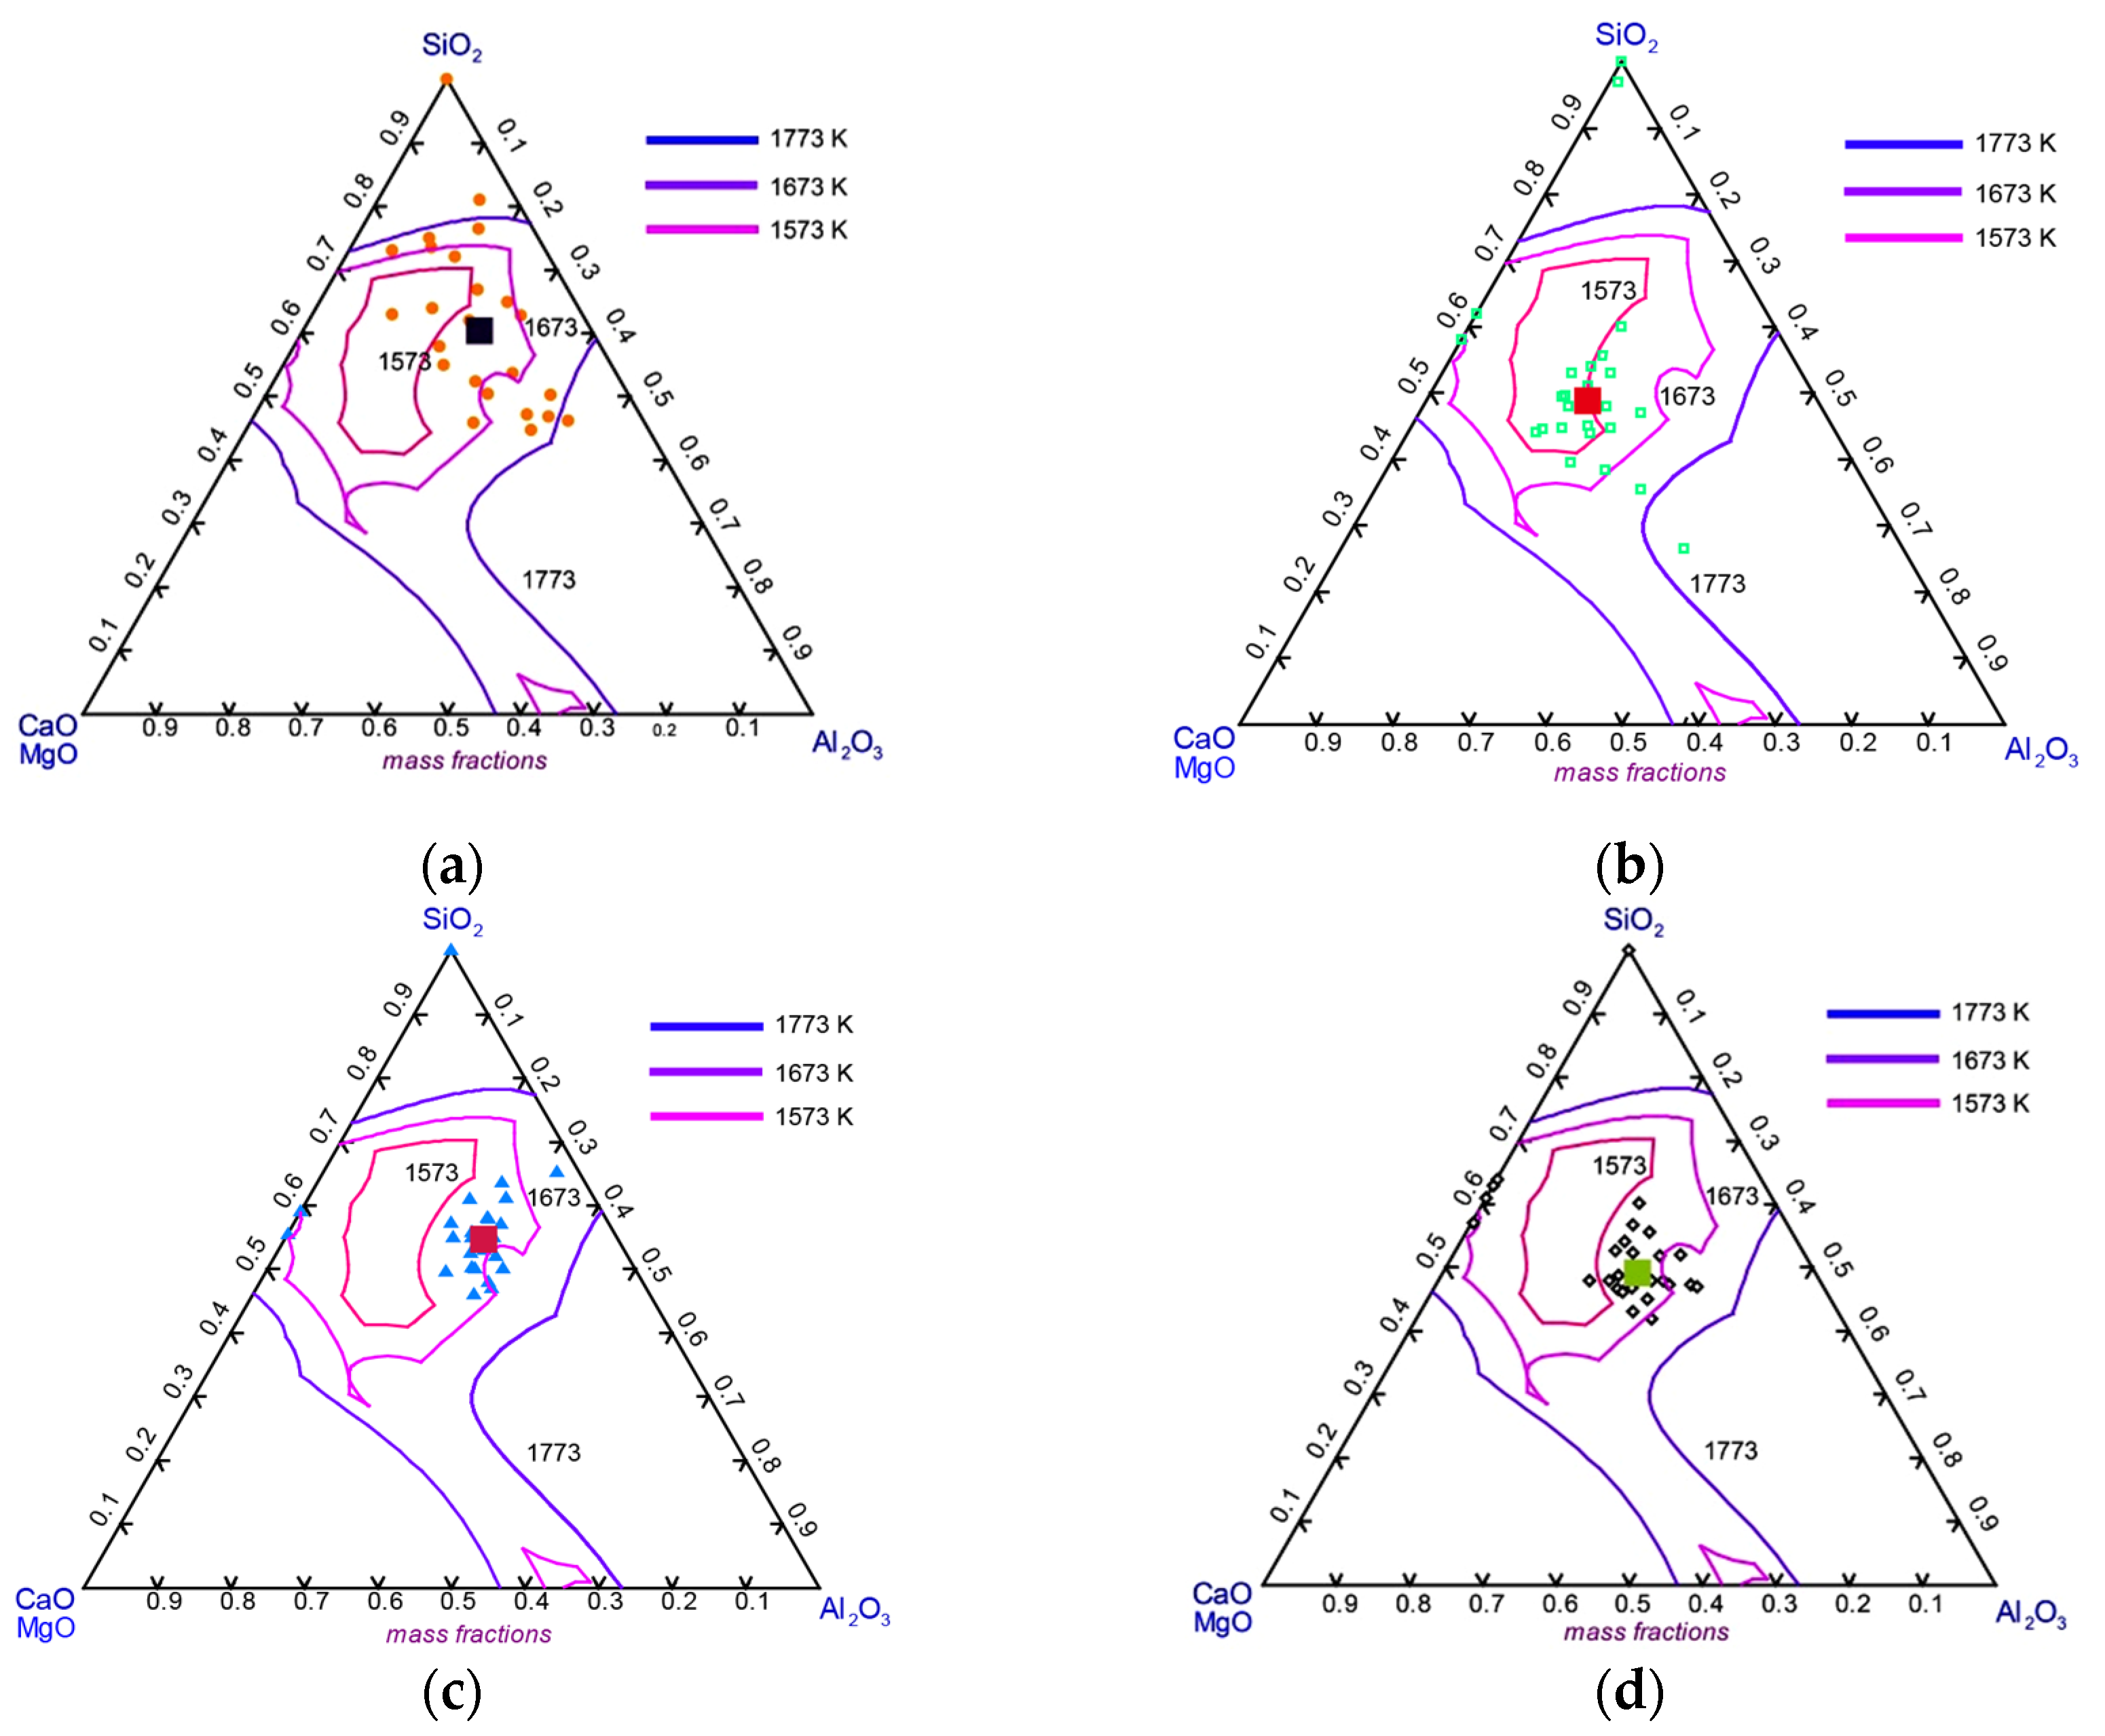
3.3. Composition Distribution of Typical Inclusions
The composition distribution of inclusions overlayed on a phase diagram with different Al
2O
3 contents and different basicities in the refining slag are shown in
Figure 6 and
Figure 7, respectively. The “small symbols” are the compositions of each inclusion in a ternary phase diagram, and the “colored square” is the average composition of all the inclusions in the 1
#~7
# steel samples. The detail composition of typical inclusions in samples were shows in
Table 6.
Figure 6 shows that the content of Al
2O
3(inc) in the inclusions and aluminosilicate inclusions had a tendency of increasing with the content of Al
2O
3(slag) increasing in the slag. The compound oxide inclusions were mainly concentrated in low-melting-point regions for all of the steel samples. In detail, the average contents of inclusions were SiO
2(inc): 48.27%, CaO
(inc)+MgO
(inc): 34.39%, Al
2O
3(inc): 17.34%; SiO
2(inc): 48.87%, CaO
(inc)+MgO
(inc): 30.01%, Al
2O
3(inc): 21.12%; SiO
2(inc): 53.46%, CaO
(inc)+MgO
(inc): 17.44%, Al
2O
3(inc): 29.10%, SiO
2(inc): 49.63%, CaO
(inc)+MgO
(inc): 18.40% and Al
2O
3(inc): 31.97%.
Figure 7 shows that most inclusions were located in the low-melting-point region, the inclusions distribution was dispersed in the 5
# steel sample with a basicity of 0.5 in the slag, and the inclusions distribution was concentrated in the 2
#, 6
# and 7
# steel samples with basicities of 0.8, 1.0 and 1.2 in the slag, respectively. In detail, the average contents of inclusions in these steel samples were SiO
2(inc): 60.26%, CaO
(inc)+MgO
(inc): 15.49%, Al
2O
3(inc): 24.25%; SiO
2(inc): 48.87%, CaO
(inc)+MgO
(inc): 30.01%, Al
2O
3(inc): 21.12%; SiO
2(inc): 54.56%, CaO
(inc)+MgO
(inc): 18.27%, Al
2O
3(inc): 27.17%, SiO
2(inc): 49.06%, CaO
(inc)+MgO
(inc): 24.34% and Al
2O
3(inc): 26.60%.
3.4. Mechanical Properties of the Experiment Steels
The mechanical properties of the experimental steels are shown in
Table 7. It is obvious that the tensile strength gradually increased from 1357.83 MPa to 1437.04 MPa as the content of Al
2O
3 in the slag increased from 3 wt.% (1
#) to 12 wt.% (4
#). In contrast, the reduction in area and elongation slightly decreased from 27.58% and 10.24% to 24.31% and 9.36%, respectively.
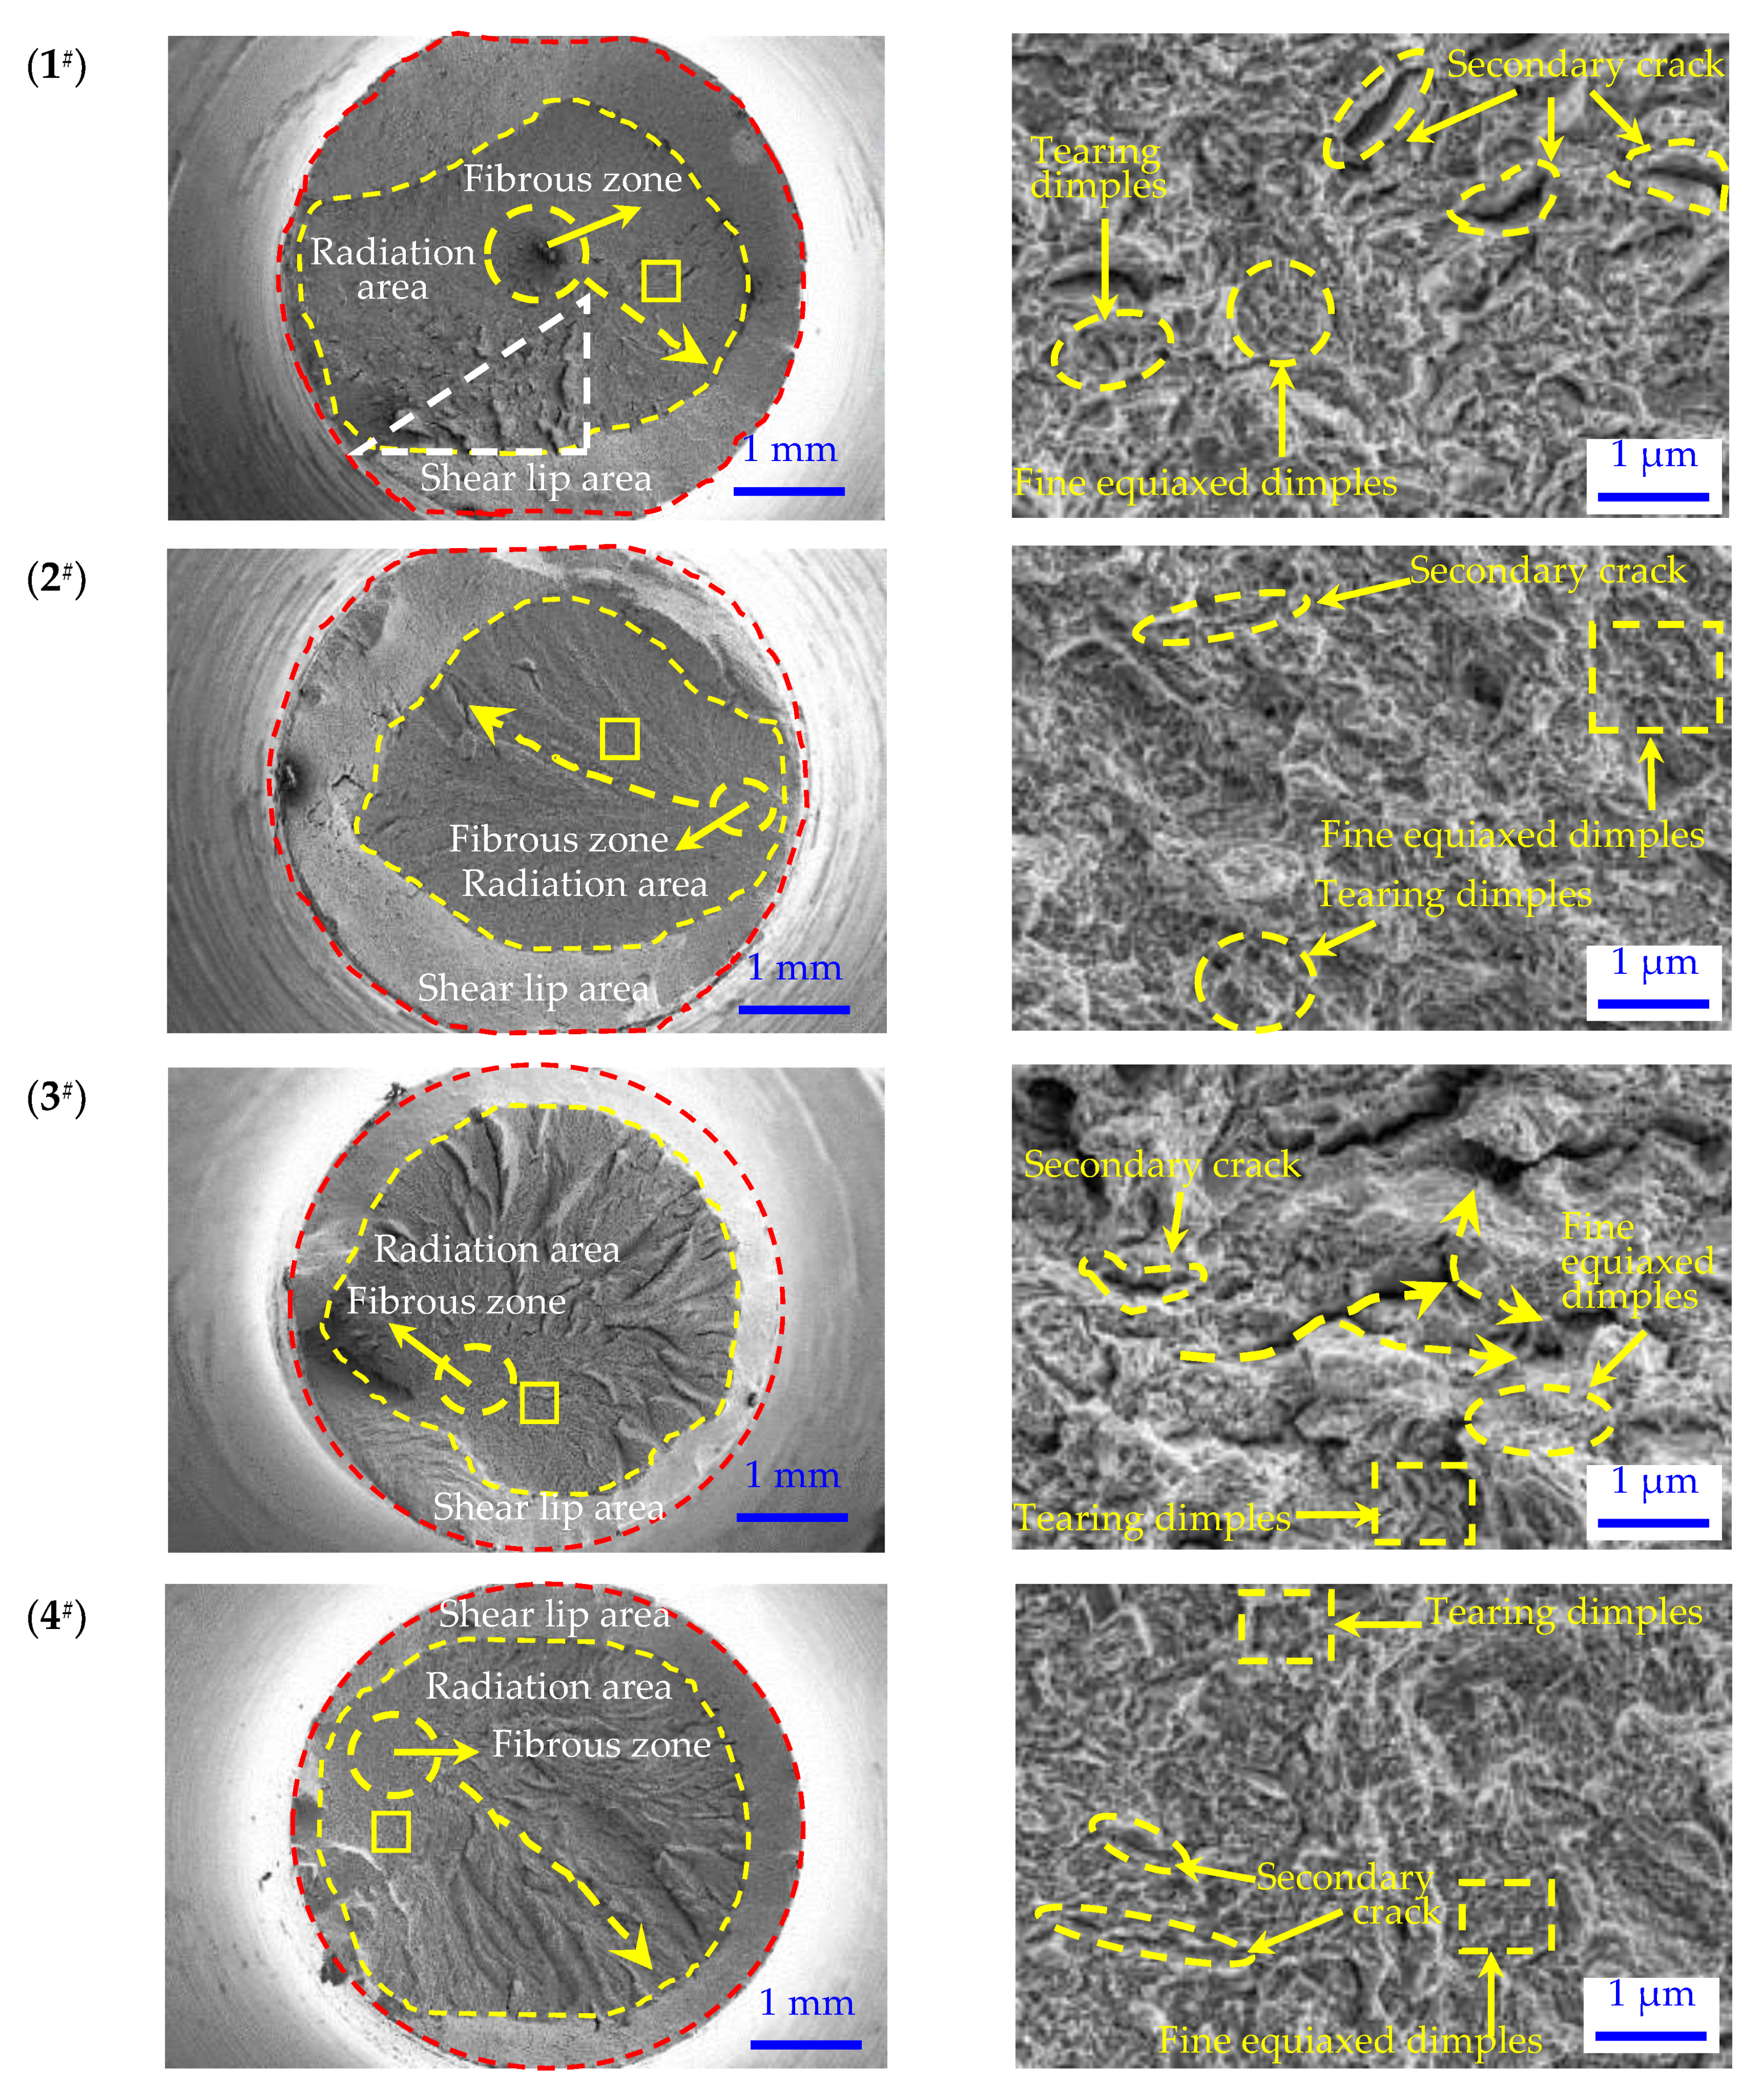
The fracture morphologies are shown in
Figure 8. From the macroscopic appearance of the fractures, the fractures of the four samples were typically cup-shaped and were divided into a fiber area, radiation area and shear lip area from the center to the edge. The radiation areas of the fractures of samples 1
# and 2
# were relatively flat, and there were few secondary microcracks, showing certain brittle fracture characteristics. In particular, many long and deep but directionless cracks appeared in the radiation area of sample 1
#, as shown in the white triangle area in the figure. In addition, the area of the radiation area tended to gradually increase; in contrast, the area of the shear lip gradually decreased. Moreover, the shape of the radiation area also gradually changed from an irregular shape and ellipse to a more regular circle. Finally, the number of secondary microcracks in the radiation area of the fracture surface of samples 3
# and 4
# significantly increased, radiating from the center to the edge along the radial direction. Furthermore, the length and depth of the secondary crack gradually became more uniform.
Comparing the microstructures of the four steel samples’ fractures, it was found that they all contained three kinds of microstructures, namely, secondary microcracks, tear dimples and fine equiaxed dimples. There was no significant difference in the fracture morphology of the four steel samples.
The tensile strength decreased gradually from 1442.12 MPa to 1367.84 MPa as the basicity of slag increased from 0.5 (5#) to 1.2 (7#). In contrast, the reduction in area and elongation slightly increased from 24.23% to 27.32% and from 9.36% to 9.96%, respectively.
The fracture morphologies of samples 5
#, 2
#, 6
# and 7
# are shown in
Figure 9. By comparing the macro morphology of these four samples, it can be seen that all the fracture morphologies were typical cup-shaped vertebrae, which was their common point. The 5
# sample had the largest radiation area, and the shape tended to be a regular circle. Secondary microcracks with high density were evenly distributed in the radiation area. This indicated that the sample’s structure was relatively uniform. The radiation area of sample 2
# was an irregular oval with a small area. In contrast, the shear lip area was large. Moreover, the fracturing of the 2
# sample was relatively flat, with only a small number of secondary cracks, which generally presented the characteristics of brittle fracture. The fiber area at the fracture of the 6
# sample was near the center of the circle, and the shape of the radiation area was a regular circle with a large area. The regularity of the fracture morphology of sample 7
# was the worst, where the fiber area was far away from the center of the circle, the morphology of the radiation area was irregular, and the radiation area was very uneven with a large number and distribution of long and deep cracks. In addition, the area of the shear lip was large.
When comparing the microstructures of the four steel samples’ fractures, it was found that they all contained three kinds of microstructures, namely, secondary microcracks, tear dimples and fine equiaxed dimples. With the increase in alkalinity, the microstructure at the fracture surface of the samples changed greatly: the number and size of secondary microcracks gradually increased, there were high-density large and deep holes in the fracture of the 6# sample (these holes were likely caused by large hard inclusions), and there were not only large and deep holes but also many cleavage planes at the fracture of sample 7#.
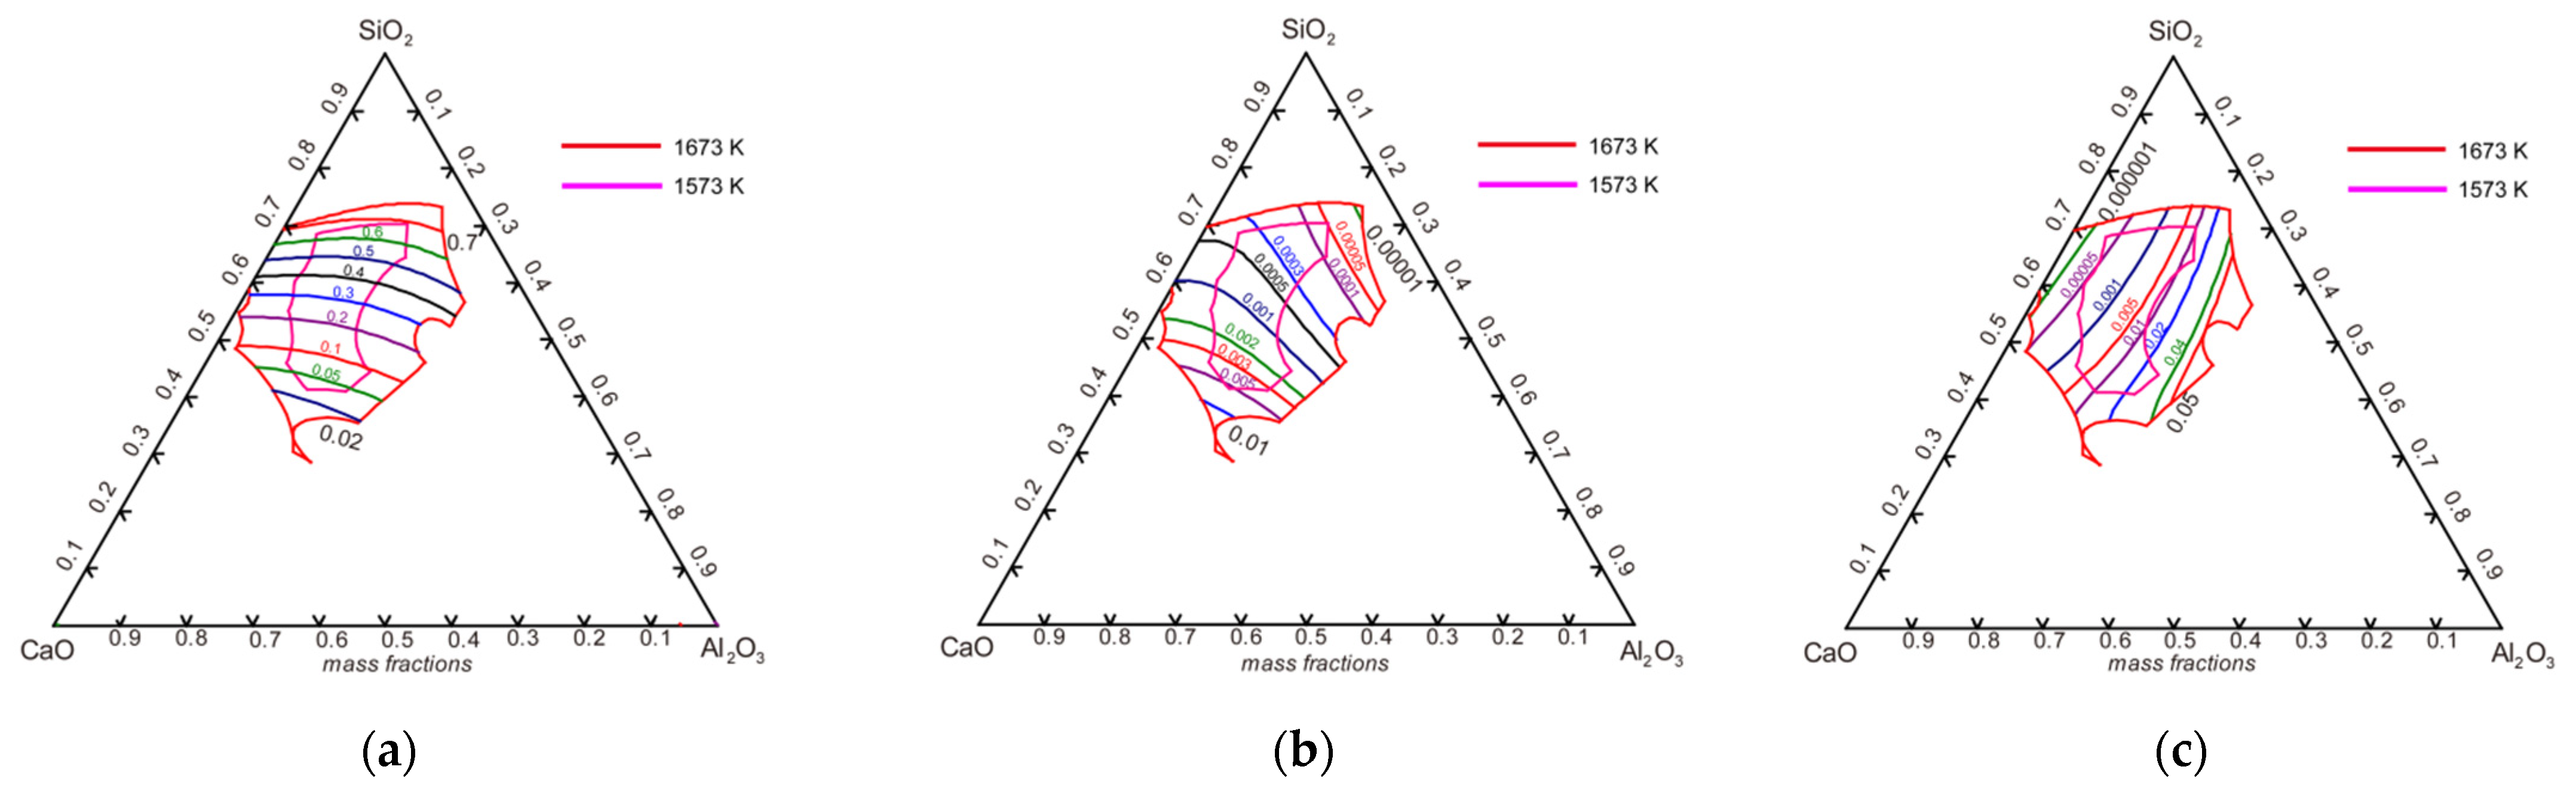
3.5. Thermodynamic Calculations of Isoactivity Lines
The calculation of the component activity of the CaO–SiO
2–Al
2O
3–MgO (10 wt.%) quaternary inclusion system was mainly completed by the phase diagram module in Fact-sage software. This part mainly calculated the isoactivity lines of CaO, SiO
2 and Al
2O
3 when the reaction reached equilibrium at 1873 K. The results are shown in
Figure 10. It was obvious that the value of
decreased sharply from 0.7 to 0.02 as the value of R gradually increased. In contrast, the values of
and
increased from 0.00001 to 0.01 and from 0 to 0.05, respectively. Within the low-melting-point zone, the value of
was one order of magnitude larger than that of
, which meant that the content of SiO
2 in the generated inclusions was significantly higher than that of CaO, which was consistent with the experimental results.
The contents of [O] and [Al] in steel have an important influence on the number, size and morphology of inclusions. Too high of a content of [O] will produce a large number of oxide inclusions and too high of a content of [Al] will produce brittle and hard inclusions with edges and corners, such as Al2O3 and MgO·Al2O3, which will seriously endanger the mechanical properties of spring steel. Therefore, the isooxygen (Iso-[O]) line and isoaluminum (Iso-[Al]) line were calculated to determine the ranges of [O] and [Al] contents where low-melting-point inclusions were formed.
The Equilib module and Phase Diagram module in Fact-sage software were used to calculate the Iso-[O] line and Iso-[Al] line when the 55SiCr molten steel was in equilibrium with CaO–SiO
2–Al
2O
3–MgO quaternary inclusions. The chemical composition of 55SiCr steel is shown in
Table 1. The activity coefficients of C, Si, Mn, Cr, Ni, V, Al, O, S, P and other elements were mainly used in the calculation. The activity coefficients
fi of each element can be calculated according to Equation (1).
where
fi is the activity coefficient of element
i and
is the interaction coefficient of element
j with
i, as shown in
Table 8.
- (1)
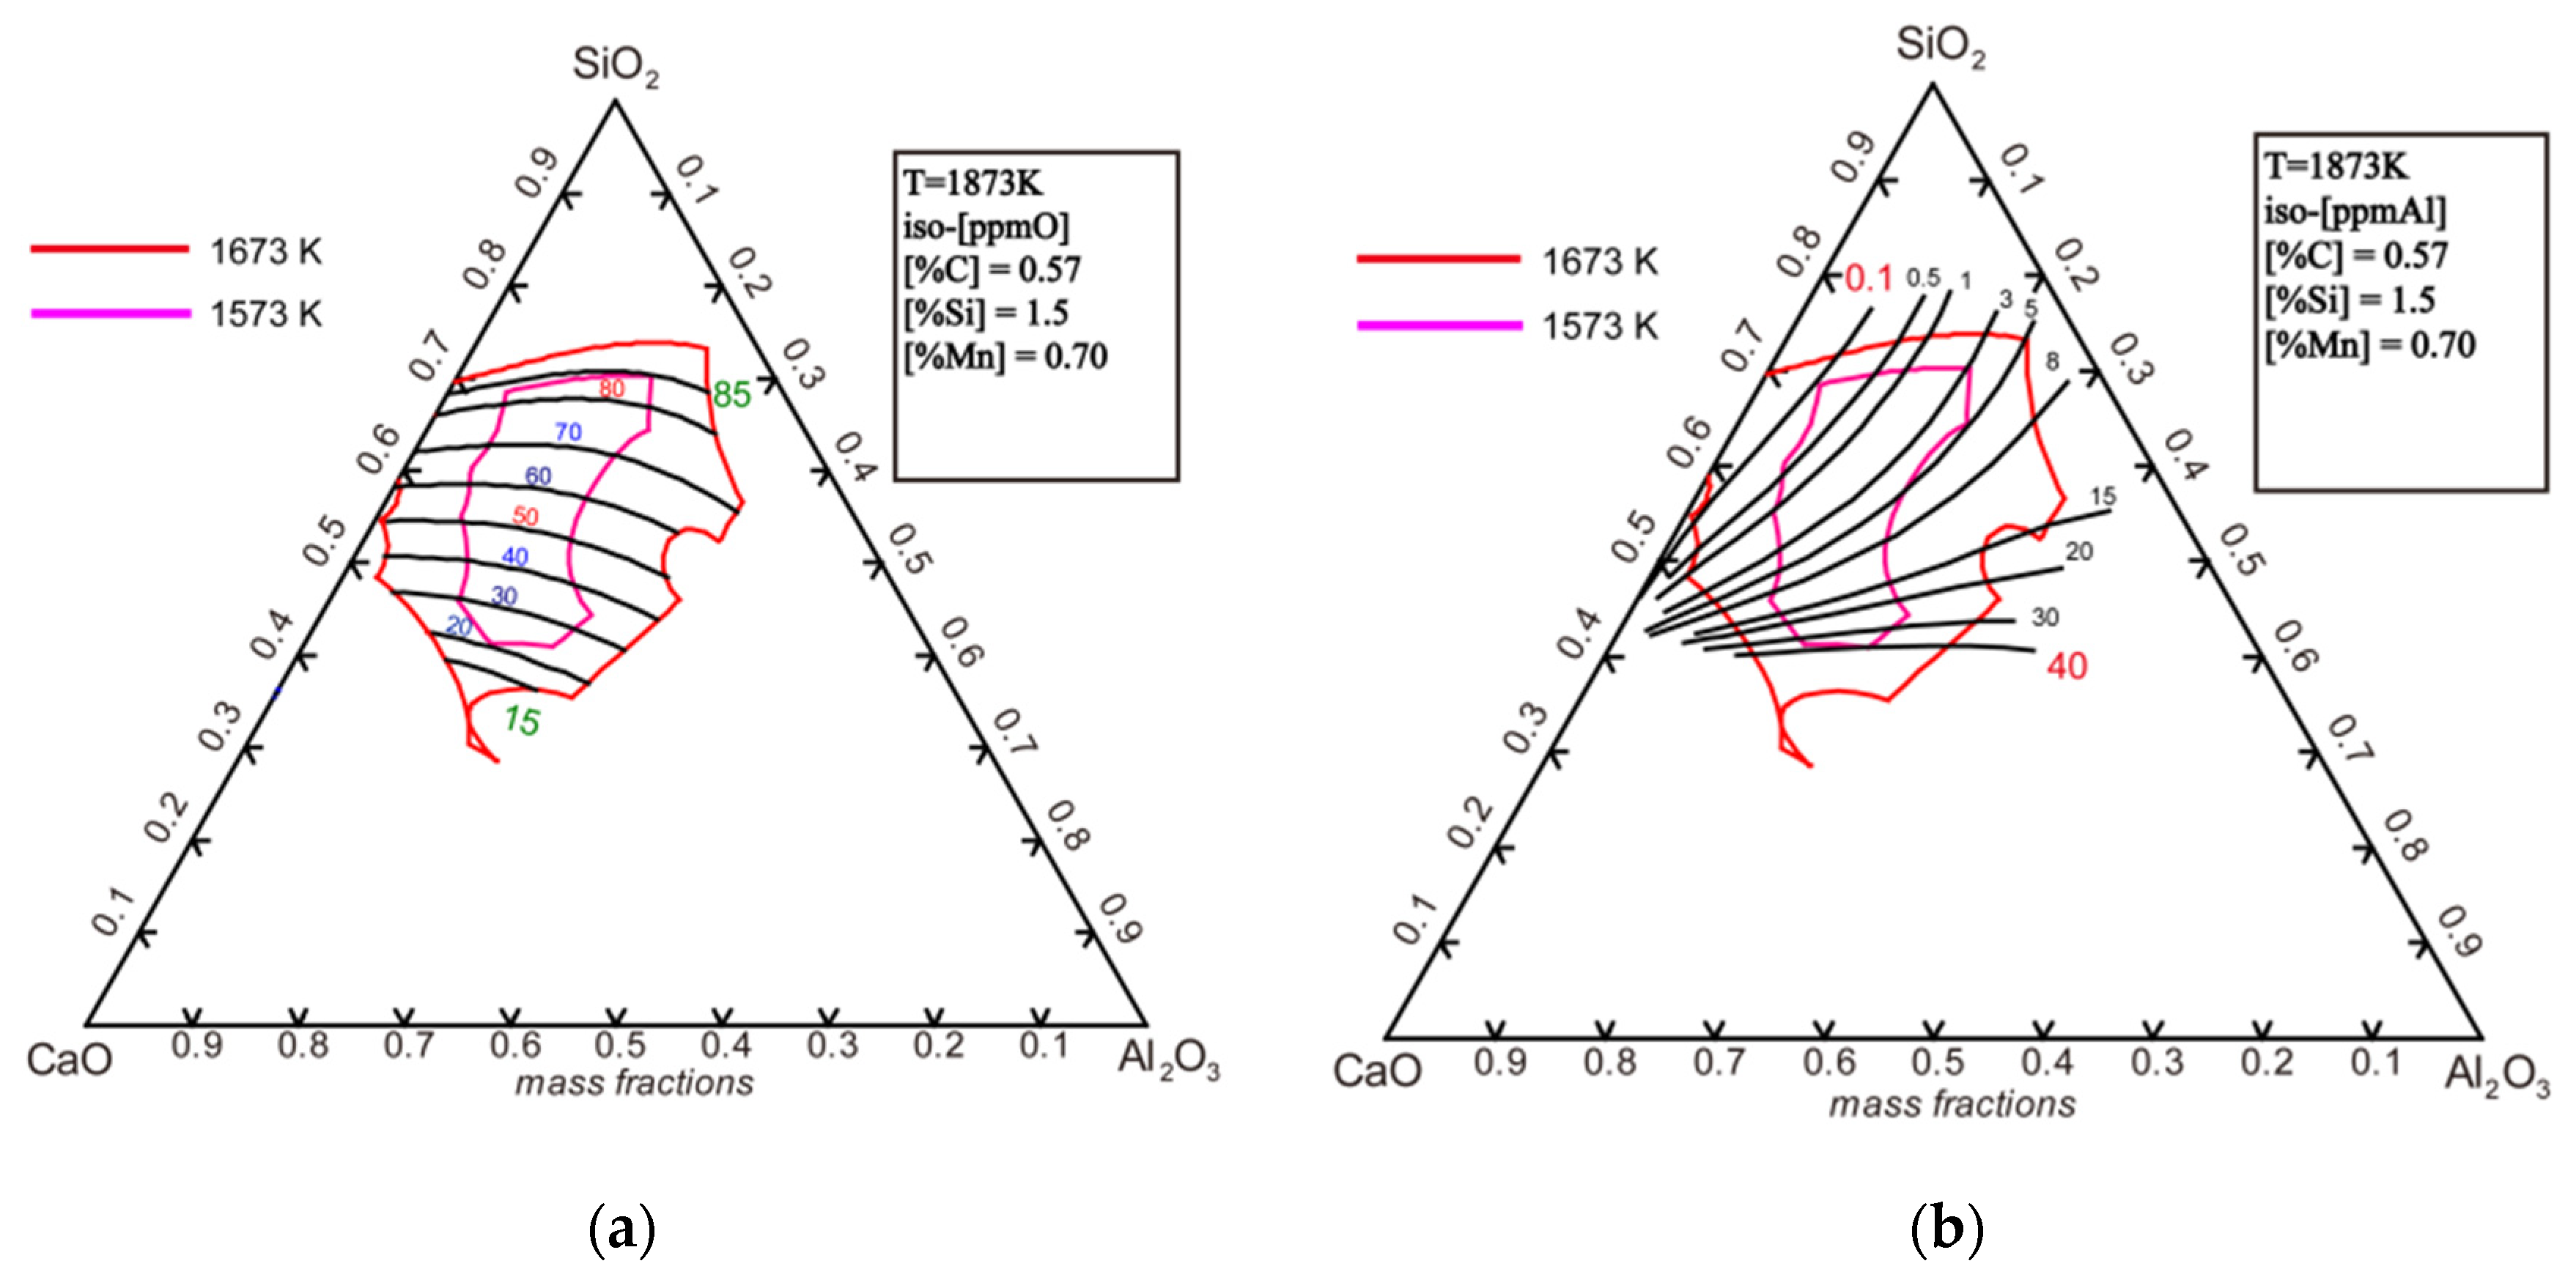
The isooxygen (Iso-[O]) line
The chemical reaction of [Si] and [O] in molten steel is shown in Equation (2) [
25] and Equation (3) can be derived from it.
The activity value of SiO
2 in
Figure 10 and the relevant data in
Table 1 and
Table 6 were substituted into Equation (3) to calculate the isooxygen (Iso-[O]) line of 55SiCr molten steel and CaO–SiO
2–Al
2O
3–MgO quaternary inclusions in molten steel at 1873 K. The results are shown in
Figure 11a. It was obvious that the oxygen content in the low-melting-point region near the calcline in the phase diagram was 0.0015 wt.%~0.0085 wt.%, with a large controllable range.
- (2)
The isoaluminum (Iso-[Al]) line
The chemical reaction of [Al] and [O] in molten steel is shown in Equation (4) [
30] and Equation (5) can be derived from it.
The activity value of SiO
2 in
Figure 10 and the relevant data in
Table 1 and
Table 6 were substituted into Equation (5) to calculate the isooxygen (Iso-[Al]) line of 55SiCr molten steel and CaO–SiO
2–Al
2O
3–MgO quaternary inclusions in molten steel at 1873 K. The results are shown in
Figure 11b. It was obvious that the oxygen content in the low-melting-point region near the calcline in the phase diagram was 0.00001 wt.%~0.0040 wt.%, with a small controllable range. Thus, the content of [Al] in steel needs to be strictly controlled at a very low level in order to obtain low-melting-point inclusions in the smelting process of low alkalinity refining slag combined with silicon deoxidation.
In this study, the content of T.O in all steels was about 0.0020 wt.% and the content of all [Al] was about 0.0015 wt.%. Therefore, the inclusions in all of the group steels can be controlled in the low-melting-point region, which is consistent with the actual test results.
For the group made up of the 1#~4# steels, the compositions of inclusions were consistent with those of refining slag when the three phases of steel–slag–inclusion reached equilibrium. Therefore, the content of [Al]s in the molten steel and the Al2O3 content of inclusions in steel increased gradually as the Al2O3 content in the slag gradually increased.
For the group made up of the 5#, 2#, 6# and 7# steels, the activity of SiO2 gradually decreased with the increasing alkalinity of the slag, which inhibited the progress of the reaction shown in Equation (4); as a result, the T.O content and the total number of inclusions in steel decreased gradually. In addition, the content of CaO in inclusions increased gradually with the basicity of slag gradually increasing due to the composition of inclusions being consistent with that of refining slag when the three phases of steel–slag–inclusion reached equilibrium.
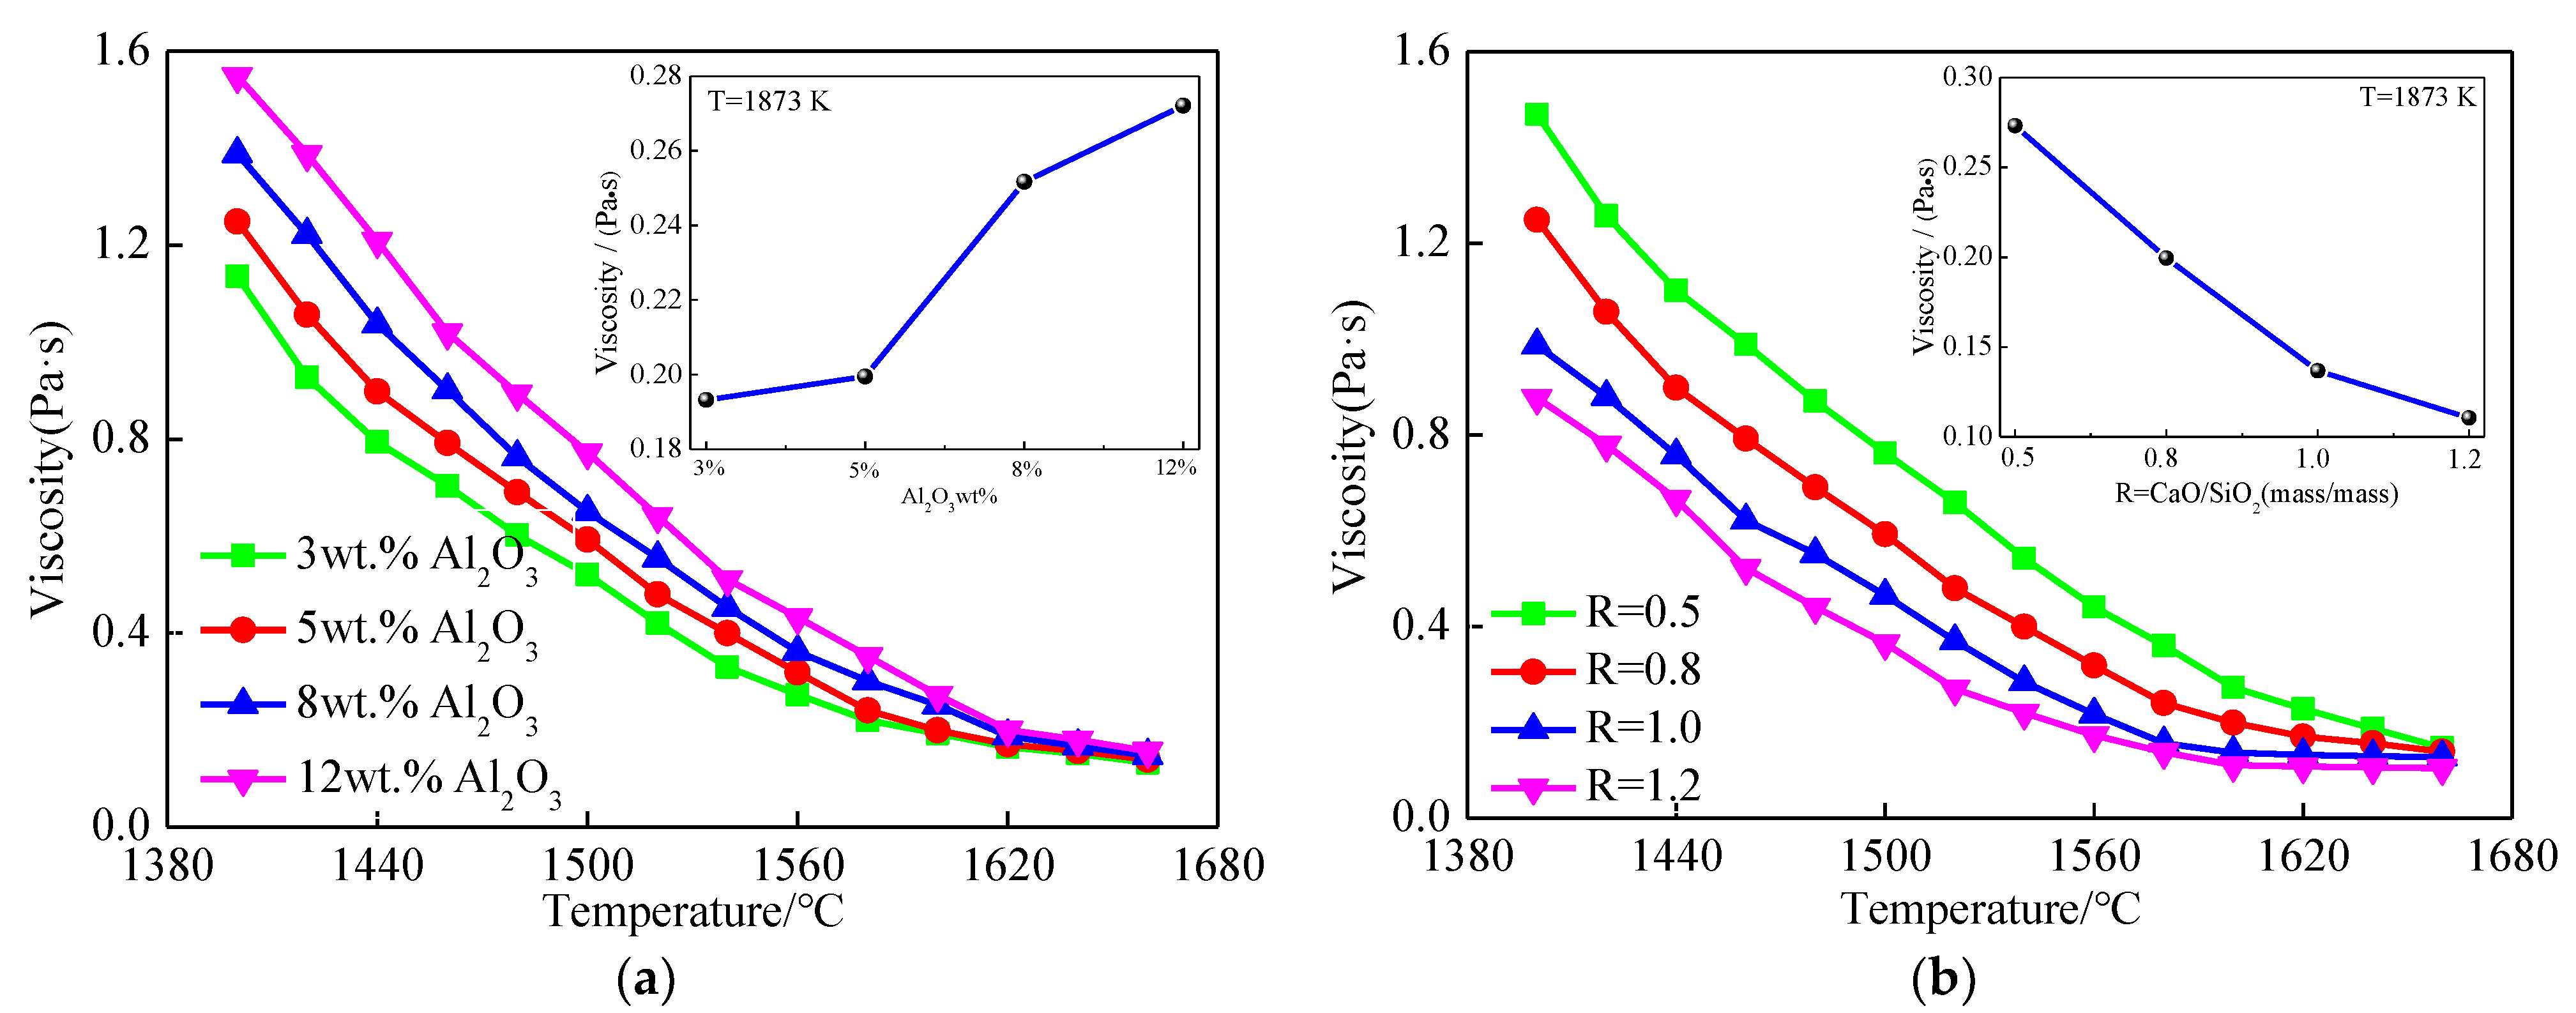
3.6. Influence of Al2O3 Content and Basicity on the Viscosity and Structure of the Slag
Increasing the Al
2O
3 content and basicity in the refining slag had an obvious impact on the thermochemical and thermophysical properties of the slag, including their structure, viscosity and surface tension [
31,
32]. The effect of Al
2O
3 content and basicity on the viscosity of the slag at different temperatures was studied using a viscometer and the results are shown in
Figure 12.
It was obvious that the viscosity of the slag increased gradually with the increase in the Al2O3 content. In contrast, the viscosity of the slag gradually decreased with the increase in basicity. In addition, the viscosity of the slag increased sharply as the temperature gently decreased. The change in slag viscosity was caused by the significant change in its microstructure.
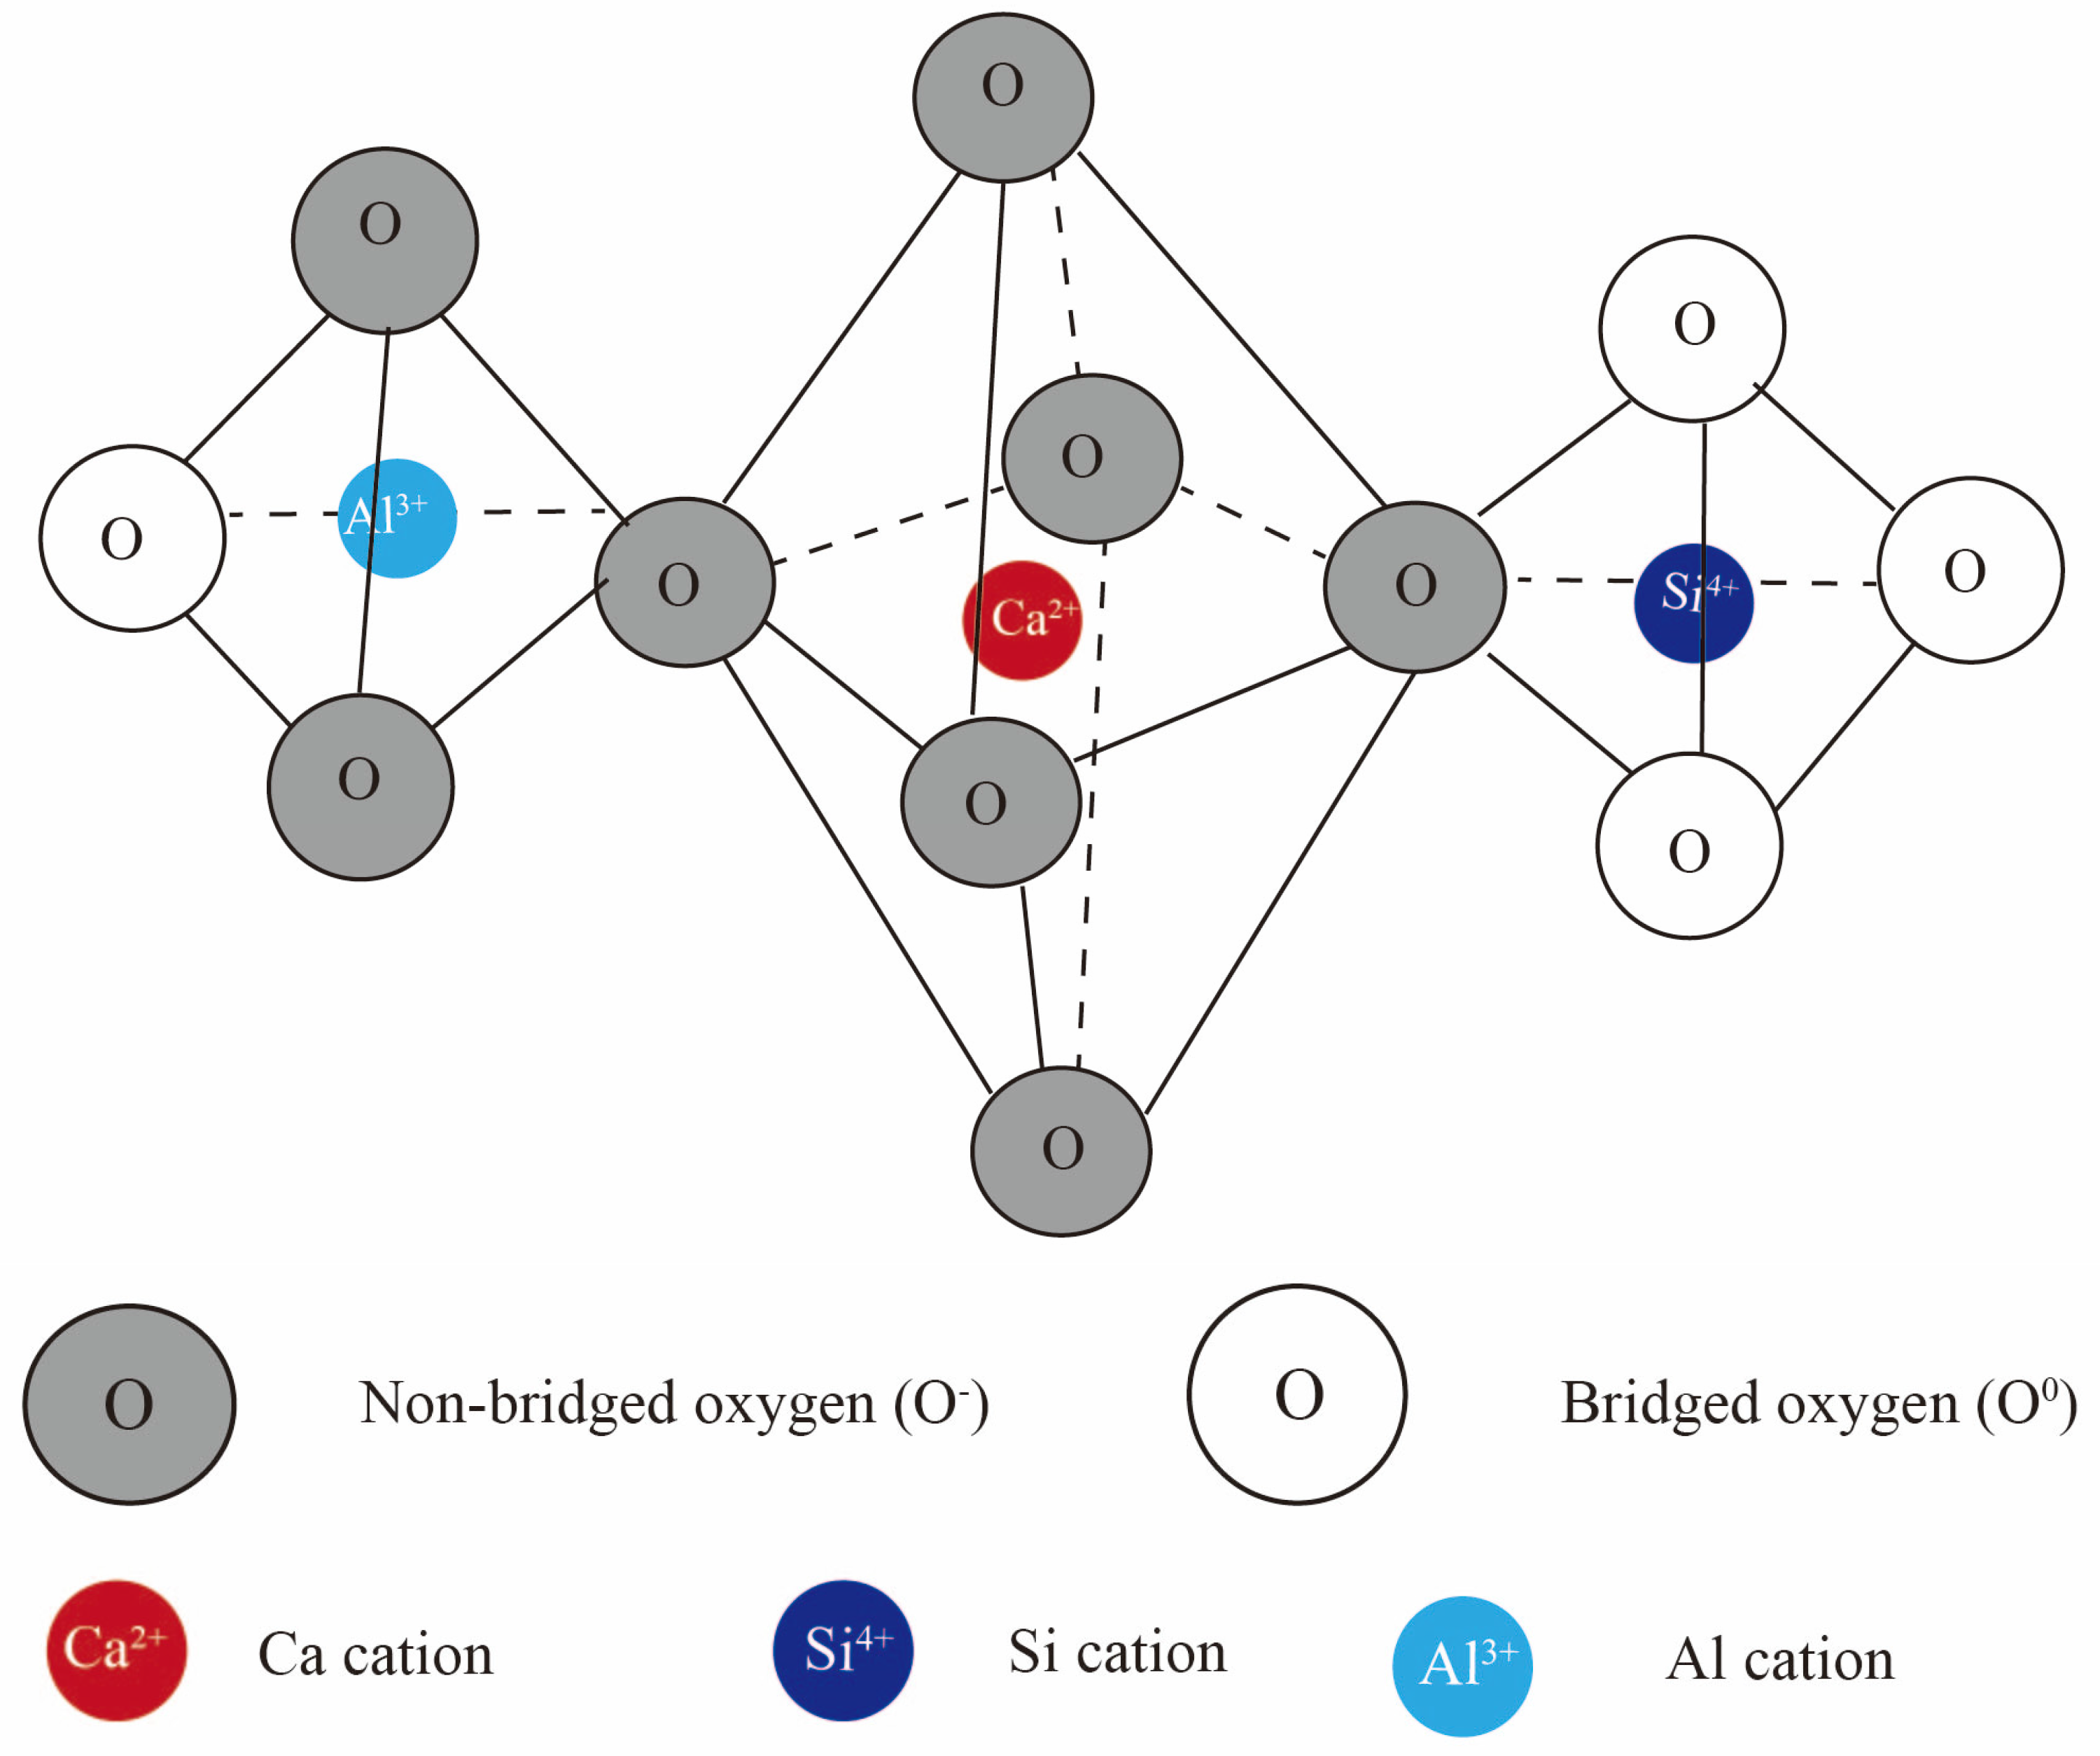
The network structure of slag is shown in
Figure 13. The viscosity of slag is often indirectly characterized by the degree of polymerization of the network structure, and the viscosity increases with the increase in the degree of polymerization.
In order to research the relationship between the structure and composition of molten slag, the molten slag quenched in water was further analyzed by using FTIR. Characteristic transmittance peaks in the FTIR spectra for silicate systems were observed in the wavenumber region between 1200 and 400 cm
−1 [
33]. In detail, the band group of Si-O bonds existed between 1030 and 750 cm
−1, which corresponds to NBO (non-bridging oxygen) of 1 to 4 [
34]. The band group shown in the range of 750-630 cm
−1 was related to the asymmetric stretching vibration of [AlO
4]
5− tetrahedral units, and the trough near 500 cm
−1 indicates Si-O-Al bending.
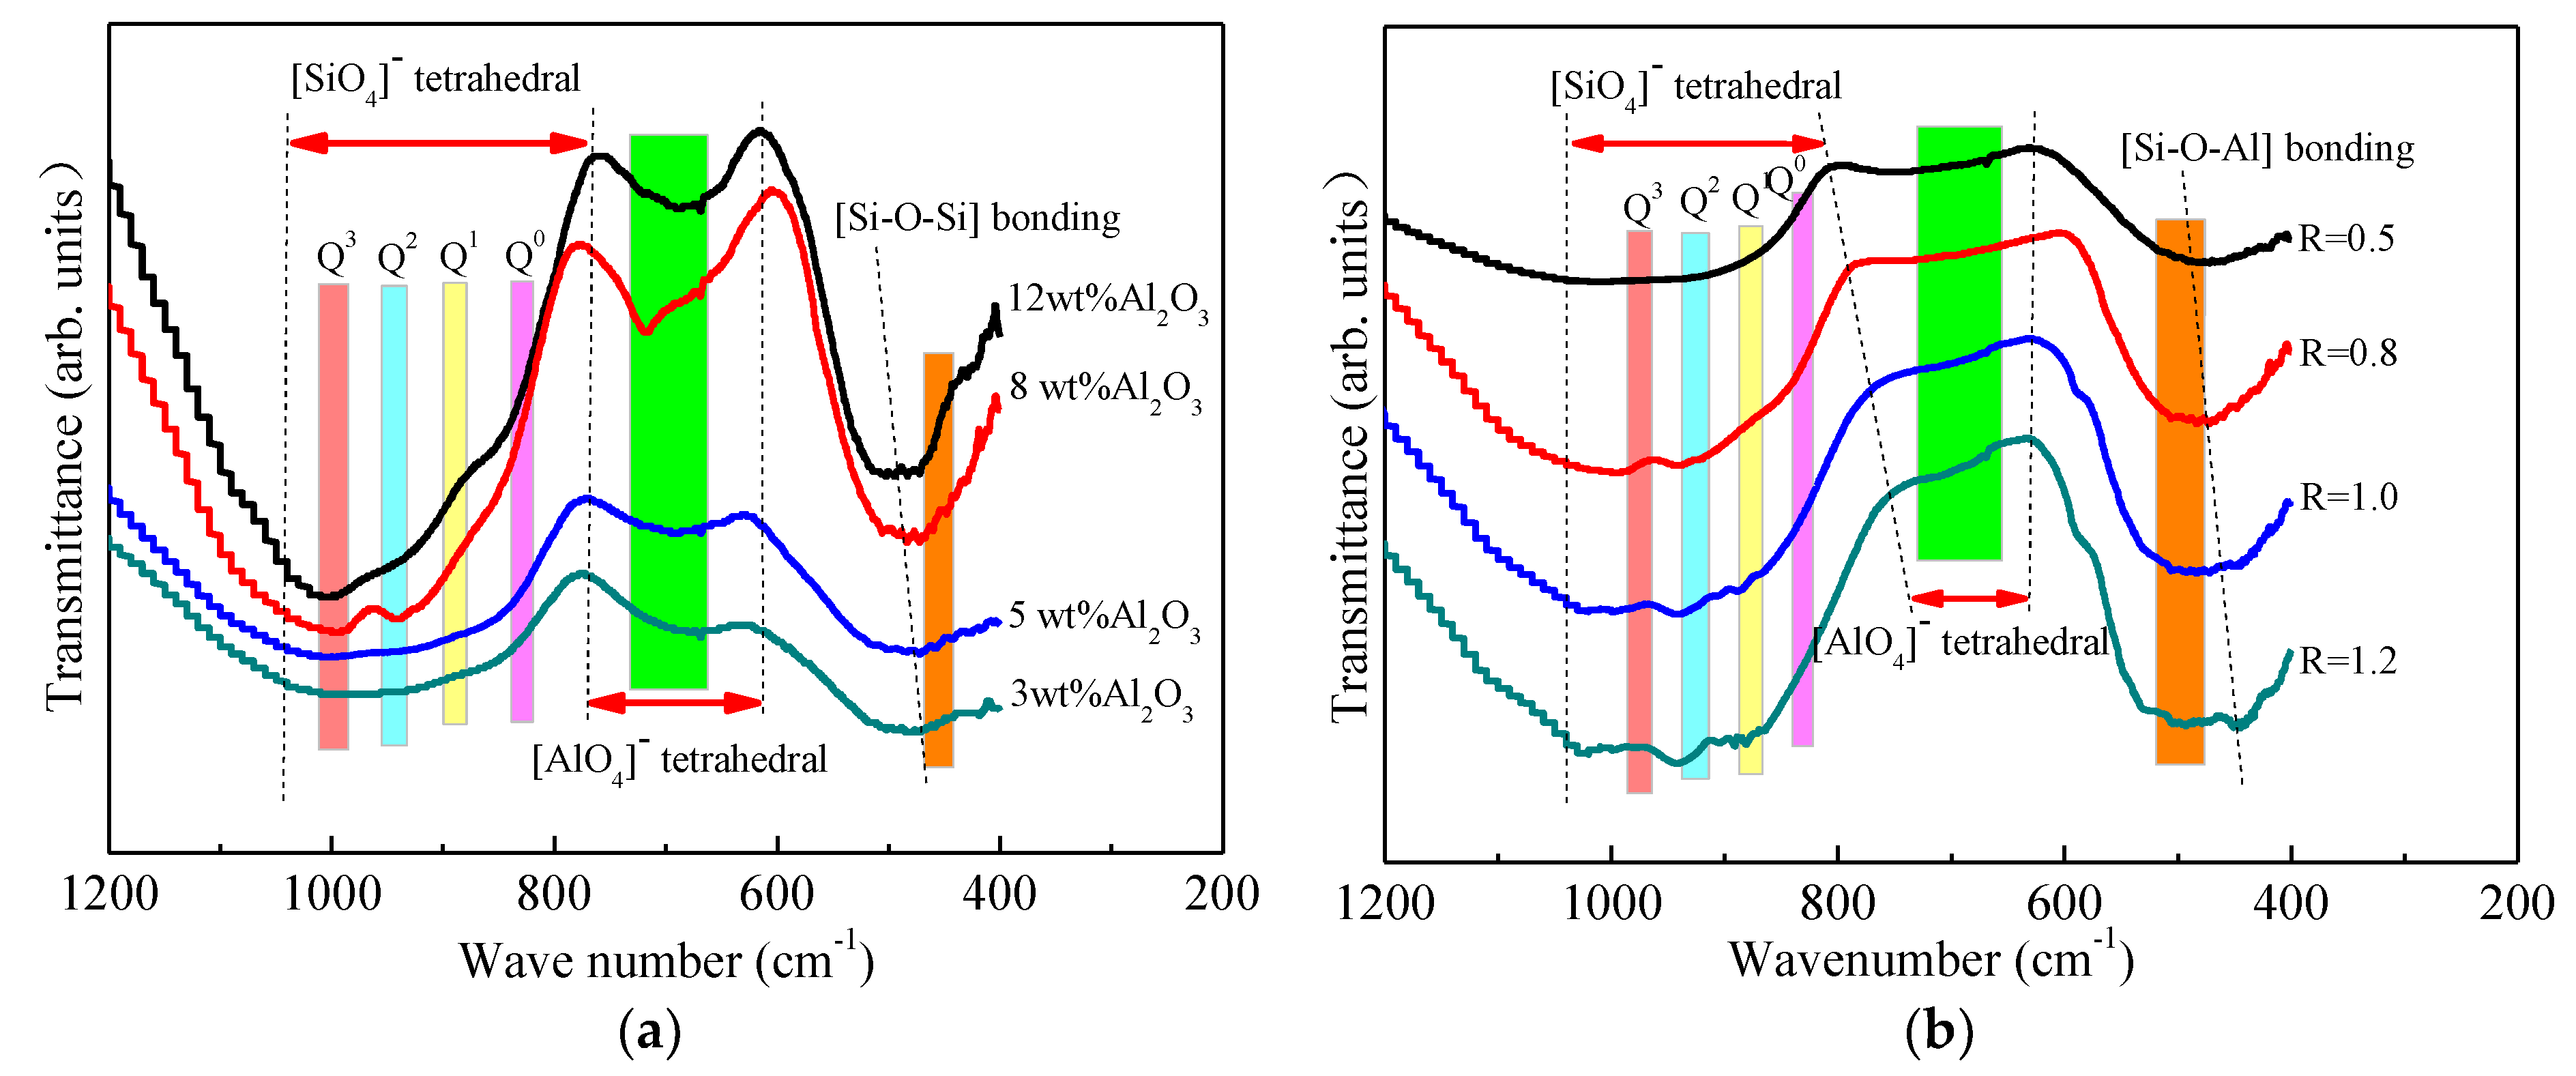
Figure 14 shows the effect of Al
2O
3 and basicity on the FTIR transmittance spectra of the CaO–SiO
2–Al
2O
3–10 wt% MgO slag. As can be seen in
Figure 14a, the transmittance trough for the [AlO
4]
5− tetrahedral stretching for wavenumbers of 750–630 cm
−1 became deeper and more pronounced with the increase in Al
2O
3 content. This suggested the occurrence of the polymerization of complex aluminate structures using the tetrahedral [AlO
4]
5− structural units with higher Al
2O
3. In addition, the Si-O-Al bending trough moved to higher wavenumbers, which suggested that the distance between Si/Al and O became shorter, i.e., the network structure was polymerized, as proposed by Badger’s rule [
35]. Moreover, the trough of the [SiO]
−4 tetrahedral band group experienced only a small change, which means that, in this experiment, Al
2O
3 content had little effect on the [SiO]
−4 tetrahedral structure. This showed that the amount of complex silicate structures increased. These results correlated well with the viscosity measurements.
As can be seen from
Figure 14b, the lower limit of the [SiO
4]
− tetrahedral bands at about 1030-750 cm
−1 shifted to a lower wavenumber from about 790 to 750 cm
−1 with an increase in the basicity of the slag from 0.5 to 1.2. Furthermore, the broadening of the width of the [SiO
4]
− tetrahedral bands suggested an increase in distance between the Si and O. This shows that the silicate network structures in the slag melt were depolymerized with an increase in the basicity of the slag. In addition, the trough of the [AlO
4]
− tetrahedral bands at about 750–630cm
−1 dampened with increasing basicity and almost disappeared at the basicity of 1.2 [
36,
37]. This indicated that the aluminate network structures in the slag melt were also depolymerized with increasing basicity. It seems reasonable to consider that the band groups observed at about 500 cm
−1 were the Si-O-Al bending vibrations. It can be concluded that further depolymerization of a complex silicate and aluminate network structure occurred at a higher basicity. These results correlated well with the viscosity measurements.
3.7. Removal of Inclusions via the Adsorption of Refining Slag
The physical properties of slag can significantly affect its adsorption and removal of inclusions. The melting point of slag decreased with the increase in Al
2O
3 content, and the fluidity increased, which increased the adsorption capacity of slag to inclusions. In contrast, the viscosity of slag increased with the increase in Al
2O
3 content, which made it more difficult for inclusions to pass through the steel–slag interface. Therefore, the comprehensive effect caused the number of inclusions in the steel gradually decrease before it increased. In addition, the gradual increase in slag viscosity reduced the situation where it was entrapped in molten steel and became foreign inclusions, and thus, the proportion of large-sized inclusions in steel continued to decrease [
38,
39,
40].
When the viscosity of slag decreased with the increase in slag basicity, it makes it easier for refining slag to be entrapped in molten steel and become foreign inclusions [
38,
39,
40]. In addition, the fluidity will weaken sharply due to the melting point of slag increasing with the increase in CaO content in slag, resulting in a decrease in its adsorption capacity for inclusions [
41]. Therefore, the comprehensive effect is that the percentage of the number of large inclusions in steel increased with the increase in slag basicity.


