Article

Isostructural Crystals of Bis(Guanidinium) Trioxofluoro-Phosphate/Phosphite in the Ratio 1/0, 0.716/0.284, 0.501/0.499, 0.268/0.732, 0/1—Crystal Structures, Vibrational Spectra and Second Harmonic Generation

1
Department of Inorganic Chemistry, Faculty of Science, Charles University, Hlavova 8, 128 43 Prague, Czech Republic
2
Institute of Physics, Academy of Sciences of the Czech Republic, Na Slovance 2, 182 21 Prague, Czech Republic
*
Author to whom correspondence should be addressed.
Crystals 2022, 12(12), 1694; https://doi.org/10.3390/cryst12121694
Submission received: 10 November 2022 / Revised: 18 November 2022 / Accepted: 19 November 2022 / Published: 23 November 2022
(This article belongs to the Section Crystal Engineering)

Abstract

:
The title structures of bis(guanidinium) trioxofluorophosphate, bis(guanidinium) trioxofluorophosphate-phosphite (0.716/0.284), bis(guanidinium) trioxofluorophosphate-phosphite (0.501/0.499), bis(guanidinium) trioxofluorophosphate-phosphite (0.268/0.732), and bis(guanidinium) phosphite are crystal-chemically isotypic. Their structures correspond to the structure of bis(guanidinium) trioxofluorophosphate which was determined by Prescott, Troyanov, Feist & Kemnitz (Z. Anorg. Allg. Chem. 2002, 628, 1749–1755). The P and O atoms of the substituted trioxofluorophosphate and phosphite anions share the same positions while the P-F and P-Hhydrido are almost parallel and oriented in the same direction. Two symmetry-independent anions and two of three symmetry-independent cations are situated on the crystallographic mirror planes. The ions are interconnected by N-H⋯O hydrogen bonds of moderate strength. The most frequent graph set motif is R 2 2 ( 8 ) , which involves interactions between the primary amine groups and the trioxofluorophosphate or phosphite O atoms. Fluorine, as well as the hydrido hydrogen, avoids inclusion into the hydrogen-bond network. The Hirshfeld surface analysis was also performed for the comparison of intermolecular interactions in the title structures of bis(guanidinium trioxofluorophosphate and bis(guanidinium) phosphite. The title crystals were also characterized by vibrational spectroscopy methods (FTIR and Raman) and the second harmonic generation (SHG). The relative SHG efficiency considerably decreases from bis(guanidinium) trioxofluorophosphate to bis(guanidinium) phosphite for the fundamental 1064 nm laser line.

1. Introduction

The present work’s aim was to prepare a series of mixed crystals in which the trioxofluorophosphate anion was substituted by the phosphite anion in different ratios. The mixed crystals with trioxofluorophosphate and phosphite anions were observed in a few cases [1]. In these structures, the oxygens of the trioxofluorophosphate and phosphite anions occupy the same positions while the P-F and P-Hhydrido are nearly parallel with the same orientation. The searches in the Cambridge Structural Database [2] as well as in the Inorganic Crystal Structure Database (2022) [3] have revealed that no other mixed phosphites and trioxofluorophosphates were included in either of these databases since 2012.
The structure of bis(guanidinium) trioxofluorophosphate was determined at 180 K [4]; the structure was assigned the refcode XOMQAR in the Cambridge Structural Database [2] (version 5.43 with updates until September 2022). Since this structure was non-centrosymmetric achiral [5], we expected that the series of title structures with phosphite anions might also be non-centrosymmetric. We also hoped that they might possess comparatively interesting non-linear optical (NLO) properties analogous to the structure of carbamoylguanidinium hydrogen phosphite [6,7], which also forms mixed crystals with the trioxofluorophosphate anion in all concentration ratios [1]. Trioxofluorophosphate anion [PO3F]2- has a large hyperpolarizability which makes it a candidate for synthesis of new materials suitable for the second harmonic generation [8]. Some of the trioxofluorophosphate structures turned out to be promising NLO materials such as (NH4)2PO3F (diammonium trioxofluorophosphate), NaNH4PO3F.H2O (sodium ammonium trioxofluorophosphate monohydrate) and already mentioned bis(guanidinium) trioxofluorophosphate [8].
In this paper, which also extends our previous studies of promising inorganic salts of guanidine [9,10], we report the preparation, crystal structure determination and spectroscopic and NLO properties of a series including bis(guanidinium) trioxofluorophosphate—compound (I), mixed crystals bis(guanidinium) trioxofluorophosphate-phosphite—compounds (II)–(IV) and bis(guanidinium) phosphite—compound (V). In addition, our attention was focused on examining the expected effect of a variable content of [PO3F]2− and [PO3H]2− anions in the title structures on SHG efficiency.

2. Materials and Methods

2.1. Synthesis and Crystallization

Colourless transparent crystals of the title compounds were prepared by neutralization of aqueous solutions of bis(guanidinium) carbonate (Aldrich, St. Louis, MO, USA, 99%), H2PO3F and H3PO3 (Aldrich, 99%). In all the cases, the cation/anion molar ratio equalled to 1. For the title mixed crystals, the amounts of the anions were combined in molar ratios 1:0, 3:1, 1:1, 1:3 and 0:1.
Fluorophosphoric acid H2PO3F was prepared by the exchange of water-diluted (NH4)2PO3F through a column with cation-exchanging resin (Amberlite) in the H-cycle and immediately added into the aqueous solutions of bis(guanidinium) carbonate and bis(guanidinium) phosphite dropwise. The volume of the eluted solution of H2PO3F was about 50 mL. The colourless crystals were prepared from the aqueous solutions by crystallization in a desiccator over P4O10 over three weeks. Bis(ammonium) trioxofluorophosphate monohydrate (NH4)2PO3F·H2O was prepared by the method described in [11] while the product which was obtained by heating of urea, H3PO4 and NH4F was recrystallized from water. The aqueous solution of bis(guanidinium) phosphite was prepared by neutralization of the corresponding amounts of bis(guanidinium) carbonate (CH6N3)2CO3 and phosphoric acid H3PO3.
In particular, for bis(guanidinium) trioxofluorophosphate there were 0.48 g (CH6N3)2CO3 and 0.40 g (NH4)2PO3F·H2O used; for bis(guanidinium) trioxofluorophosphate-phosphite (3:1) there were 0.64 g of (CH6N3)2CO3 used, 0.40 g of (NH4)2PO3F·H2O and 0.07 g of H3PO3 used; for bis(guanidinium) trioxofluorophosphate-phosphite (1:1) there were 0.96 g of (CH6N3)2CO3, 0.40 g of (NH4)2PO3F·H2O and 0.22 g of H3PO3 used; for bis(guanidinium) trioxofluorophosphate-phosphite (1:3) there were 0.96 g of (CH6N3)2CO3, 0.20 g of (NH4)2PO3F·H2O and 0.32 g of H3PO3 used; for bis(guanidinium) phosphite there were 1.10 g of (CH6N3)2CO3 and 0.5 g of H3PO3 used. It seems that the title crystals are highly soluble in water because they started to crystallize in quite a reduced volume of the solution which was estimated to be about 5 mL. Hereafter the title compounds will be referred as (I), (II), (III), (IV), and (V) in correspondence with the decreasing content of trioxofluorophosphate anion [PO3F]2−.

2.2. Structure Determination and Refinement

The intensity data were collected on a SuperNova dual (Cu at zero point) diffractometer (Agilent Technologies, Oxfordshire, UK) equipped with an Atlas S2 CCD detector. The absorption correction was carried out by the analytical method based on the knowledge of the sample shape except for the phosphite where the multi-scan method was applied. The applied software for data collection and reduction was [12]. The structures were solved by [13] and refined by [14]. It should be noted that the software used [14] does not refine the weighting scheme. It uses experimentally obtained reflection weights. The calculated goodness-of-fit S bears its original meaning, indicating the amount of information available in data with respect to the information provided by the structural model. The extinction correction was carried out by the method [15]. It turned out that the structural data of the pure trioxofluorophosphate, (I), were somewhat worse. Therefore, the indicator wR(F2) is somewhat worse than that in other title structures. The weighting scheme of (I) also differs from the other title structures (Table 1). All the hydrogens in the title structures were clearly discernible in the difference electron density map except for the hydrido hydrogen, which belonged to molecule H3PO3 in the mixed crystals. The displacement parameters of the primary amine hydrogens were constrained to Uiso(Hprimary amine) = 1.2Ueq (Nprimary amine). Since the hydrido hydrogens could not be clearly resolved in the difference electron density maps of the mixed crystals (Figure 1) the following model was adopted: The P1-F1 and P2-F2 distances were restrained to 1.574 and 1.576 Å, respectively, with the weight [16] equal to 0.001 Å for both distances. These values were taken from the refinement of the title structure of bis(guanidinium) trioxofluorophosphate. The positional parameters of the hydrido hydrogens were restrained by the distance restraints P1-H1 and P2-H2 equal to the respective values 1.28 and 1.31 Å with the weight equal to 0.01 Å. The latter distance values were taken from the refinement of the title structure of bis(guanidinium) phosphite. The distance restraints were necessary to obtain a reasonable model because in the mixed crystals of bis(guanidinium) trioxofluorophosphate-phosphite (0.716/0.284), bis(guanidinium) trioxofluorophosphate-phosphite (0.501/0.499), and bis(guanidinium) trioxofluorophosphate-phosphite (0.268/0.732) the unrestrained refinement of F1/H1 and F2/H2 atoms yielded the respective P1-F1 distances 1.560(3), 1.538(3), 1.478(8) Å and the respective P1-F2 distances 1.5606(16), 1.553(2) and 1.529(7) Å.
The occupational parameters of F1 and H1 as well as F2 and H2 were refined under the condition that the sum of these occupancies equalled to 1. The refined values of the occupational parameters F1|F2 converged to the respective values 0.744(7)|0.687(7); 0.507(7)|0.494(6); 0.270(9)|0.265(9), which corresponded to the mixed crystals with the proportion of the trioxofluorophosphate in descending order. (The given values in the formula are the average of the occupations pertinent to each site; the content of the phosphite is the complement to 1.) The positional parameters of the primary amine hydrogens were restrained by the distance 0.88 Å with the weight equal to 0.02 Å. The values of the Flack parameters for each of the title structures indicated that all the samples were inversion-twin monodomain crystals. The structures of bis(guanidinium) trioxofluorophosphate and bis(guanidinium) trioxofluorophosphate-phosphite (0.732/0.268) have inverted coordinates (1 − x, 1 − y, 1 − z) regarding bis(guanidinium) trioxofluorophosphate-phosphite (0.501/0.499) and bis(guanidinium) trioxofluorophosphate-phosphite (0.284/0.716) and bis(guanidinium) phosphite in order to maintain the Flack parameter approximating to 0.0 in all the title structures.
The aryl and the methyl H atoms were constrained with the Caryl-H = 0.93, Cmethyl-H = 0.96 and Cmethine-H = 0.98 Å and Uiso(Haryl/methine) = 1.2Ueq(Caryl/methine), and Uiso(Hmethyl) = 1.5Ueq(Cmethyl). The positional parameters of the secondary amine H atoms H1na and H1nb were refined freely while Uiso(Hsecondary amine) = 1.2Ueq(Nsecondary amine). The details regarding the X-ray diffraction experiment and the refinement are given in Table 1 and Table 2. The employed graphical programs were PLATON [17] and DIAMOND [18]. The Hirshfeld surfaces (see reference [19]) were visualized by [20].
Supplementary publications CCDC 2211221–2211225, for bis(guanidinium) trioxofluorophosphate/phosphite in the ratio 1/0, 0.716/0.284, 0.501/0.499, 0.268/0.732, 0/1, respectively, contain crystallographic data for this paper. These data can be obtained free of charge from the Cambridge Crystallographic Data Centre via www.ccdc.cam.ac.uk/data_request/cif.

2.3. Vibrational Spectroscopy

Infrared spectra were recorded using the DRIFT (Diffuse Reflectance Infrared Fourier Transform) spectroscopic technique (samples mixed with KBr at 1:50 ratio and ground in agate mortar) on a Thermo Scientific (Madison, WI, USA) Nicolet 6700 FTIR spectrometer with 2 cm−1 resolution and Happ-Genzel apodization in the 400–4000 cm−1 region.
The Raman spectra of the title salts were taken on many unoriented small crystals (size about 0.1 mm) which were separated from the crucible. The spectra were recorded on a Thermo Scientific (Madison, WI, USA) DXR Raman Microscope interfaced to an Olympus (Olympus Optical Co. Ltd., Tokyo, Japan) microscope (objectives 10× and 50×) using a depolarized 780 nm frequency-stabilized single mode laser (10 mW laser power, 45–3410 cm−1 spectral range, 400 lines/mm grating). The spectrometer was calibrated using a software-controlled calibration procedure employing multiple neon emission lines (wavelength calibration), multiple polystyrene Raman bands (laser frequency calibration) and standardized white light sources (intensity calibration). The Raman spectra samples were also collected on a dispersive confocal Raman microscope MonoVista CRS+ (Spectroscopy &Imaging GmbH, Warstein, Germany) interfaced to an Olympus microscope (objectives 20× and 50×) using a 785 nm diode excitation laser (10 mW laser power, 40–3800 cm−1 spectral range, 300 lines/mm grating). The spectrometer was wavelength- and intensity-calibrated using a software-controlled auto-alignment and calibration procedure with mercury and Ne-Ar lamps.

2.4. Second Harmonic Generation

The second harmonic signal was studied on powder samples of each compound using the Kurtz-Perry powder technique [21] with potassium dihydrogen phosphate (KDP) as a reference material. As a light source BMI (Evry, France) Q-switched Nd-YAG laser (1064 nm, ~6 ns pulses of 2 mJ, 20 Hz repetition rate) was used and the filtered second harmonic signal at 532 nm was detected by a photomultiplier and a boxcar averager.

3. Results

3.1. Crystal Structure

Information regarding the crystal data and the refinement of the title crystal-chemically isotypic structures [22] is given in Table 1 and Table 2. The refinement of the data which was extracted from CIF of XOMQAR regarding the structure determination of bis(guanidinium) trioxofluorophosphate [3] confirmed that the previous structure determination referred to the same phase as it is described in this article.
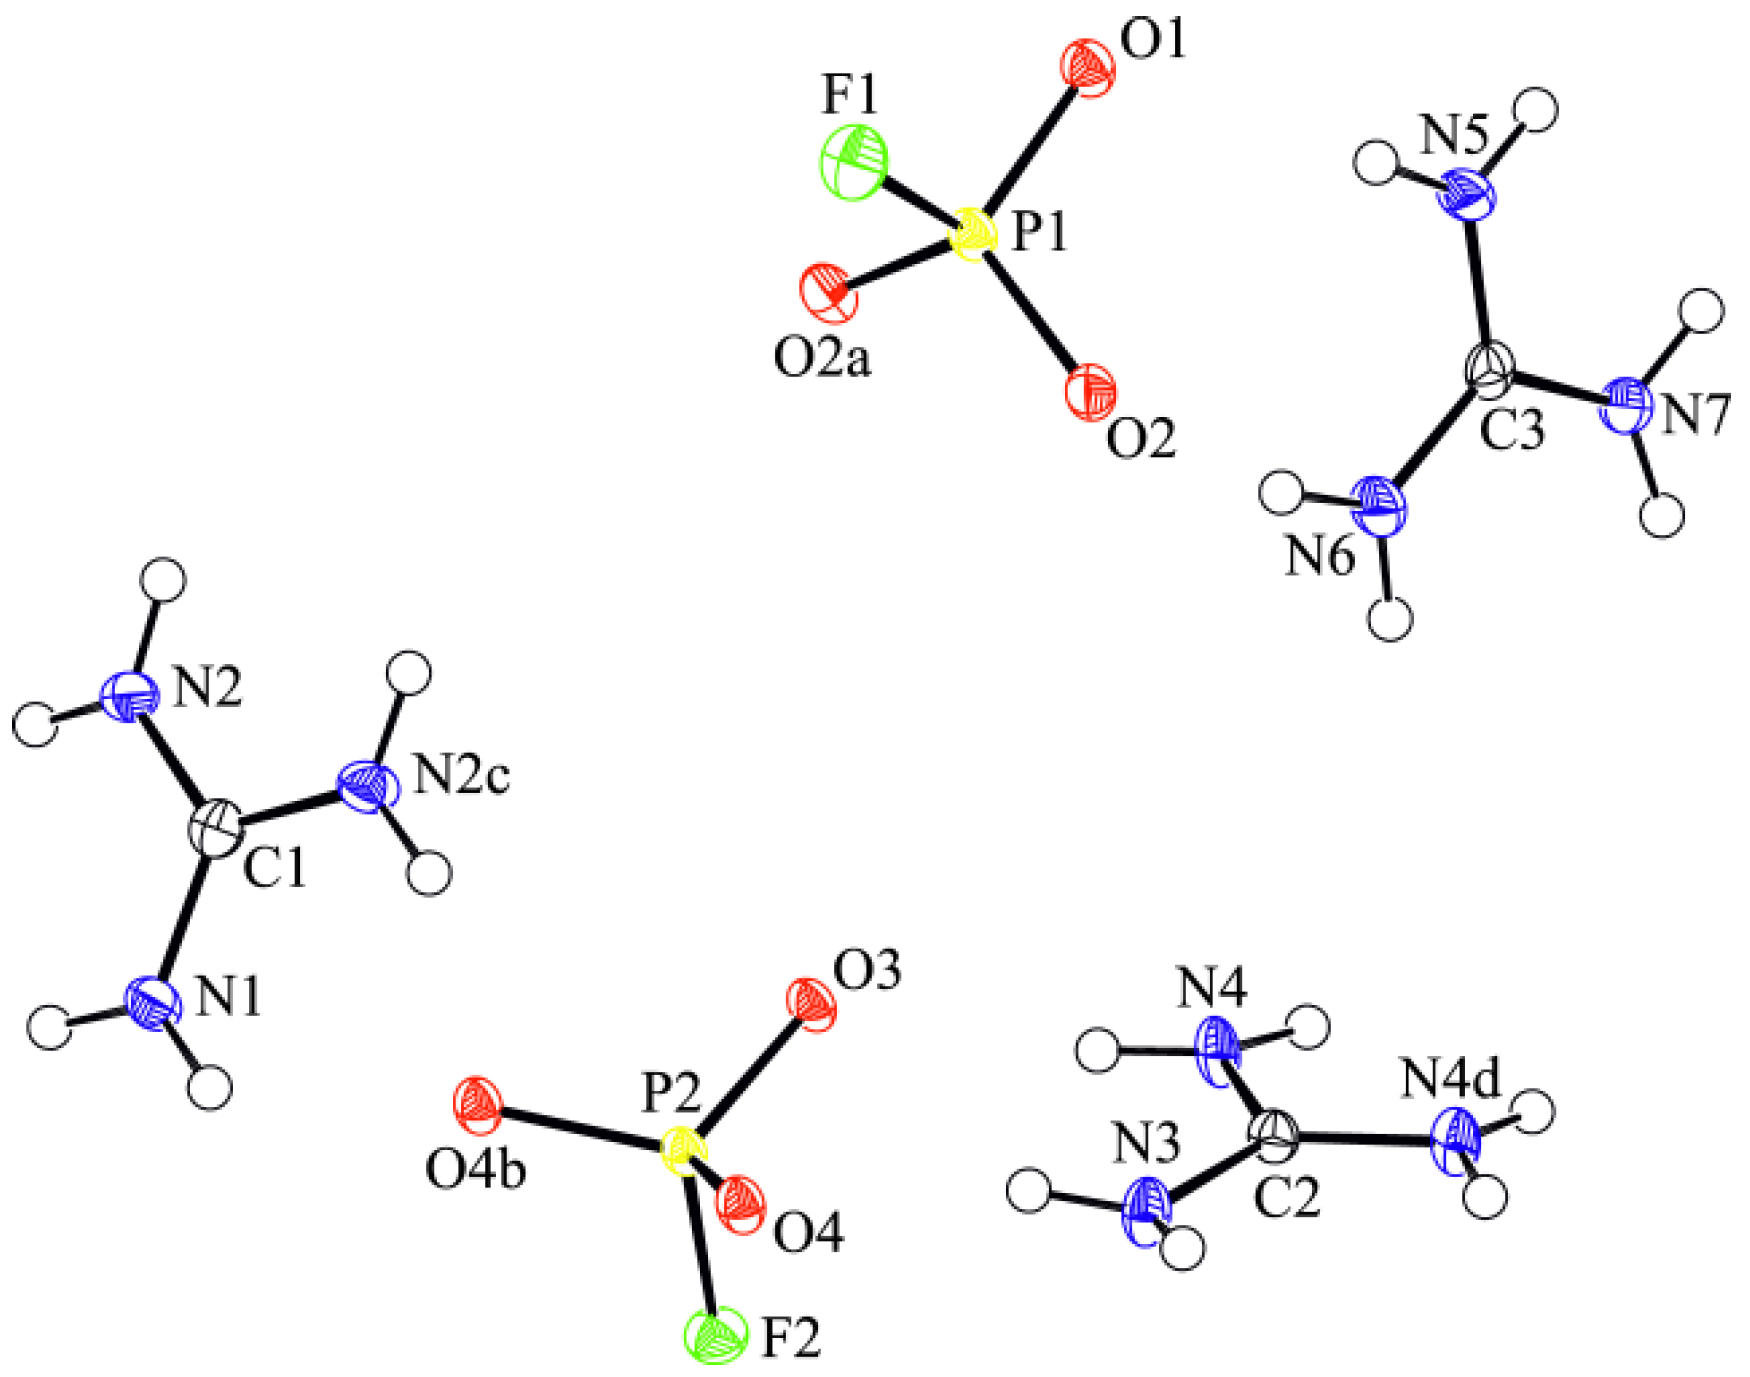
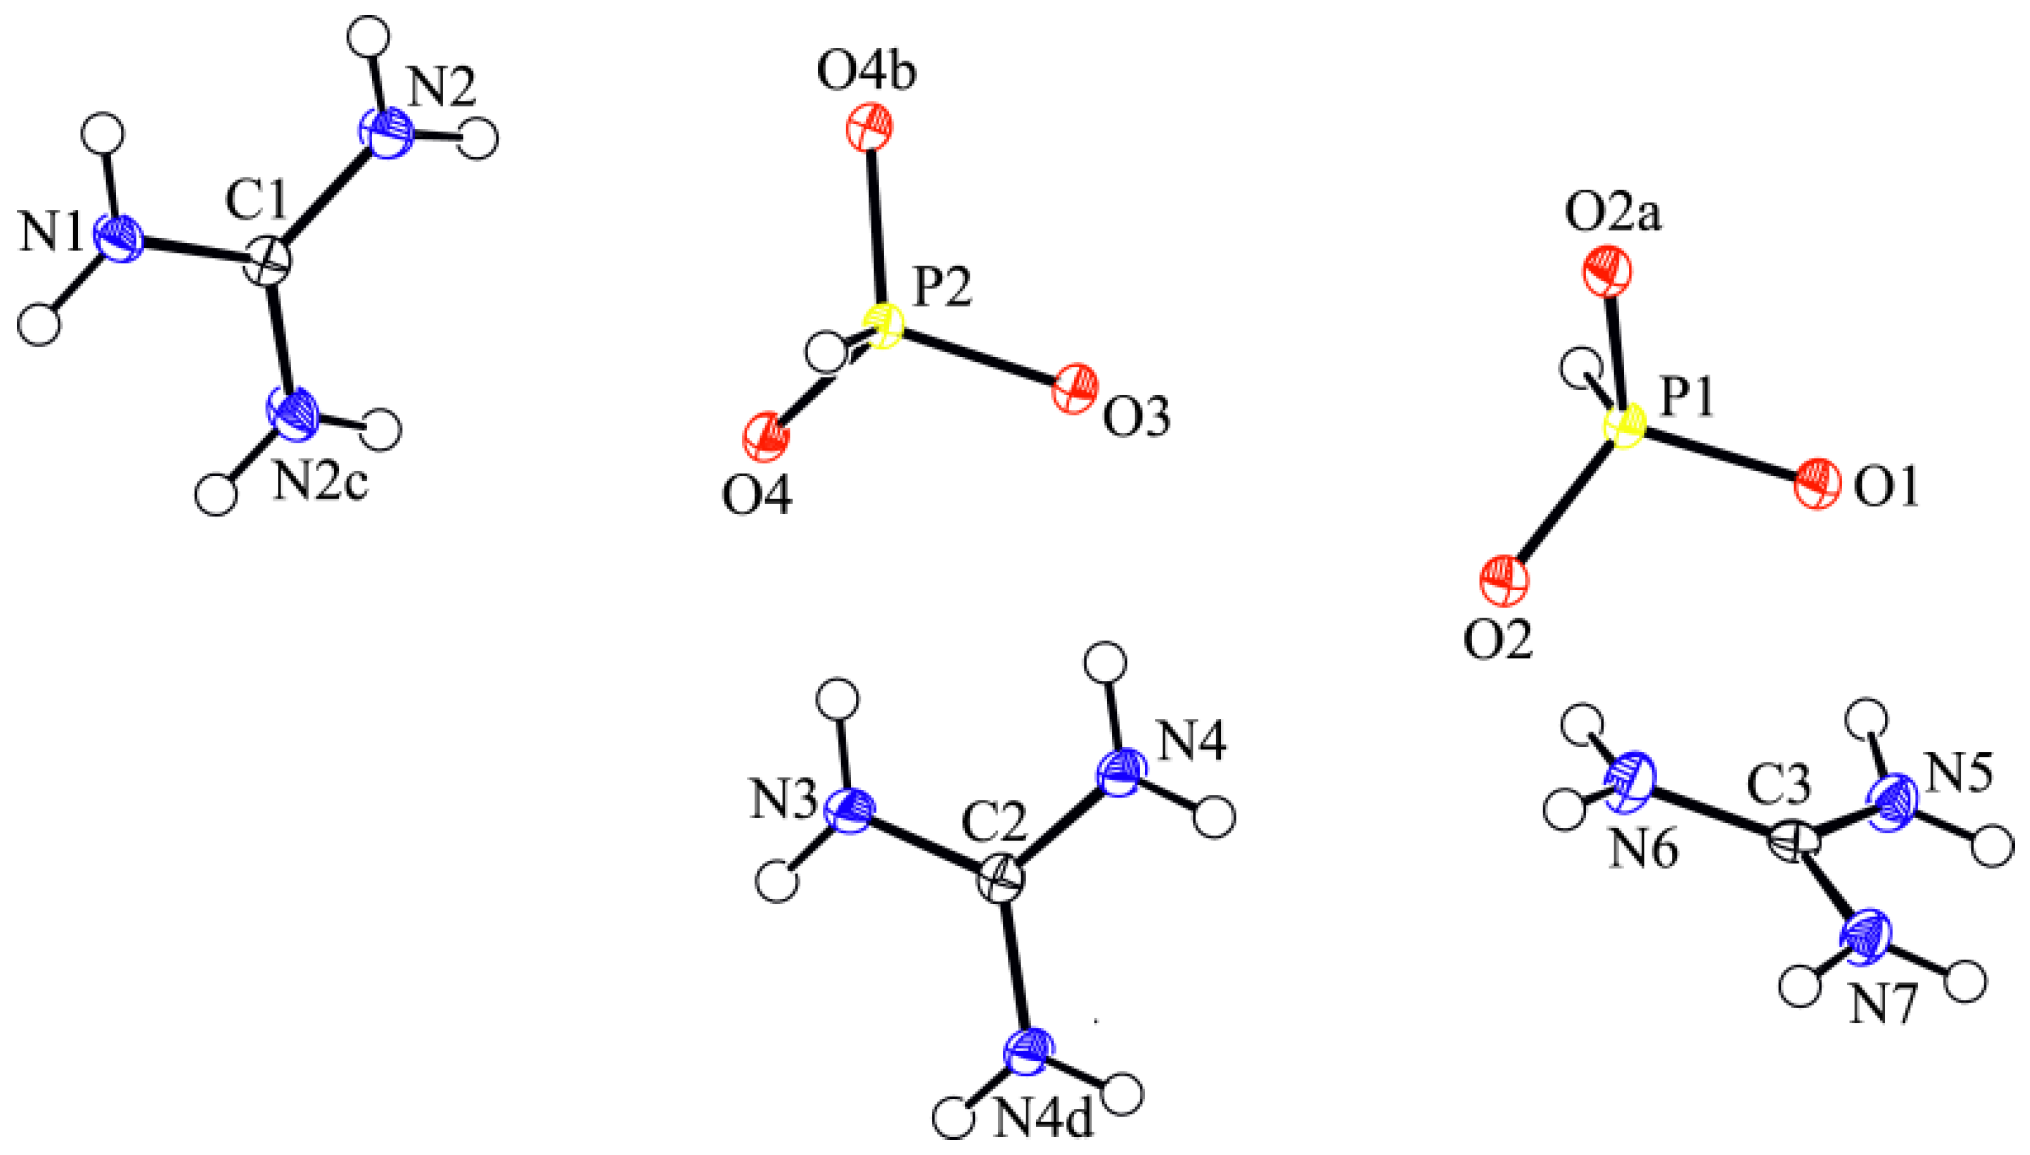
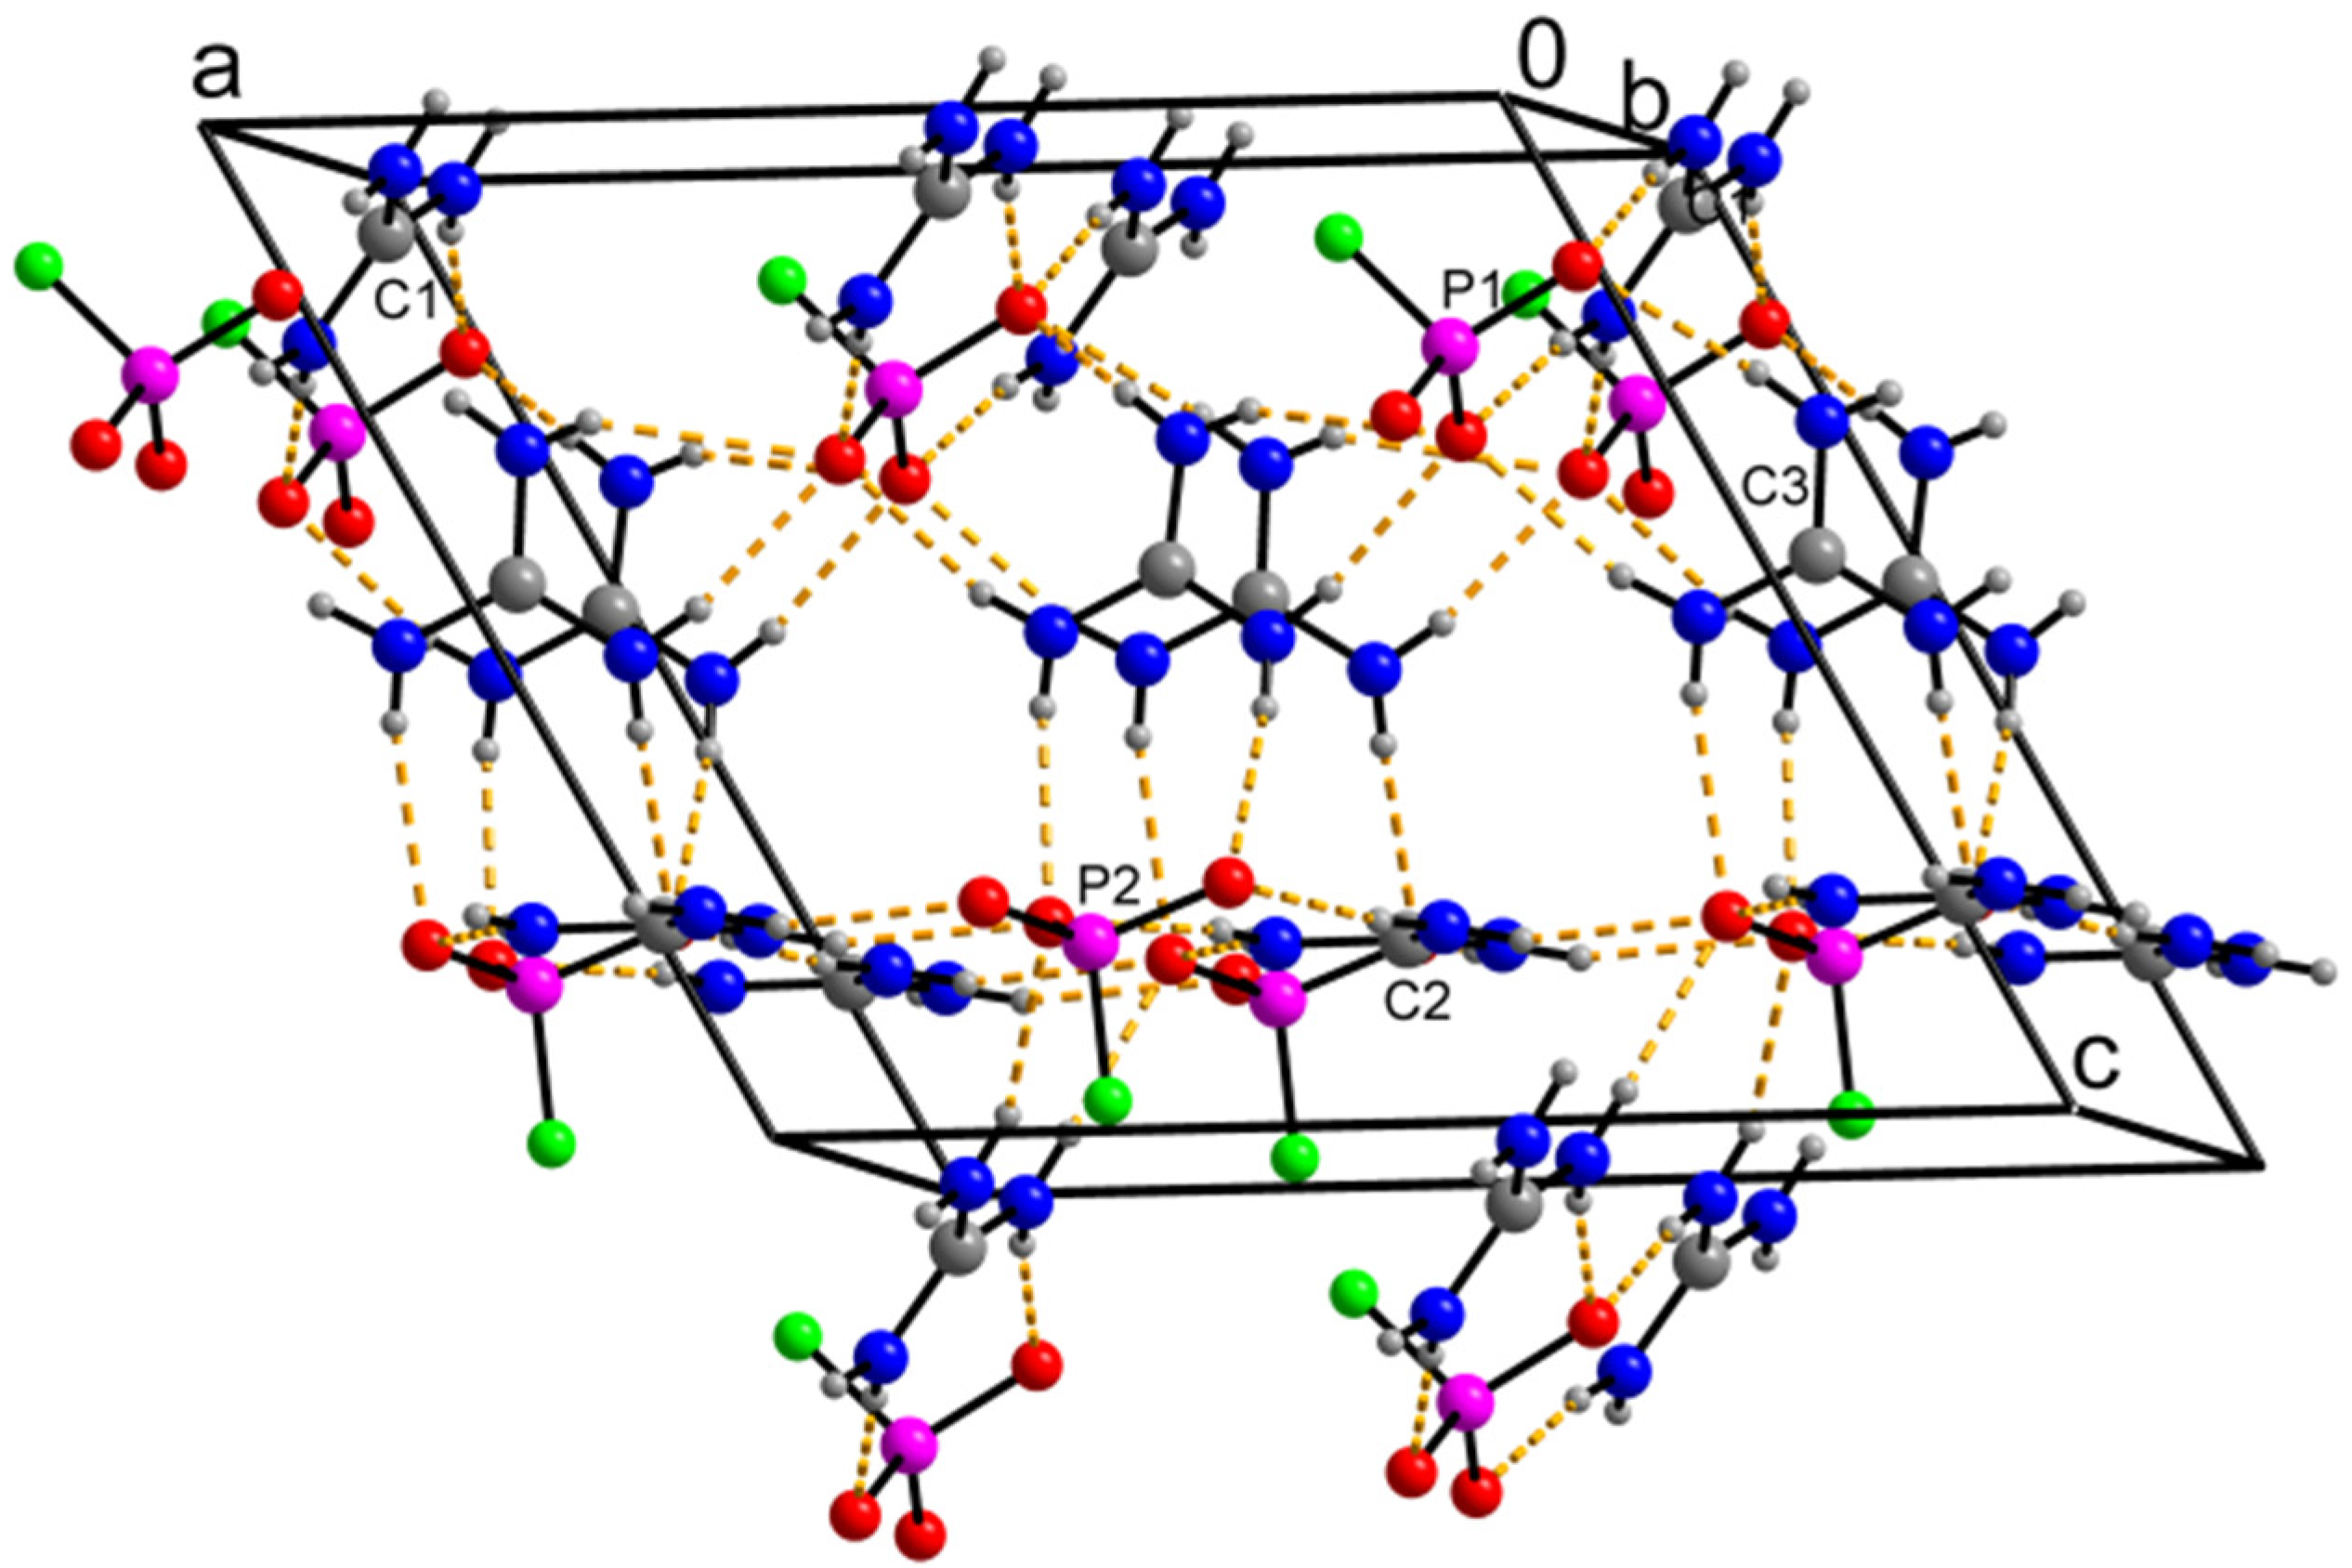
Each of the title structures consists of three symmetry-independent guanidinium cations and two symmetry-independent anions (trioxofluorophosphate or phosphite). The anions are situated in special positions, i.e., on the symmetry planes (the Wyckoff position 2a). Two of the symmetry-independent cations, i.e., those with C1 and C2 atoms, as well as both anions, are situated in a special position (the Wyckoff position 2a), too. The guanidinium cation centered on C3 is in a general position 4b. The molecules are shown in Figure 2 and Figure 3 and in the Figures S1–S3, Supplementary Materials. Figure 4 shows the packing of the title molecules in bis(guanidinium) trioxofluorophosphate.
As in the previous structure determinations of the mixed trioxofluorophosphates and phosphites, the respective P and O atoms of the latter molecules occupy the same positions. On the other hand, the fluorine and the hydrido hydrogen atoms are oriented in the same direction, while P-F and P-Hhydrido bonds are nearly parallel. In the title structures of the mixed crystals, the electron density along the P-F direction is smeared, and the hydrido hydrogen is not observable (Figure 1). Interestingly, in the title mixed crystals, the maxima of the electron density of the P-F/Hhydrido region are shifted towards each P atom compared to the pure trioxofluorophosphate. Thus, chemically reasonable models could be obtained by the refinement with the restrained P-F and P-Hhydrido distances (see the section of this article which describes the refinement).
The lattice parameter b is almost unaffected by the substitution of the trioxofluorophosphate by the phosphite. This observation agrees with the fact that the P-F or P-Hhydrido are almost perpendicular to the unit-cell axis b.
The molecules are interconnected by N-H⋯O hydrogen bonds of moderate strength [23]. The hydrogen bonds are listed in Table 3, which shows the contraction of the donor-acceptor bond lengths towards the phosphite end of the series with two exceptions for N6-H1n6⋯O2 and N7-H1n7⋯O3v. Cf. P-O bond lengths, which are about 0.2 Å shorter in the trioxoflourophosphate than in the phosphite anion. The comparison of the other bond lengths is listed in Table S1, Supplementary Materials.
The most common graph set motifs [24] are R 2 2 ( 8 ) in which all the cations are involved: C1-N1-H1n1⋯O2ii-P1vi-O1vi⋯H1n2i-N2i; C1-N2-H1n2⋯O1iii-P1iii-O2iii-H1n1i-N1; C2-N4i-H1n4i-O3-P2vii-O4i-H1n3-N3; C2-N4-H2n4-O4iv-P2v-O4v-H2n4i-N4i; C2-N3-H1n3i -O4-P2-O3-H1n4-N4; C3-N6-H2n6-O4iv-P2iv-O3⋯H1n7-N7; C3-N6-H1n6-O2-P1-O1- H2n5-N5 with the symmetry codes (i) x, 1 − y, z; (ii) 1 + x, 1 − y, z; (iii) 1 + x, y, z; (iv) −1/2 + x, 1/2 –y, z; (v) −1/2 + x, 1/2 + y, z; (vi) 1 + x, 1 + y, z; (vii) x, 1 + y, z.
Moreover, there are also present graphs set motifs R 2 1 ( 6 ) for C3-N5-H1n5…O2v…H2n7-N7 as well as R 4 2 ( 10 ) C1viii-N2viii-H2n2viii⋯O4⋯H1n3i-N3 -H1n3⋯O4i⋯H2n2ix-N2ix with the symmetry codes (viii) x, y, 1 + z, (ix) x, 1 − y, 1 + z.
Fluorine in the title trioxofluorophosphates (Figure 4) avoids hydrogen bonding, as was observed previously. This phenomenon is similar to that observed in C-F bonded fluorine [25,26] and can be generalized to other fluorine-containing molecules with oxygen ligands [27]. The closest interatomic distances to the fluorines or the hydrido hydrogens are given in Table 4. The fingerprints of the Hirshfeld surface with w(r) = 0.5 [19,20,28] neatly illustrate the prevailing N-H⋯O intermolecular interactions over F⋯H and Hhydrido in bis(guanidinium) trioxofluorophosphate as well as in bis(guanidinium) phosphite (Figure 5 and Figure S4, Supplementary Materials).

3.2. Vibrational Spectroscopy

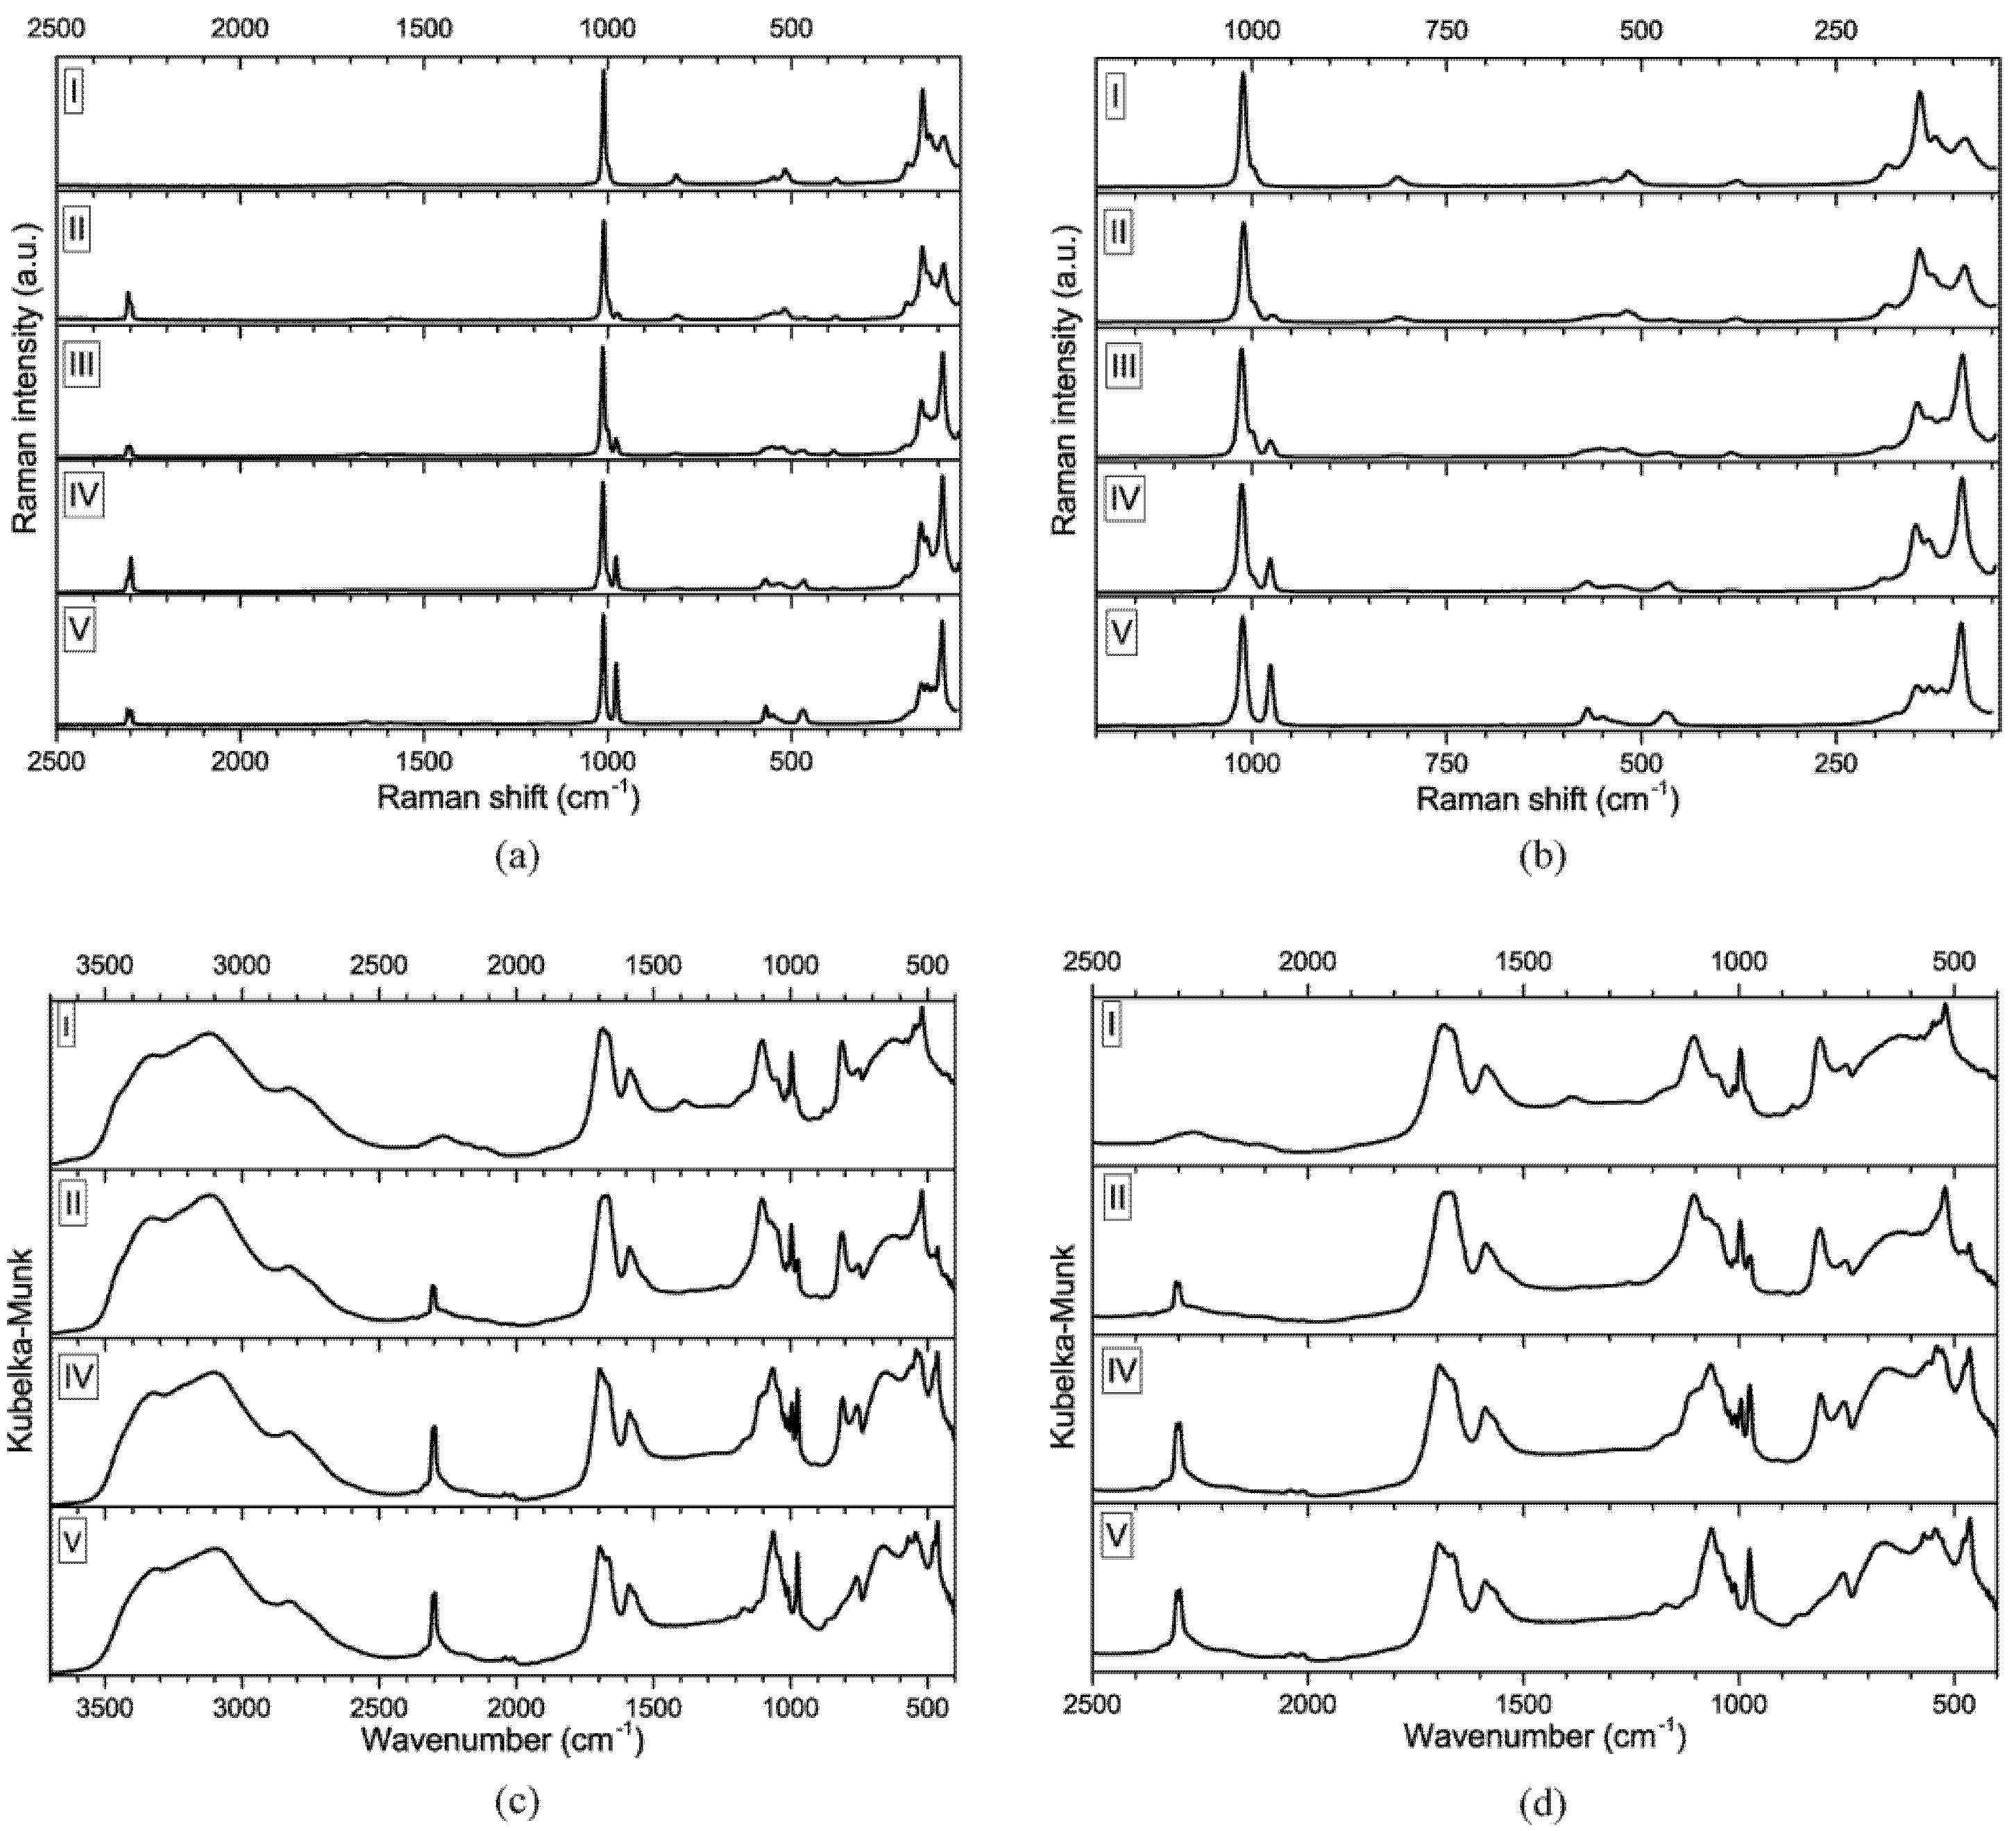
The FTIR and the Raman spectra of compounds (I)–(V), which were recorded at room temperature, are presented in Table 5 and depicted in Figure 6a–d. Unfortunately, the compound (III)—Gu2(PO3F)0.501 (HPO3)0.499—was not prepared in a sufficient amount for the infrared spectra collection by DRIFT technique; therefore, it is missing in Table 5 as well as in Figure 6c,d.
The number of the normal modes in all the title salts was determined by the extended nuclear site group analysis [29]. All the crystals belong to the monoclinic system with Cm ( C s 3 ) space group and contain 30 atoms per asymmetric units (Z = 4). Twenty atoms occupy the Wyckoff position 4b (C1), while 10 atoms occupy the Wyckoff position 2a (Cs). The asymmetric unit contains three guanidinium(1+) cations and two anions—phosphites [HPO3]2−, trioxofluorophosphates [PO3F]2− or their mixture according to their variable proportion. The symmetry analysis of the optical vibrational modes yielded 60A′ + 60A″ representations for the internal modes and 28A′ + 29A″ representations for the external modes (see Table S2, Supplementary Materials). The correlation diagrams concerning guanidinium cations, occupying 1 (C1) and m (Cs) sites, trioxofluorophosphate and phosphite anions, which occupy m (Cs) sites, are presented in Table S3a–c, Supplementary Materials. However, the well-resolved Davydov splitting (see Tables S2 and S3, Supplementary Materials) was not observed in the recorded IR and Raman spectra of the prepared salts, except for a doublet at ~2306 cm−1 and ~2300 cm−1, which will be discussed below.
A detailed assignment of the recorded bands is given in Table 5. It is based on previous studies of guanidine salts [9,10], trioxofluorophosphates [30,31,32,33] and phosphites [34,35,36,37,38,39,40] as well as on the present structure determinations. The assignment of the bands of the stretching and out-of-plane bending vibrations of the N-H bonds (see Table 5) involved in the hydrogen interactions is based on the correlation curves [41], which concern a vibrational band position and the corresponding hydrogen bond lengths.
The overall character of the recorded vibrational spectra is in accordance with the expected vibrational manifestations of the hydrogen-bonded salts containing guanidinium cations and phosphite and/or trioxofluorophosphate anions. The following paragraphs summarise and highlight selected aspects observed in the spectra.
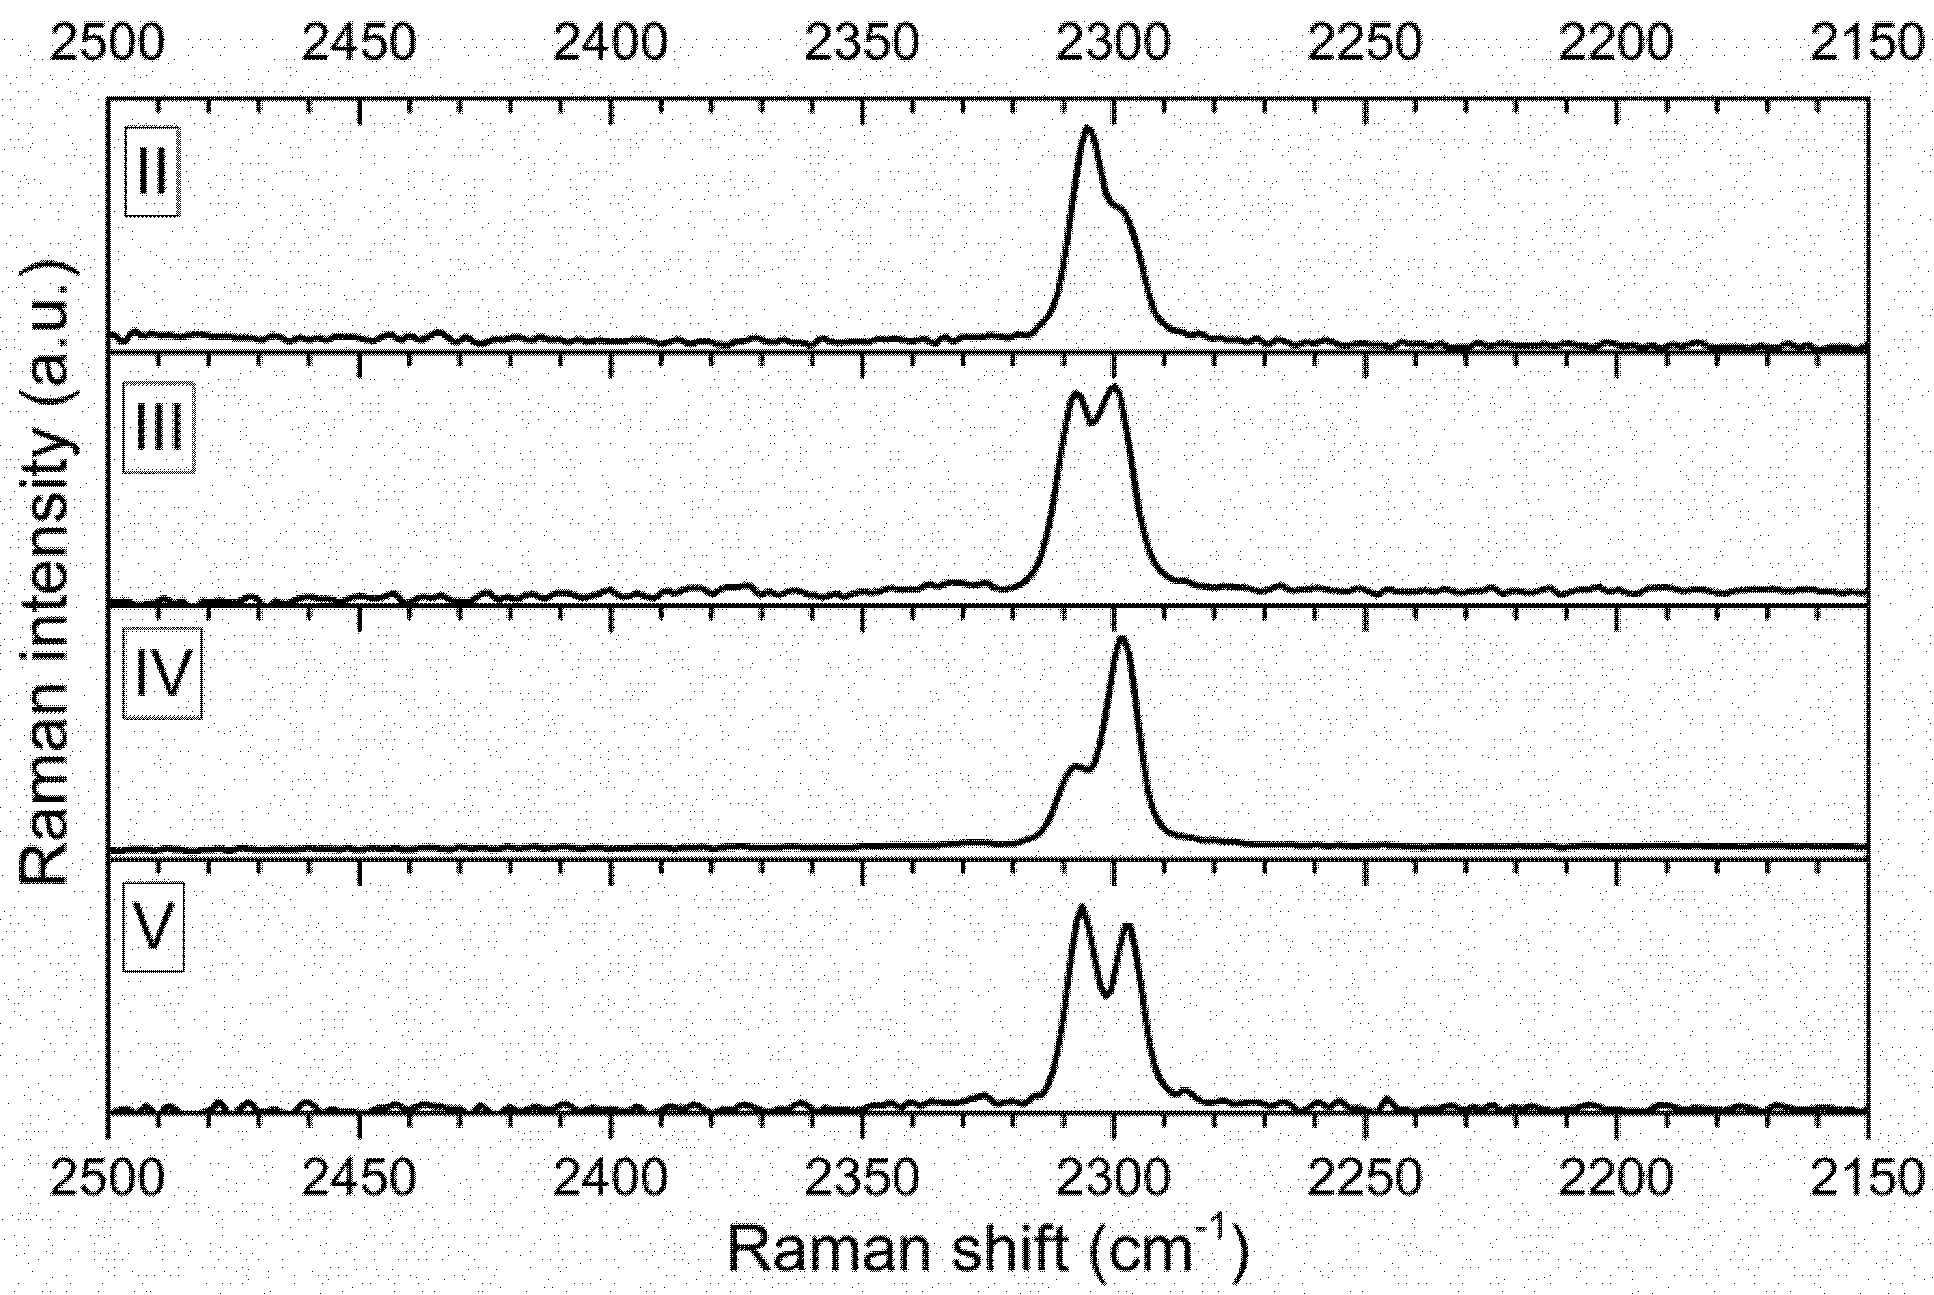
The Raman spectra of all the compounds are dominated by very strong bands of symmetric stretching vibrations of guanidinium (CN3) skeleton at ~1010 cm−1 and by strong bands of external modes located below 200 cm−1. The increasing proportion of the phosphite anion in compounds (II)–(V) is reflected by the increasing intensity of the bands of symmetric stretching PO3 vibrations at ~975 cm−1 as well as by changes in the intensities and the band area ratio concerning the doublet (~2306 and ~2300 cm−1) of the P-H stretching vibrations. The changes in the intensities of the bands forming this doublet, i.e., comparison of the relative band areas, are listed in Table 6 and depicted in Figure 7. It is obvious that the increasing proportion of the phosphite anion in compounds (II)–(IV) leads to the increase of the intensity of the band at ~2306 cm−1 and simultaneously to the decrease of the intensity of the band at ~2300 cm−1. Surprisingly, the ratio of band areas of this doublet of the compound (III) is similar to that of in the compound (V), i.e., in the pure phosphite compound. The formation of such a doublet (present in both Raman and IR spectra) could be explained by the Davydov splitting of the vibrational bands due to the presence of more formula units in the unit cell or by the Fermi resonance with some overtone or a combination mode. Similar splitting of ν P-H band was also observed in previously studied organic phosphites [42,43].
Strong, wide and structured bands (3500–2600 cm−1 region) of stretching vibrations of NH2 groups involved in N-H...O hydrogen bonds dominate the IR spectra of all the compounds. The increasing proportion of the phosphite anions in compounds (II), (IV) and (V) is indicated by the increasing intensity of the bands of stretching P-H vibrations (doublet at ~2305 and ~2300 cm−1), symmetric stretching (~975 cm−1) and bending (~465 cm−1) vibrations of PO3 groups while a decrease in intensity or disappearance of the bands characteristic for trioxofluorophosphate anions—e.g., bands at 1104, 997 and 811 cm−1—is observed.

3.3. Second Harmonic Generation

Basic measurements of the relative SHG efficiency of the title series of compounds show that the efficiency of the powdered samples is below the KDP standard (1064 nm laser irradiation). The resulting values of relative second harmonic signal intensity I(2ω) with frequency 2ω equalled 0.6, 0.45, 0.4, 0.35 and 0.3 I(2ω)(KDP) for the series of compounds (I)–(V), respectively. This means that the efficiency of SHG in the title compounds grows with the proportion of the trioxofluorophosphate anions.

4. Conclusions

The title structure is a new example of a series of isostructural compounds with mixed trioxofluorophosphate and the phosphite anions which were thus far rarely observed. The N-H...O hydrogen bonds with prevailing R 2 2 ( 8 ) graph set motifs are the most important intermolecular interactions in the title structures. Fluorine, as it is common in trioxofluorophosphates, is a poor hydrogen-bond acceptor.
The overall character of the recorded FTIR and Raman spectra agrees with crystal structure determinations. Both types of the vibrational spectra are sensitive to the composition of the title structures.
Relative efficiency of SHG (1064 nm laser irradiation) in the series of the title compounds grows with the proportion of [PO3F]2− anions. This result confirms the potential of the trioxofluorophosphate anion in the crystal engineering of novel molecular NLO materials.

Supplementary Materials

The following supporting information can be downloaded at: https://www.mdpi.com/article/10.3390/cryst12121694/s1, Figure S1: Atom numbering of bis(guanidinium) trioxofluorophosphate-phosphite (0.716/0.284)—compound (II). The symmetry codes for the atoms O2a and O4b: x, 2 − y, z; for the atoms N2c and N4d: x, 1 − y, z. The anisotropic displacement parameters are shown at the 50% probability level. Applied colours: C—black, N—blue, O—red, H—black contour, P—yellow, F—green. The Figure was prepared by [17].; Figure S2: Atom numbering of bis(guanidinium) trioxofluorophosphate-phosphite (0.501/0.499)—compound (III). The anisotropic displacement parameters are shown at the 50% probability level. The symmetry codes for the atoms O2a and O4b: x, −y, z; for the atoms N2c and N4d: x, 1 − y, z. Applied colours: C—black, N—blue, O—red, H—black contour, P—yellow, F—green. The Figure was prepared by [17].; Figure S3: Atom numbering of bis(guanidinium) trioxofluorophosphate-phosphite (0.268/0.732)—compound (IV). The anisotropic displacement parameters are shown at the 50% probability level. The symmetry codes for the atoms O2a and O4b: x, −y, z; for the atoms N2c and N4d: x, 1 − y, z. Applied colours: C—black, N—blue, O—red, H—black contour, P—yellow, F—green. The Figure was prepared by [17].; Figure S4: Two dimensional fingerprint plots (di, de) of the Hirshfeld surface of various intermolecular interactions. Left column for bis(guanidinium) trioxofluorophosphate—compound (I); right column: bis(guanidinium) phosphite—compound (V); cations (a): O-H interactions; (b): N-H interactions; anions (c): O-H interactions. The Figure was prepared by [20]. Figure S4: Two-dimensional fingerprint plots (di, de) of Hirshfeld surface of various intermolecular interactions. Continued. Left column for bis(guanidinium) trioxofluorophosphate—compound (I); right column: bis(guanidinium) phosphite—compound (V); (d): H-H interactions; (e): F-H interactions only for compound (I). The Figure was prepared by [20]. Table S1: Selected bond distances (Å) and angles in (°) in bis(guanidinium) trioxofluorophosphate/phosphite in the ratio 1/0 (I), 0.716/0.284 (II), 0.501/0.499 (III), 0.268/0.732 (IV), 0/1 (V). Table S2: The results of the nuclear site group analysis for (I)–(V) crystals.; Table S3: Correlation diagrams of (a) and (b) gu+ internal modes in title crystals, site symmetry C1 and site symmetry Cs, respectively; (c) PO3F2- and HPO32- internal modes in crystals, site symmetry Cs.

Author Contributions

Conceptualization, I.M., J.F. and I.N.; methodology, I.M., J.F., V.E., M.D., J.K. and I.N.; investigation, I.M., J.F., V.E., M.D.; resources, I.M., J.F. and I.N.; writing—original draft preparation, I.M., J.F., M.D. and I.N.; writing—review and editing, I.M., J.F. and I.N.; visualization, I.M., J.F. and I.N.; supervision, I.M., J.F. and I.N. All authors have read and agreed to the published version of the manuscript.

Funding

Financial support from the Ministry of Education Youth and Sports, CUCAM Centre of Excellence, (OP VVV “Excellent Research Teams” project No. CZ.02.1.01/0.0/0.0/15_003/0000417) is gratefully acknowledged. The crystallographic experiments used the CzechNanoLab Research Infrastructure were supported by MEYS CR (LM2018110).

Data Availability Statement

The data presented in this study are available on request from the corresponding author.

Conflicts of Interest

The authors declare no conflict of interest.

References

  1. Fábry, J.; Fridrichova, M.; Dušek, M.; Fejfarová, K.; Krupková, R. Mixed crystals of 2-carbamoylguanidinium with hydrogen fluorophosphonate and hydrogen phosphite in the ratios 1:0, 0.76 (2):0.24 (2) and 0.115 (7):0.885 (7). Acta Crystallogr. Sect. C Cryst. Struct. Commun. 2012, 68, o76–o83. [Google Scholar] [CrossRef] [PubMed]
  2. Groom, C.R.; Bruno, I.J.; Lightfoot, M.P.; Ward, S.C. The Cambridge Structural Database. Acta Crystallogr. Sect. B Struct. Sci. 2016, 72, 171–179. [Google Scholar] [CrossRef] [PubMed]
  3. Databases, I.C.S. Version 2017-1. Fachinformationzentrum Karlsruhe, Germany, and the U.S. Department of Commerce on the behalf of the United States 2017. Available online: https://icsd.products.fiz-karlsruhe.de/ (accessed on 10 October 2022).
  4. Prescott, H.A.; Troyanov, S.I.; Kemnitz, E. The crystal structures of the potassium hydrogen monofluorophosphates, KHPO3F and K3[H(PO3F)2], and the α modification of RbHPO3F. Z. Krist.—Cryst. Mater. 2003, 218, 604–611. [Google Scholar] [CrossRef]
  5. Flack, H.D. Chiral and Achiral Crystal Structures. Helvet. Chim. Acta 2003, 86, 905–921. [Google Scholar] [CrossRef]
  6. Fridrichová, M.; Kroupa, J. Spontaneous noncollinear second harmonic generation in GUHP. J. Opt. 2011, 13, 035204. [Google Scholar] [CrossRef]
  7. Fridrichová, M.; Němec, I.; Císařová, I.; Němec, P. Guanylurea(1+) hydrogen phosphite: A novel promising phase-matchable material for second harmonic generation. CrystEngComm 2010, 12, 2054–2056. [Google Scholar] [CrossRef]
  8. Xiong, L.; Chen, J.; Lu, J.; Pan, C.-Y.; Wu, L.-M. Monofluorophosphates: A New Source of Deep-Ultraviolet Nonlinear Optical Materials. Chem. Mater. 2018, 30, 7823–7830. [Google Scholar] [CrossRef]
  9. Němec, I.; Matulková, I.; Held, P.; Kroupa, J.; Němec, P.; Li, D.; Bohatý, L.; Becker, P. Crystal growth, crystal structure, vibrational spectroscopy, linear and nonlinear optical properties of guanidinium phosphates. Opt. Mater. 2017, 69, 420–431. [Google Scholar] [CrossRef]
  10. Němec, I.; Matulková, I.; Krumbe, W.; Andersen, L.; Císařová, I.; Kroupa, J.; Němec, P.; Bohatý, L.; Becker, P. Linear and nonlinear optical properties, pyroelectricity and vibrational spectroscopy of polar guanidinium hydrogen phosphite, GuH2PO3, and hydrogen selenite, GuHSeO3. Opt. Mater. 2021, 111, 110722. [Google Scholar] [CrossRef]
  11. Schülke, U.; Kayser, R. Herstellung von Fluorophosphaten, Difluorophosphaten, Fluorophsophonaten und Fluorophosphiten in fluoridhaltigen Harnstoffschmelzen. Z. Anorg. Allg. Chem. 1991, 600, 221–226. [Google Scholar] [CrossRef]
  12. Diffraction, R.O. CrysAlisPro. Single Crystal X-ray Diffraction Data Collection and Processing Software. Available online: https://www.rigaku.com/products/crystallography/crysalis (accessed on 10 October 2022).
  13. Burla, M.C.; Caliandro, R.; Carrozzini, B.; Cascarano, G.L.; Cuocci, C.; Giacovazzo, C.; Mallamo, M.; Mazzone, A.; Polidori, G. Crystal structure determination and refinement via SIR2014. J. Appl. Crystallogr. 2015, 48, 306–309. [Google Scholar] [CrossRef]
  14. Petříček, V.; Dušek, M.; Palatinus, L. Crystallographic Computing System JANA2006: General features. Z. Krist.—Cryst. Mater. 2014, 229, 345–352. [Google Scholar] [CrossRef]
  15. Becker, P.J.; Coppens, P. Extinction within the limit of validity of the Darwin transfer equations. I. General formalism for primary and secondary extinction and their applications to spherical crystals. Acta Crystallogr. A 1974, 30, 129–147. [Google Scholar] [CrossRef]
  16. Müller, P.; Herbst-Irmer, R.; Spek, A.L.; Schneider, T.R.; Sawaya, R. Crystal Refinement. A Crystallographer’s Guide to SHELXL; Oxford University Press: New York, NY, USA, 2006. [Google Scholar]
  17. Spek, A.L. Structure validation in chemical crystallography. Acta Crystallogr. D 2009, 65, 148–155. [Google Scholar] [CrossRef] [Green Version]
  18. Brandenburg, K. Diamond Version 4.6.8; Crystal Impact GbR: Bonn, Germany, 2022. [Google Scholar]
  19. McKinnon, J.J.; Spackman, M.A.; Mitchell, A.S. Novel tools for visualizing and exploring intermolecular interactions in molecular crystals. Acta Crystallogr. Sect. B Struct. Sci. 2004, 60, 627–668. [Google Scholar] [CrossRef] [PubMed]
  20. Turner, M.J.; McKinnon, J.J.; Wolff, S.K.; Grimwood, D.J.; Spackman, P.R.; Jayatilaka, D.; Spackman, M.A. CrystalExplorer17; The University of Western Australia: Crawley, WA, Australia, 2017; Available online: https://wiki.crystalexplorer.net (accessed on 10 October 2022).
  21. Kurtz, S.K.; Perry, T.T. A Powder Technique for Evaluation of Nonlinear Optical Materials. J. Appl. Phys. 1968, 39, 3798–3814. [Google Scholar] [CrossRef]
  22. Buijs, K.; Schutte, C.J.H. The infra-red spectra el the anhydrous nitrates of some alkali and alkaline earth metals. Spectrochim. Acta 1962, 18, 307–313. [Google Scholar] [CrossRef]
  23. Gilli, G.; Gilli, P. The Nature of the Hydrogen Bond, Outline of a Comprehensive Hydrogen Bond Theory; Oxford University Press: Oxford, UK; New York, NY, USA, 2009. [Google Scholar]
  24. Etter, M.C.; MacDonald, J.C. Graph-Set Analysis of Hydrogen-Bond Patterns in Organic Crystals Acta Crystallogr. Sect. B Struct. Sci. 1990, 46, 256–262. [Google Scholar] [CrossRef]
  25. Dunitz, J.D. Organic fluorine: Odd man out. ChemBioChem 2004, 5, 614–621. [Google Scholar] [CrossRef]
  26. Dunitz, J.D.; Taylor, R. Organic Fluorine Hardly Ever Accepts Hydrogen Bonds. Chem. Eur. J. 1997, 3, 89–98. [Google Scholar] [CrossRef]
  27. Matulková, I.; Fábry, J.; Němec, I.; Císařová, I.; Vaněk, P. Migrating hydrogen in 2,4,6-triaminopyrimidinium(1+)x hydrogen trioxofluorophosphate(-)x monohydrate/2,4,6-triaminopyrimidinium(2+)1–x trioxofluorophosphate(2–)1–x monohydrate (0.0 < x < 0.73) with changing temperature. Acta Crystallogr. Sect. B Struct. Sci. 2017, 73, 1114–1124. [Google Scholar] [CrossRef]
  28. Spackman, M.A.; McKinnon, J.J. Fingerprinting intermolecular interactions in moelcular crystals. CrystEngComm 2002, 4, 378–392. [Google Scholar] [CrossRef]
  29. Rousseau, D.L.; Bauman, R.P.; Porto, S.P.S. Normal Mode Determination in Crystals. J. Raman Spectrosc. 1981, 10, 253–290. [Google Scholar] [CrossRef]
  30. Bühler, K.; Bues, W. Schwingungsspektren von Fluorophosphatschmelzen und -kristallen. Z. Anorg. Allg. Chem. 1961, 308, 62–71. [Google Scholar] [CrossRef]
  31. Nakamoto, K. Infrared and Raman Spectra of Inorganic and Coordination Compounds, Part A: Theory and Applications in Inorganic Chemistry; John Wiley and Son, Inc.: New York, NY, USA, 2009. [Google Scholar]
  32. Weil, M.; Baran, E.J.; Kremer, R.K.; Libowitzky, E. Synthesis, Crystal Structure, and Properties of Mn(PO3F)(H2O)2. Z. Anorg. Allg. Chem. 2015, 641, 184–191. [Google Scholar] [CrossRef]
  33. Weil, M.; Puchberger, M.; Baran, E.J. Preparation and Characterization of Dimercury(I) Monofluorophosphate(V), Hg2PO3F:  Crystal Structure, Thermal Behavior, Vibrational Spectra, and Solid-State 31P and 19F NMR Spectra. Inorg. Chem. 2004, 43, 8330–8335. [Google Scholar] [CrossRef]
  34. Baran, J.; Czapla, Z.; Drozd, M.K.; Ilczyszyn, M.M.; Marchewka, M.; Ratajczak, H. Polarised FTIR and Raman spectra of betaine phosphite single crystal. I. Paraelectric phase. J. Mol. Struct. 1997, 403, 17–37. [Google Scholar] [CrossRef]
  35. Bickley, R.I.; Edwards, H.G.M.; Knowles, A.; Tait, J.K.F. Vibrational spectroscopic study of the hypophosphite and phosphite anions, H2PO2 and HPO32−, and of their deuteriated analogues in the solid state and in aqueous solution. Spectrochim. Acta Part A 1994, 50, 1277–1285. [Google Scholar] [CrossRef]
  36. Fridrichová, M.; Němec, I.; Matulková, I.; Gyepes, R.; Borodavka, F.; Kroupa, J.; Hlinka, J.; Gregora, I. Vibrational spectra of guanylurea(1+) hydrogen phosphite—Novel remarkable material for nonlinear optics. Vib. Spectrosc. 2012, 63, 485–491. [Google Scholar] [CrossRef]
  37. Matulková, I.; Cihelka, J.; Pojarová, M.; Fejfarová, K.; Dušek, M.; Císařová, I.; Vaněk, P.; Kroupa, J.; Němec, P.; Tesařová, N.; et al. Molecular Crystals of 2-amino-1,3,4-thiadiazole with Inorganic Oxyacids—Crystal Engineering, Phase Transformations and NLO Properties. CrystEngComm 2014, 16, 1763–1776. [Google Scholar] [CrossRef]
  38. Matulková, I.; Cihelka, J.; Pojarová, M.; Fejfarová, K.; Dušek, M.; Vaněk, P.; Kroupa, J.; Krupková, R.; Fábry, J.; Němec, I. A new series of 3,5-diamino-1,2,4-triazolium(1+) inorganic salts and their potential in crystal engineering of novel NLO materials. CrystEngComm 2012, 14, 4625–4636. [Google Scholar] [CrossRef]
  39. Matulková, I.; Němec, I.; Císařová, I.; Němec, P.; Mička, Z. Inorganic salts of biguanide—Searching for new materials for second harmonic generation. J. Mol. Struct. 2008, 886, 103–120. [Google Scholar] [CrossRef]
  40. Tsuboi, M. Vibrational Spectra of Phosphite and Hypophosphite Anions, and the Characteristic Frequencies of PO32− and PO2 Groups. J. Am. Chem. Soc. 1957, 79, 1351–1354. [Google Scholar] [CrossRef]
  41. Lautié, A.; Froment, F.; Novak, A. Relationship between NH Stretching Frequencies and N...O Distances of Crystals Containing NH...O Hydrogen-Bonds. Spectrosc. Lett. 1976, 9, 289–299. [Google Scholar] [CrossRef]
  42. Marchewka, M.K.; Drozd, M. Ethylenediammonium dication: H-bonded complexes with terephthalate, chloroacetate, phosphite, selenite and sulfamate anions. Detailed vibrational spectroscopic and theoretical studies of ethylenediammonium terephthalate. Spectrochim. Acta Part A 2012, 99, 223–233. [Google Scholar] [CrossRef]
  43. Arjunan, V.; Kalaivani, M.; Marchewka, M.K.; Mohan, S. Crystal structure, vibrational and DFT simulation studies of melaminium dihydrogen phosphite monohydrate. J. Mol. Struct. 2013, 1045, 160–170. [Google Scholar] [CrossRef]
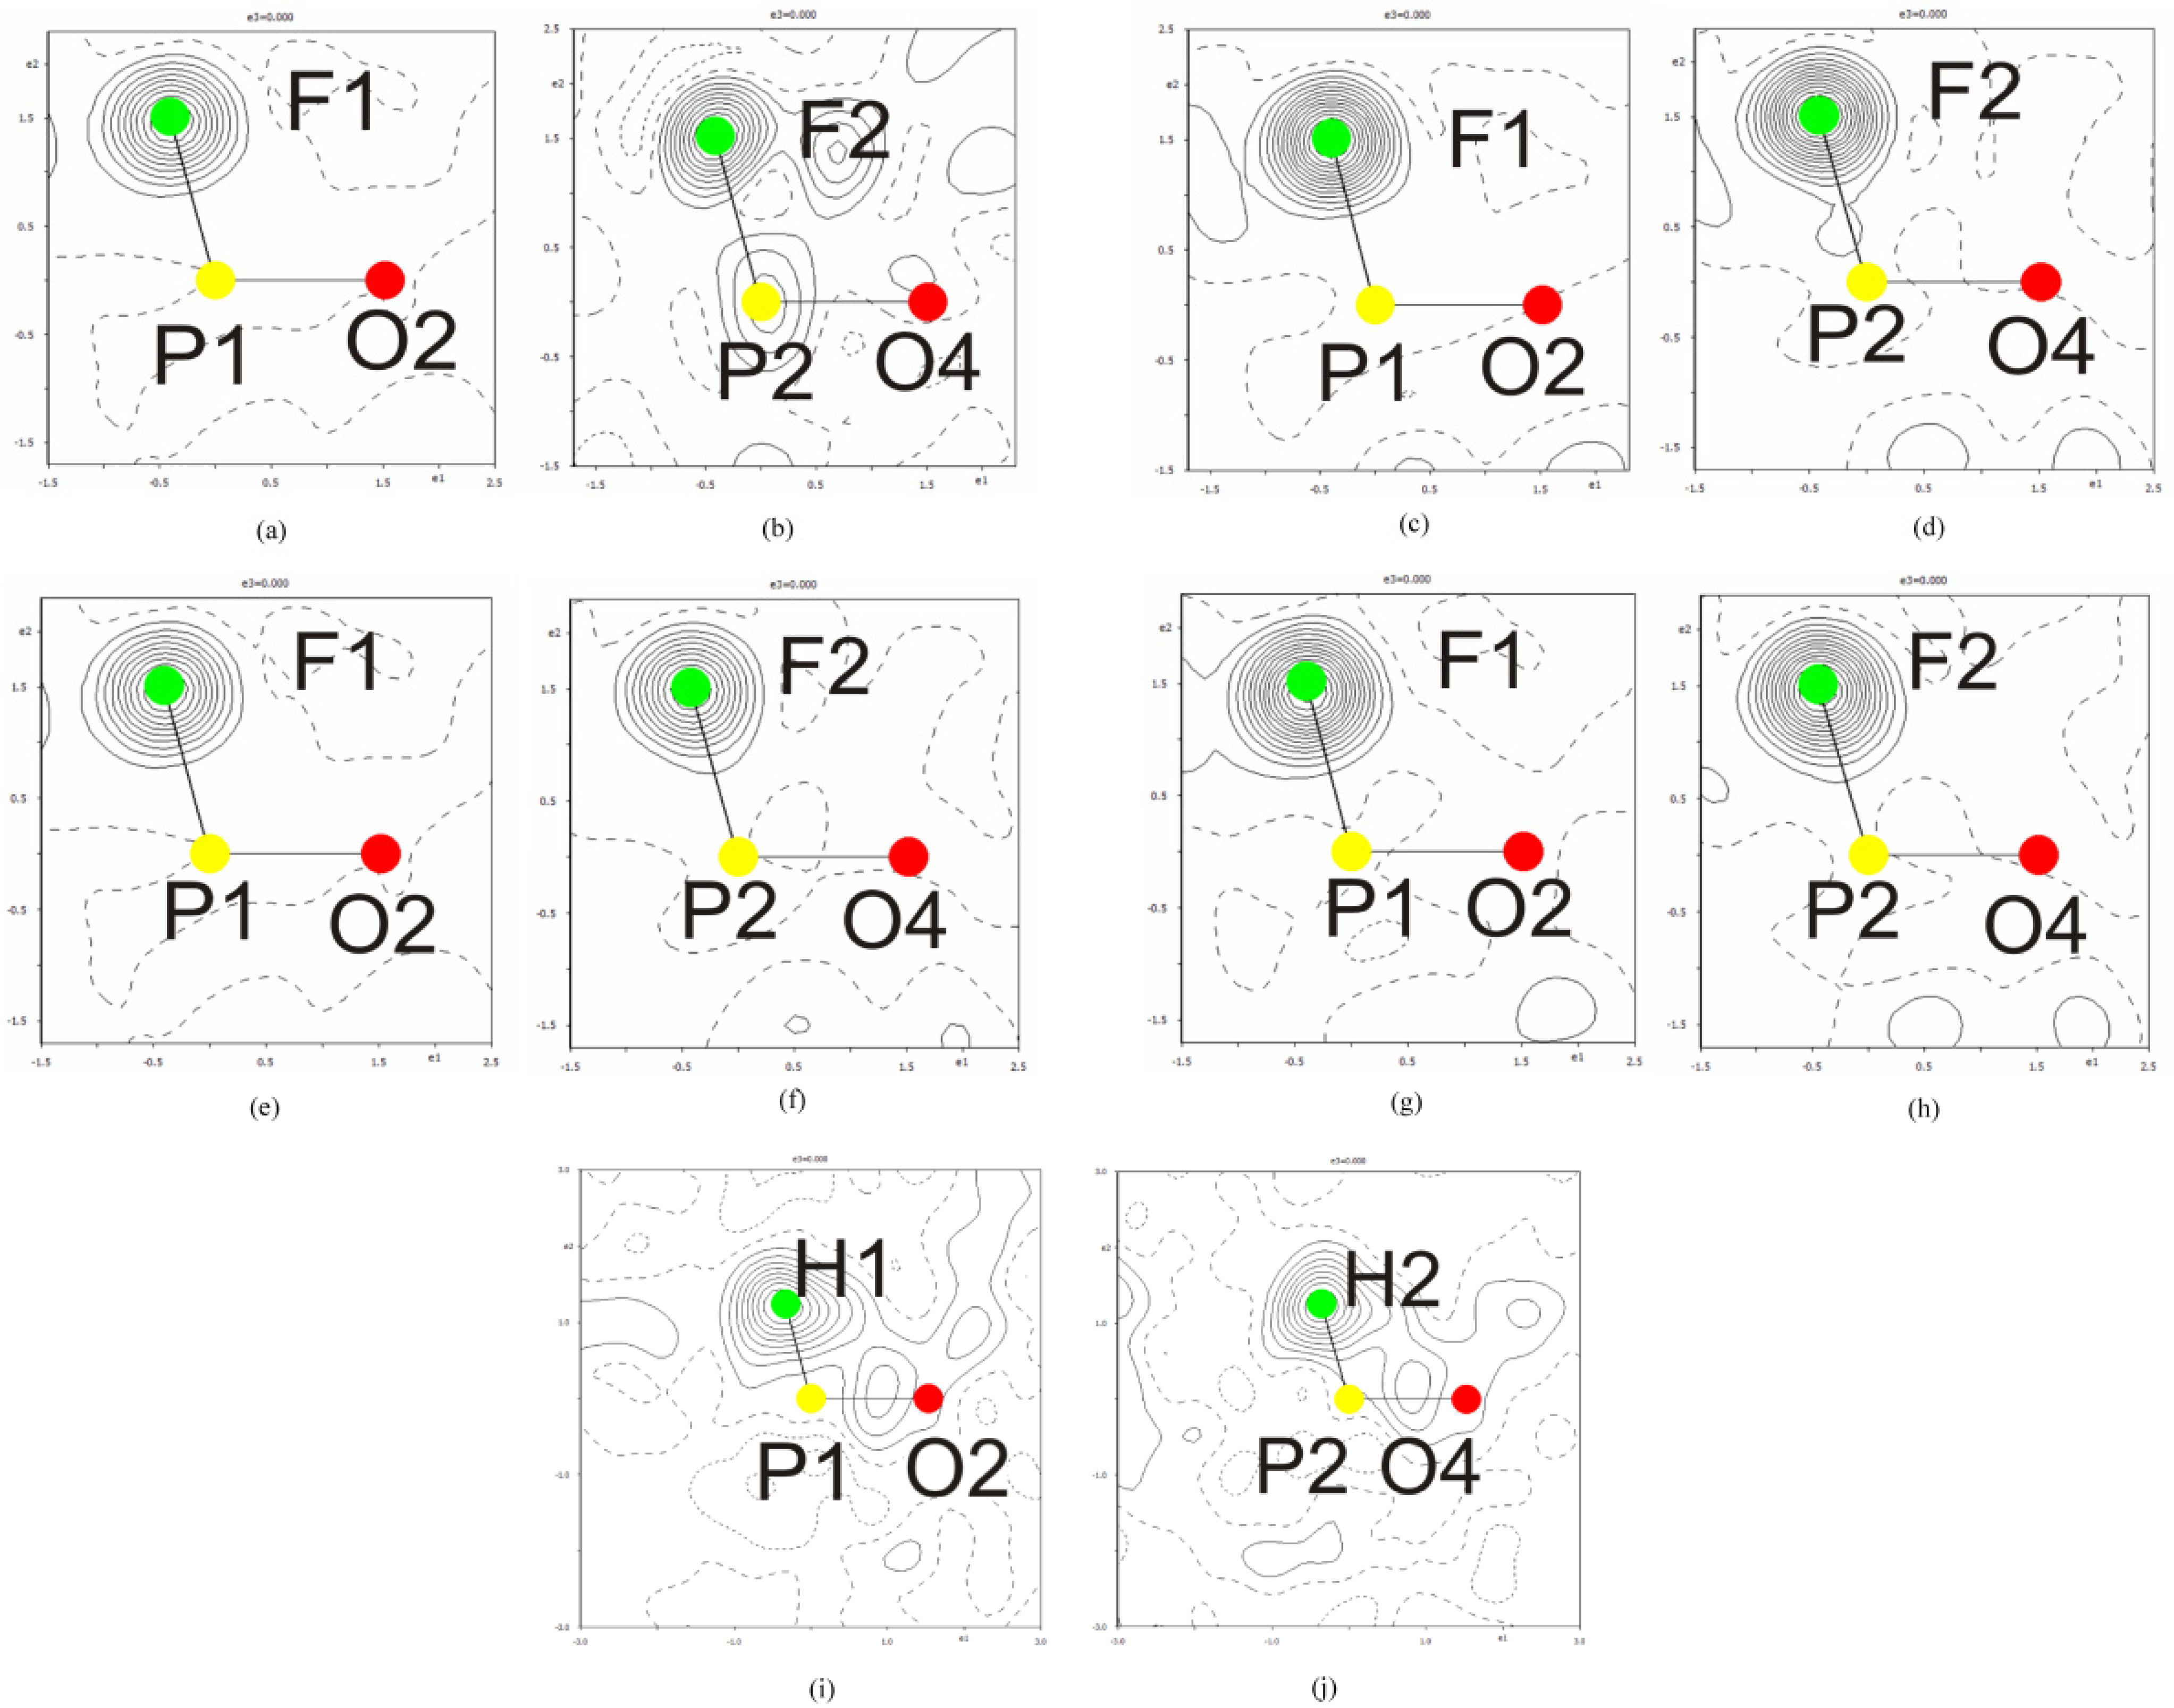
Figure 1. The difference electron density [eÅ−3] before including the atoms F1/H1 and F2/H2 into the title crystals. (a,b) bis(guanidinium) trioxofluorophosphate—compound (I); (c,d) bis(guanidinium) trioxofluorophosphate-phosphite (0.716/0.284)—compound (II); (e,f) bis(guanidinium) trioxofluorophosphate-phosphite (0.501/0.499)—compound (III); (g,h) bis(guanidinium) trioxofluorophosphate-phosphite (0.268/0.732)—compound (IV); (i,j) bis(guanidinium) phosphite compound (V). The increment of the contours is 0.5 eÅ−3. Positive, zero and negative electron density is depicted by the full, dotted and dashed lines, respectively. The Figure was prepared by [14].
Crystals 12 01694 g001
Figure 2. Atom numbering of bis(guanidinium) trioxofluorophosphate—compound (I). The anisotropic displacement parameters are shown at the 50% probability level. The symmetry codes for the atoms O2a and O4b: x, 2 − y, z; for the atoms N2c and N4d: x, 1 − y, z. Applied colours: C—black, N—blue, O—red, H—black contour, P—yellow, F—green. The Figure was prepared by [17].
Crystals 12 01694 g002
Figure 3. Atom numbering of bis(guanidinium) phosphite—compound (V). The anisotropic displacement parameters are shown at the 50% probability level. The symmetry codes for the atoms O2a and O4b: x, −y, z; for the atoms N2c and N4d: x, 1 − y, z. Applied colours: C—black, N—blue, O—red, H—black contour, P—yellow. The Figure was prepared by [17].
Crystals 12 01694 g003
Figure 4. View of the unit cell of bis(guanidinium) trioxofluorophosphate—compound (I). The other title structures are virtually the same. Applied colours: C—grey, N—blue, O—red, H—grey, P—violet, F—green. The Figure was prepared by [18].
Crystals 12 01694 g004
Figure 5. Two-dimensional fingerprint plots (di, de) of the Hirshfeld surface of various intermolecular interactions. Left columns for bis(guanidinium) trioxofluorophosphate—compound (I); right columns for bis(guanidinium) phosphite—compound (V). Cation A occupies the general position. The Figure was prepared by Crystal Explorer software [20].
Crystals 12 01694 g005
Figure 6. (a) Raman spectra of the series of Gu2(PO3F)x(HPO3)ycompounds (I)–(V); (b) Detail of the Raman spectra of compounds (I)–(V) (region 1200–50 cm−1); (c) DRIFT spectra of the series of Gu2(PO3F)x(HPO3)y—compounds (I), (II), (IV) and (V); (d) Detail of the DRIFT spectra of compounds (I), (II), (IV) and (V) (region 2500–400 cm−1).
Crystals 12 01694 g006
Figure 7. A detail of the Raman spectra of compounds (II)–(V) containing phosphite anions (region 2500–2150 cm−1).
Crystals 12 01694 g007
Table 1. Crystal data and details of data collection and refinement for compounds (I), (II) and (III).
CompoundIIIIII
Chemical formulaFO3P·2(CH6N3)(CH6N3)4(PO3F)0.744(PO3H)0.256 (PO3F)0.687(PO3H)0.313(CH6N3)4(PO3F)0.507(PO3H)0.493 (PO3F)0.494(PO3H)0.506
DiffractometerSUPERNOVA DualSUPERNOVA DualSUPERNOVA Dual
DetectorAtlasS2 (CCD)AtlasS2 (CCD)AtlasS2 (CCD)
Shape and size of the sample (mm)prism 0.183 × 0.232 × 0.399prism 0.047 × 0.227 × 0.414prism 0.068 × 0.096 × 0.447
colourcolourlesscolourlesscolourless
Mr218.1426.02418.29
Crystal system, space groupMonoclinic, CmMonoclinic, CmMonoclinic, Cm
T (K)959595
a, b, c (Å)13.191 (3)13.1423 (4)13.1069 (7)
7.2940 (6)7.2997 (1)7.3028 (3)
11.644 (3)11.6364 (10)11.6406 (16)
β (°)119.80 (4)119.614 (6)119.560 (11)
V (Å3)972.2 (5)970.51(11)969.18 (18)
Z422
X-ray density (g/cm3)1.49032.632.59
F000456447440
μ (mm−1)2.6812.6272.587
Radiation, λ(Å)Cu Kα, 1.54184Cu Kα, 1.54184Cu Kα, 1.54184
monochromatormirrormirrormirror
θ – limit (°)4.38 – 75.084.37 – 75.024.37 – 74.82
hmin, hmax−16, 11−15, 16−16, 16
kmin, kmax−8, 8−9, 9−8, 8
lmin, lmax−11, 14−14, 14−14, 14
Absorption correctionAnalytical [12] Analytical [12] Analytical [12]
Tmin, Tmax0.559, 0.7130.554, 0.9080.536, 0.842
No. of measured, independent and observed [I > 3σ(I)] 3702, 1519, 15126952, 2050, 20477256, 2129, 2124
Rint0.0180.020.016
(sin θ/λ)max−1)0.6270.6270.626
Refinement/ Weighting scheme|F|2, w = 1/[σ2(I) + 0.0016(I)2]|F|2, w = 1/[σ2(I) + 0.0004(I)2]|F|2, w = 1/[σ2(I) + 0.0004(I)2]
R[F2 > 3σ(F2)] 0.0360.0220.021
wR(F2)0.1020.060.056
S2.172.162.07
No. of reflections152020502129
No. of parameters171177177
Extinction correction [14]2000(200)730(100)660(90)
No. of constraints141616
No. of restraints121616
Δρmax, Δρmin (e Å−3)0.55, −0.250.16, −0.180.24, −0.27
No. of the Friedel pairs4609681052
Flack param.0.06 (3)0.003 (14)−0.006 (12)
Note: The used software does not refine the weighting scheme. It uses experimentally obtained weights of reflections and therefore the calculated S has its original meaning, indicating the amount of information available in data with respect to the information provided by the structure model. Such S rarely reaches 1.
Table 2. Crystal data and details of data collection and refinement for compounds (IV) and (V).
CompoundIVV
Chemical formula(CH6N3)4(PO3F)0.271(PO3H)0.729 (PO3F)0.265(PO3H)0.735HO3P·2(CH6N3)
DiffractometerSUPERNOVA DualSUPERNOVA Dual
DetectorAtlasS2 (CCD)AtlasS2 (CCD)
Shape and size of the sample (mm)prism 0.183 × 0.232 × 0.399prism 0.047 × 0.227 × 0.414
colourcolourlesscolourless
Mr409.92200.1
Crystal system, space groupMonoclinic, CmMonoclinic, Cm
T (K)9595
a, b, c (Å)13.0598 (4)13.0231 (4)
7.3078 (2)7.3185 (3)
11.6352 (9)11.6405 (4)
β (°)119.509 (6)119.484 (3)
V (Å3)966.39(10)965.77 (7)
Z24
X-ray density (g/cm3)1.40871.3765
F000433424
μ (mm−1)2.5462.493
Radiation, λ(Å)Cu Kα, 1.54184Cu Kα, 1.54184
monochromatormirrormirror
θ – limit (°)4.37 - 74.694.37 - 75.02
hmin, hmax−15, 16−15, 16
kmin, kmax−8, 8−9, 9
lmin, lmax−14, 13−14, 14
Absorption correctionAnalytical [12] Multi-scan [12]
Tmin, Tmax0.586, 0.8500.672, 0.779
No. of measured, independent and observed [I > 3σ(I)] 4134, 1766, 17606465, 2066, 2047
Rint0.0130.018
(sin θ/λ)max−1)0.6260.624
Refinement/ Weighting scheme|F|2, w = 1/[σ2(I) + 0.0004(I)2]|F|2, w = 1/[σ2(I) + 0.0004(I)2]
R[F2 > 3σ(F2)] 0.0220.016
wR(F2)0.0690.044
S2.351.45
No. of reflections17662066
No. of parameters177163
Extinction correction [14]1200(120)1970(80)
No. of constraints1616
No. of restraints1612
Δρmax, Δρmin (e Å−3)0.22, −0.280.16, −0.10
No. of the Friedel pairs6941005
Flack param.−0.023 (19)0.016 (11)
Table 3. Hydrogen-bond interactions in the title structure determinations for compounds (I)–(V).
CompoundH-BondD-H (Å)H-A (Å)D···A (Å)D-H···A (°)CompoundH-BondD-H (Å)H-A (Å)D···A (Å)D-H···A (°)
IN1-H1n1···O2 ii0.92(3)1.97(3)2.874(3)167(3)IN5-H1n5···O2 iv0.82(3)2.39(4)3.118(5)148(4)
II0.874(16)1.998(16)2.8677(12)173.0(17)II0.860(19)2.33(2)3.096(2)149(2)
III0.879(15)1.993(15)2.8656(11)171.8(14)III0.85(2)2.14(2)2.980(2)170(2)
IV0.90(2)1.97(2)2.8610(17)174(3)IV0.86(2)2.30(3)3.066(3)148(3)
V0.889(13)1.973(13)2.8564(10)171.8(12)V0.826(16)2.31(2)3.0541(16)149.7(16)
IN2-H1n2···O1 iii0.86(3)2.06(3)2.911(3)172(5)IN5-H2n5···O10.85(5)2.17(5)2.988(5)162(3)
II0.847(16)2.070(16)2.9106(12)171(3)II0.85(3)2.14(3)2.988(2)171(2)
III0.840(15)2.072(16)2.9079(12)173(2)III0.85(2)2.14(2)2.980(2)170(2)
IV0.867(19)2.05(2)2.9049(17)171(3)IV0.87(3)2.13(3)2.980(3)167(3)
V0.849(13)2.066(14)2.9051(11)170(2)V0.87(2)2.12(2)2.9733(18)169.4(16)
IN2-H2n2···O4 x0.85(3)2.22(3)2.976(4)148(3)IN6-H1n6···O20.85(5)2.10(5)2.940(5)171(3)
II0.853(14)2.214(16)2.9676(15)147.1(18)II0.85(3)2.10(3)2.939(2)169.0(16)
III0.847(13)2.221(15)2.9686(16)147.1(17)III0.82(2)2.13(2)2.946(2)170.2(14)
IV0.862(16)2.21(2)2.967(2)147(2)IV0.85(3)2.10(3)2.945(3)169.5(19)
V0.838(11)2.213(13)2.9650(12)149.4(15)V0.85(2)2.11(2)2.9475(18)171.0(12)
IN3-H1n3···O4 i0.85(3)2.08(3)2.915(4)169(3)IN6-H2n6···O4 iv0.84(3)2.18(3)2.972(4)158(4)
II0.852(19)2.06(2)2.9106(17)173.5(16)II0.854(15)2.123(17)2.9698(17)171(2)
III0.843(17)2.067(18)2.9040(15)171.6(19)III0.863(14)2.121(16)2.9668(18)166(2)
IV0.85(2)2.06(2)2.901(2)170(2)IV0.861(17)2.123(19)2.965(2)166 (3)
V0.848(15)2.055(16)2.8953(13)170.6(17)V0.828(13)2.154(15)2.9650(13)166.3(18)
IN4-H1n4···O30.88(4)2.07(4)2.943(4)171(4)IN7-H1n7···O3 v0.86(3)2.17(3)2.987(4)161(3)
II0.86(2)2.08(2)2.9343(16)171.9(17)II0.861(16)2.129(18)2.9791(17)169.1(18)
III0.852(18)2.086(19)2.9300(15)170.7(18)III0.865(15)2.128(17)2.9752(17)166.1(17)
IV0.85(2)2.09(2)2.931(2)170(3)IV0.859(19)2.13(2)2.970(2)167(2)
V0.841(15)2.089(16)2.9268(14)174.3(15)V0.837(13)2.144(14)2.9671(13)167.6(14)
IN4-H2n4···O4 iv0.90(4)2.03(4)2.909(5)166(3)IN7-H2n7···O2 iv0.85(3)1.97(3)2.810(4)167(4)
II0.87(2)2.05(2)2.897(2)167.5(19)II0.855(15)1.990(14)2.8225(15)164(2)
III0.87(2)2.03(2)2.8914(17)168.1(17)III0.852(15)2.005(13)2.8277(15)162(2)
IV0.88(3)2.01(3)2.884(3)171(2)IV0.856(17)1.982(16)2.826(2)169(3)
V0.846(19)2.035(18)2.8761(15)172.8(15)V0.848(13)2.013(12)2.8372(11)163.8(18)
Note: Symmetry codes: (i) x, −y + 1, z; (ii) x + 1, −y + 1, z; (iii) x + 1, y, z; (iv) x − ½, −y + ½, z; (v) x − ½, y + ½, z; (x) x, y, z − 1.
Table 4. The closest intermolecular interactions to anionic F and Hhydrido hydrogen in the title structures for compounds (I)–(V).
CompoundH-interactionD-H (Å)H-A (Å)D···A (Å)D-H···A (°)
IN5-H1n5···F1 xi0.83(4)2.86(3)3.421(4)126(3)
IIN5-H1n5···F1 xi0.860(19)2.824(18)3.419(2)127.8(18)
IIN5-H1n5···H1 xi0.860(19)2.82(13)3.45(16)131(5)
IIIN5-H1n5···F1 v0.824(18)2.838(18)3.425(3)129.9(18)
IIIN5-H1n5···H1 v0.824(18)2.87(6)3.50(7)134(3)
IVN5-H1n5···F1 v0.86(2)2.81(2)3.407(7)128(2)
IVN5-H1n5···H1 v0.86(2)2.86(6)3.50(7)132(3)
VN5-H1n5···H1 v0.826(16)2.883(19)3.524(16)136.0(15)
IN2-H1n2···F2 viii0.80 (3)3.05(4)3.293 (4)101(3)
IIN2-H1n2···F2 viii0.847(16)3.05(2)3.289 (2)98.7(15)
IIN2-H1n2···H2 viii0.847(16)3.14(14)3.34 (12)96.3(19)
IIIN2-H1n2···F2 x0.840 (15)3.035(18)3.425(3)100.1(13)
IIIN2-H1n2···H2 x0.840 (15)3.08(8)3.50(7)98.0(14)
IVN2-H1n2···F2 x0.867(19)3.04(3)3.407(7)99.6(18)
IVN2-H1n2···H2 x0.867(19)2.98(6)3.50(7)98.7(18)
VN2-H1n2···H2 x0.849(13)3.09(2)3.524(16)97.4(11)
IN2-H2n2···F2 viii0.83 (3)2.93(4)3.293(4)109(3)
IIN2-H2n2···F2 viii0.853 (14)2.97(2)3.289(2)104.4(15)
IIN2-H2n2···H2 viii0.853 (14)2.97(11)3.34(12)109(2)
IIIN2-H2n2···F2 x0.847 (13)2.95(2)3.288(3)105.9(15)
IIIN2-H2n2···H2 x0.847 (13)2.92(6)3.31(6)110.0(17)
IVN2-H2n2···F2 x0.826(16)2.99(3)3.294(6)103.3(19)
IVN2-H2n2···H2 x0.826(16)2.88(5)3.23(5)106(2)
VN2-H2n2···H2 x0.838 (11)2.92(2)3.305(14)110.3(13)
Note: Symmetry codes: (v) x − ½, y + ½, z; (viii) x, y, z + 1; (x) x, y, z − 1; (xi) x + ½, y − ½, z.
Table 5. FTIR and Raman spectra of compounds (I)–(V).
gu2PO3Fgu2(PO3F)x(HPO3)ygu2HPO3
Compound (II)Compound (III)Compound (IV)
Compound (I)x = 0.716 y = 0.284x = 0.501 y = 0.499x = 0.268 y = 0.732 Compound (V)
FTIRRamanFTIR RamanRamanFTIRRamanFTIRRaman
Assignmentcm−1Int. *cm−1Int. *cm−1Int. *cm−1Int. *cm−1Int. *cm−1Int. *cm−1Int. *cm−1Int. *cm−1Int. *Assignment
v N-H(…O)332571 333091 333073 331070 v N-H(…O)
312084 311599 311086 310083
283050 283072 283548 283548
? 237710 ?
23076223053323079230550230810230552230614 v PH
22996222981723009229751229829229654229713
?226621
2182sh
2120sh
20408 204012 ?
20158 201512
δ NH2, v CN16838716825 1694671697616978416972 δ NH2, v CN
1669sh1660sh16679916775166531658271659616637716603
1588621586615888015926159121589611587sh15885915952
1568sh 15674 156451571sh
?138943
138135
125662
122112 ?
ρ NH21166sh 11602 11704411652 ρ NH2
vas PO3, ρ NH2110480 110498 1110sh vas PO3, ρ NH2
ρ NH2, δ PO31053sh10595 106588 10649310593 δ PO3, ρ NH2
1046sh
102272 102259 102262 δ PH, ρ NH2
vs CN31012491013100101074101113410131001010561013951010571012100 vs CN3
vs PO3997721000sh99789 100025995661001sh
979sh975597375973139771697475977309758097656 vs PO3
?9167
87637 859sh ?
v PF811798131381186811118163810678113
δ NCN75062 75273 75664 75764 δ NCN
γ N-H(…O), τ NH2 6756 678266185 660846783 γ N-H(…O), τ NH2
64986
62580 62185
δ PO3580805768581855723564sh56090570115709056917 δs PO3
55625529 56088
δ NCN, τ NH25498954711 5465 541100 544935509 δ NCN, τ NH2
5259529985347 532sh
δ FPO3, δ NCN, τ NH25211005171852110051919
48177 4736 47887 δ PO3
4648046384666464984651046310046914
ρ PO3 37710 37793856 3873
External modes 18323 1852718910 18913 188sh External modes
14384 14310014651 14759 14638
12347 130sh13038 13147 13037
11236 11534
8445 84788895 88100 9094
* The intensities of IR and Raman bands are presented using a relative scale of 0–100.
Table 6. Comparison of the relative peak area of two bands of stretching PH vibrations.
CompoundStoicheiometric Coefficients x/yArea of the Band at 2300 cm−1Area of the Band at 2306 cm−1Ratio of the Band Areas
II0.716/0.28494116790.56
III0.501/0.49910467631.37
IV0.268/0.732319511372.81
V0/17636801.12
Publisher’s Note: MDPI stays neutral with regard to jurisdictional claims in published maps and institutional affiliations.