Article

Biogenic Synthesis of Zero Valent Fe/Magnetite Fe3O4 Nanoparticles Using Caralluma acutangula and Application for Methylene Blue Dye Degradation under UV Light Irradiation

Chemistry Department, Faculty of Science, Jazan University, Jazan, 45142, Saudi Arabia
*
Author to whom correspondence should be addressed.
Crystals 2022, 12(11), 1510; https://doi.org/10.3390/cryst12111510
Submission received: 27 September 2022 / Revised: 11 October 2022 / Accepted: 16 October 2022 / Published: 25 October 2022
(This article belongs to the Special Issue Novel Nanomaterials for Catalytic and Biological Applications)

Abstract

:
Biogenic synthesis of nanoparticles using plant extract is a promising trend in research to reduce chemical consumption and avoid wastewater treatment complications. In this work, the zero-valent Fe/Fe3O4 nanoparticles (Fe0/Fe3O4 NPs) were synthesized using Caralluma acutangula (CA) plant, widespread in the Jazan region in Saudi Arabia. The synthesis process involves hydrothermal treatment of plant extract and iron (III) mixture at 80 °C to facilitate the reduction reaction of iron (III) cations. The Fe0/Fe3O4 NPs were characterized by XRD, FTIR, SEM, EDX, TEM, XPS, TGA, UV, and SBET. The obtained data support the formation of Fe0/Fe3O4 NPs crystal structure with an average particle size of 9.6 nm and surface area of 89 m2.g−1. The biosynthesized Fe0/Fe3O4 NPs were then applied for the photodegradation of Methylene blue (MB) dye as one of the most common organic dyes in wastewater due to several industrial human activities. Different parameters for MB degradation were performed, such as kinetics and thermodynamics studies. The data obtained reflect the nonspontaneous endothermic process with 87.8 KJ. mol−1 activation energy (Ea).

1. Introduction

Recently green approach has received wide attention from researchers regarding the synthesis of a wide variety of nanomaterials due to it is unique size (1–100 nm ), structure, shapes, physicochemical, magnetic, thermal, electrical, and catalytic properties [1,2,3,4,5,6,7]. The particle size and surface area are the main parameters that could be used to define the properties and surface activity of such materials [8,9,10]. Nanoparticles are highly intriguing due to their high surface area-to-volume ratio over bulk material counterparts. The nanoparticle structure could represent a high degree of complexity that consists of three layers, i.e., the surface layer, the shell, and the core (generally described as the nanoparticles) [11]. The difference between the nanoparticles forming layers lies mainly in the functional groups such as metal ions, surfactants, small molecules, and polymers. The properties of nanoparticles, such as size, shape, composition, structure, and framework, are specific and need to be optimized during synthesis [12]. Depending on their distinct characteristics, nanoparticles are categorized into different classes, including metal oxides, ceramics, polymers, and semiconductors, carbon and lipids based [13,14,15,16]. Other metal oxides, such as transition metals oxides, gold, silicon, and magnesium oxides, have various environmental applications. Metal oxide nanomaterials attribute various applications such as photodegradation, adsorption, catalysis, textile, pharmaceutical, and energy [5,8,17,18,19]. Iron oxide nanoparticles possess distinguished and magnificent physical properties such as super magnetism, liquid solution firmness, lower susceptibility to oxidation, flexible surface chemistry, and a wide variety of environmental applications [20,21,22,23]. Iron oxide nanoparticles also exhibit a typical shell structure and core which make it possess the characteristics of both metallic iron and hydrous iron oxide [24,25,26]. Furthermore, iron nanoparticles also possess enzyme-like catalytic properties, which can carry out the same oxidation action of various enzymes such as peroxidase and catalase, making it a new enzyme mimic [22,27]. Another feature of iron nanoparticles is the capability of such particles to join with biological molecules such as peptides, nucleic acids, enzymes, and fatty acids [28].
The use of magnetic material is important interest for researchers due to its wide variety of application and capability of regeneration and or recycling [29]. The possible iron oxide that could be obtained after synthesis are α-Fe2O3, γ-Fe2O3 and Fe3O4 [30]. The percentage of each kind of iron oxide depends on the method of synthesis and the thermal treatment. Magnetite is one of the useful forms of iron oxides due to it is highest and largest magnetization saturation. Synthesis of magnetized iron were performed using several techniques and methods [30,31]. Several works indicate the formation of magnetite as well as hematite at high calcination temperature lies between 400 and 500 °C [29]. XRD characterization of the magnetic iron oxide did not indicate any relevance prove that could distinguish between both magnetite and maghemite.
Different methods have been employed for synthesizing iron oxide nanomaterials, including chemical, physical and biological [32,33]. Chemical processes involve the use of various chemicals, which can cause a severe impact on living organisms as well as humans when it is wastes discharged into the echo system. Furthermore, applying physical techniques such as milling, grinding, and thermal treatment of ores could be costly, besides time and energy consumption [23]. Therefore, the shift toward green techniques possessing safe, biologically acceptable, coast effective echo friendly, and fast methods became a necessity of great importance [34,35,36]. In the biogenic synthesis of iron oxide nanoparticles, several living organisms, such as plants, bacteria, and fungi, can be used instead of chemicals [7,37,38,39]. Two basic steps involved in biogenic mainly bio-reduction, which consists of the reduction of metal ions to a stable oxidation state, and biosorption in which metal ions are binding to the surface of the organism such as cell wall and peptides to form a stabilized complex [40]. Subsidiary steps such as capping or adhering to the biologically active phytochemicals stabilize the nanoparticle’s surface and produce stable suspended particles. Subsequently, biogenic synthesis is an economical, nontoxic chemical application compared to other physical and chemical synthesis procedures [38]. The Southwest region of Saudi Arabia is enriched with various plant genus, especially medicinal plants. Apocynaceae family is a highly spread plant genus in this region of Saudi Arabia. This genera of the Apocynaceae family traditionally treat various diseases in Saudi Arabia. Caralluma belongs to the family Apocynaceae, and this genus comprises 14 species in the Gizan province of Saudi Arabia [41]. Caralluma acutangula plant extract in various aqueous or organic solvents is very efficient in treating cancer, e.g., hepatocellular carcinoma and prostate and breast cancer. The extract of Caralluma acutangular species is enriched with various pregnant glycosides phytochemicals that are effective biomolecules for anticancer, appetite suppressant, and anti-obesity and antitrypanosomally treatments [42].
In this work, we used the biogenic synthesis of zero valent Fe/Fe3O4 nanoparticles (Fe0/Fe3O4 NPs) through an aqueous extract of Caralluma acutangula (CA), which is a widespread plant in the Jazan area. The iron precursor solution was heated at 80 °C with CA aqueous solution, and iron was reduced to zero-valent iron/oxide nanoparticles, and the phytochemicals stabilized the surface. Later, Fe0/Fe3O4 NPs were successfully characterized by various spectroscopic techniques. The average size of Fe0/Fe3O4 NPs has calculated at 9.6 nm with a surface area of 89 m2.g−1 and successfully applied for the photodegradation of methylene blue dye using Fenton reaction with hydrogen peroxide. After the degradation reaction of MB, the used Fe0/Fe3O4 NPs were collected with a magnet. This methodology explores the cheap and environmentally friendly biogenic synthesis of Fe0/Fe3O4 NPs and their application for environmental pollutant removal such as MB dye and may apply to various target studies.

2. Materials and Methods

2.1. Materials

Ferric chloride (FeCl3), Sodium hydroxide (NaOH), Methylene blue, and Methanol (99.5% purity) were purchased from Sigma-Aldrich. All used chemicals and solvents are of analytical grades and used without further purification. Deionized water from a Milli-Q system was used for all the experiments. CA leaves were obtained from a healthy plant growing in an open forest in the northern region of Jazan, Saudi Arabia.

2.2. Preparation of Fe0/Fe3O4 NPs

Figure 1a,b, show the schematic for preparing CA aqueous extract and biogenic synthesis procedure of Fe0/Fe3O4 NP, respectively. CA leaves were dried, grinded, and heated at 90 °C in 600 mL DI water for 4 h. The orange color aqueous extract was then filtered to acquire a clear solution and stored as the mother solution at 4 °C for further use. CA aqueous extract was heated at 80 °C and kept under constant stirring for 1 h. The heated clear solution was then treated with 3% FeCl3 solution. The color of the orange solution was changed from greenish to black following the addition of FeCl3 solution due to the interaction with organic species present in the mother liquor, which resulted in the formation of the Fe(III) complex, and then it further reduced to Fe(II) and zerovalent Fe which usually responsible for the greenish to black color. The pH of reaction mixture was find acid as 1.5 which is due the presence of high percent of benzoic acid and tridecanoic acid, 4,8,12-trimethyl-methyl ester in the aqueous extract of CA as mentioned in earlier report [43]. The reaction mixture was treated with 0.1 N NaOH to precipitate iron hydroxide NPs that converted to magnetite upon calcination at 400 °C after washing and drying.

2.3. Catalytic Degradation of MB Dye

Catalytic activity of the synthesized Fe0/Fe3O4 NPs was tested by applying UV irradiation using 6 W UV lamp with 254 nm wavelength. 100 ppm stock solution of MB was used for the photodegradation test under varying experimental condition, such as different MB concentrations (5–100 mg/l), different catalyst and H2O2 doses. Calibration curve for MB dye was carried out by diluting the stock solution to the proper concentration prior to the measurements using spectrophotometer.

2.4. Characterization of Fe0/Fe3O4 NPs

The biogenic synthesis Fe0/Fe3O4 NPs were characterized using different techniques to acquire a full texturing for the surface characteristics of Fe0/Fe3O4 NPs crystallinity and structure were examined by Shimadzu XRD, LabX-6000 XRD X-ray Diffractometer, Kyoto, Japan, with a CuKα (λ = 1.54056 Å), working on 40/30 kV/Milli Ampere, at 2°/m amid 20–70° angles. The Fe0/Fe3O4 NPs surface morphology was analyzed using high-resolution scanning electron microscopy (HRSEM), Energy-dispersive X-ray spectrometry (EDX), and atomic mapping by FEI-Quanta FEG 250 SEM with field emission gun, Netherlands. Fe0/Fe3O4 NPs suspension (10.0 μL) was placed on a carbon conductive adhesive tape. Samples were dried at 80 °C under a vacuum overnight and subjected to HRSEM and EDX. The Fe0/Fe3O4 NPs shape and surface morphology were analyzed using Transmission Electron Microscope (TEM), JEOL HRTEM, JEM-2100F (Tokyo, Japan) instrument at 120 kV. Nanoparticle suspension was prepared in methanol. A 1.0 μL sample was transferred onto a Cu grid and heated in a vacuum oven at 80 °C overnight to vaporize the solvent and further characterized by the TEM instrument. Surface functional groups such as carbon-oxygen and iron-oxygen were analyzed using X-ray photon spectroscopy using a surface science instrument X-probe, X-Ray000 400um–FG ON (400 µm). Fe0/Fe3O4 NPs nanoparticles surface charge was measured by zeta sizer nano instrument, Nano ZS90, ZEN3690, Malvern Instruments Ltd., Cambridge city, UK. The synthesized Fe0/Fe3O4 NPs’ surface area and pore characteristics were measured by a five-point Brunauer-Emmette Teller (BET) analysis (80 °C degassing temperature) with a Quantachrome Nova 2200e instrument. CA mother liquor functional groups and Fe0/Fe3O4 NPs were determined using FTIR set at 450–4000 cm−1, using a Prestige-21, Shimadzu, Japan IR spectrometer. Thermal stability of Fe0/Fe3O4 NPs oxide NPs was evaluated by thermogravimetric analysis (TGA), using Shimadzu, Kyoto, Japan. The analysis was performed in a nitrogen environment at a heating rate of 5.0 °C min−1. UV-Vis spectrophotometer (SCO TECH, SPUV-26, Dingetstädt, Germany) with 1.0 cm quartz cuvettes in the range from 200 to 800 nm was used for UV/Vis spectroscopic analysis. The catalytic activity of the synthesized Fe0/Fe3O4 NPs was tested by applying UV irradiation using a 6 W UV lamp with a 254 nm wavelength.

3. Results and Discussions

3.1. UV-VIS and Band Gap Analysis

The data obtained from UV analysis for the synthesized iron nanoparticles in comparison with the mother liquor was depicted in Figure 2a. Figure 2a (I) refer to the UV-Vis absorption spectrum of FeCl3 solution at 340 nm and broad absorption peak at 300 nm. The data obtained indicate the appearance of new bands at 280, 300, and 340 nm upon adding iron as shown in Figure 2a (III) in CA aqueous extract. The data revealed that the new peaks at 280, 295, and 340 nm demonstrated with both Fe (II) and Fe (III) ions, respectively. While in Figure 2a (II), represent the CA aqueous extract alone which has absorption broad peak at 330 and 265 nm range. This finding could reflect that our synthesized sample is a mixture of both ions with a different ratio, as indicated by XRD and XPS analysis. The calculation of the optical energy band gap for direct transition is represented in Figure 2b. The data obtained indicate that the calculated value is 1.94, which agrees with other research work [44]. Therefore, the received data could reflect the biosynthesized Fe0/Fe3O4 NPs. Recently, in our published article we demonstrated the aqueous based phytochemicals of Caralluma acutangula using GC-MS to assimilate the metal reduction process and stabilization of metal nanoparticles by biogenic synthesis [43]. Different number of aqueous based phytochemicals such as benzoic acid (27.80%), glycerin (8.22%), D-arabinose-hexopyranoside, methyl 2,6-dideoxy-4-O-(6-dexoy-3-O-methyl-β-D-allyopyranosyl)-3-O-methyl (11.77%), tridecanoic acid, 4,8,12-trimethyl-,methyl ester (10.16%) were observed majorly. Nevertheless, previous published reports show benzoic acid derivatives reduce and stabilize agents during the biosynthesis of Fe0/Fe3O4 NPs [45,46,47].

3.2. FTIR and TGA Analysis

FTIR analysis was investigated to identify surface functional group characteristics of the biosynthesized sample. FTIR spectrum of the plant extract and biosynthesized Fe0/Fe3O4 NPs before and after calcination was depicted in Figure 3a. FTIR spectrum of plant extracts exhibits absorbance bands at 3435, 2947, 2365, 1606, 1412, and 1066 cm−1 as shown in Figure 2a(III). The broad absorbance band located at 3435 cm−1 could belong to the O-H stretching vibration of adsorbed water or surface functional groups of the organic constituents of the extract. In contrast, the band located at 2365 cm−1 could be attributed to C-O. Furthermore, the absorbance bands at 2947 and 1606 cm−1 could be assigned to the C-H stretching of aromatic and aliphatic organic molecules, respectively. However, the bands at 1412 and 1066 cm−1 could be attributed to the bending vibration of COO and N-H, respectively.
Comparing the absorbance bands of the synthesized sample before calcination with the mother liquor of the plant extract as shown in Figure 2a (II). New absorbance bands were observed at 592 and 456 cm−1, which could be attributed to Fe-O vibrations formed due to the interaction between added Fe ions and extract functional groups [48]. Furthermore, the FTIR spectrum also indicates a marked shift in the band located at 1412 cm−1, which shifted to 1375 cm−1, indicating that the carboxyl functional groups (COO) could be going through interaction with Fe ions led to the formation of new species.
On the other hand, the FTIR spectrum of the Fe0/Fe3O4 NPs after calcination indicates the appearance of a new band at 630 cm−1 that could be assigned to the existence of iron oxide nanoparticles in the magnetite phase. The data also indicate the diminishes of the bands located at 1375 and 1066 cm−1 after calcination, which could be attributed to the decomposition of C=O and N-H groups upon heating.
The data collected for uncalcined Fe0/Fe3O4 NPs TGA is shown in Figure 3b. The obtained curve shows three different stages depending on the rise of temperature [29,30,31]. The first stage represents 8.91% wt. loss upon heating up to 122 °C, which could be assigned to the loss of physically adsorbed water molecules. The second stage exhibits 20.44% wt. loss upon increasing the temperature to reach 290 °C, which could be attributed to the decomposition of organic species that exist in the synthesized sample. Further increase of temperature demonstrates the third stage that shows 4.23% wt. loss which could be due to the decomposition of more stable organic species and relative temperature functional groups moieties attached to the surface of the synthesized material.
Furthermore, the overall wt. loss (33.58%) during the TGA analysis which extended to 900 °C indicates that the remaining amount of Fe0/Fe3O4 NPs equals to 66.42, which means that the total carbon content is 24.67% if we exclude the% of adsorbed water molecules. The obtained data was found in agreement with the data obtained by other researchers [31,49].

3.3. XRD Analysis

X-ray diffraction patterns of the synthesized Fe0/Fe3O4 NPs after calcination are illustrated in Figure 4. The obtained diffraction lines located at (311), (110), (113), (024), (442), (511), (620), (440), (300), (620), (533), (622) and (444) are in good agreement with tetragonal structure (JCPDS file no. 25-1402) of magnetite (Fe3O4). Some magnetite could contain maghemite species because standard reflections of such kinds of species are indistinguishable. Furthermore, the diffraction lines located at (012), (104), (011), (400), and (211) could be assigned to the formed hematite rhombohedral (α-Fe2O3) structure (JCPDS file no. 24-0072) [50]. Moreover, one diffraction line appears at 2θ = 45°, which is in agreement with iron zero that could be formed upon the reduction of iron ions in the presence of elemental carbon as a source of the electron [51].

3.4. TEM and Particles Size Distribution

HRTEM image and electron diffraction patterns of the synthesized sample are presented in Figure 5a. The obtained image indicates the formation of Fe0/Fe3O4 NPs with a core/shell structure. The obtained image also shows different shapes of Fe0/Fe3O4 NPs, which could reflect that the NPs have a variety of polycrystalline orientations, which agrees with XRD results. In addition, an analysis of particle size distribution was collected using a diameter of 9.6 nm, which agrees with the data obtained from SBET.

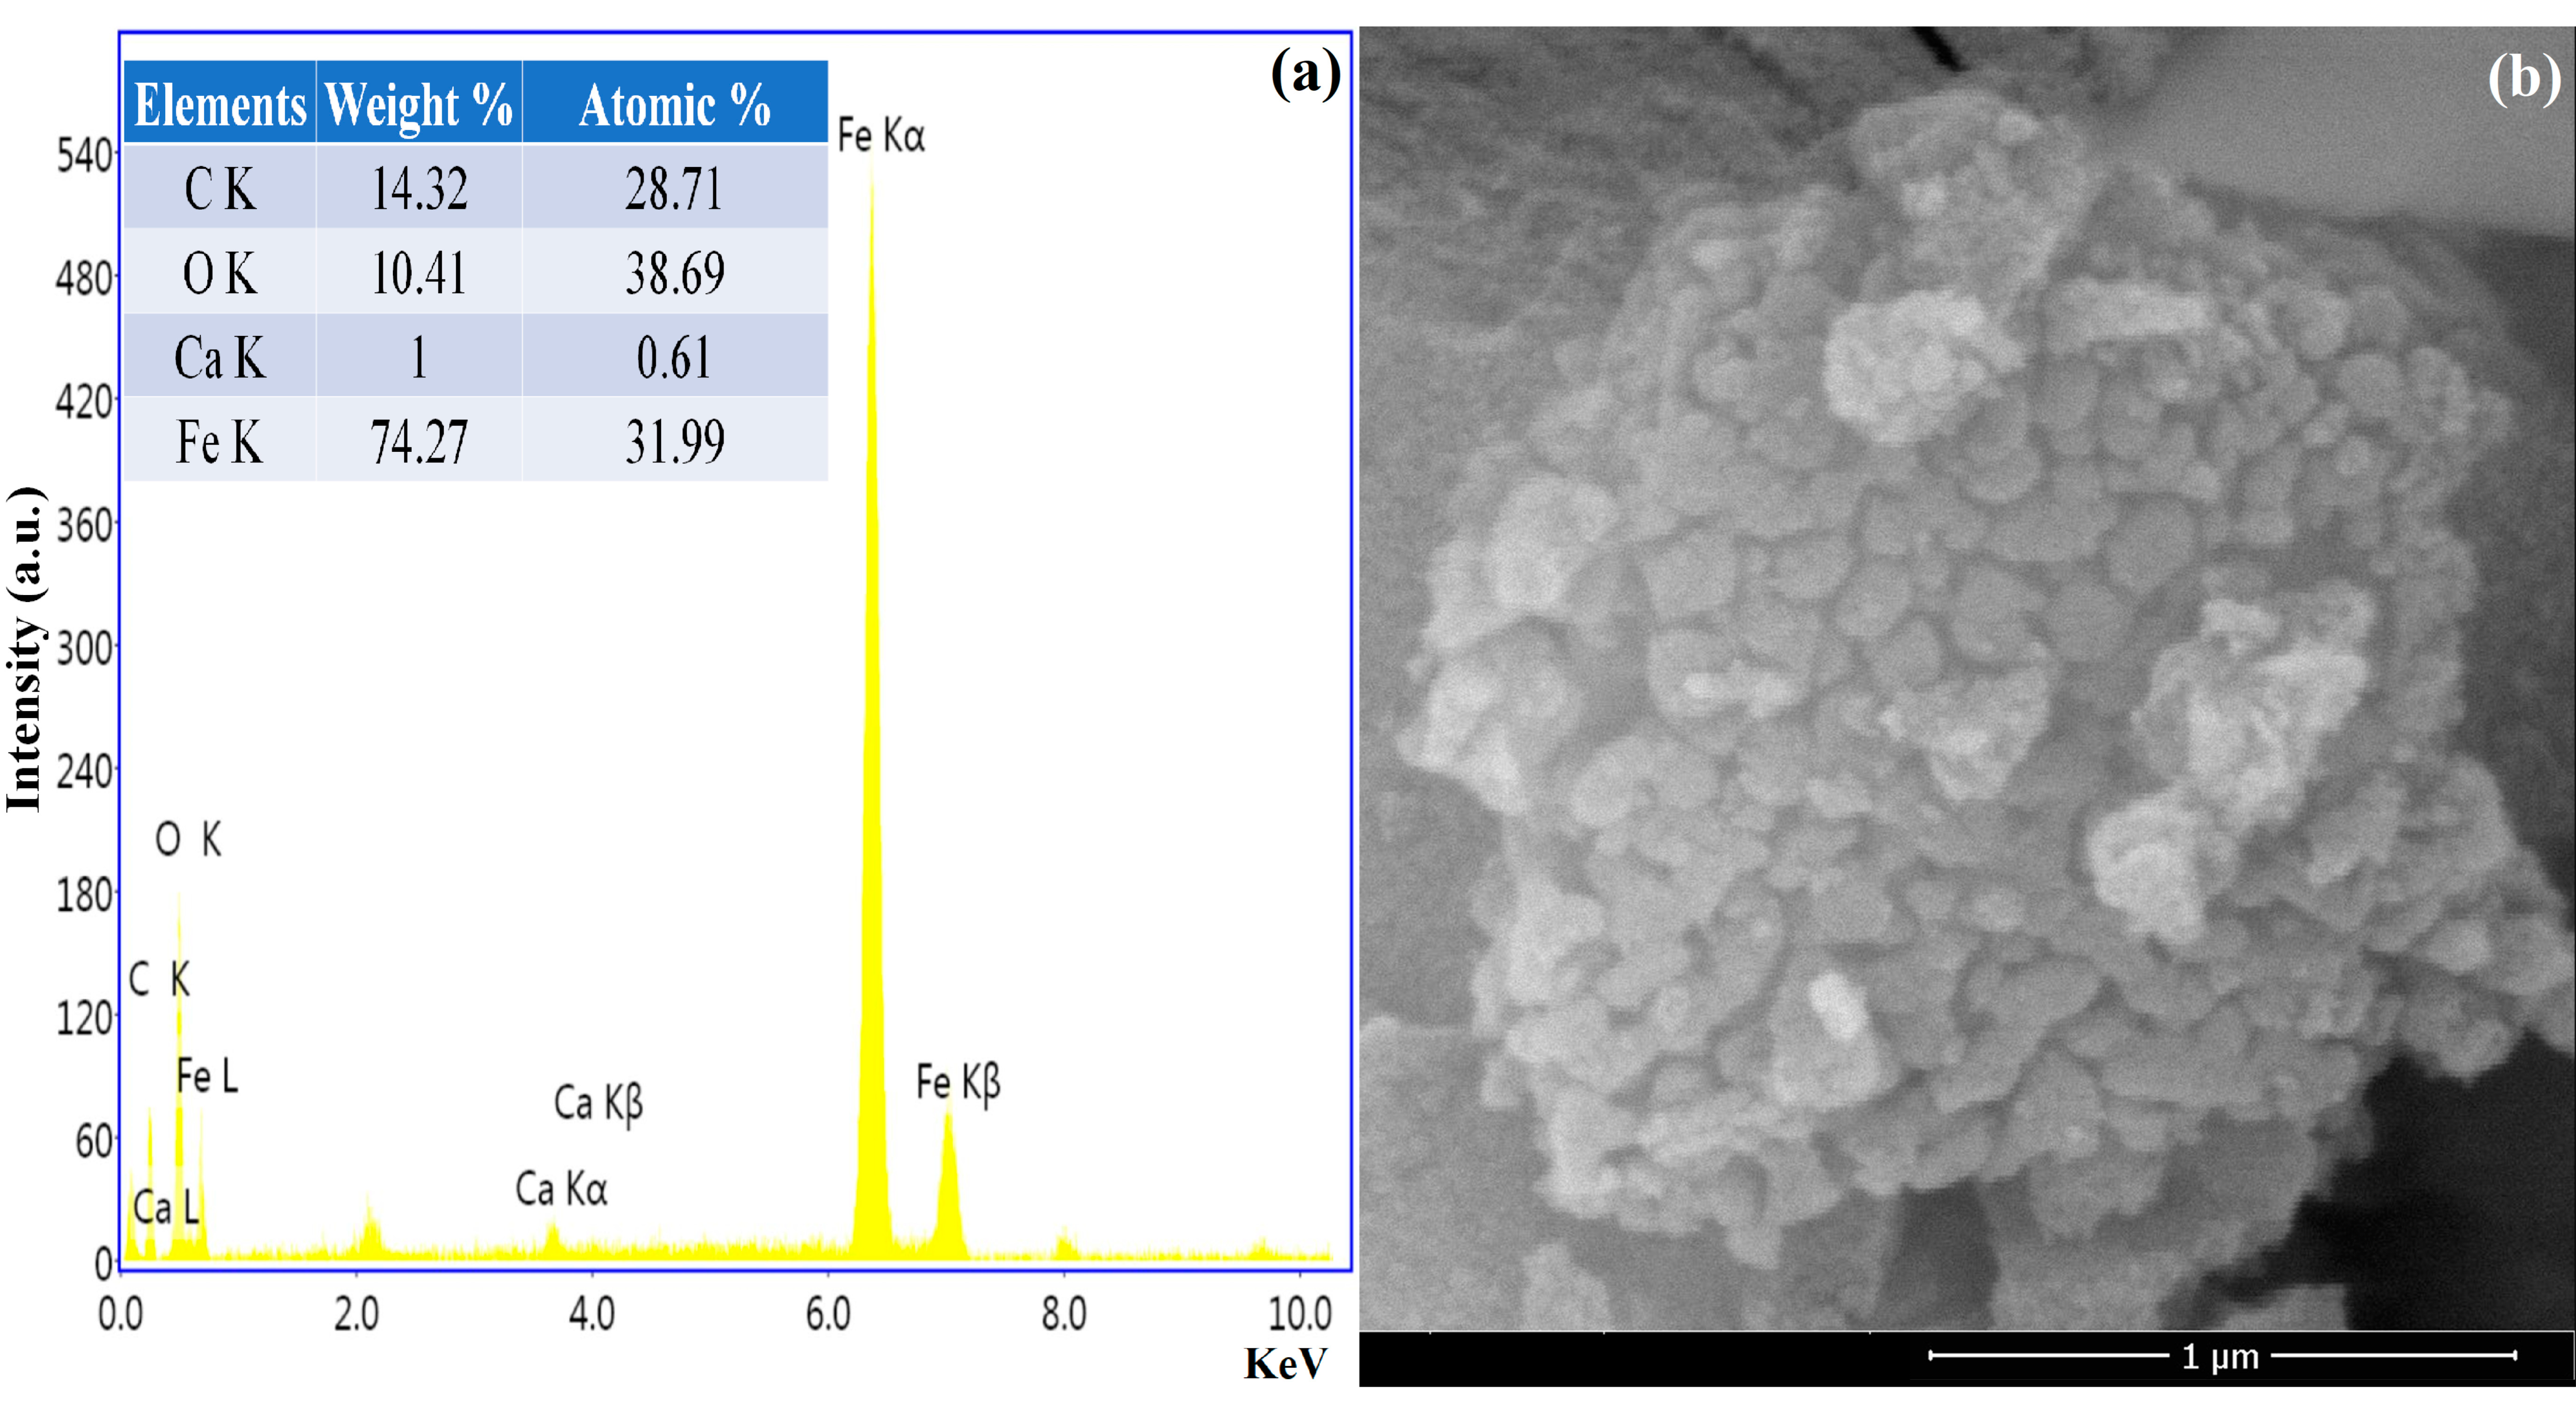
3.5. SEM and EDX Analysis
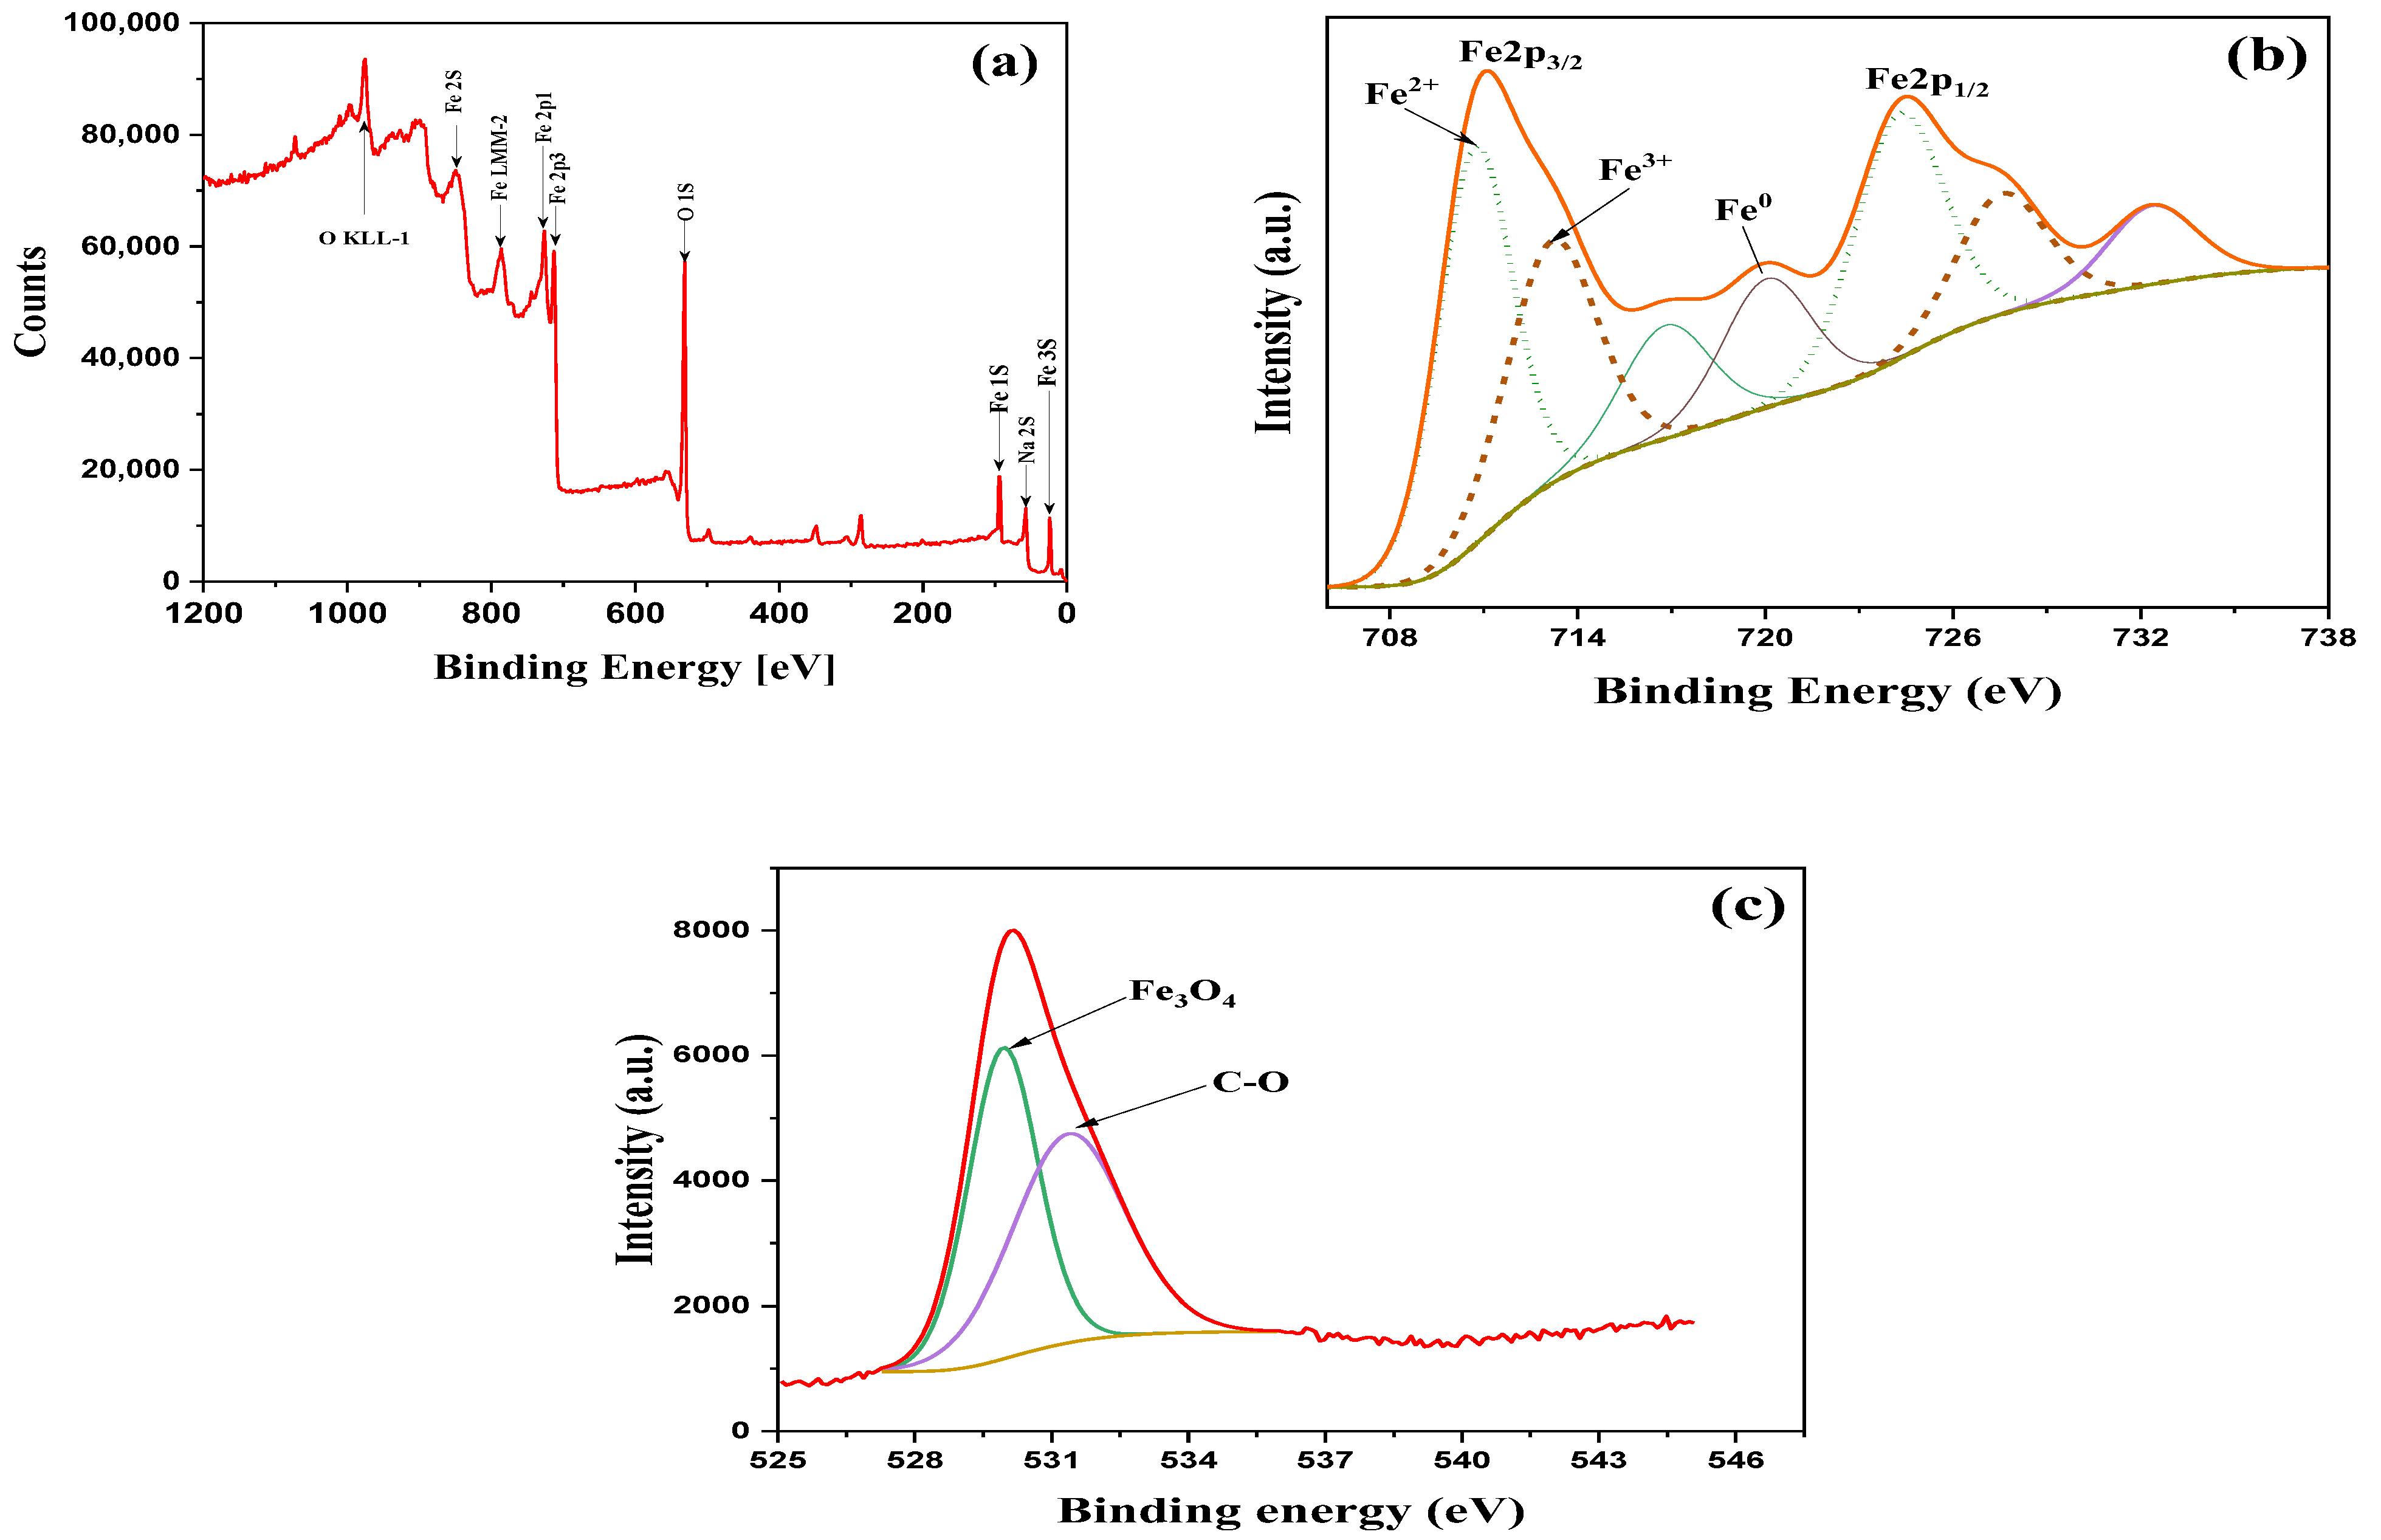
EDX spectrum represented in Figure 6a and SEM image in Figure 6b indicates the appearance of C, O, and Fe species and a tiny amount of Ca as well as surface analysis of biosynthesized Fe0/Fe3O4 NPs. The obtained data indicate the presence of carbon content with 14.32 weight %, indicating that the calcined samples retain some organic species even after calcination at 400 °C. The data also show that the depicted weight % of O and Fe was 10.41 and 74.27% for O and Fe, respectively. The lower weight % of O compared to Fe content might reflect that some iron exists in zero-valent (Fe0), which supports the data obtained from XRD. The data also reflect that the detected calculated ratio of Fe/O atomic % of O (38.69%) is not high enough, which could support the formation of magnetite. Upon analysis of the % of both O and Fe, we can conclude that the formed Fe0/Fe3O4 NPs species is a mixture of magnetite and maghemite with Fe/O ratio equal to 1:2.

3.6. XPS Analysis

The surface chemical composition of the synthesized sample was investigated using XPS, and the oxidation state of existing iron species was determined. Figure 7a shows the characteristic XPS survey spectrum of the calcined Fe0/Fe3O4 NPs. Signals from Fe, O, and Na were detected. The oxygen signals can be attributed to existing oxide species and the magnetic shell. The deconvolution analysis of the Fe2p in the (700–740 eV) range reveals that the synthesized sample contains Fe atoms in different oxidation states (Figure 7b). As illustrated in Figure 7b, high-resolution XPS spectra of Fe2p showed two shake-up satellites and two spin-orbit doublets. The peaks at 711/725.3 eV and 713.8/728.5 eV are assigned to Fe2+ and Fe3+ species with Fe2+/Fe3+ ratio of 1.19. Furthermore, the obtained data also indicate that the amount of Fe2+ in the synthesized sample was 54.27%, whereas Fe3+ was 45.73%. Furthermore, the O1s scan illustrated in Figure 7c indicates two signals at 530 and 532 eV. The first signal at 530 is assigned to magnetite species Fe3O4, whereas the second signal is located at 532 eV assigned to C=O species [51]. On combining all XPS results, it can be observed that the magnetite species was identified from O1s and Fe2P spectra. The characteristic peak of zerovalent Fe should be at 706.9 and 719.8 eV [52]. In Fe0/Fe3O4 NPs XPS spectra as shown in Figure 7b we observed characteristic peak at 719.9 eV which is evidence for the presence of metallic iron (Fe0) while peak at 706.8 eV is missing. It may refer the presence Fe0 is reside blow the iron oxide surface. Fe2p3/2 and Fe2p1/2 were modeled, and magnetite was the sole iron oxide phase because it is positively identified with XRD.

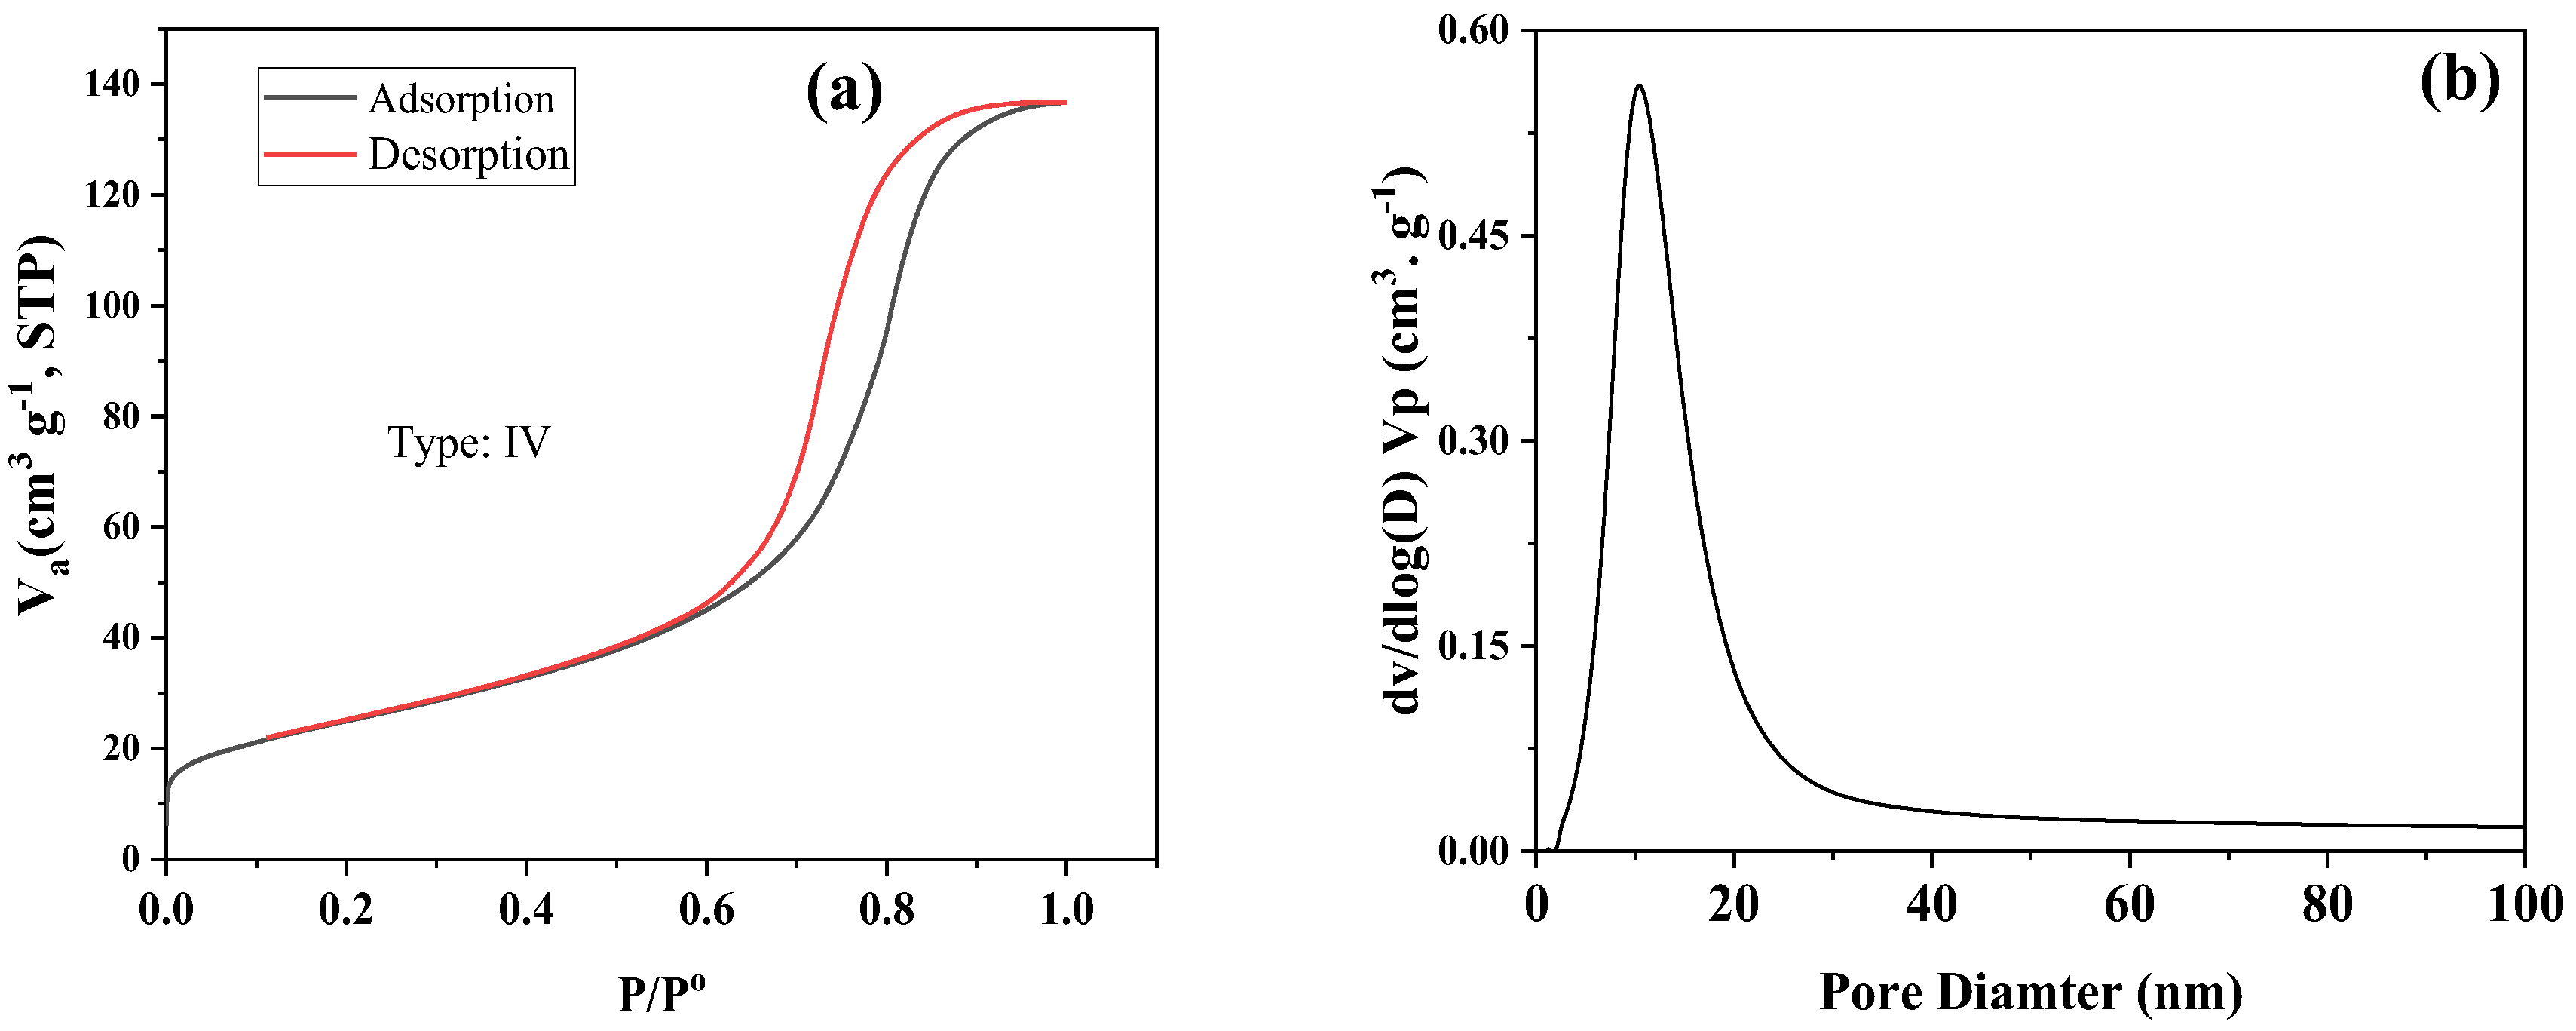
3.7. Surface Area Measurement of Fe0/Fe3O4 NPs

Investigation of Surface characteristics and pore volume using N2 adsorption-desorption isotherm was collected in Table 1, and illustrated in Figure 8a. it’s clear from Table 1 that the biosynthesized Fe0/Fe3O4 NPs sample possesses a relatively higher SBET (89.1 m2. g−1). On the other hand, the data represented graphically in Figure 8a indicate that the biosynthesized Fe0/Fe3O4 NPs exhibit type IV adsorption isotherm, which is obtained with mesoporous (2 nm < pore diameter < 50 nm) solids, with almost vertical and parallel two branches of Hysteresis loop over a wide range of gas uptake which associated with the porous materials that might be consists of agglomerates or uniform spherical structure in a regular arrangement. Furthermore, particles surface characteristics are depicted in Table 1. That obtained from Figure 8b indicates that the mean pore size is located at 10.75 nm, which prove that the synthesized sample possesses a mesoporous structure.

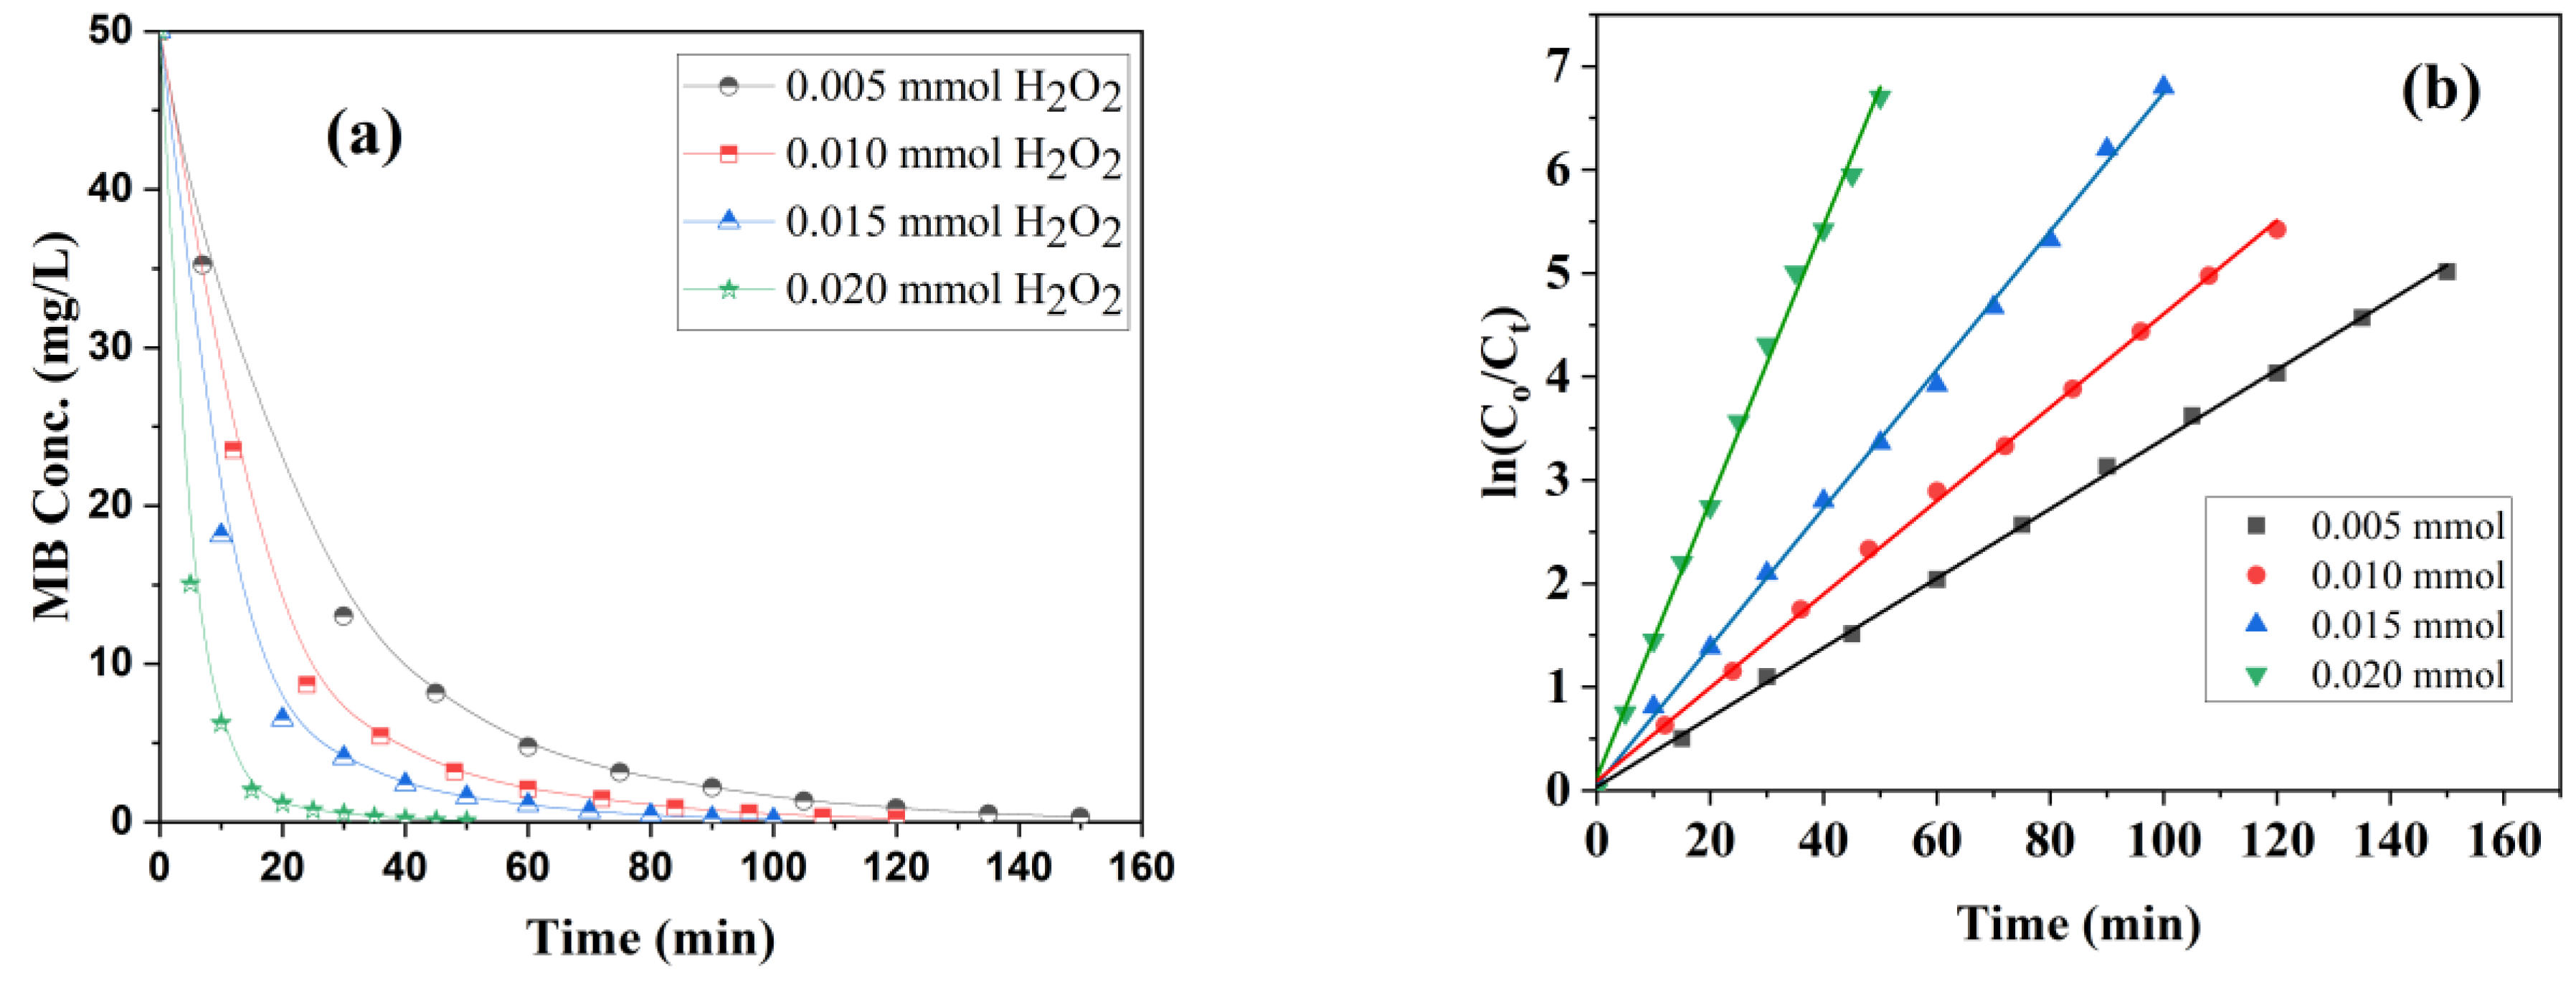
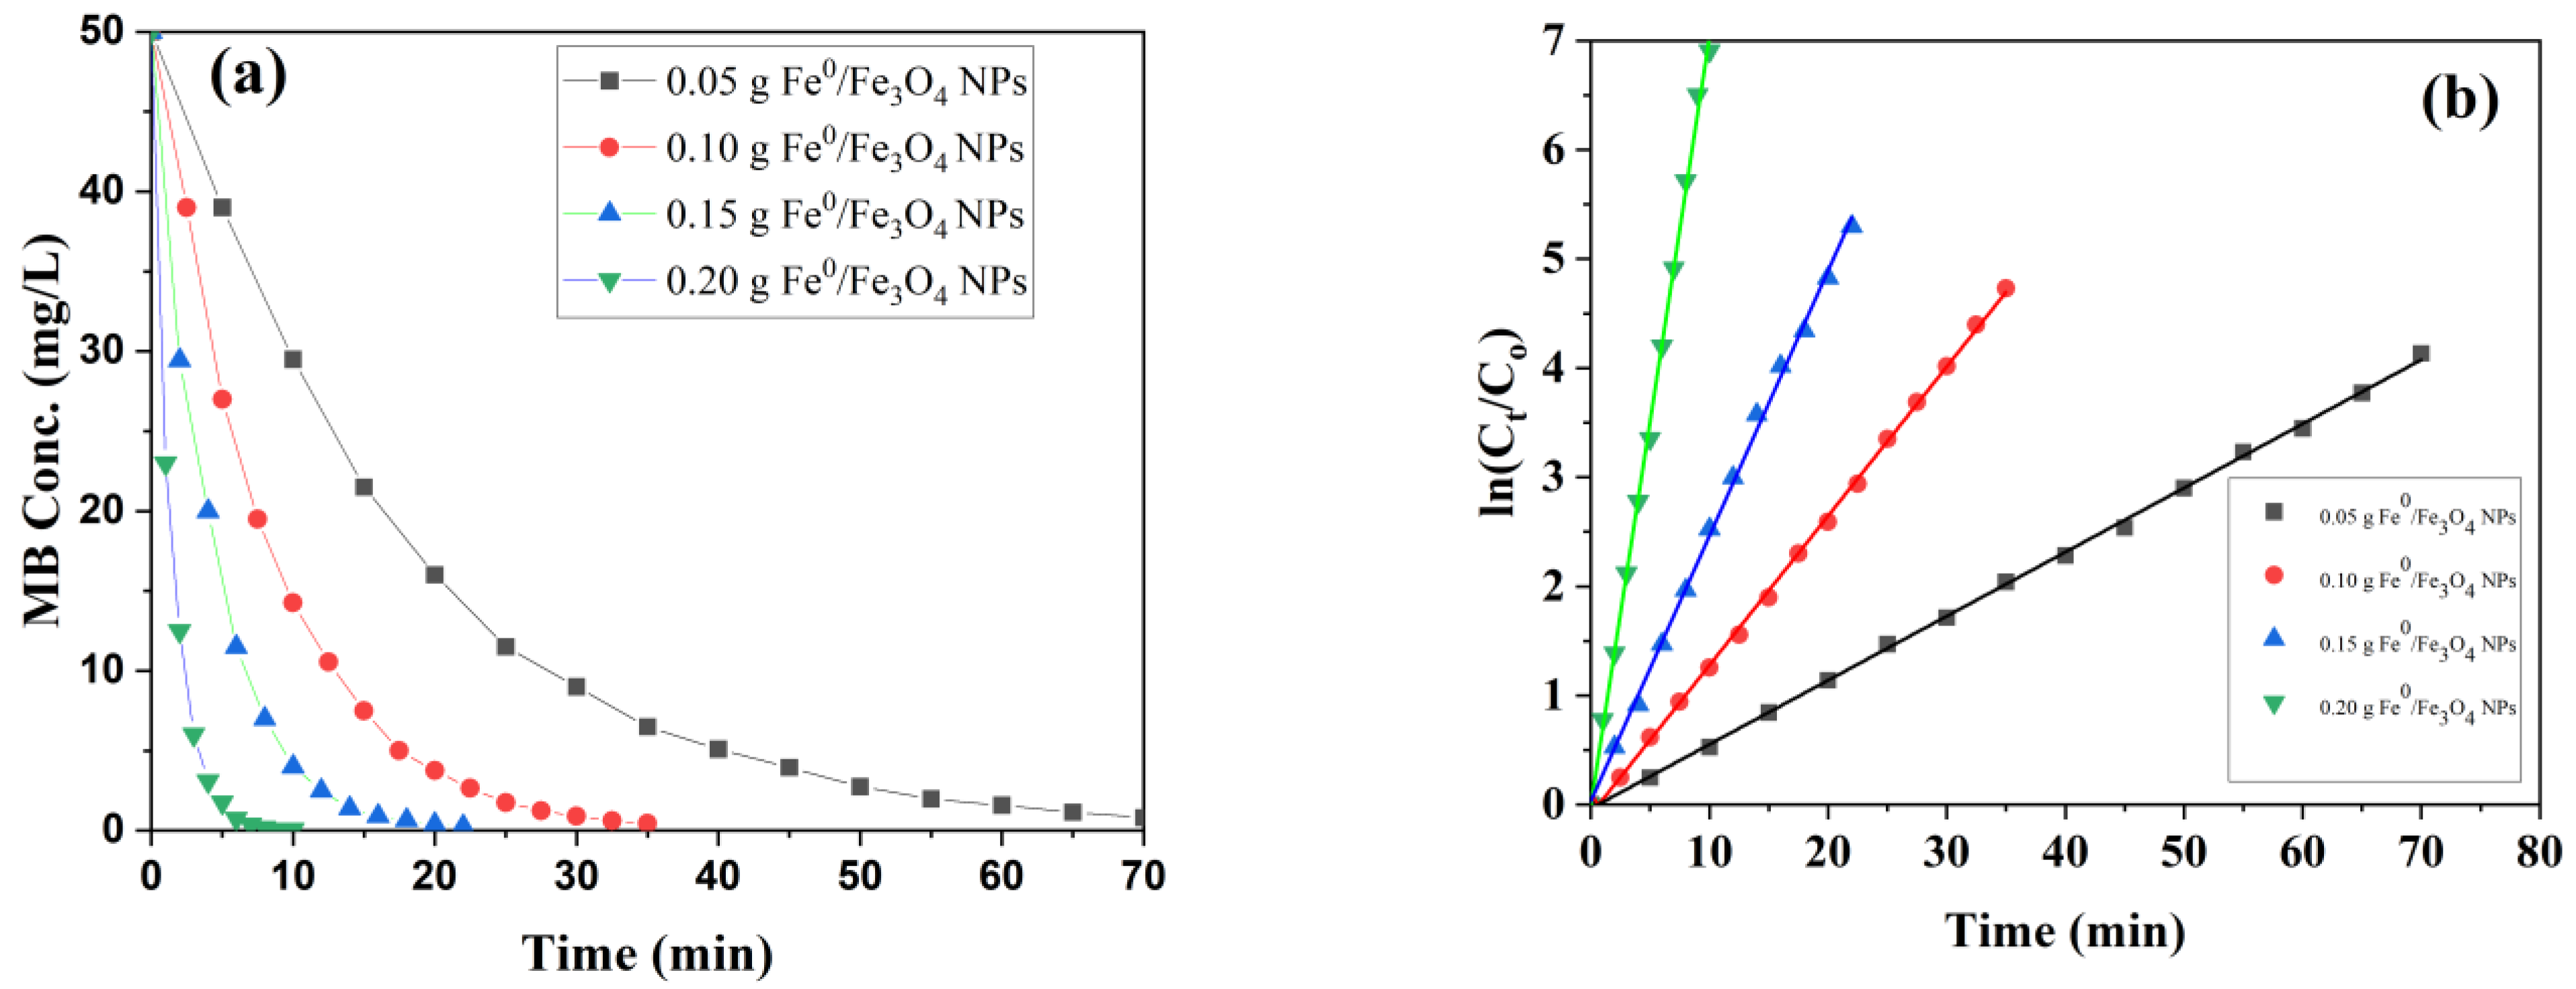
3.8. Catalytic Activity of Fe0/Fe3O4 NPs

The photocatalytic activity of the biosynthesized Fe0/Fe3O4 NPs was tested with Methylene blue dye as an example of the most common organic pigments used in a wide variety of applications [53,54,55]. Different experimental parameters were also investigated in order to depict the most suitable conditions that would possess the highest catalytic activity for the synthesized sample.

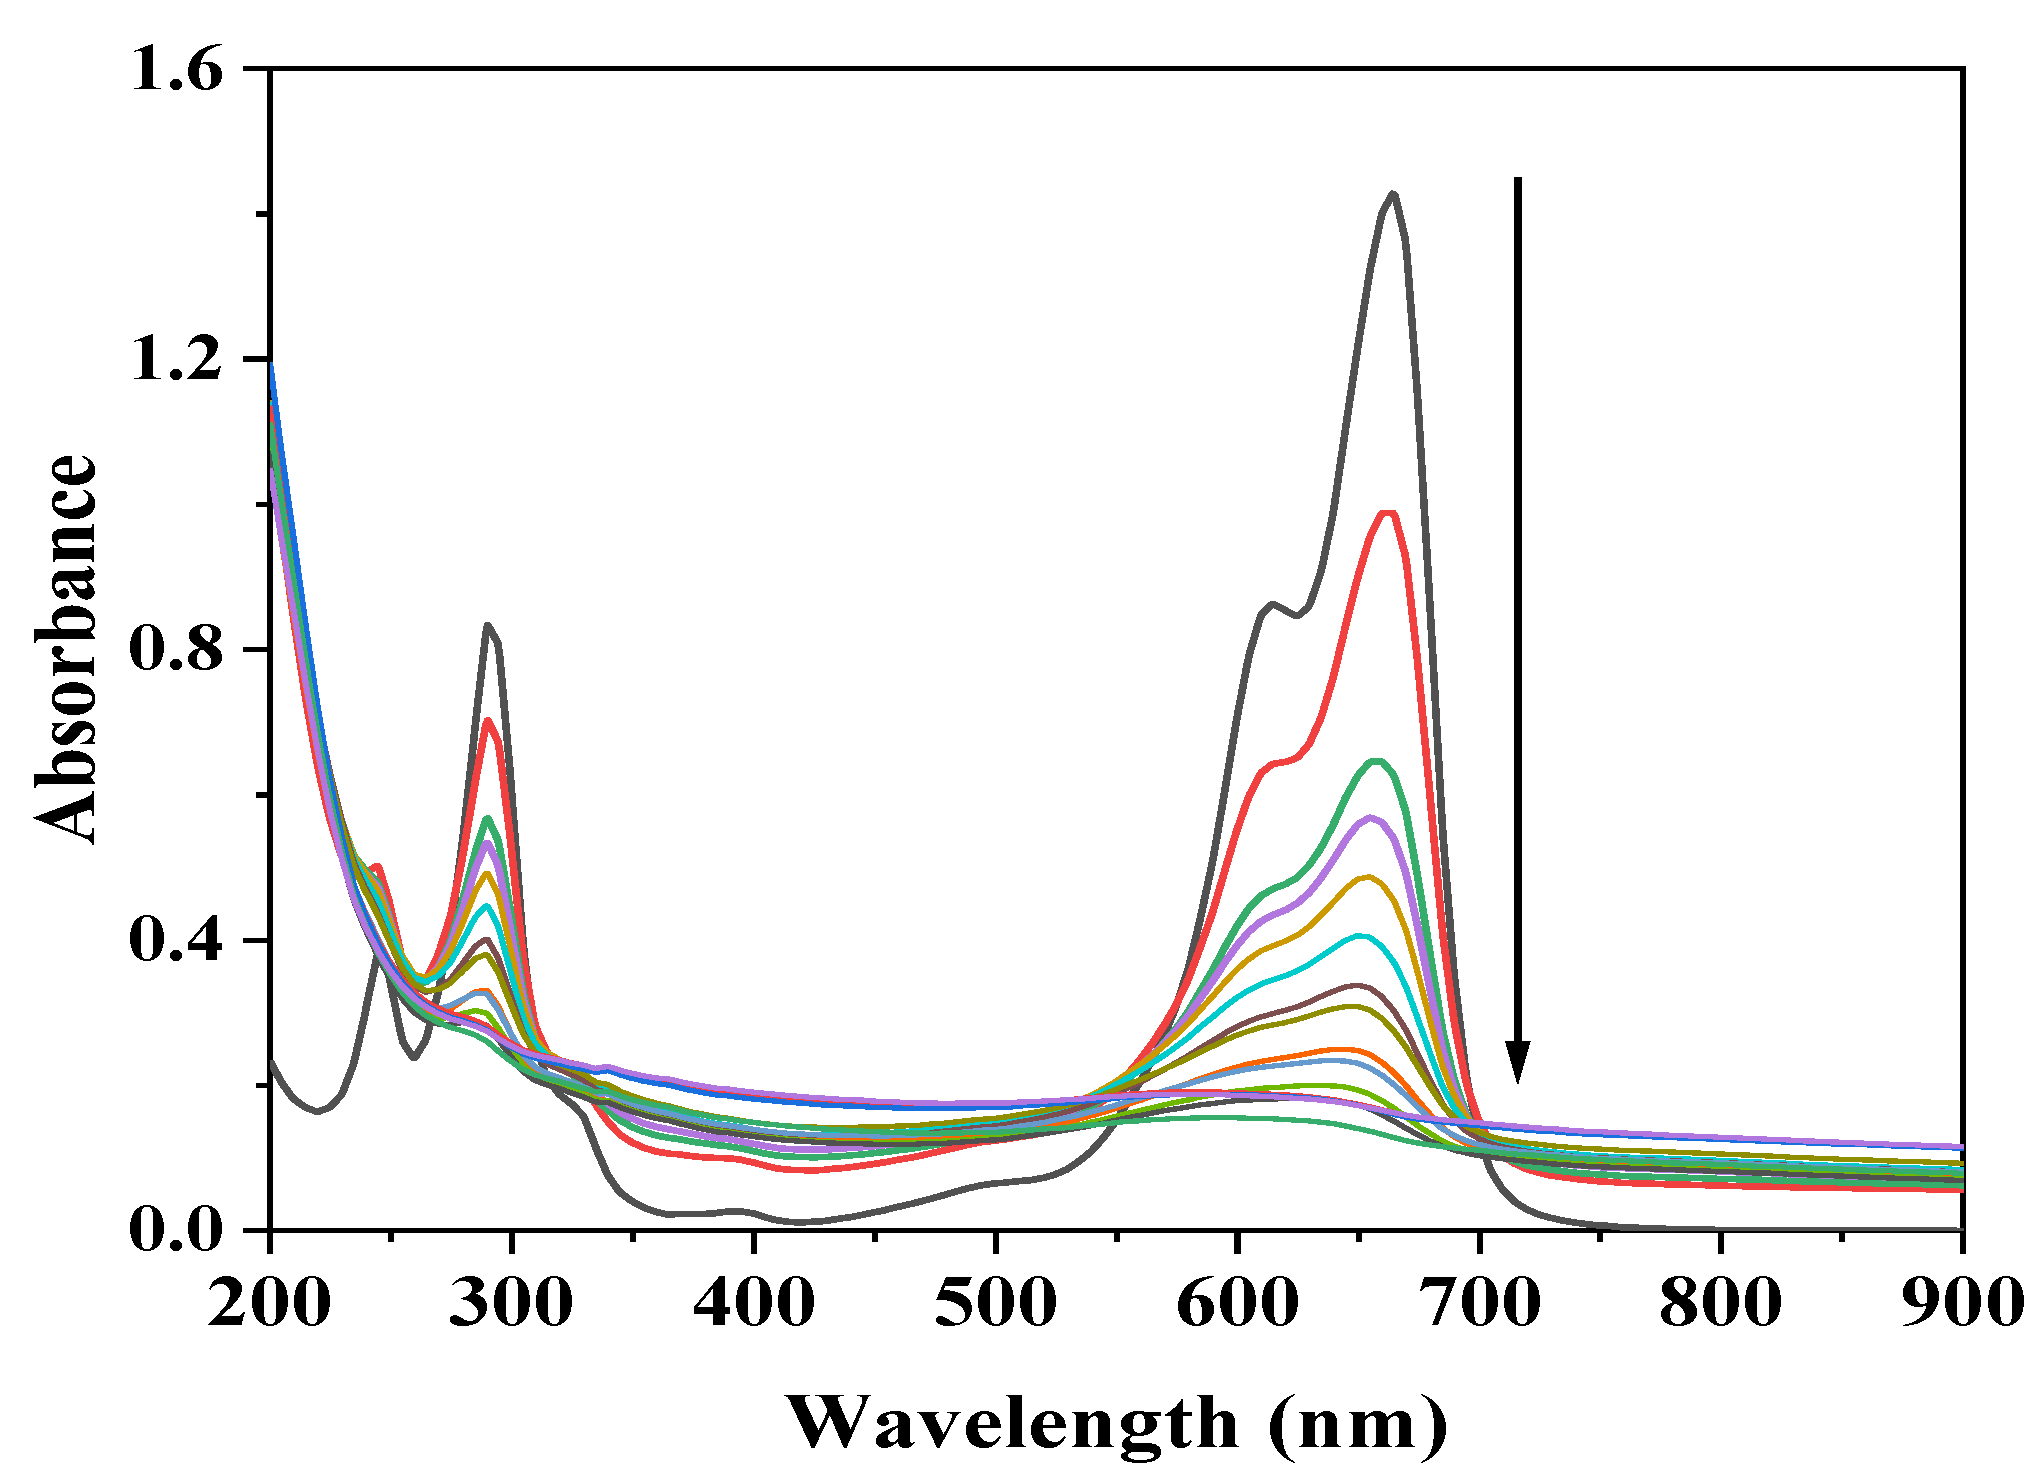
3.8.1. Photolysis of Methylene Blue (MB)

Under varying experimental conditions, MB did not exhibit any degradation capability that indicates marked stability of MB under our working conditions [56]. Therefore, the photodegradation of MB has been investigated in the absence and in the presence of H2O2. The obtained data indicate that the presence of UV only has no degradation effect in the absence of oxygen carrier materials. However, the application Fe0/Fe3O4 NPs with H2O2 indicates a marked degradation behavior for MB due to the formation of highly energetic hydroxyl radicals that attack the organic MB molecules, leading to degradation, shown from the blue color diminishing throughout the process (Figure 9).
Figure 10a, depicts the photodegradation of 50 ppm MB in the presence of different doses of oxygen carrier hydrogen peroxide. The data obtained indicate the dependence of degradation rate on the amount of H2O2 added to the aqueous MB solution. It also reflects that the time consumed during the degradation process was varied according to the amount of H2O2, starting with 150 min for the lower doses of H2O2 (0.005 mmol) and ending with 50 min with the highest amount of H2O2 (0.020 mmol). The rate of reaction can be expressed as follows.
R a t e   =   d M B d t = k H 2   O 2
The results obtained from experimental data for the effect of H2O2 doses on the degradation of MB were found to fit with the Langmuir-Hinshelwood first-order kinetics model as described in the following equation.
l n C o C t = k a p p .   * t
where C o   a n d   C t is the initial and remaining concentration of MB, respectively. The plot of l n C t C o vs. time gives a straight-line relation with a slope equal to the first-order degradation rate constant k a p p . min 1 , as depicted in Figure 10b.
The data illustrated in Table 2 indicate that the increased amount of H2O2 strongly affects the values of the apparent rate constant, which rise to a maximum upon increasing the amount of H2O2 used. This increase could be attributed to the rise in the number of hydroxyl radicals formed after adding H2O2 and exposure to UV irradiation. The linear regression coefficient values (R2) for MB photolysis were within the range of 0.996 to 0.998. the highest value of the apparent reaction rate constant observed (Kapp) of 0.13343 min−1 corresponding to 0.020 mmol H2O2.

3.8.2. Effect of Fe0/Fe3O4 NPs Catalyst on the Photocatalytic Degradation of MB

The investigated behavior of Fe0/Fe3O4 NPs in combination with H2O2 on the degradation of MB is illustrated in Figure 11a,b. The data obtained indicate that adding Fe0/Fe3O4 NPs to the aqueous MB solution dramatically enhances the degradation rate, Figure 11a. This enhanced effect of Fe0/Fe3O4 NPs could be attributed to the formation of highly energetic hydroxyl radicals produced from the decomposition of H2O2 via the catalyst particles as well as the UV irradiation. Furthermore, the reaction kinetics was represented graphically in Figure 11b, and the calculated rate constant was tabulated in Table 2. The results indicate that the highest reaction rate constant (0.704 min−1) was observed with 0.2 g/L Fe0/Fe3O4 NPs.

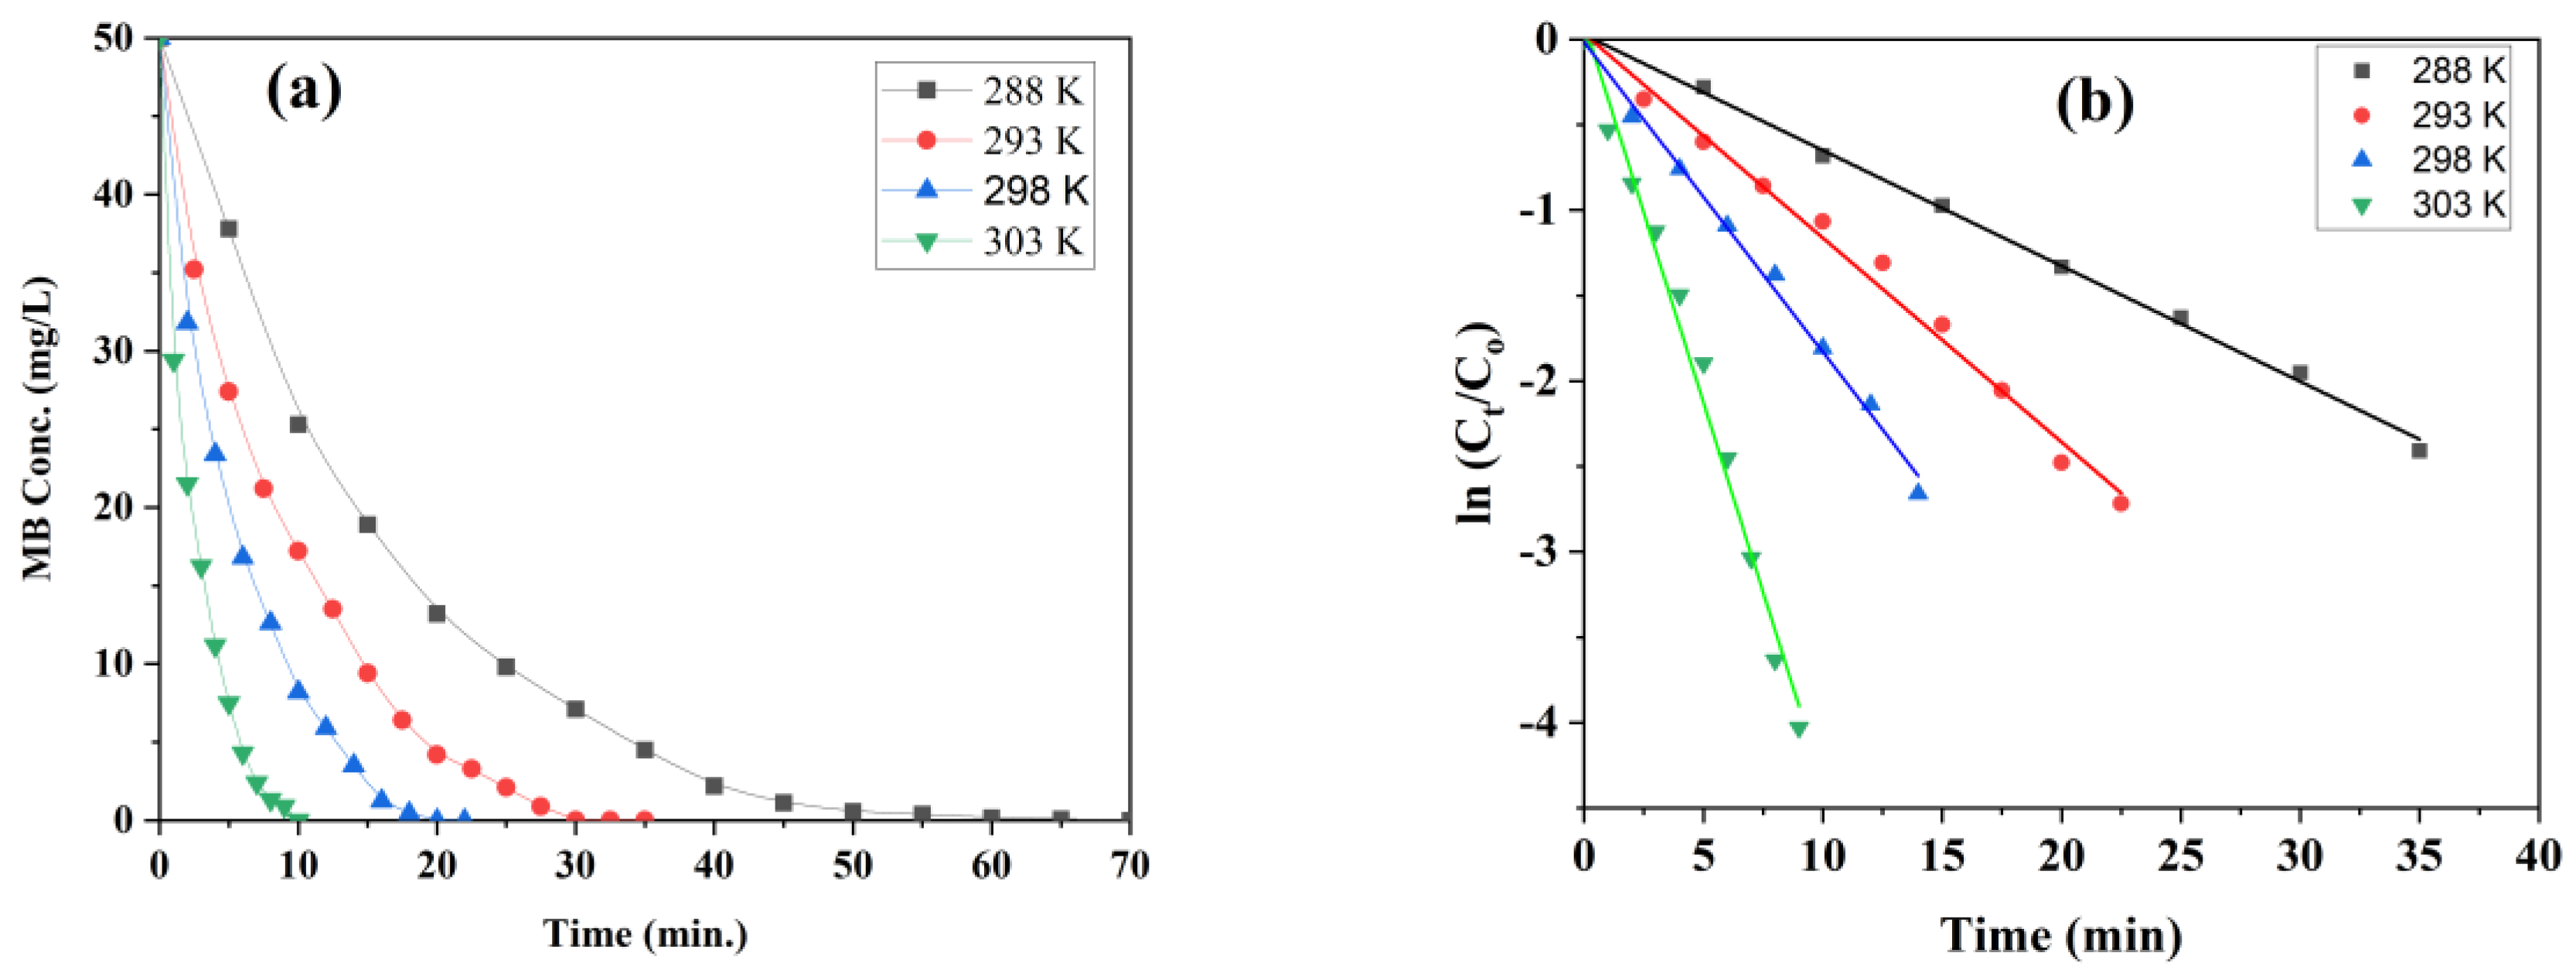
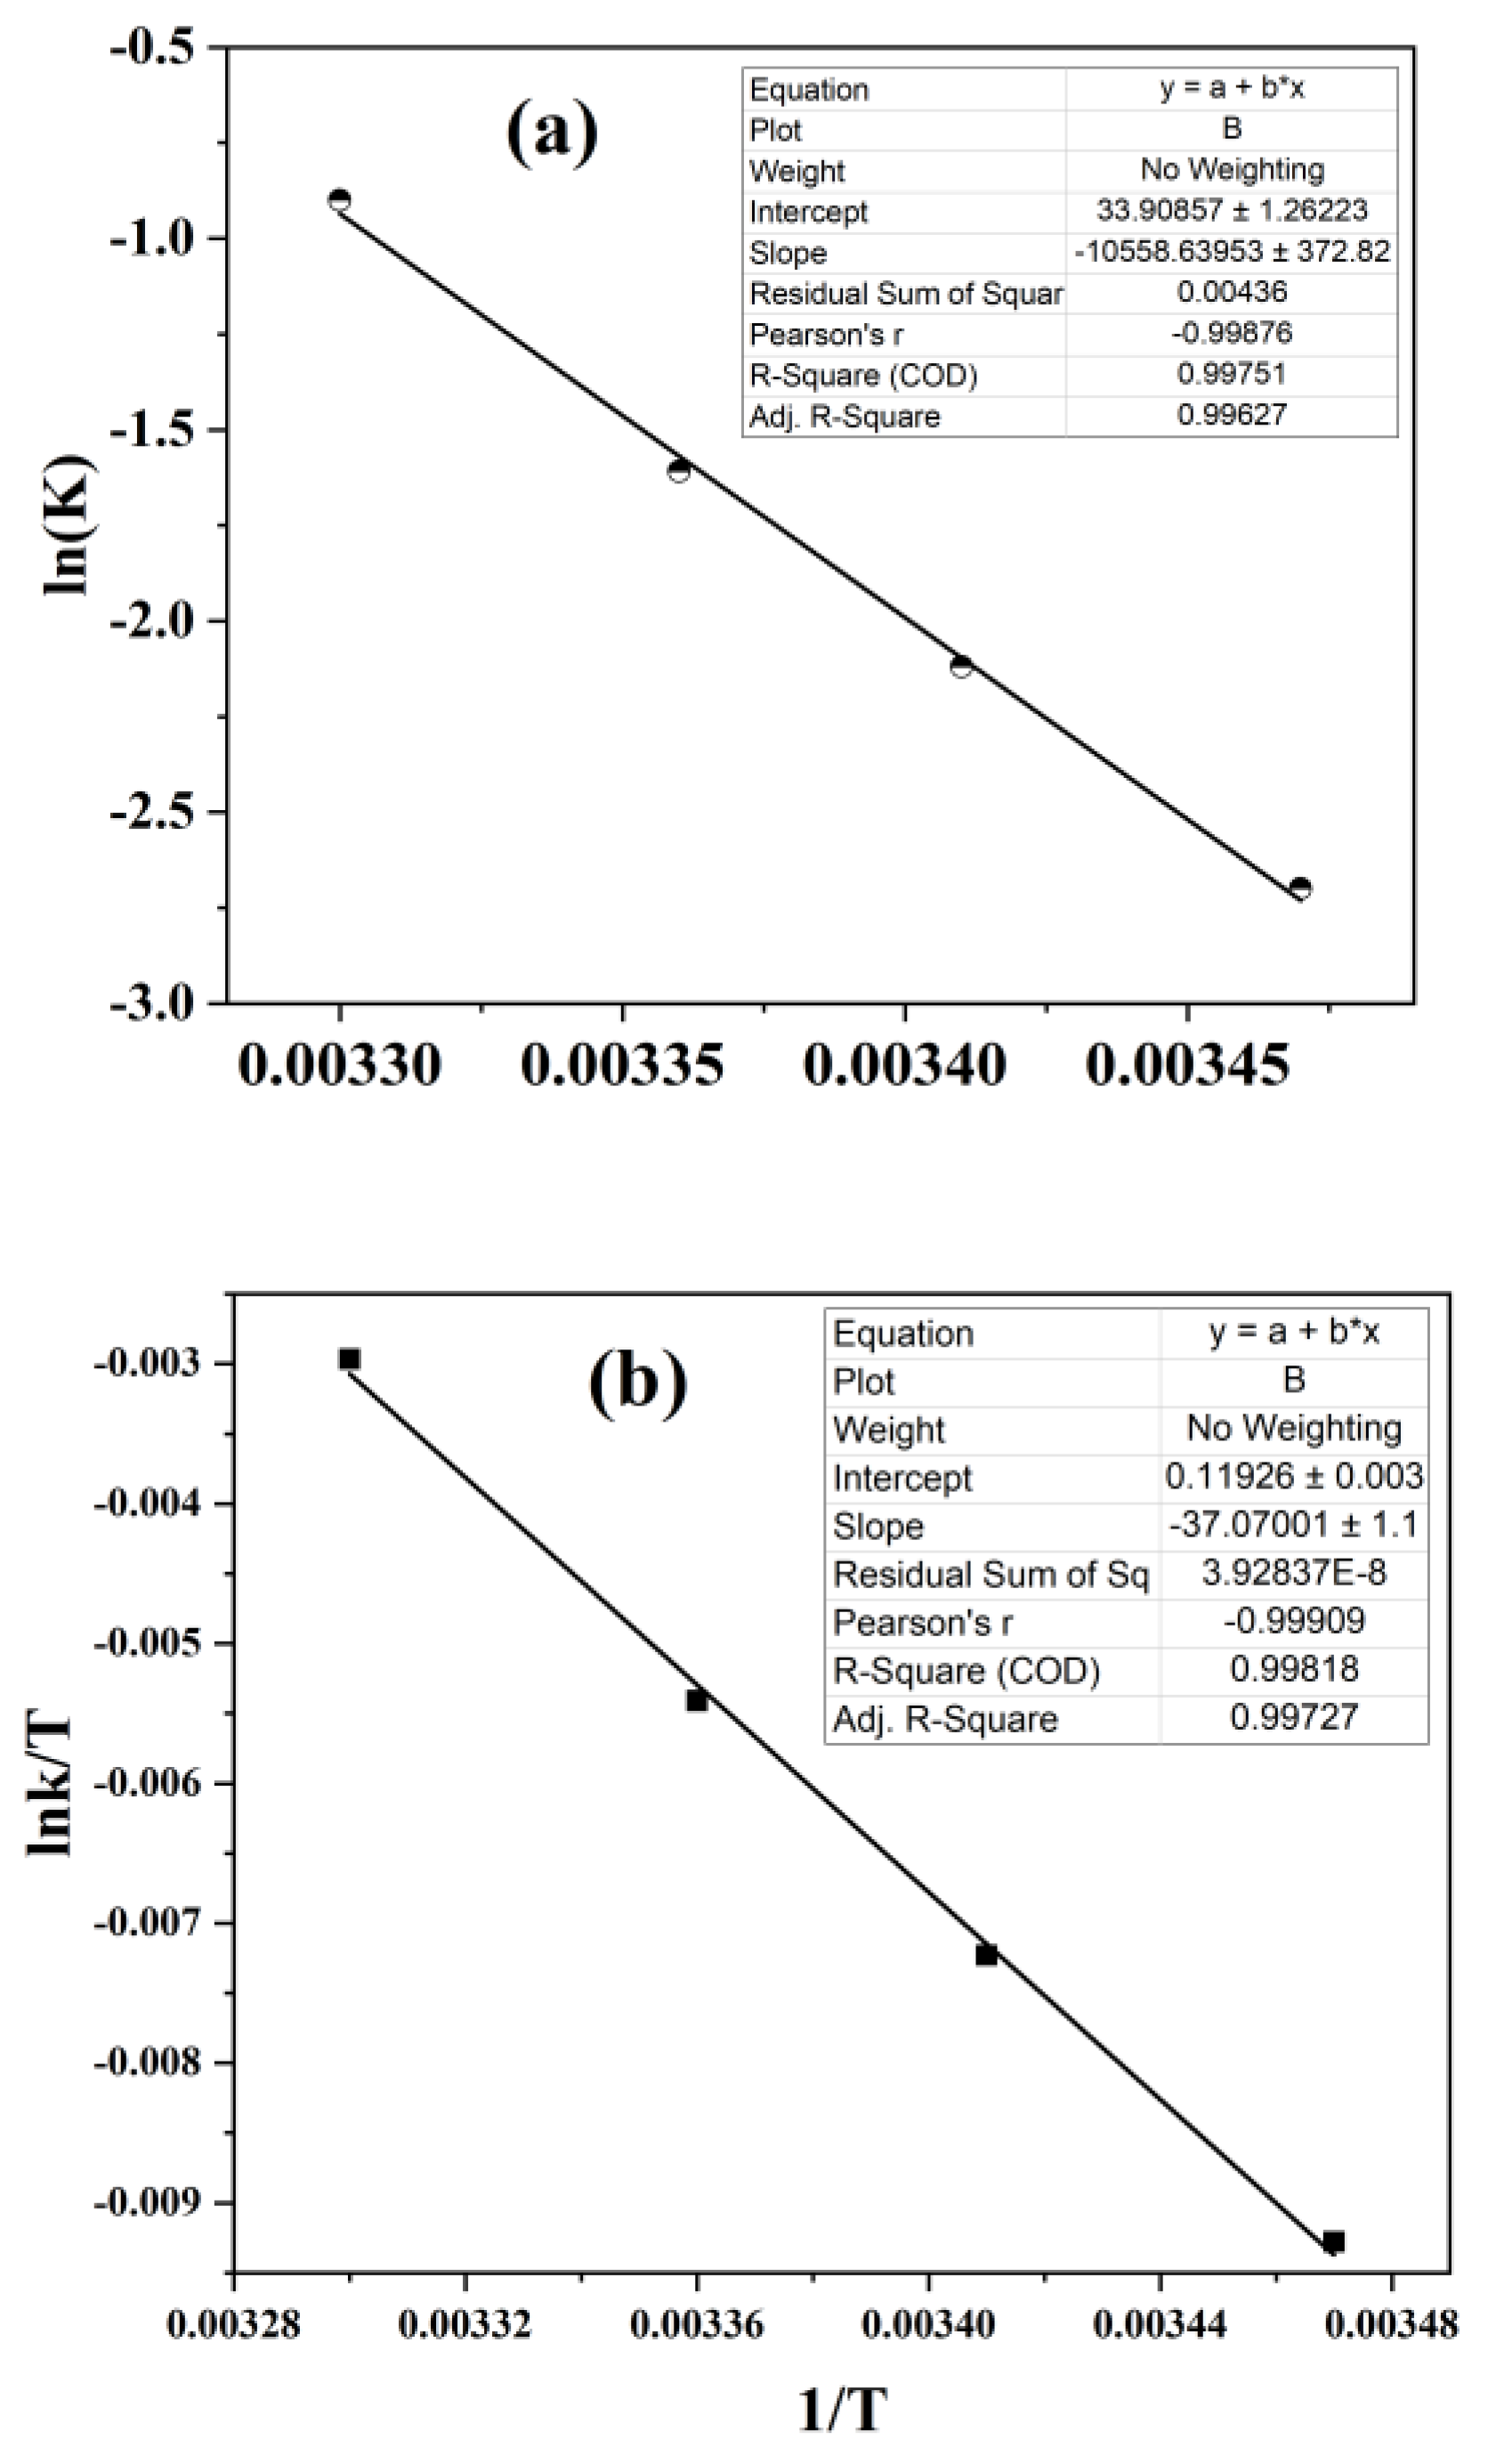
3.8.3. Thermodynamic Study of MB Degradation with Fe0/Fe3O4 NPs

Thermodynamic parameters are considered as one of the most important conditions that could control the process of degradation due to the motion of the increased molecules inside the aqueous solution upon raising the temperature giving rise to the increase in degradation rate. The effect of varying temperatures, i.e., 288, 293, 298, and 303 K on the photodegradation of MB using Fe0/Fe3O4 NPs and H2O2 was evaluated and illustrated in Figure 12a,b. The data obtained indicate that the increase in temperature leads to an enhancing degradation effect on the process of MB degradation, which might reflect the endothermic nature of the degradation of MB under experimental working conditions [53,56,57]. The effect of temperature was examined at different temperatures lying around the ambient temperature (15–30 °C) to avoid energy consumption in the heating process if required in large-scale treatment. The obtained data illustrated in Figure 12a reflect that complete degradation of MB was achieved at different time intervals depending on the temperature applied. For instance, at 288 K the degradation process ended with a complete blue color disappearance after 70 min, whereas at 293 K it consumed 35 min. Furthermore, as the temperature rose when it reached 298 and 303, the degradation ended after 25 and 10 min for 298 and 303 K, respectively. This obvious effect of temperature could be assigned to the formation of OH radicals which became highly energetic due to the absorbance of thermal energy following the increase in temperature.
The investigation of temperature effect kinetics is demonstrated in Figure 12b. The illustrated data indicate a straight-line relation with different slopes depending on the temperature used. The degradation rate was found to be directly proportional to the temperature, and the highest degradation rate was observed at 303 K, which consumed less than 10 min. for complete degradation of 50 mg/ L MB in the presence of 0.05 g Nano iron catalyst. The increasing trend of the obtained rate constant depicted in Table 3 could be assigned to the fact that upon increasing temperature, the collision frequency of the reacted molecules increases with the rise of temperature [56,58,59]. This increase in collision frequency led to an enhancement in the rate of MB degradation.

3.8.4. Thermodynamic Parameters Calculations

Thermodynamic parameters were calculated based on Arrhenius relation:
k = A e E a R T
where k; is the rate constant, A is the frequency constant, Ea. is the activation energy, R is the gas constant (8.314 j. K−1. mol−1) and T is the temperature in K.
The plot of (lnk v/s 1/T ) in the linear transformation of the above equation (eq. 3) and (1/T), as illustrated in Figure 13a, gives a straight-line relation with a slope equal (−Ea/R) from which the value of the energy of activation can be easily calculated:
l n k = l n A E a R T
Furthermore, the calculation of other thermodynamic parameters such as ΔH and ΔS can be carried out using the linear transformation of the Eyring Polanyi equation:
ln k a p p T = K B h + Δ S R Δ H R T
where (KB) is the Boltzmann constant (1.380 × 10⁻²³ J. K−1), h is the Plank’s constant (6.626 × 10⁻²³ J. s−1), ΔH is the change in standard enthalpy, and ΔS is the change in standard entropy.
The plot of ln k a p p T vs 1 T (Figure 10) gives a straight-line relation with a slope equal to Δ H R and intercept equal to K B h + Δ S R . From the value of slope and intercept, ΔH and ΔS can be calculated as shown in Figure 13b.
In our study, the calculated ΔH value is 308.4 KJ. mol−1 and ΔS are −323 KJ. K−1. mol−1, respectively. The negative value obtained for the entropy change indicates that the reaction between MB molecules and the oxidizing species generated on the surface of Fe0/Fe3O4 NPs due to exposure to UV irradiation is nonspontaneous. However, the positive value of ΔH accompanied by the increase of reaction rate constant following the rise of temperature might confirm the endothermic nature of MB photodegradation using our biosynthesized Fe0/Fe3O4 NPs.
Moreover, the values of both ΔH and ΔS can be used to calculate the value of free energy by using the following equation:
Δ G = Δ H T Δ S
The obtained values obtained for ΔG are depicted in Table 3. The higher positive value of ΔG obtained upon elevating the temperatures indicates the non-spontaneity of the photodegradation of MB dye.

4. Conclusions

This work first refers to the successful biogenic synthesis of Fe0/Fe3O4 NPs using Caralluma acutangulla (CA) leaves aqueous extract. Biogenic successfully synthesized Fe0/Fe3O4 NPs was confirmed by various spectroscopic techniques such as UV-Vis, FTIR, TEM, SEM, EDX, XPS, and TGA. The effective surface area of Fe0/Fe3O4 NPs was calculated at 89 m2. g−1, pore size was calculated as 10.75 nm using the Brunauer, Emmett, and Teller (BET) process. The obtained data indicate the formation of zero-valent metallic Fe NPs. The upper surface of zero-valent Fe NPs forms a magnetite phase with semiconductor properties obtained as 1.94 band gap energy. Particles size distribution was observed from 1 to 18 nm and diameter average size was calculated as 9.5 nm. The synthesized Fe0/Fe3O4 NPs were applied in the photodegradation of MB dye under different experimental conditions using H2O2. Biogenic synthesized Fe0/Fe3O4 NPs possess high degradation efficiency with a nonspontaneous endothermic nature with ΔG = +95.1 KJ. K−1.mol−1. Biogenic synthesized Fe0/Fe3O4 NPs using CA successfully may apply for successive removal of organic waste from polluted water. The obtained data also indicate that our method can be applied for the successful synthesis of Fe0/Fe3O4 NPs which can be used in the remediation of organic pollutants through the photodegradation techniques.

Author Contributions

Conceptualization, M.M.E.-M.; methodology, W.M.A., M.M.E.-M., N.H. and A.A.A.; software, W.M.A., N.H.; Investigation, A.M.B.; Validation, W.M.A. and A.M.B.; Formal analysis, A.M.B.; Visualization, A.A.A.; Writing — original draft, M.M.E.-M., N.H.; Writing — review & editing, N.H. All authors have read and agreed to the published version of the manuscript.

Funding

This research work is funded by Deanship of Scientific Research, Jazan University, Jazan, Kingdom of Saudi Arabia with the reference number as Waed project, W43-068.

Data Availability Statement

Not applicable.

Acknowledgments

The authors are acknowledging the Deanship of Scientific Research, Jazan University, Jazan, Kingdom of Saudi Arabia, for funding the project. The reference number is Waed project, W43-068.

Conflicts of Interest

The authors declare no conflict of interest.

References

  1. Abdeen, M.; Sabry, S.; Ghozlan, H.; El-Gendy, A.A.; Carpenter, E.E. Microbial-Physical Synthesis of Fe and Fe3O4 Magnetic Nanoparticles Using Aspergillus niger YESM1 and Supercritical Condition of Ethanol. J. Nanomater. 2016, 2016, 9174891. [Google Scholar] [CrossRef] [Green Version]
  2. Chen, S.; Yuan, R.; Chai, Y.; Hu, F. Electrochemical sensing of hydrogen peroxide using metal nanoparticles: A review. Microchim. Acta 2013, 180, 15–32. [Google Scholar] [CrossRef]
  3. Arya, A.; Mishra, V.; Chundawat, S.T. Green synthesis of silver nanoparticles from green algae (Botryococcus braunii) and its catalytic behavior for the synthesis of benzimidazoles. Chem. Data Collect. 2019, 20, 100190. [Google Scholar] [CrossRef]
  4. Hussain, M.; Raja, N.I.; Iqbal, M.; Aslam, S. Applications of Plant Flavonoids in the Green Synthesis of Colloidal Silver Nanoparticles and Impacts on Human Health, Iranian Journal of Science and Technology. Trans. A Sci. 2019, 43, 1381–1392. [Google Scholar]
  5. Saleh, T.A.; Fadillah, G.; Saputra, O.A. Nanoparticles as components of electrochemical sensing platforms for the detection of petroleum pollutants: A review. TrAC Trends Anal. Chem. 2019, 118, 194–206. [Google Scholar] [CrossRef]
  6. Turan, N.B.; Erkan, H.S.; Engin, G.O.; Bilgili, M.S. Nanoparticles in the aquatic environment: Usage, properties, transformation and toxicity—A review. Process Saf. Environ. Prot. 2019, 130, 238–249. [Google Scholar] [CrossRef]
  7. Vasantharaj, S.; Sathiyavimal, S.; Senthilkumar, P.; LewisOscar, F.; Pugazhendhi, A. Biosynthesis of iron oxide nanoparticles using leaf extract of Ruellia tuberosa: Antimicrobial properties and their applications in photocatalytic degradation. J. Photochem. Photobiol. B Biol. 2019, 192, 74–82. [Google Scholar] [CrossRef]
  8. Mourdikoudis, S.; Pallares, R.M.; Thanh, N.T. Characterization techniques for nanoparticles: Comparison and complementarity upon studying nanoparticle properties. Nanoscale 2018, 10, 12871–12934. [Google Scholar] [CrossRef] [Green Version]
  9. Srikar, S.K.; Giri, D.D.; Pal, D.B.; Mishra, P.K.; Upadhyay, S.N. Green synthesis of silver nanoparticles: A review. Green Sustain. Chem. 2016, 6, 34–56. [Google Scholar] [CrossRef] [Green Version]
  10. Campos, E.A.; Pinto, D.V.B.S.; Oliveira, J.I.S.d.; Mattos, E.d.C.; Dutra, R.d.C.L. Synthesis, characterization and applications of iron oxide nanoparticles-a short review. J. Aerosp. Technol. Manag. 2015, 7, 267–276. [Google Scholar] [CrossRef] [Green Version]
  11. Thakkar, K.N.; Mhatre, S.S.; Parikh, R.Y. Biological synthesis of metallic nanoparticles. Nanomed. Nanotechnol. Biol. Med. 2010, 6, 257–262. [Google Scholar] [CrossRef]
  12. Abhilash, K.; Revati, B.D. Pandey, Microbial synthesis of iron-based nanomaterials—A review. Bull. Mater. Sci. 2011, 34, 191–198. [Google Scholar] [CrossRef] [Green Version]
  13. Bhatia, S. Nanoparticles types, classification, characterization, fabrication methods and drug delivery applications. In Natural Polymer Drug Delivery Systems; Springer: Berlin/Heidelberg, Germany, 2016; pp. 33–93. [Google Scholar]
  14. Ealia, S.A.M.; Saravanakumar, M. A Review on the Classification, Characterisation, Synthesis of Nanoparticles and Their Application; IOP Conference Series: Materials Science and Engineering; IOP Publishing: Bristol, UK, 2017; p. 032019. [Google Scholar]
  15. Amoabediny, G.; Haghiralsadat, F.; Naderinezhad, S.; Helder, M.N.; Kharanaghi, E.A.; Arough, J.M.; Zandieh-Doulabi, B. Overview of preparation methods of polymeric and lipid-based (niosome, solid lipid, liposome) nanoparticles: A comprehensive review. Int. J. Polym. Mater. Polym. Biomater. 2018, 67, 383–400. [Google Scholar] [CrossRef]
  16. Khan, I.; Saeed, K.; Khan, I. Nanoparticles: Properties, applications and toxicities. Arab. J. Chem. 2019, 12, 908–931. [Google Scholar] [CrossRef]
  17. Mei, W.; Wu, Q. Applications of metal nanoparticles in medicine/metal nanoparticles as anticancer agents. In Metal Nanoparticles: Synthesis and Applications in Pharmaceutical Sciences; Wiley: Hoboken, NJ, USA, 2018; pp. 169–190. [Google Scholar]
  18. Borah, D.; Das, N.; Das, N.; Bhattacharjee, A.; Sarmah, P.; Ghosh, K.; Chandel, M.; Rout, J.; Pandey, P.; Ghosh, N.N. Alga-mediated facile green synthesis of silver nanoparticles: Photophysical, catalytic and antibacterial activity. Appl. Organomet. Chem. 2020, 34, e5597. [Google Scholar] [CrossRef]
  19. Mughal, B.; Zaidi, S.Z.J.; Zhang, X.; Hassan, S.U. Biogenic nanoparticles: Synthesis, characterisation and applications. Appl. Sci. 2021, 11, 2598. [Google Scholar] [CrossRef]
  20. Malhotra, N.; Lee, J.-S.; Liman, R.A.D.; Ruallo, J.M.S.; Villaflores, O.B.; Ger, T.-R.; Hsiao, C.-D. Potential toxicity of iron oxide magnetic nanoparticles: A review. Molecules 2020, 25, 3159. [Google Scholar] [CrossRef]
  21. Sharma, P.; Kumari, S.; Ghosh, D.; Yadav, V.; Vij, A.; Rawat, P.; Kumar, S.; Sinha, C.; Saini, S.; Sharma, V. Capping agent-induced variation of physicochemical and biological properties of α-Fe2O3 nanoparticles. Mater. Chem. Phys. 2021, 258, 123899. [Google Scholar] [CrossRef]
  22. Gao, L.; Fan, K.; Yan, X. Iron oxide nanozyme: A multifunctional enzyme mimetics for biomedical application. Nanozymology 2020, 105–140. [Google Scholar]
  23. Bhuiyan, M.S.H.; Miah, M.Y.; Paul, S.C.; Aka, T.D.; Saha, O.; Rahaman, M.M.; Sharif, M.J.I.; Habiba, O.; Ashaduzzaman, M. Green synthesis of iron oxide nanoparticle using Carica papaya leaf extract: Application for photocatalytic degradation of remazol yellow RR dye and antibacterial activity. Heliyon 2020, 6, e04603. [Google Scholar] [CrossRef]
  24. Li, X.-Q.; Zhang, W.-X. Iron nanoparticles: The core−shell structure and unique properties for Ni (II) sequestration. Langmuir 2006, 22, 4638–4642. [Google Scholar] [CrossRef] [PubMed]
  25. Radini, I.A.; Hasan, N.; Malik, M.A.; Khan, Z. Biosynthesis of iron nanoparticles using Trigonella foenum-graecum seed extract for photocatalytic methyl orange dye degradation and antibacterial applications. J. Photochem. Photobiol. B 2018, 183, 154–163. [Google Scholar] [CrossRef] [PubMed]
  26. Alshehri, A.; Malik, M.A.; Khan, Z.; Al-Thabaiti, S.A.; Hasan, N. Biofabrication of Fe nanoparticles in aqueous extract of Hibiscus sabdariffa with enhanced photocatalytic activities. RSC Adv. 2017, 7, 25149–25159. [Google Scholar] [CrossRef] [Green Version]
  27. Zhang, R.; Zhou, Y.; Yan, X.; Fan, K. Advances in chiral nanozymes: A review. Microchim. Acta 2019, 186, 782. [Google Scholar] [CrossRef]
  28. Jubran, A.S.; Al-Zamely, O.M.; Al-Ammar, M.H. A study of iron oxide nanoparticles synthesis by using bacteria. Int. J. Pharm. Qual. Assur. 2020, 11, 1–8. [Google Scholar] [CrossRef]
  29. Li, Y.; Wang, Z.; Liu, R. Superparamagnetic α-Fe2O3/Fe3O4 Heterogeneous Nanoparticles with Enhanced Biocompatibility. Nanomaterials 2021, 11, 834. [Google Scholar] [CrossRef]
  30. Venkateswarlu, S.; Yakkate, S.; Balaji, T.; Prathima, B.; Jyothi, N.V. Biogenic synthesis of Fe3O4 magnetic nanoparticles using plantain peel extract. Mater. Lett. 2013, 100, 241–244. [Google Scholar] [CrossRef]
  31. Silva, C.; Marchetti, S.; Farro, A., Jr.; Silva, T.; Assaf, J.; Rangel, M. Effect of gadolinium on the catalytic properties of iron oxides for WGSR. Catal. Today 2013, 213, 127–134. [Google Scholar] [CrossRef] [Green Version]
  32. Laurent, S.; Forge, D.; Port, M.; Roch, A.; Robic, C.; Elst, L.V.; Muller, R.N. Magnetic iron oxide nanoparticles: Synthesis, stabilization, vectorization, physicochemical characterizations, and biological applications. Chem. Rev. 2008, 108, 2064–2110. [Google Scholar] [CrossRef]
  33. Wu, W.; He, Q.; Jiang, C. Magnetic iron oxide nanoparticles: Synthesis and surface functionalization strategies. Nanoscale Res. Lett. 2008, 3, 397–415. [Google Scholar] [CrossRef] [Green Version]
  34. Ovais, M.; Khalil, A.T.; Raza, A.; Khan, M.A.; Ahmad, I.; Islam, N.U.; Saravanan, M.; Ubaid, M.F.; Ali, M.; Shinwari, Z.K. Green synthesis of silver nanoparticles via plant extracts: Beginning a new era in cancer theranostics. Nanomedicine 2016, 12, 3157–3177. [Google Scholar] [CrossRef] [PubMed]
  35. Adelere, I.A.; Lateef, A. A novel approach to the green synthesis of metallic nanoparticles: The use of agro-wastes, enzymes, and pigments. Nanotechnol. Rev. 2016, 5, 567–587. [Google Scholar] [CrossRef]
  36. Salam, H.A.; Rajiv, P.; Kamaraj, M.; Jagadeeswaran, P.; Gunalan, S.; Sivaraj, R. Plants: Green route for nanoparticle synthesis. Int. Res. J. Biol. Sci. 2012, 1, 85–90. [Google Scholar]
  37. Latif, M.; Abbas, S.; Kormin, F.; Mustafa, M. Green synthesis of plant-mediated metal nanoparticles: The role of polyphenols. Asian J. Pharm. Clin. Res. 2019, 12, 75–84. [Google Scholar] [CrossRef]
  38. Gahlawat, G.; Choudhury, A.R. A review on the biosynthesis of metal and metal salt nanoparticles by microbes. RSC Adv. 2019, 9, 12944–12967. [Google Scholar] [CrossRef] [PubMed] [Green Version]
  39. Schröfel, A.; Kratošová, G.; Šafařík, I.; Šafaříková, M.; Raška, I.; Shor, L.M. Applications of biosynthesized metallic nanoparticles—A review. Acta Biomater. 2014, 10, 4023–4042. [Google Scholar] [CrossRef]
  40. Pantidos, N.; Horsfall, L.E. Biological synthesis of metallic nanoparticles by bacteria, fungi and plants. J. Nanomed. Nanotechnol. 2014, 5, 1. [Google Scholar] [CrossRef]
  41. Chaudhary, S.A.; Waṭaniyah, M.; Miyah, M.W.A.Z. Flora of the Kingdom of Saudi Arabia, Illustrated; Ministry of Agriculture & Water National Agriculture and Water Research Center: Riyadh, Saudi Arabia, 1999. [Google Scholar]
  42. Al-Fifi, Z.; Masrahi, Y.; Aly, M.; Al-Turki, T. In vitro Anticancer Activity of Caralluma acutangula (Decne.) N.E.Br. Extract. Int. J. Pharm. Sci. Rev. Res. 2016, 38, 59–63. [Google Scholar]
  43. Alamier, W.M.; Hasan, N.; Ali, S.K.; Oteef, M.D.Y. Biosynthesis of Ag Nanoparticles Using Caralluma acutangula Extract and Its Catalytic Functionality towards Degradation of Hazardous Dye Pollutants. Crystals 2022, 12, 1069. [Google Scholar] [CrossRef]
  44. Albaghdadi, W.A.; Abdulridha, W.A.; Latif, D. Synthesis and Some Physical Properties of Magnetite (Fe3O4) NPS. J. Multidiscip. Eng. Sci. Stud. 2016, 2, 341–345. [Google Scholar]
  45. Korpany, K.; Majewski, D.; Chiu, C.; Cross, S.; Blum, A. Iron Oxide Surface Chemistry: The Effect of Chemical Structure on Binding in Benzoic Acid and Catechol Derivatives. Langmuir 2017, 33, 3000–3013. [Google Scholar] [CrossRef]
  46. Gusrizal, G.; Santosa, S.; Kunarti, E.; Rusdiarso, B. Synthesis of Silver Nanoparticles by Reduction of Silver Ion with m-Hydroxybenzoic Acid. Asian J. Chem. 2017, 29, 1417–1422. [Google Scholar] [CrossRef]
  47. Fadliah, D.S.; Wahyuni, E.; Santosa, S. Synthesis of Silver Nanoparticles Using o-Hydroxybenzoic, p-Hydroxybenzoic, and o,p-Dihydroxybenzoic Acids as Reducing Agents. Mater. Sci. Forum 2017, 901, 26–31. [Google Scholar]
  48. Sharma, G.; Jeevanandam, P. Synthesis of self-assembled prismatic iron oxide nanoparticles by a novel thermal decomposition route. RSC Adv. 2012, 3, 189–200. [Google Scholar] [CrossRef]
  49. Aksimentyeva, O.; Savchyn, V.; Dyakonov, V.; Piechota, S.; Horbenko, Y.; Demchenko, P.; Popov, A.; Szymczak, H. Modification of Polymer-Magnetic Nanoparticles by Luminescent and Conducting Substances. Mol. Cryst. Liq. Cryst. 2014, 590, 35–42. [Google Scholar] [CrossRef]
  50. Jozwiak, W.; Kaczmarek, E.; Maniecki, T.; Ignaczak, W.; Maniukiewicz, W. Reduction behavior of iron oxides in hydrogen and carbon monoxide atmospheres. Appl. Catal. A-Gen. 2007, 326, 17–27. [Google Scholar] [CrossRef]
  51. Cai, N.; Larese-Casanova, P. Facile Synthesis and Reuse of Magnetic Black Carbon Magnetite (BC-Mag) for Fast Carbamazepine Removal from Water. Nanomaterials 2020, 10, 213. [Google Scholar] [CrossRef] [Green Version]
  52. Dalal, U.; Reddy, S.N. A novel nano zero-valent iron biomaterial for chromium (Cr(6+) to Cr(3+)) reduction. Environ. Sci. Pollut. Res. Int. 2019, 26, 10631–10640. [Google Scholar] [CrossRef]
  53. El-Naggar, M.E.; Ali, O.A.A.; Saleh, D.I.; Abu-Saied, M.A.; Ahmed, M.K.; Abdel-Fattah, E.; Mansour, S.F. Degradation of methylene blue using co-dopants Mg and Se in an hydroxyapatite composite. Luminescence 2022, 37, 399–407. [Google Scholar] [CrossRef]
  54. Emara, M.M.; Tourky, A.S.; El-Moselhy, M.M. Structural modification of mordenite zeolite with Fe for the photo-degradation of EDTA. J. Hazard. Mater. 2009, 166, 514–522. [Google Scholar] [CrossRef]
  55. Elsayed, M.S.; Ahmed, I.A.; Bader, D.M.D.; Hassan, A.F. Green Synthesis of Nano Zinc Oxide/Nanohydroxyapatite Composites Using Date Palm Pits Extract and Eggshells: Adsorption and Photocatalytic Degradation of Methylene Blue. Nanomaterials 2021, 12, 49. [Google Scholar] [CrossRef]
  56. El-Moselhy, M.M. Methylene blue dye degradation using C-100 polymeric material modified with ZnO nanoparticles. Desalination Water Treat. 2016, 57, 25800–25811. [Google Scholar] [CrossRef]
  57. El-Moselhy, M.M. Photo-degradation of acid red 44 using Al and Fe modified silicates. J. Hazard. Mater. 2009, 169, 498–508. [Google Scholar] [CrossRef]
  58. Liu, C.; Yang, B.; Chen, J.; Jia, F.; Song, S. Synergetic degradation of Methylene Blue through photocatalysis and Fenton reaction on two-dimensional molybdenite-Fe. J. Environ. Sci. 2022, 111, 11–23. [Google Scholar] [CrossRef]
  59. Perumal, V.; Inmozhi, C.; Uthrakumar, R.; Robert, R.; Chandrasekar, M.; Mohamed, S.B.; Honey, S.; Raja, A.; Al-Mekhlafi, F.A.; Kaviyarasu, K. Enhancing the photocatalytic performance of surface—Treated SnO2 hierarchical nanorods against methylene blue dye under solar irradiation and biological degradation. Environ. Res. 2022, 209, 112821. [Google Scholar] [CrossRef]
Figure 1. Schematic representation for (a), Preparation of CA aqueous extract (b) biosynthesis process of Fe0/Fe3O4 NPs.
Crystals 12 01510 g001
Figure 2. (a). UV-Vis absorbance spectra of (I) FeCl3 Solution, (II) Fe0/Fe3O4 NPs (III) only CA. (b), Determination of the optical band gap of the synthesized Fe0/Fe3O4 NPs.
Crystals 12 01510 g002
Figure 3. (a) FTIR of the synthesized (I); Fe0/Fe3O4 NPs after calcination, (II) Fe0/Fe3O4 NPs before the calcination and (III) shows the CA aqueous extract, (b) Thermogravimetric Analysis (TGA) of Fe0/Fe3O4 NPs.
Crystals 12 01510 g003
Figure 4. X-Ray diffraction patterns of iron oxide NPs calcined at 400 °C.
Crystals 12 01510 g004
Figure 5. (a), HRTEM and electron diffraction pattern, (b) Particles size distribution of the biosynthesized Fe0/Fe3O4 NPs.
Crystals 12 01510 g005
Figure 6. (a), EDX elemental analysis, (b) SEM images of the biosynthesized Fe0/Fe3O4 NPs.
Crystals 12 01510 g006
Figure 7. (a), Survey XPS spectrum of biosynthesized Fe0/Fe3O4 NPs with the assigned peaks of the corresponding elements. (b), Narrow scan high resolution XPS spectra of synthesized Fe0/Fe3O4 NPs. (c), O1s Narrow scan high resolution XPS spectra of synthesized Fe0/Fe3O4 NPs.
Crystals 12 01510 g007
Figure 8. (a), Nitrogen adsorption-desorption isotherm of the biosynthesized Fe0/Fe3O4 NPs. (b), Particle pore size of the biosynthesized Fe0/Fe3O4 NPs.
Crystals 12 01510 g008
Figure 9. UV-Vis spectra of MB photolysis degradation using Fe0/Fe3O4 NPs in the presence of H2O2.
Crystals 12 01510 g009
Figure 10. Different concentration effect of H2O2 with Fe0/Fe3O4 NPs (a) Photolysis of MB vs. Time (min) graph, (b) Photolysis of MB kinetics vs. Time graph.
Crystals 12 01510 g010
Figure 11. Different concentration effect of Fe0/Fe3O4 NPs with constant concentration H2O2 (0.005mmol) (a) Photolysis of MB vs. Time (min) graph, (b) Photolysis of MB kinetics vs. Time graph.
Crystals 12 01510 g011
Figure 12. Different temperature effect on MB degradation using Fe0/Fe3O4 NPs and H2O2 (a) Photolysis of MB vs. Time (min) graph, (b) Photolysis of MB kinetics vs. Time graph.
Crystals 12 01510 g012
Figure 13. Thermodynamic parameter calculations for MB degradation using biosynthesized Fe0/Fe3O4 NPs (a) Calculation of activation energy (Ea) using Arrhenius equation, (b) Calculation of ΔH and ΔS for the degradation of MB using Eyring Polanyi equation.
Crystals 12 01510 g013
Table 1. Surface characteristics of Fe0/Fe3O4 NPs.
SampleSBET (m2. G−1)Vp (cm3. G−1)Pore Size (nm)
Fe3O489.10.226410.75
Table 2. Calculated rate constant of MB photolysis and photocatalytic degradation.
H2O2 (mmol/L)KappR2Fe Oxide NPs (g/L)KappR2
0.0050.033610.9960.050.0580.999
0.0100.045140.9980.100.1370.999
0.0150.066900.9980.150.2430.998
0.0200.133430.9990.200.7040.998
Table 3. MB photodegradation calculated thermodynamic parameters.
T(K)T−1(
10−3)
KappLn(K)Ea.ΔHΔSΔG
(min−1)(KJ. mol−1)(KJ. mol−1)(J. K−1. mol−1)(KJ. K−1.mol−1)
2883.470.069−2.6787.78308.4−32392.9864
2933.410.120−2.1293.9656
2983.360.200−1.6195.8964
3033.300.440−0.8297.5054
Publisher’s Note: MDPI stays neutral with regard to jurisdictional claims in published maps and institutional affiliations.

