

Swelling and Salt Formation in Ibuprofen and Tranexamic Acid-Containing Tablets during High-Temperature Storage

 ,
,  and
and
Abstract
1. Introduction
2. Materials and Methods
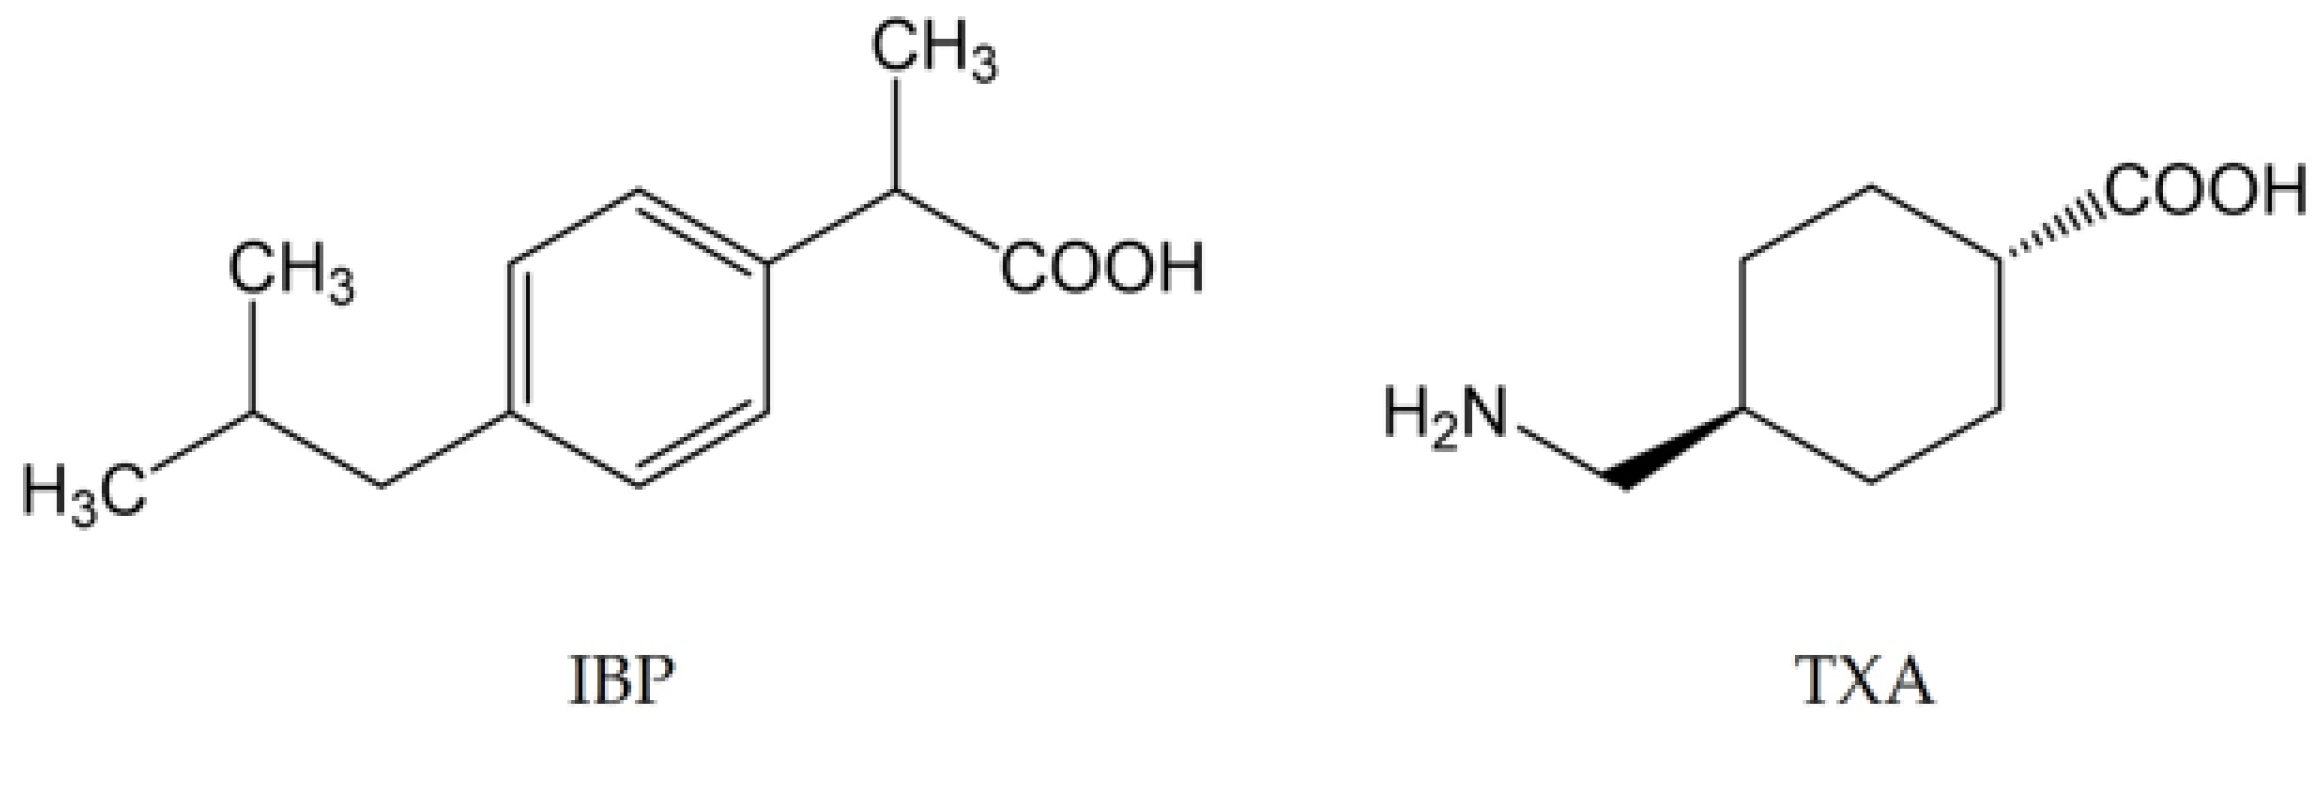
2.1. Materials
2.2. Sample Preparation
2.3. Swelling of Tablet and Morphology of Powder Evaluation
2.4. DSC Analysis
2.5. PXRD Analysis
2.6. Attenuated Total Reflectance–Fourier Transform Infrared Spectrometry (ATR-FTIR) Analysis
2.7. SCXRD Analysis
3. Results and Discussion
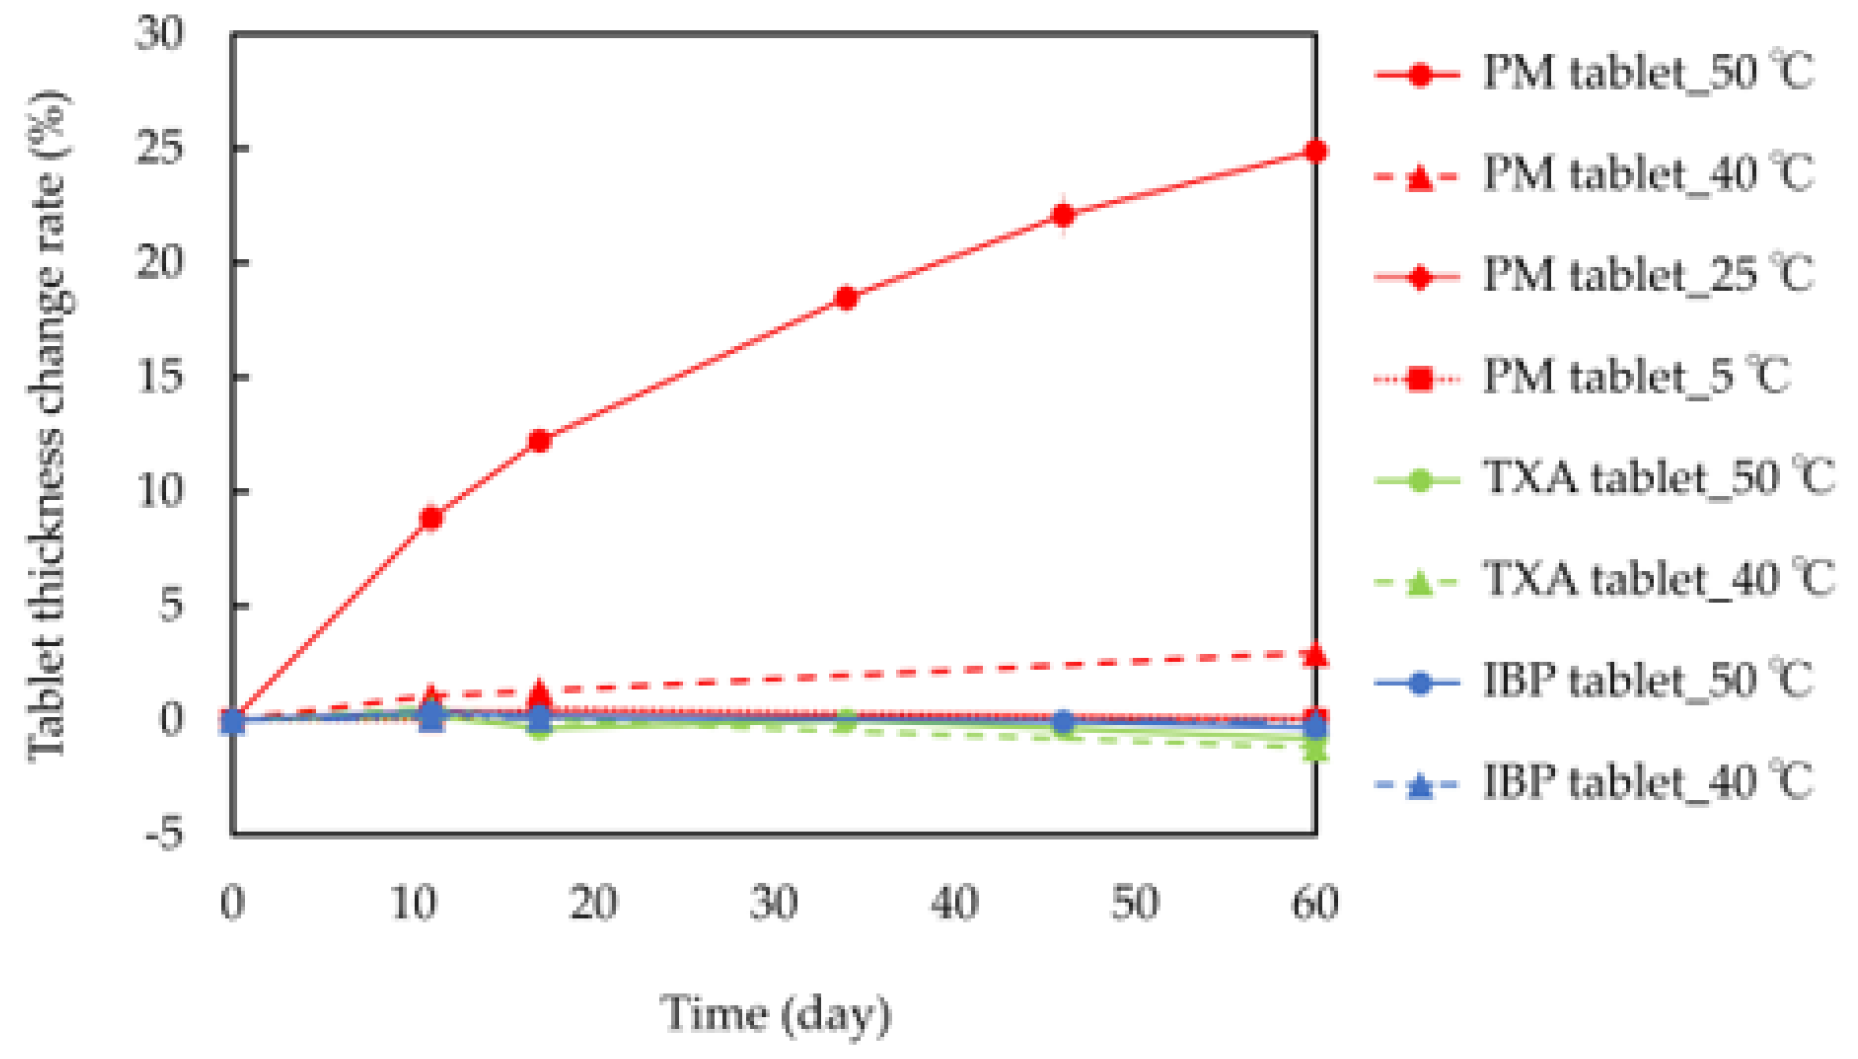
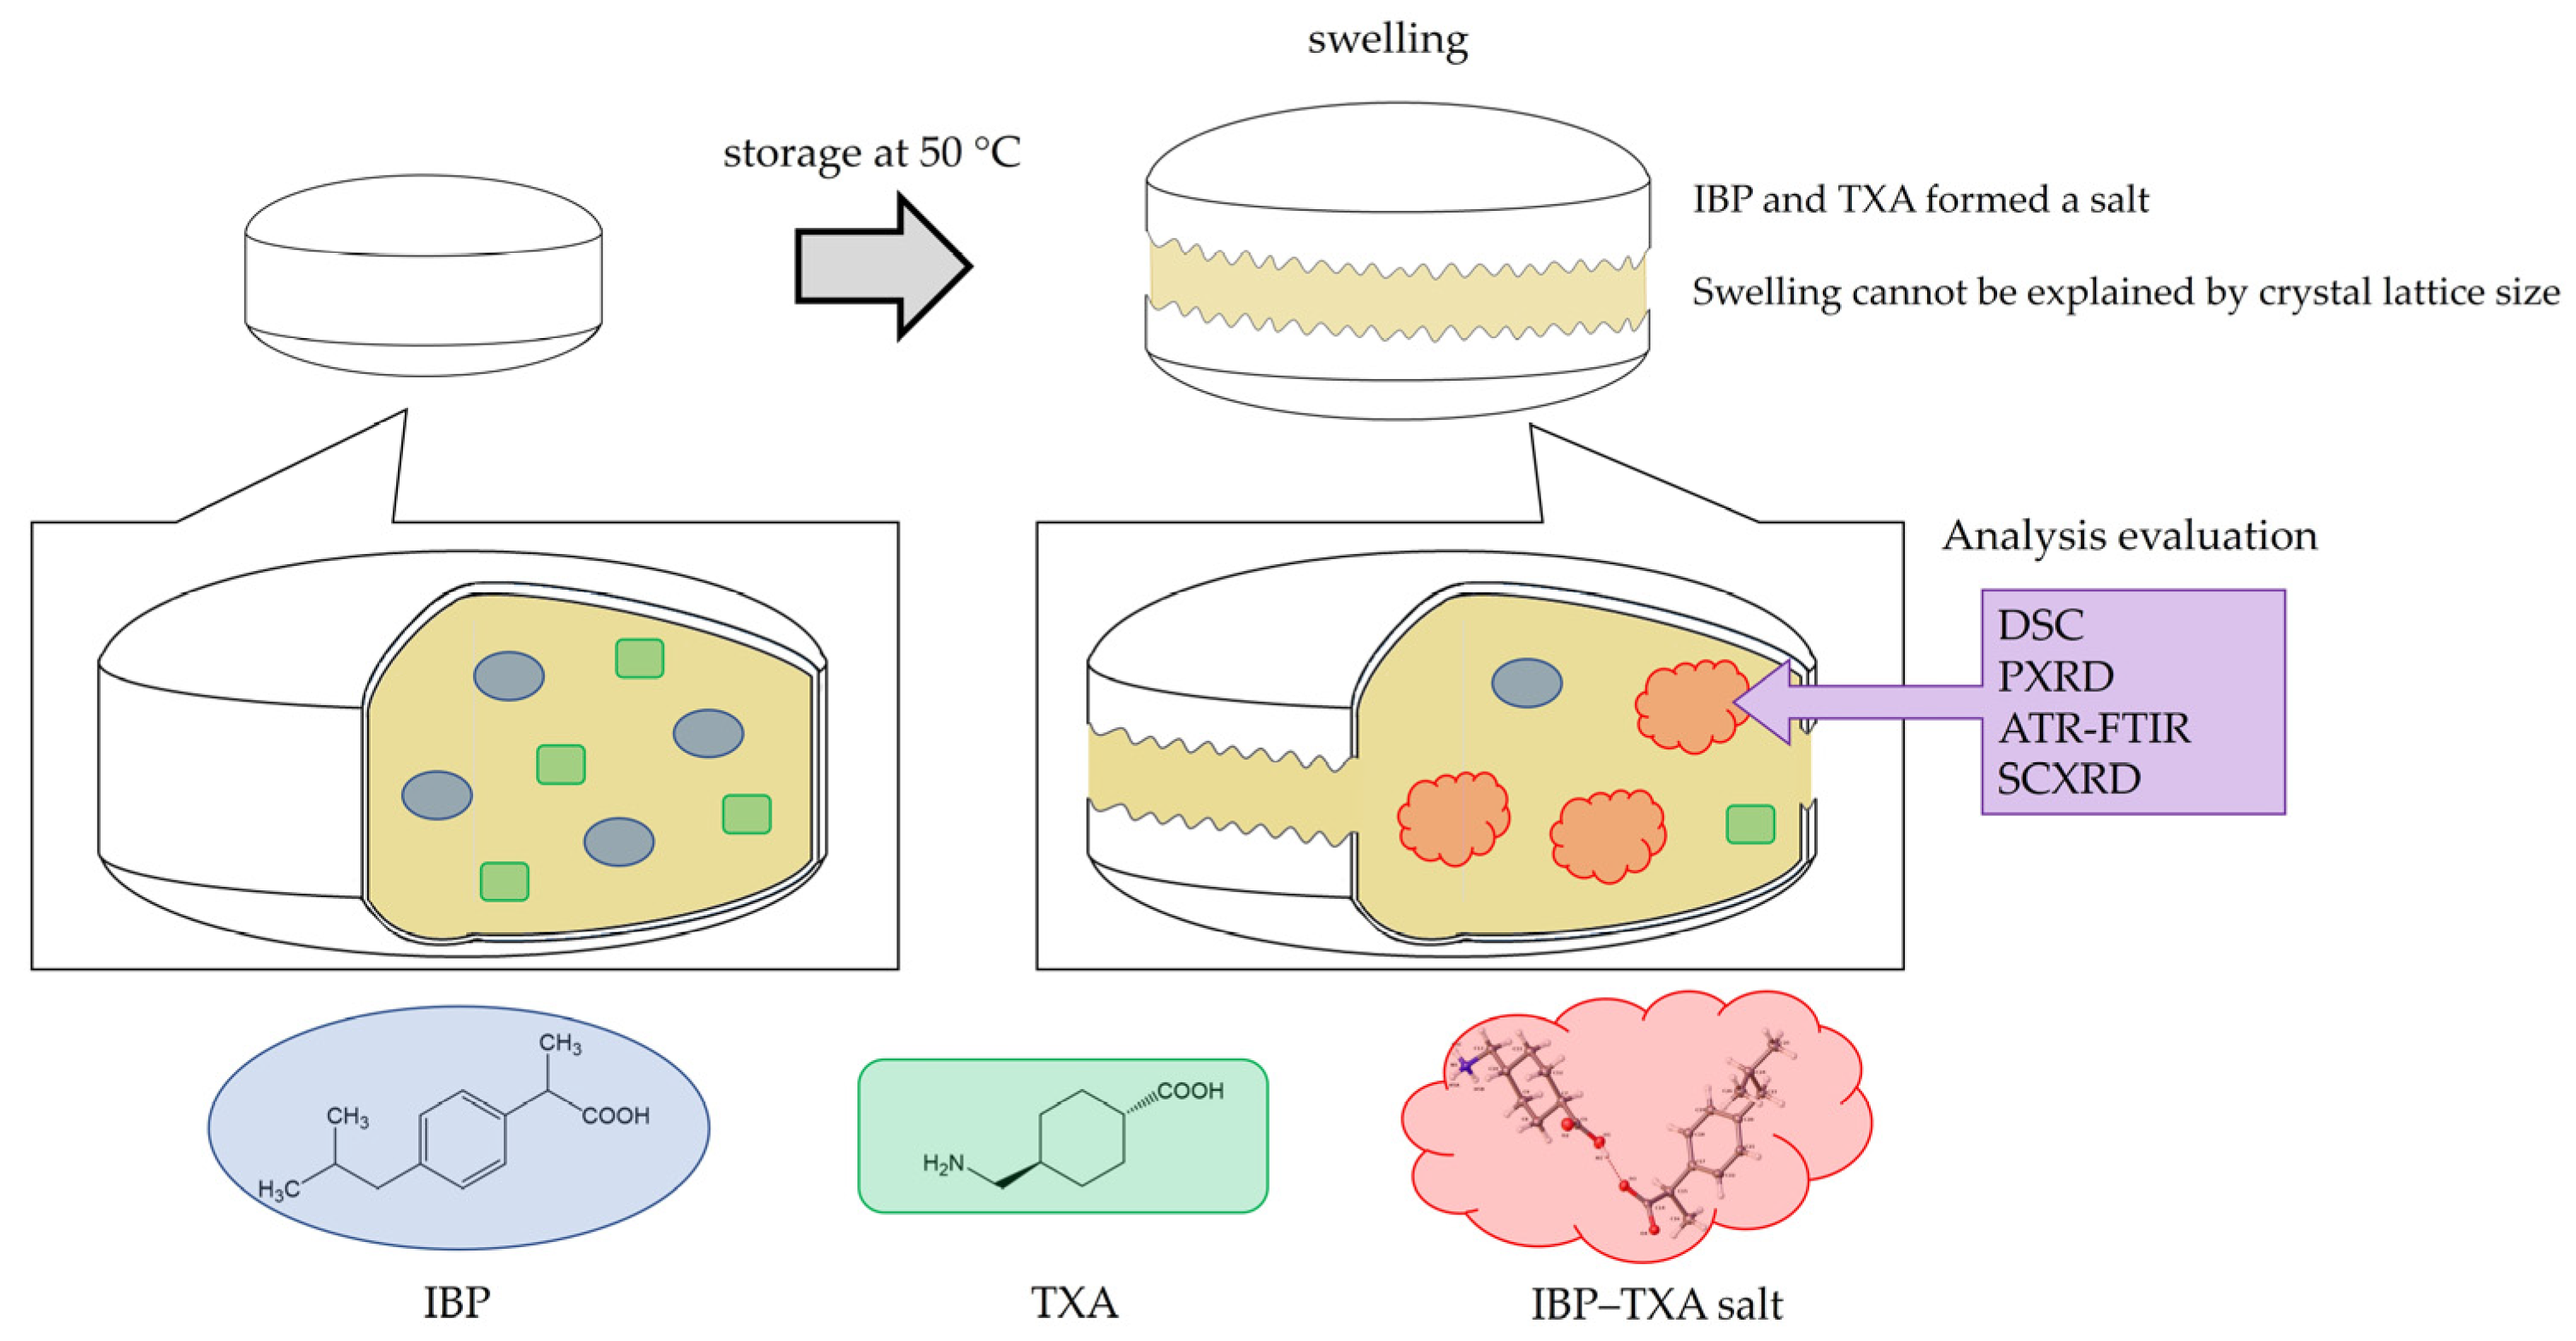
3.1. Swelling Evaluation
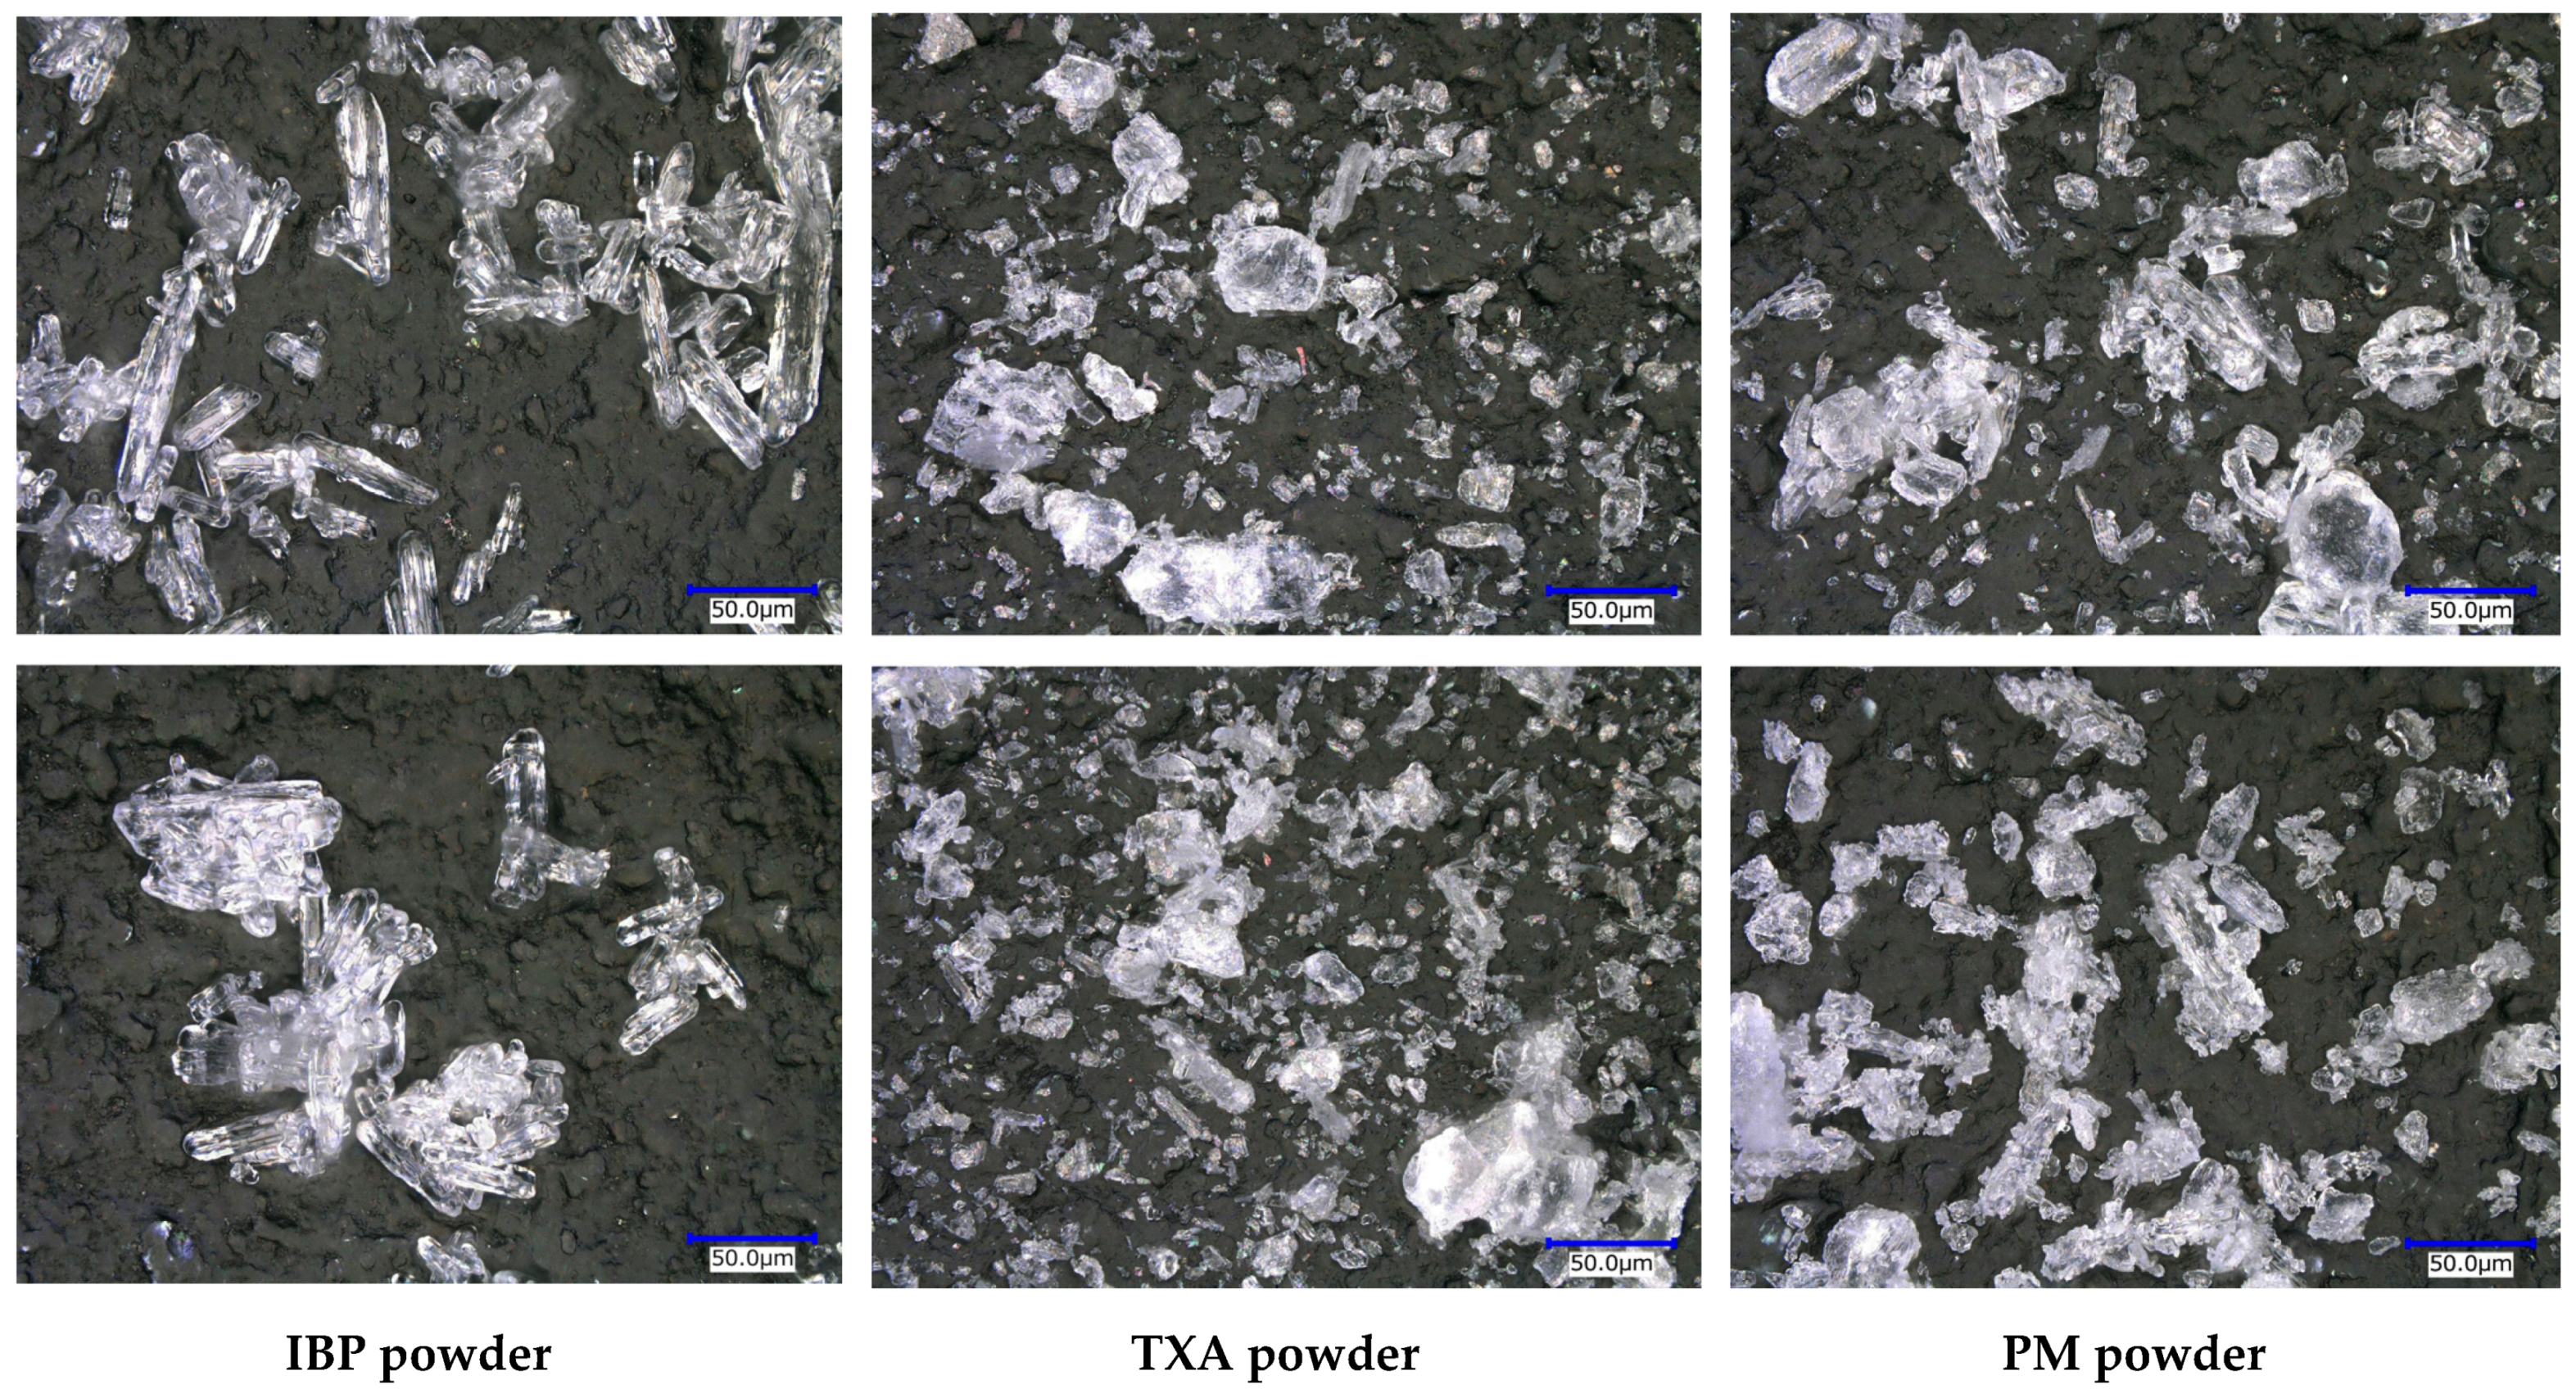
3.2. Crystal Morphology Evaluation
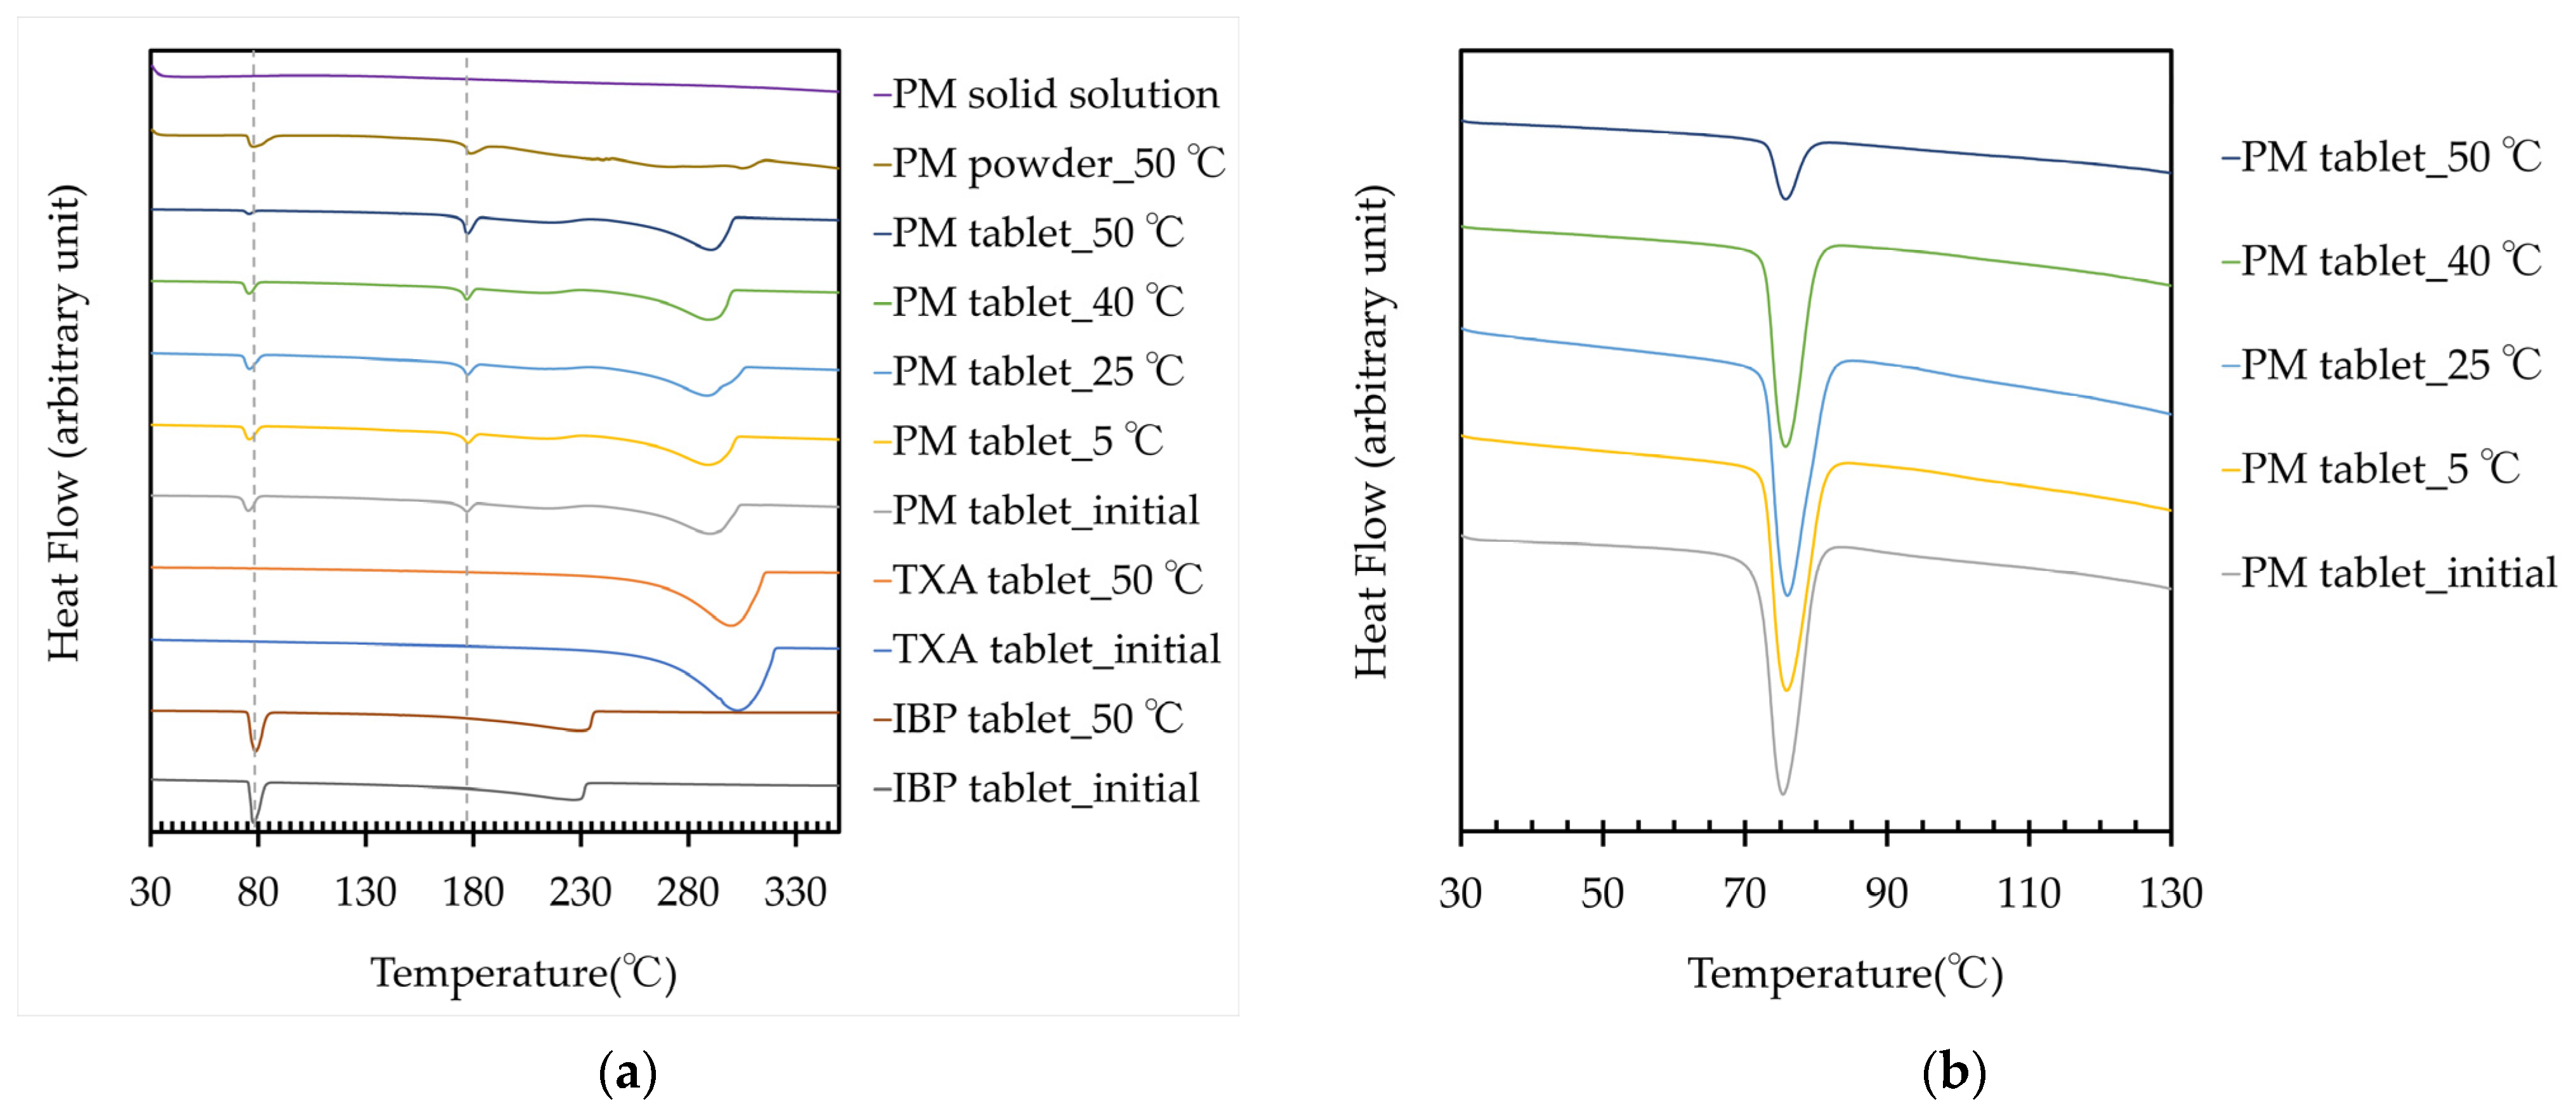
3.3. DSC Analysis
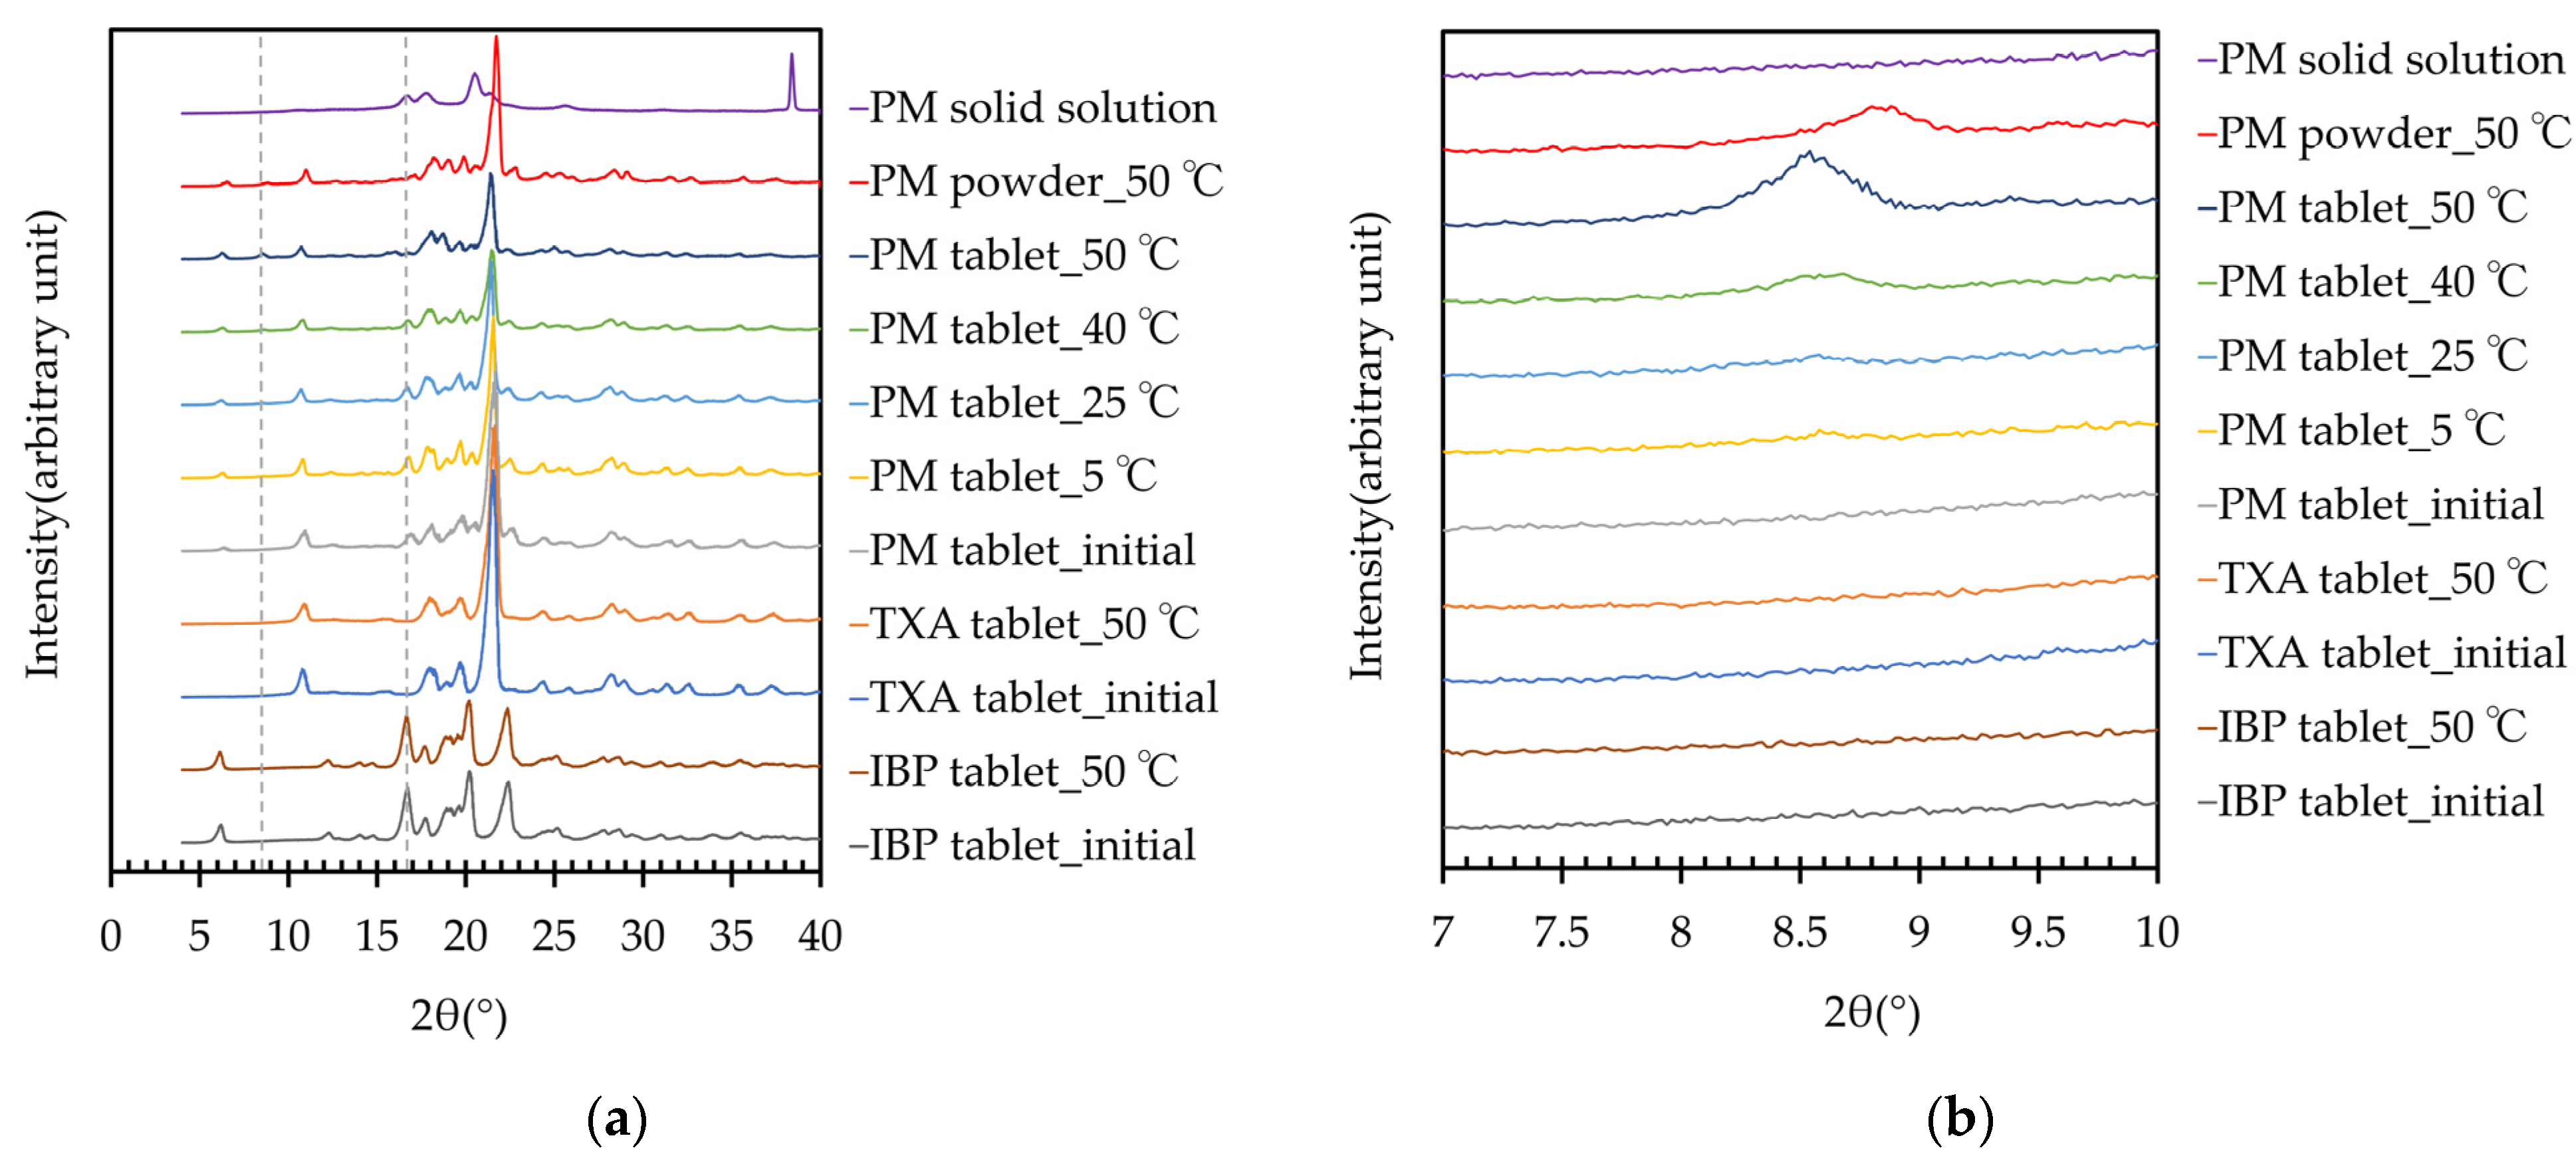
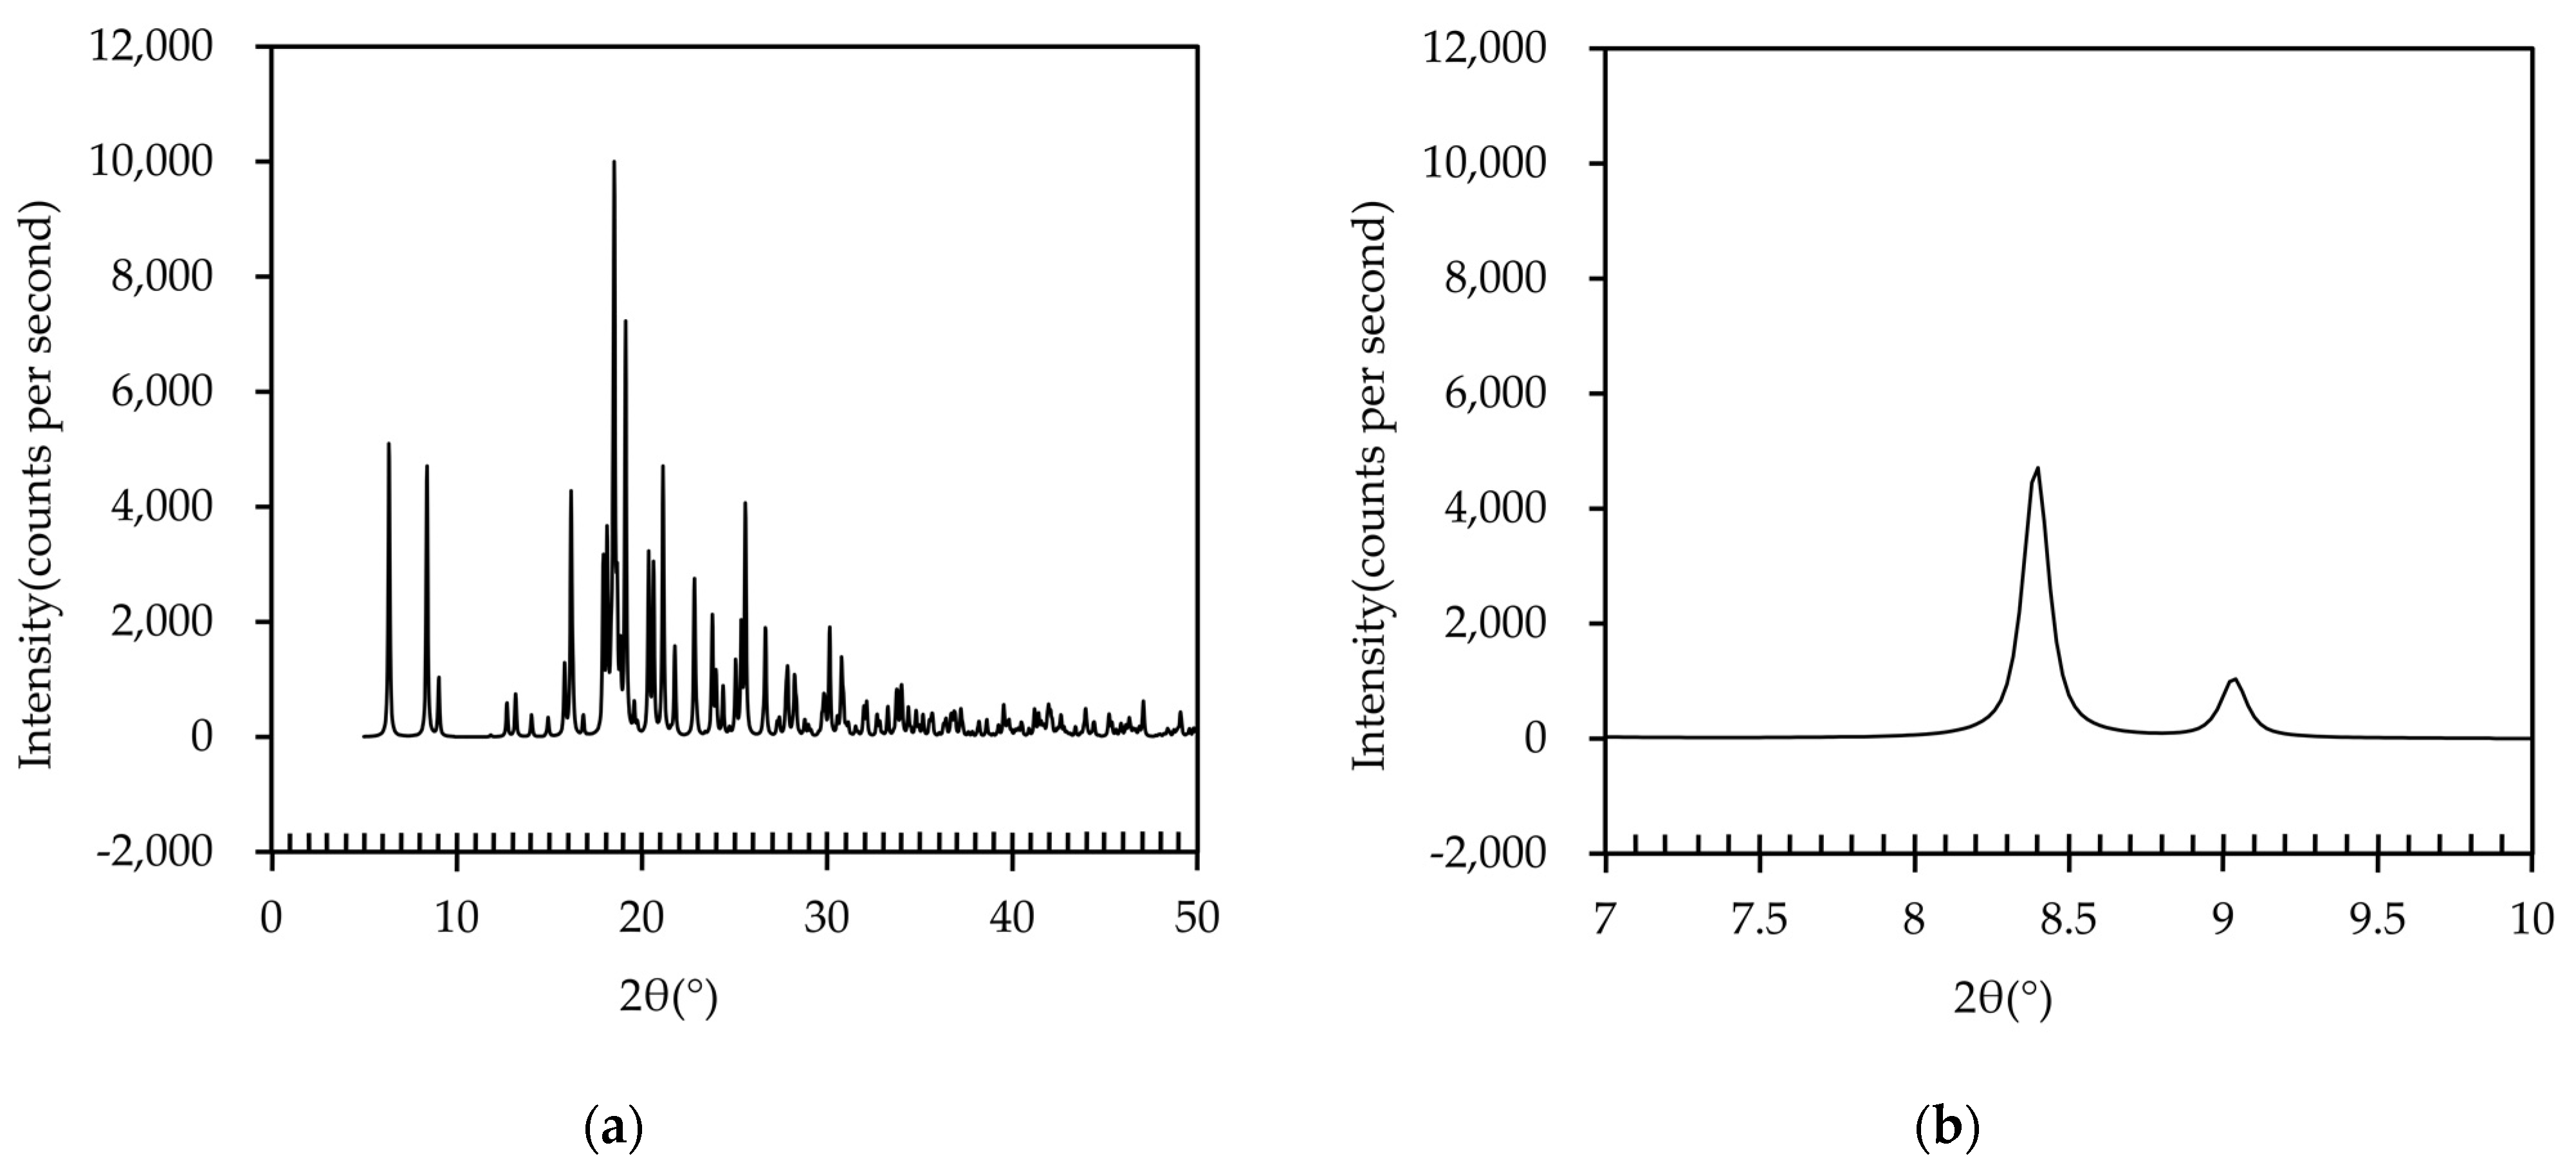
3.4. PXRD Analysis
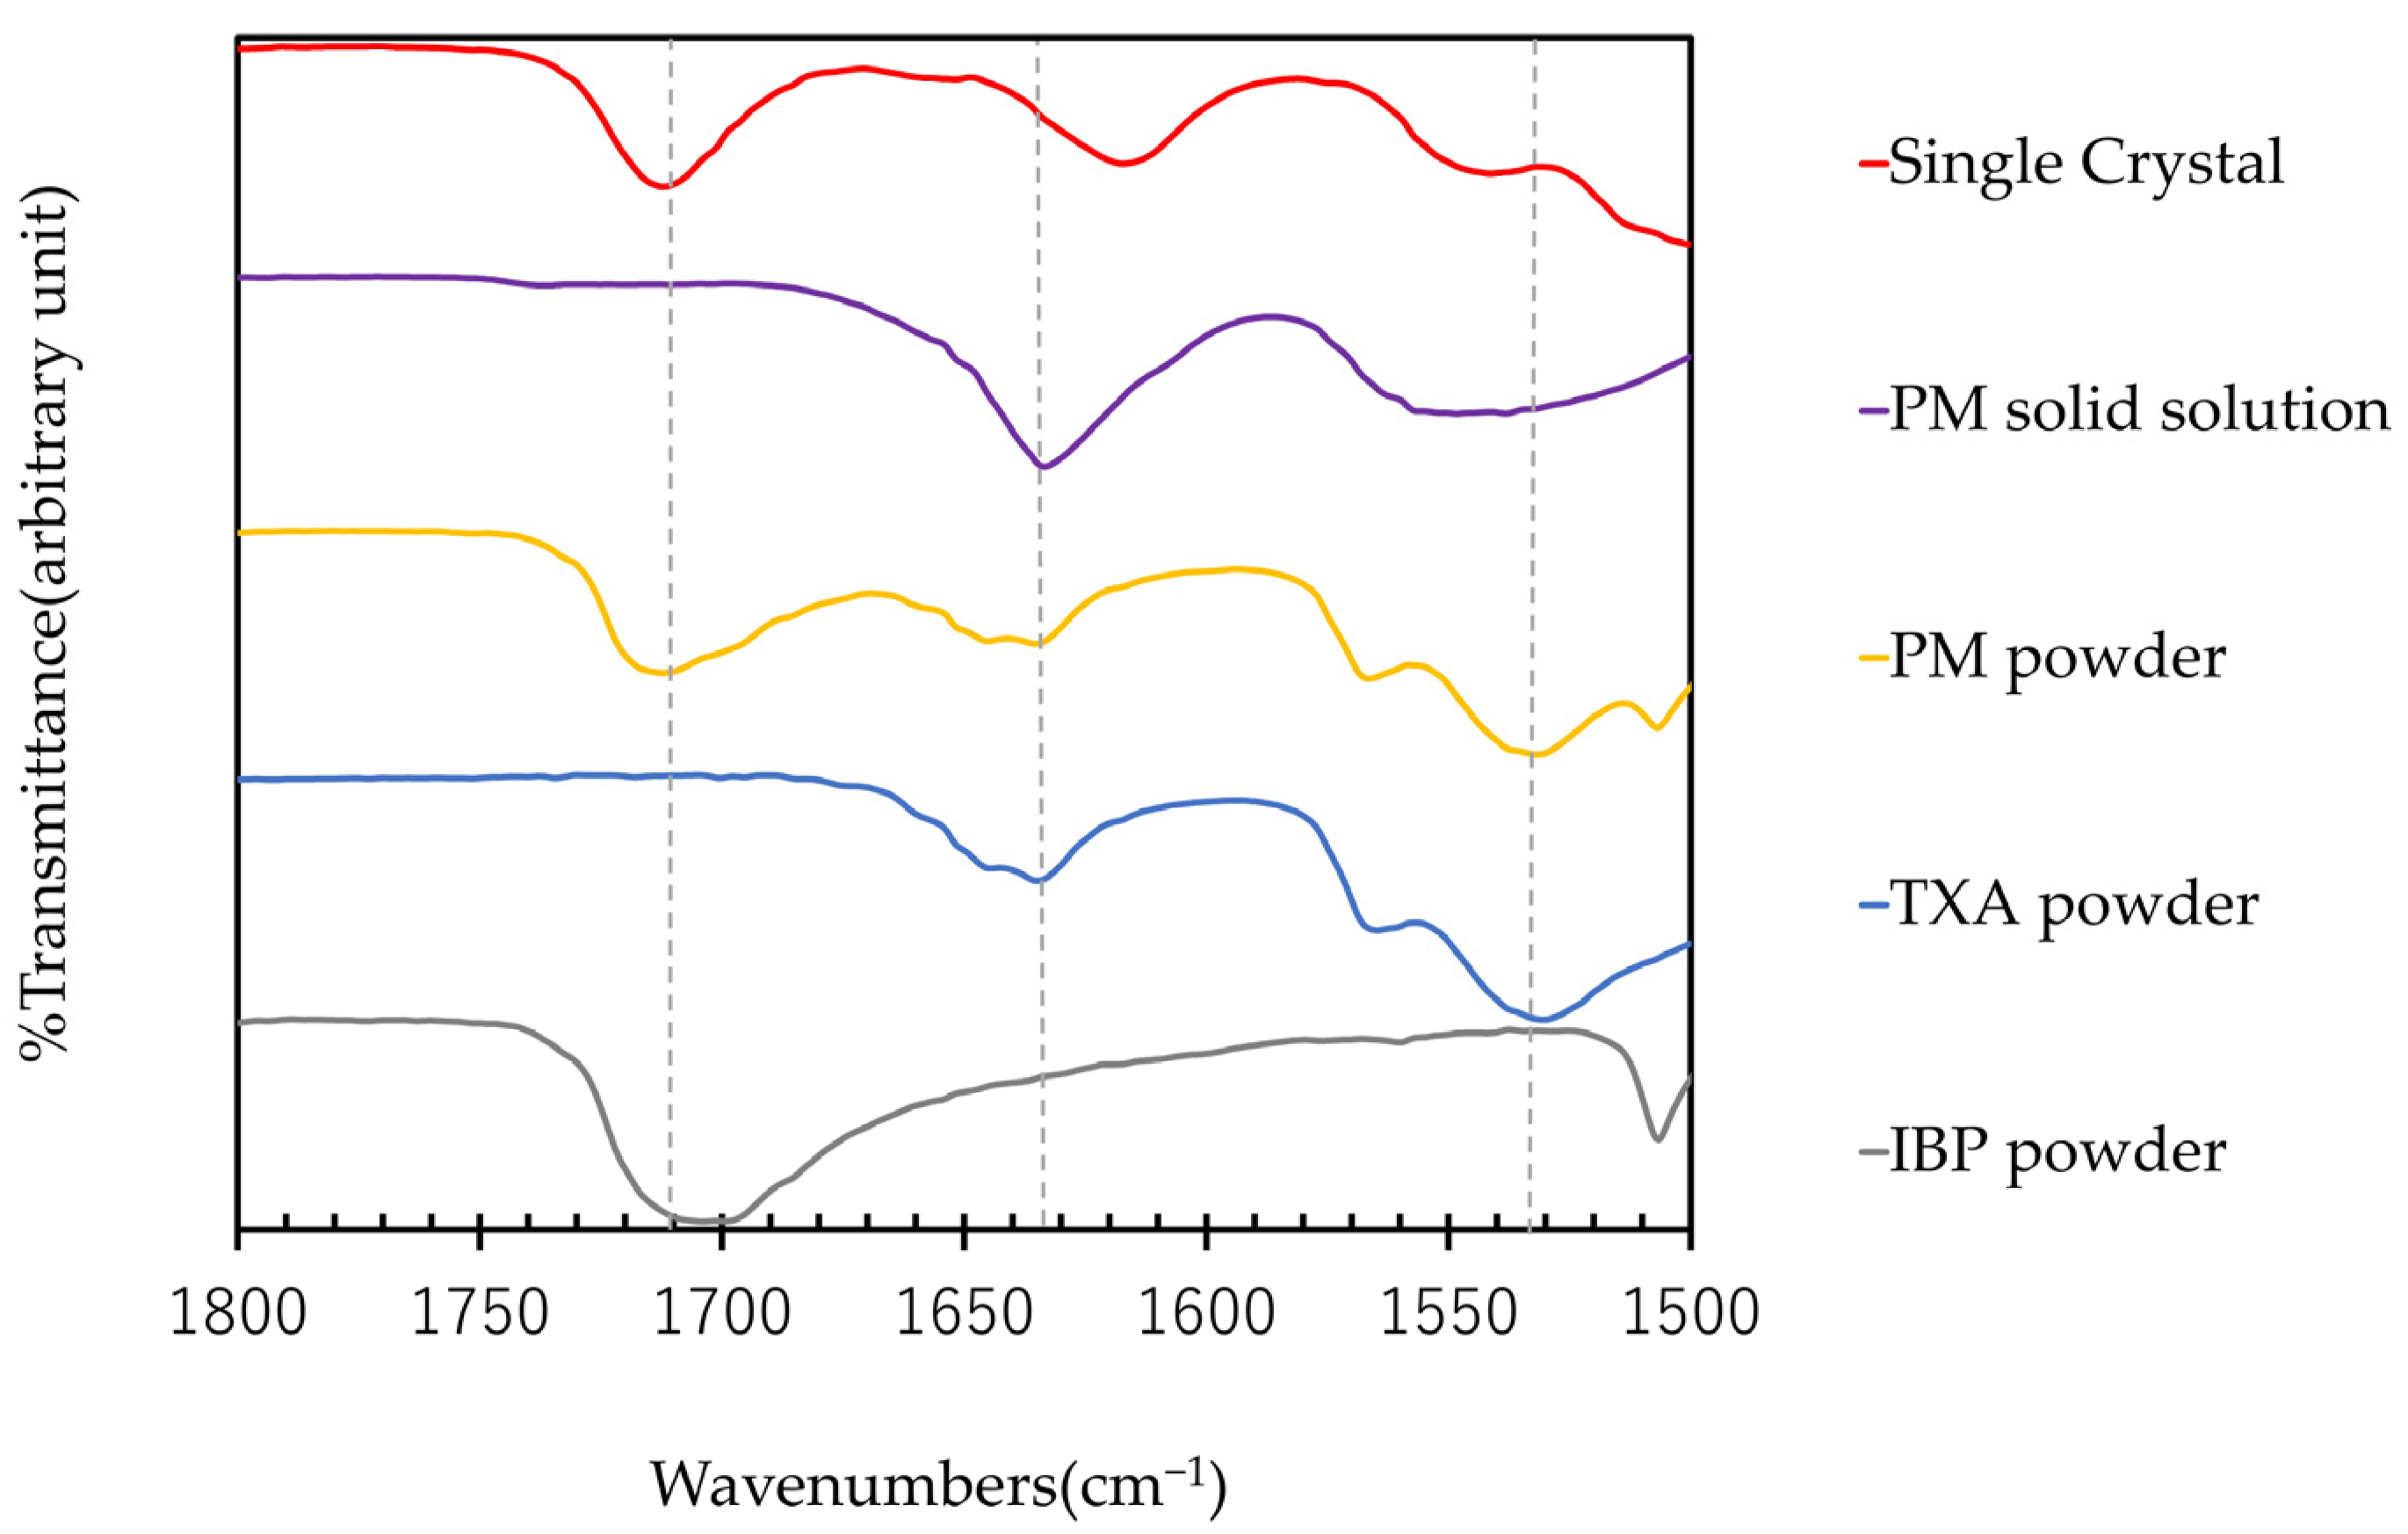
3.5. ATR-FTIR Analysis
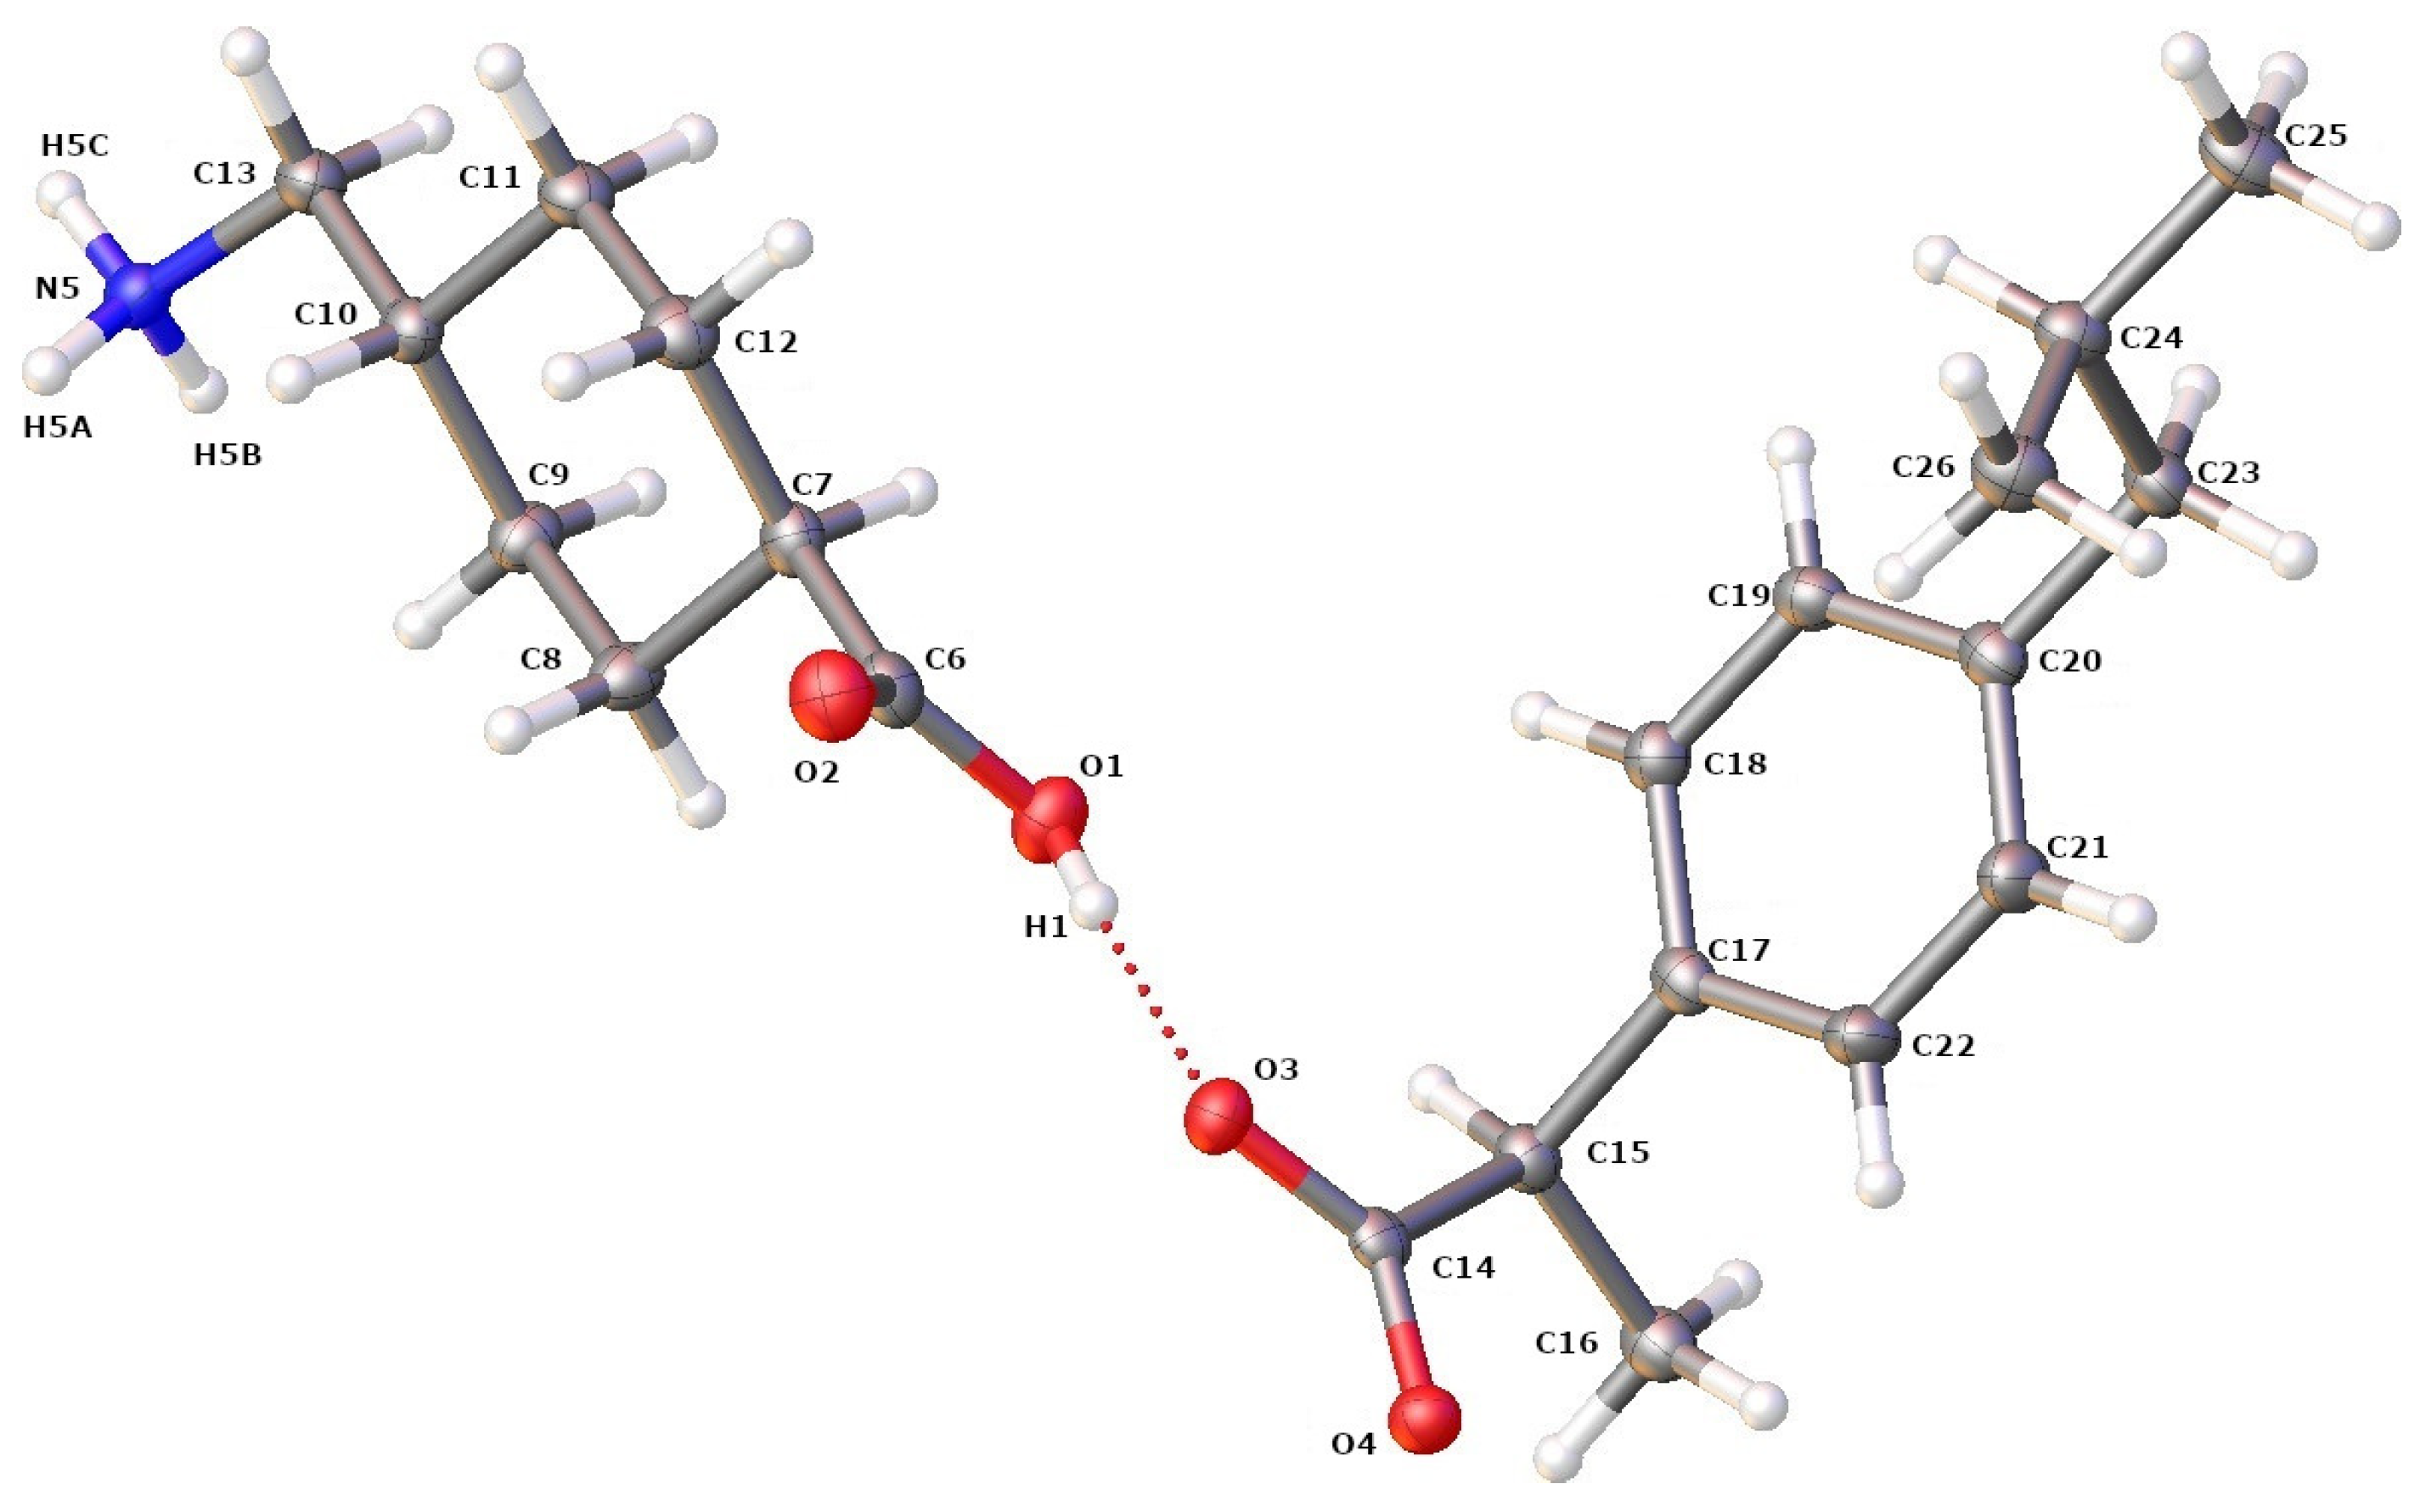
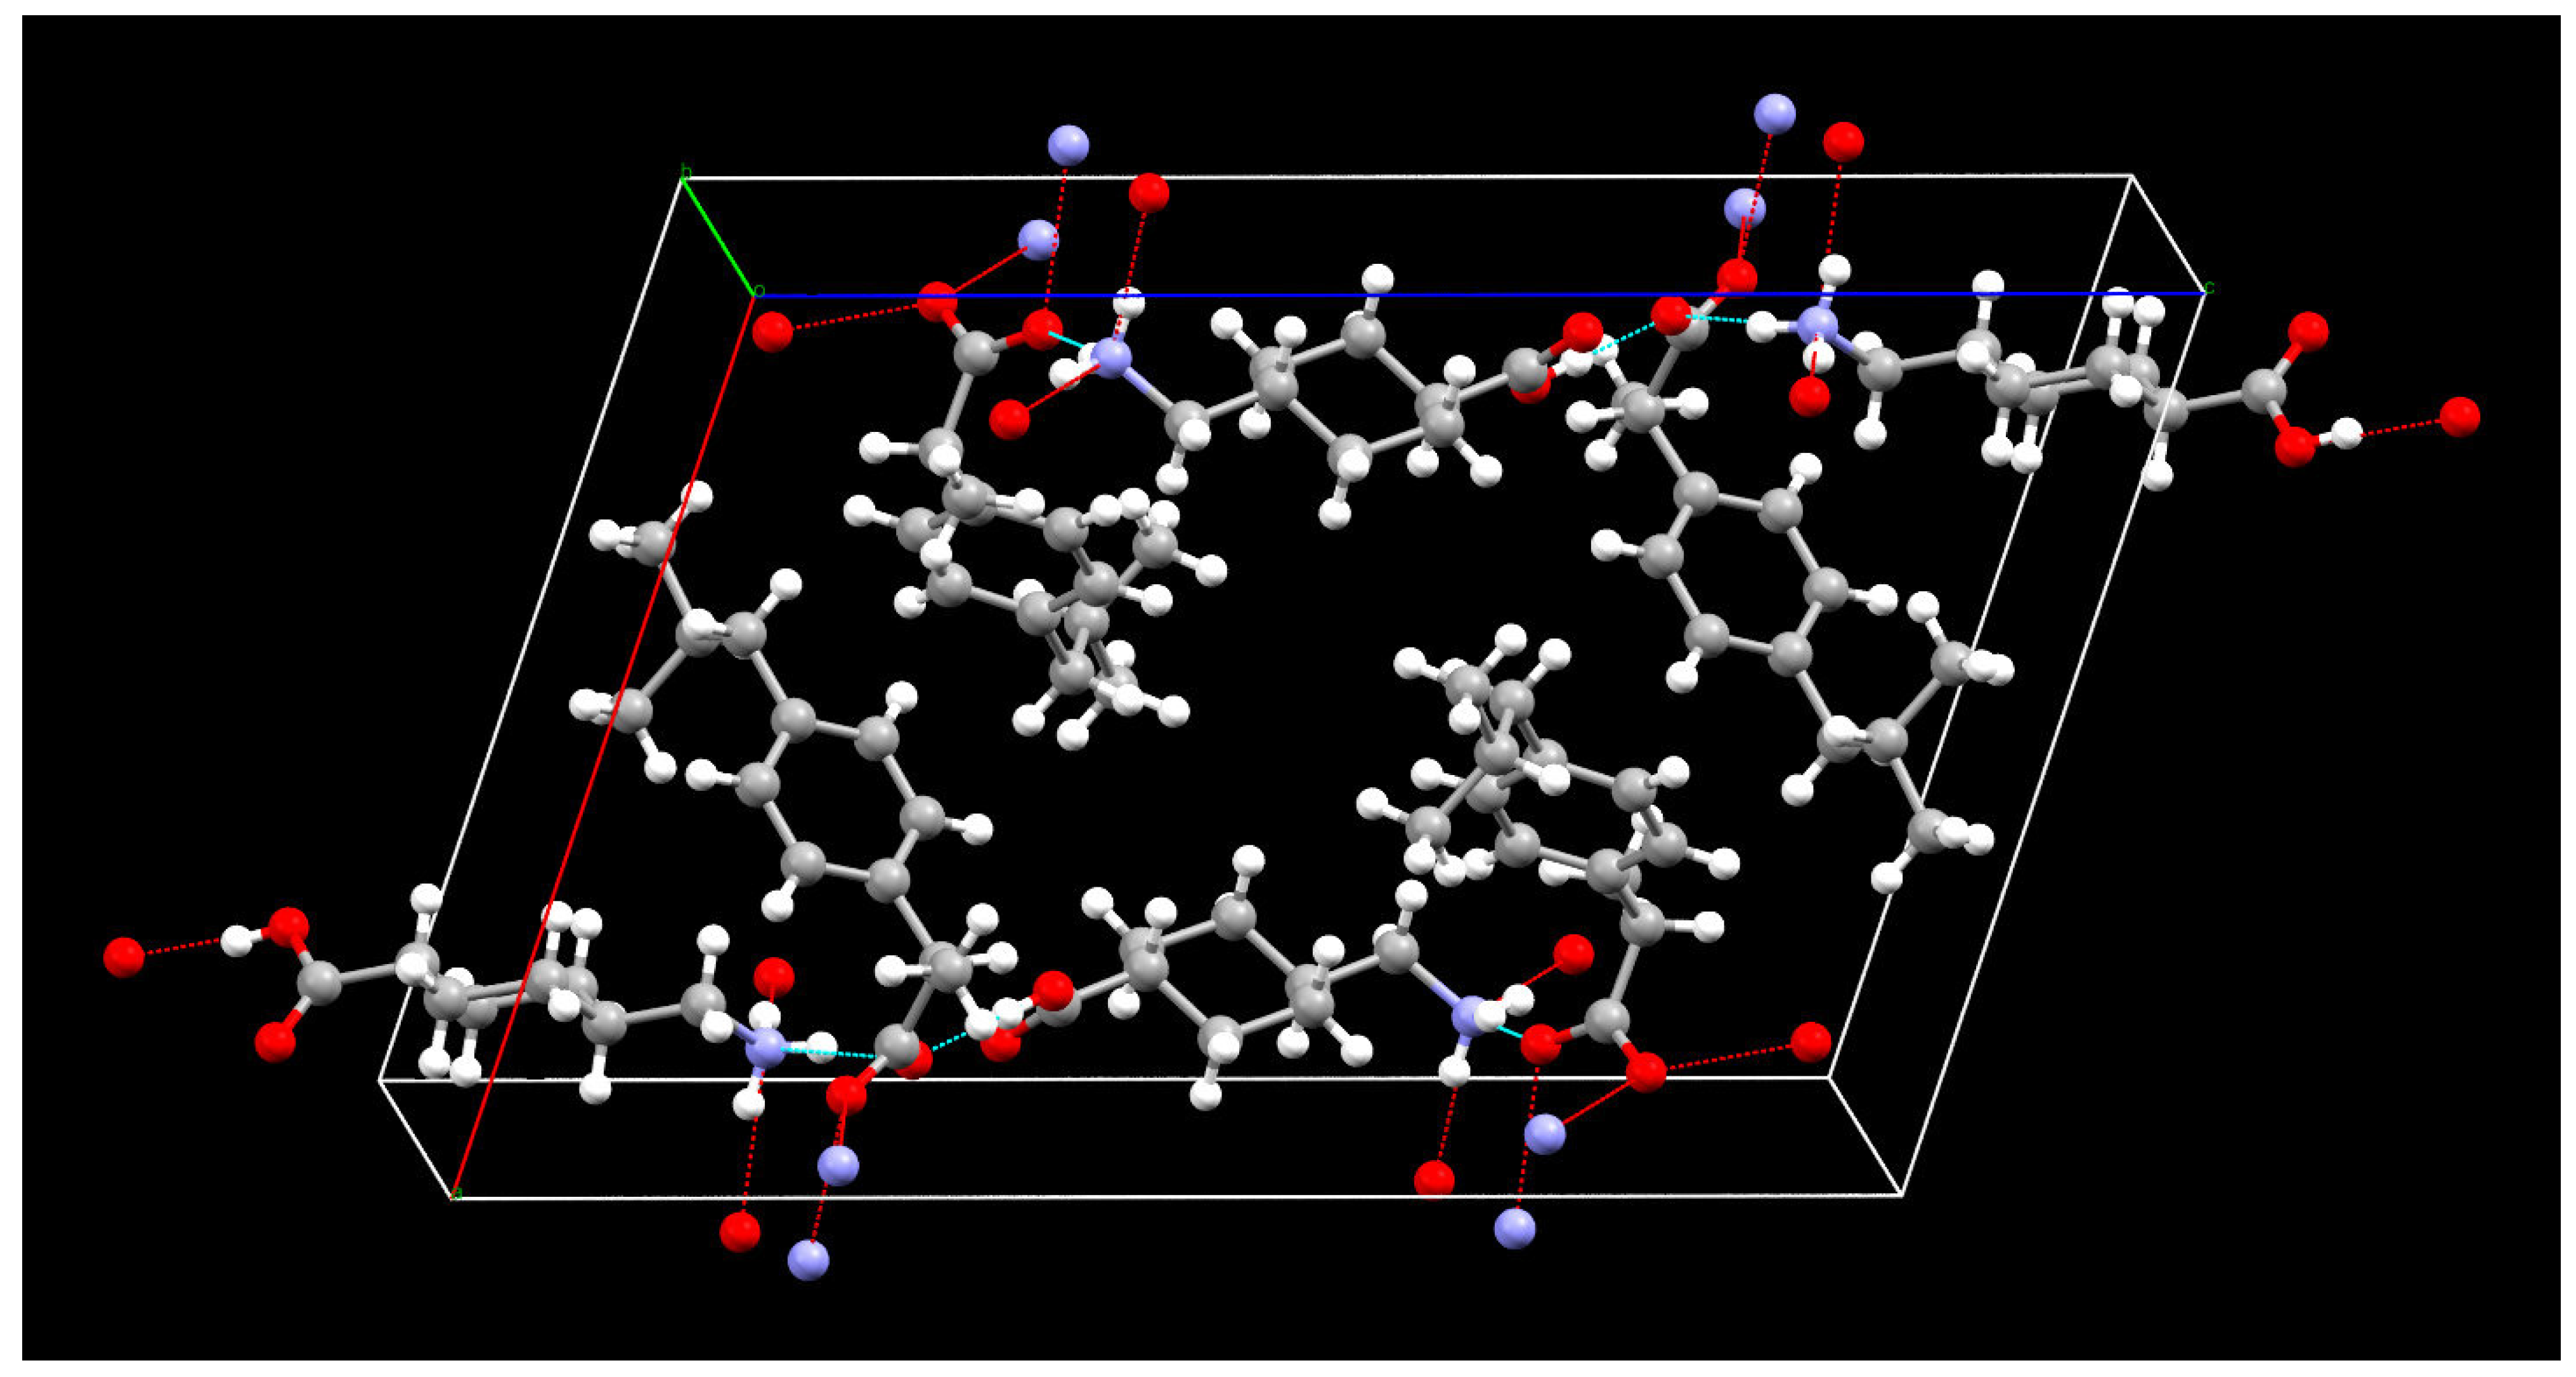
3.6. SCXRD Analysis
4. Conclusions
Author Contributions
Funding
Data Availability Statement
Acknowledgments
Conflicts of Interest
References
- Takahara, S.; Nishi, A. Film Coating Tablet. International Patent Application No. JP2019019128A, 5 September 2022. [Google Scholar]
- Kano, Y. Solid Preparation Comprising Ibuprofen and Tranexamic Acid. WIPO (PCT) International Patent Application No. WO2008044331A1, 4 October 2007. [Google Scholar]
- Yoshikawa, T.; Matsuoka, A.; Matoba, H. Stabilized Pharmaceutical Formulation. International Patent Application No. JP2007145758B2, 19 December 2012. [Google Scholar]
- Usui, T.; Shimokawa, T.; Kawashima, H. Solid Preparation Containing Ibuprofen and Tranexamic Acid. International Patent Application No. JP2009203218B2, 15 October 2009. [Google Scholar]
- Noritaka, I.; Tsunoda, K.; Ishida, K. Pharmaceutical Preparation and Method for Producing the Same. International Patent Application No. JP2007284423B2, 9 April 2014. [Google Scholar]
- Usui, T. Solid Preparation Containing Ibuprofen, Tranexamic Acid and Calcium Silicate. International Patent Application No. JP2010030903B2, 12 February 2010. [Google Scholar]
- Falini, G.; Fermani, S.; Tosi, G.; Dinelli, E. Calcium Carbonate Morphology and Structure in the Presence of Seawater Ions and Humic Acids. Cryst. Growth Des. 2009, 9, 2065–2072. [Google Scholar] [CrossRef]
- Childs, S.L.; Stahly, G.P.; Park, A. The Salt−Cocrystal Continuum: The Influence of Crystal Structure on Ionization State. Mol. Pharm. 2007, 4, 323–338. [Google Scholar] [CrossRef] [PubMed]
- Shaw, L.R.; Irwin, W.J.; Grattan, T.J.; Conway, B. The Effect of Selected Water-Soluble Excipients on the Dissolution of Paracetamol and Ibuprofen. Drug Dev. Ind. Pharm. 2005, 31, 515–525. [Google Scholar] [CrossRef] [PubMed]
- Nechipadappu, S.K.; Reddy, I.R.; Tarafder, K.; Trivedi, D.R. Salt/Cocrystal of Anti-Fibrinolytic Hemostatic Drug Tranexamic acid: Structural, DFT, and Stability Study of Salt/Cocrystal with GRAS Molecules. Cryst. Growth Des. 2018, 19, 347–361. [Google Scholar] [CrossRef]
- Ishihara, S.; Hattori, Y.; Otsuka, M.; Sasaki, T. Cocrystal Formation through Solid-State Reaction between Ibuprofen and Nicotinamide Revealed Using THz and IR Spectroscopy with Multivariate Analysis. Crystals 2020, 10, 760. [Google Scholar] [CrossRef]
- Toledo, M.V.; José, C.; Suster, C.R.L.; Collins, S.E.; Portela, R.; Bañares, M.A.; Briand, L.E. Catalytic and molecular insights of the esterification of ibuprofen and ketoprofen with glycerol. Mol. Catal. 2021, 513, 111811. [Google Scholar] [CrossRef]
- Shankland, N.; Wilson, C.C.; Florence, A.; Cox, P.J. Refinement of Ibuprofen at 100K by Single-Crystal Pulsed Neutron Diffraction. Acta Crystallogr. Sect. C Cryst. Struct. Commun. 1997, 53, 951–954. [Google Scholar] [CrossRef]
- Ostrowska, K.; Kropidłowska, M.; Katrusiak, A. High-Pressure Crystallization and Structural Transformations in Compressed R,S-Ibuprofen. Cryst. Growth Des. 2015, 15, 1512–1517. [Google Scholar] [CrossRef]
- Kleemiss, F.; Justies, A.; Duvinage, D.; Watermann, P.; Ehrke, E.; Sugimoto, K.; Fugel, M.; Malaspina, L.A.; Dittmer, A.; Kleemiss, T.; et al. Sila-Ibuprofen. J. Med. Chem. 2020, 63, 12614–12622. [Google Scholar] [CrossRef] [PubMed]
- Groth, P.; Rasmussen, S.E.; Taylor, D.B.; Haug, A.; Enzell, C.; Francis, G. Crystal Structure of the trans Form of 1,4-Aminomethylcyclohexanecarboxylic Acid. Acta Chem. Scand. 1968, 22, 143–158. [Google Scholar] [CrossRef] [PubMed]
- Shahzadi, S.; Ali, S.; Parvez, M.; Badshah, A.; Ahmed, E.; Malik, A. Synthesis, spectroscopy and antimicrobial activity of vanadium(III) and vanadium(IV) complexes involving Schiff bases derived from Tranexamic acid and X-ray structure of zwitter ion of Tranexamic acid. Russ. J. Inorg. Chem. 2007, 52, 386–393. [Google Scholar] [CrossRef]
- Lin, Y.-J.; Hwang, K.-S. Swelling of Copper Powders during Sintering of Heat Pipes in Hydrogen-Containing Atmospheres. Mater. Trans. 2010, 51, 2251–2258. [Google Scholar] [CrossRef]
- Usui, T. Ibuprofen-Containing Preparation Suppressed in Ibuprofen Sublimation. International Patent Application No. JP2008201738A, 4 September 2008. [Google Scholar]


| Sample | Melting Point of IBP (°C) | Endothermic Energy Amount around 75 °C (J/g) | Endothermic Temperature around 180 °C (°C) | Endothermic Energy Amount around 180 °C (J/g) |
|---|---|---|---|---|
| IBP tablet_initial | 77.79 | 119.47 | - | - |
| IBP tablet_50 °C | 78.68 | 125.69 | - | - |
| TXA tablet_initial | - | - | - | - |
| TXA tablet_50 °C | - | - | - | - |
| PM tablet_initial | 76.93 | 44.57 | 173.89 | 11.87 |
| PM tablet_5 °C | 75.85 | 36.49 | 177.41 | 27.29 |
| PM tablet_25 °C | 75.99 | 37.33 | 177.23 | 31.34 |
| PM tablet_40 °C | 75.74 | 28.02 | 176.88 | 29.31 |
| PM tablet_50 °C | 75.70 | 5.66 | 177.23 | 37.86 |
| PM powder_50 °C | 77.75 | 24.72 | 178.64 | 20.37 |
| PM solid solution | - | - | - | - |
| Parameters | IBP–TXA Salt |
|---|---|
| Molecular formula | C21H33NO4 |
| Molecular weight | 363.48 |
| Temperature (K) | 100.00(10) |
| Crystal system | Monoclinic |
| Space group | P21/c |
| Lattice parameters (Å, °) | a = 14.4682(3), α = 90 |
| b = 6.60510(10), β = 105.894(2) | |
| c = 21.8870(4), γ = 90 | |
| Volume(Å3) | 2011.64(7) |
| Z | 4 |
| Dcalcd (Mg/m3) | 1.200 |
| Absorption coefficient (mm−1) | 0.656 |
| F (000) | 792.0 |
| Theta range for data collection (°) | 6.352 to 155.006 |
| Index ranges | −18 ≤ h ≤ 18, −8 ≤ k ≤ 8, −19 ≤ l ≤ 26 |
| Reflections collected | 39,241 |
| Independent reflections | 4236 [Rint = 0.0294, Rsigma = 0.0135] |
| Data/restraints/parameters | 4236/0/241 |
| Goodness-of-fit on F2 | 1.042 |
| Final R indexes [I ≥ 2σ (I)] | R1 = 0.0335, wR2 = 0.0859 |
| Final R indexes [all data] | R1 = 0.0345, wR2 = 0.0870 |
| Largest diff. peak and hole (e Å3) | 0.30/−0.19 |
| D-H…A | D-H (Å) | H-A (Å) | D-A (Å) | D-H…A (°) |
|---|---|---|---|---|
| O1-H1…O3 | 0.82 | 1.82 | 2.6293(10) | 170.4 |
| N5-H5A…O41 | 0.89 | 1.91 | 2.7734(11) | 163.3 |
| N5-H5B…O42 | 0.89 | 1.95 | 2.8216(11) | 165.8 |
| N5-H5C…O33 | 0.89 | 1.96 | 2.7913(11) | 155.0 |
Publisher’s Note: MDPI stays neutral with regard to jurisdictional claims in published maps and institutional affiliations. |
© 2022 by the authors. Licensee MDPI, Basel, Switzerland. This article is an open access article distributed under the terms and conditions of the Creative Commons Attribution (CC BY) license (https://creativecommons.org/licenses/by/4.0/).
Share and Cite
Kawano, Y.; Tanaka, Y.; Hata, N.; Yoshiike, Y.; Nakajima, M.; Yonemochi, E.; Ishihara, N. Swelling and Salt Formation in Ibuprofen and Tranexamic Acid-Containing Tablets during High-Temperature Storage. Crystals 2022, 12, 1420. https://doi.org/10.3390/cryst12101420
Kawano Y, Tanaka Y, Hata N, Yoshiike Y, Nakajima M, Yonemochi E, Ishihara N. Swelling and Salt Formation in Ibuprofen and Tranexamic Acid-Containing Tablets during High-Temperature Storage. Crystals. 2022; 12(10):1420. https://doi.org/10.3390/cryst12101420
Chicago/Turabian StyleKawano, Yuto, Yoshiharu Tanaka, Nanami Hata, Yuki Yoshiike, Masato Nakajima, Etsuo Yonemochi, and Nobuhiro Ishihara. 2022. "Swelling and Salt Formation in Ibuprofen and Tranexamic Acid-Containing Tablets during High-Temperature Storage" Crystals 12, no. 10: 1420. https://doi.org/10.3390/cryst12101420
APA StyleKawano, Y., Tanaka, Y., Hata, N., Yoshiike, Y., Nakajima, M., Yonemochi, E., & Ishihara, N. (2022). Swelling and Salt Formation in Ibuprofen and Tranexamic Acid-Containing Tablets during High-Temperature Storage. Crystals, 12(10), 1420. https://doi.org/10.3390/cryst12101420