Article

Freezing and Thawing of D2O/Sand Mixtures Investigated by Neutron Diffraction

Department of Solid State Engineering, Faculty of Nuclear Science and Physical Engineering, Czech Technical University in Prague, 120 00 Prague, Czech Republic
*
Author to whom correspondence should be addressed.
Crystals 2021, 11(8), 961; https://doi.org/10.3390/cryst11080961
Submission received: 21 July 2021 / Revised: 4 August 2021 / Accepted: 13 August 2021 / Published: 16 August 2021
(This article belongs to the Special Issue The Structures and Transitions of Ice and Water)

Abstract

:
Evolution ice diffraction patterns in mixtures of D2O with quartz sand of three different grain coarseness (100–600, 300–800 and 600–1200 μm) were studied under various temperature regimes by means of neutron diffraction method. The studied structural parameters and characteristics involved the phase composition of specimens, Ih D2O ice lattice parameters, and crystallographic texture of the present phases. Variations in the ice crystallographic texture during the repeated freezing and thawing were observed for all tested sample types, showing an intermittent enhancement of ice and quartz texture indices accompanying the start of specimens cooling. Formation of radial internal stresses is demonstrated by the observed split of (002) and (100) diffraction maxima of ice. Estimated mean internal radial stress values are calculated.

1. Introduction

Freezing and thawing processes taking place in pure water as well as in mixtures of water with solid particles, and the influence of these transformations on resulting microstructure and deformation behavior of the ice phase, have been subjected to a long-lasting research effort, with important impacts of the results in many diverse fields of science involving, e.g., climatology and glaciology [1,2,3], atmospheric science and meteorology [4], space research [5], medicine and biology [6], civil engineering [7] or food production [8]. Various models have been proposed and developed aimed at theoretical description of the complex processes accompanying ice grains nucleation, growth, and preferential orientation (texture) formation [3,9,10,11]. Representative experimental data are then necessary to evaluate and further improve the theoretical models, requiring application of advanced experimental methods, such as X-ray diffraction and tomography [2,12], electron back-scatter diffraction [13], ultrasound waves dispersion [7,14], optical automatic ice texture analysis [2,4], helium spin-echo [15] and neutron diffraction and radiography [16,17,18].
In our recent study [18], we reported on application of neutron radiography and neutron diffraction methods to characterize ice melting kinetics studied on two D2O/sand mixtures differing in sand grains coarseness (630–1250 μm, and 100–630 μm). Compared with pure heavy water only, the ice melting point observed on the samples of mixtures was significantly shifted, the observed enhancement amounting 3 K and 6 K for the coarse and fine-grained samples, respectively. Reduction in heat transport capacity due to sand/water boundaries was suggested as the main physical reason behind that effect. Usage of D2O instead of H2O allows a direct characterization of the water solid↔liquid phase transition in the whole studied specimen volume by the neutron diffraction method, due to the large coherent scattering amplitude of thermal neutrons on deuterium atoms [19]. In the present paper, we extend our studies of freezing and thawing processes in D2O/sand mixtures on evolution of further structural characteristics involving the crystallographic texture of the present phases, D2O ice lattice parameters, and estimated internal stress loads within volume of investigated samples.

2. Materials and Methods

Mixtures of D2O with mono-dispersive quartz sands (Sklopísek Střeleč, a.s, Střeleč, Czech Republic) admixed in the mass ratio sand/D2O~3.5/1 were studied and their behavior juxtaposed with pure heavy water (D2O) in the place of the control. The tested sand batches include coarse grain quartz sand with the grain size between 600 and 1200 μm (further marked as CGQS), medium-grain sand (300–800 μm, MGQS) and fine grain sand (100–600 μm, FGQS).
The specimens for measurement were placed in cylindrical aluminum containers (internal diameter 10 mm, wall thickness 1 mm, axial height 50 mm) and these mounted on the cold finger of a closed-loop He-cryostat (Cryophysics CP-62-ST/5). The neutron diffraction measurements were performed on the KSN-2 neutron diffractometer located in the Laboratory of Neutron Diffraction DSSE, FNSPE CTU in Prague located at the research nuclear reactor LVR-15 in the Nuclear Research Institute, Řež near Prague. The primary neutron diffraction patterns were collected within the Bragg scattering angle (2θ) range of 10–60 degrees using a monochromatized beam of thermal neutrons (wavelength λ = 0.1362 nm, neutron flow at the sample 8 × 106 cm−2 s−1, ultimate resolution of diffracting planes distance (d) ∆d/d = 0.0075).
Altogether 102 diffraction patterns were recorded with the temperature (T) of tested specimens varying within the range 150 K ≤ T ≤ RT. The obtained raw data were then evaluated with the aid of SW tools FIT [20] and GSAS [21]. Correction of the resulting diffraction patterns on variations in the primary neutron beam flux and background subtraction were performed prior to further analysis.
Using the FIT code, the observed individual diffraction maxima were fitted by a Gaussian function and characterized by the following parameters: centroid position (2ϴ; degrees or steps), full width at half maximum (FWHM; degrees or steps), maximum intensity of the line (Ip; counts) and total diffracted intensity of the line (A; counts). The GSAS code was then used to determine the phase composition of the tested specimens, crystallographic texture index (TI) of the present crystallographic phases, and parameters of a quadratic fit to the full width on half maximum (FWHM) dependence of the recorded diffracted patterns on the Bragg angle.

3. Results and Discussion

Three different crystalline phases were identified in neutron diffraction diagrams of the tested specimens at temperatures below the D2O freezing point: α-quartz phase characterized by the space group P3221, hexagonal D2O ice phase Ih (space group P63/mmc), and a face centered cubic phase (space group Fm-3m, mean lattice parameter a = 4.04076 ± 0.00759 Å) related to Al-alloy forming the specimen container (c.f. Figure 1). There are two poorly fit lines at 2θ = 27.58 and 32.22 deg. The first one corresponds to the λ/2 line of Al (220) which is found to be strong for the used Al alloy. The second one then originates from α-quartz of sand and shows a highly fluctuating intensity for different sand batches.

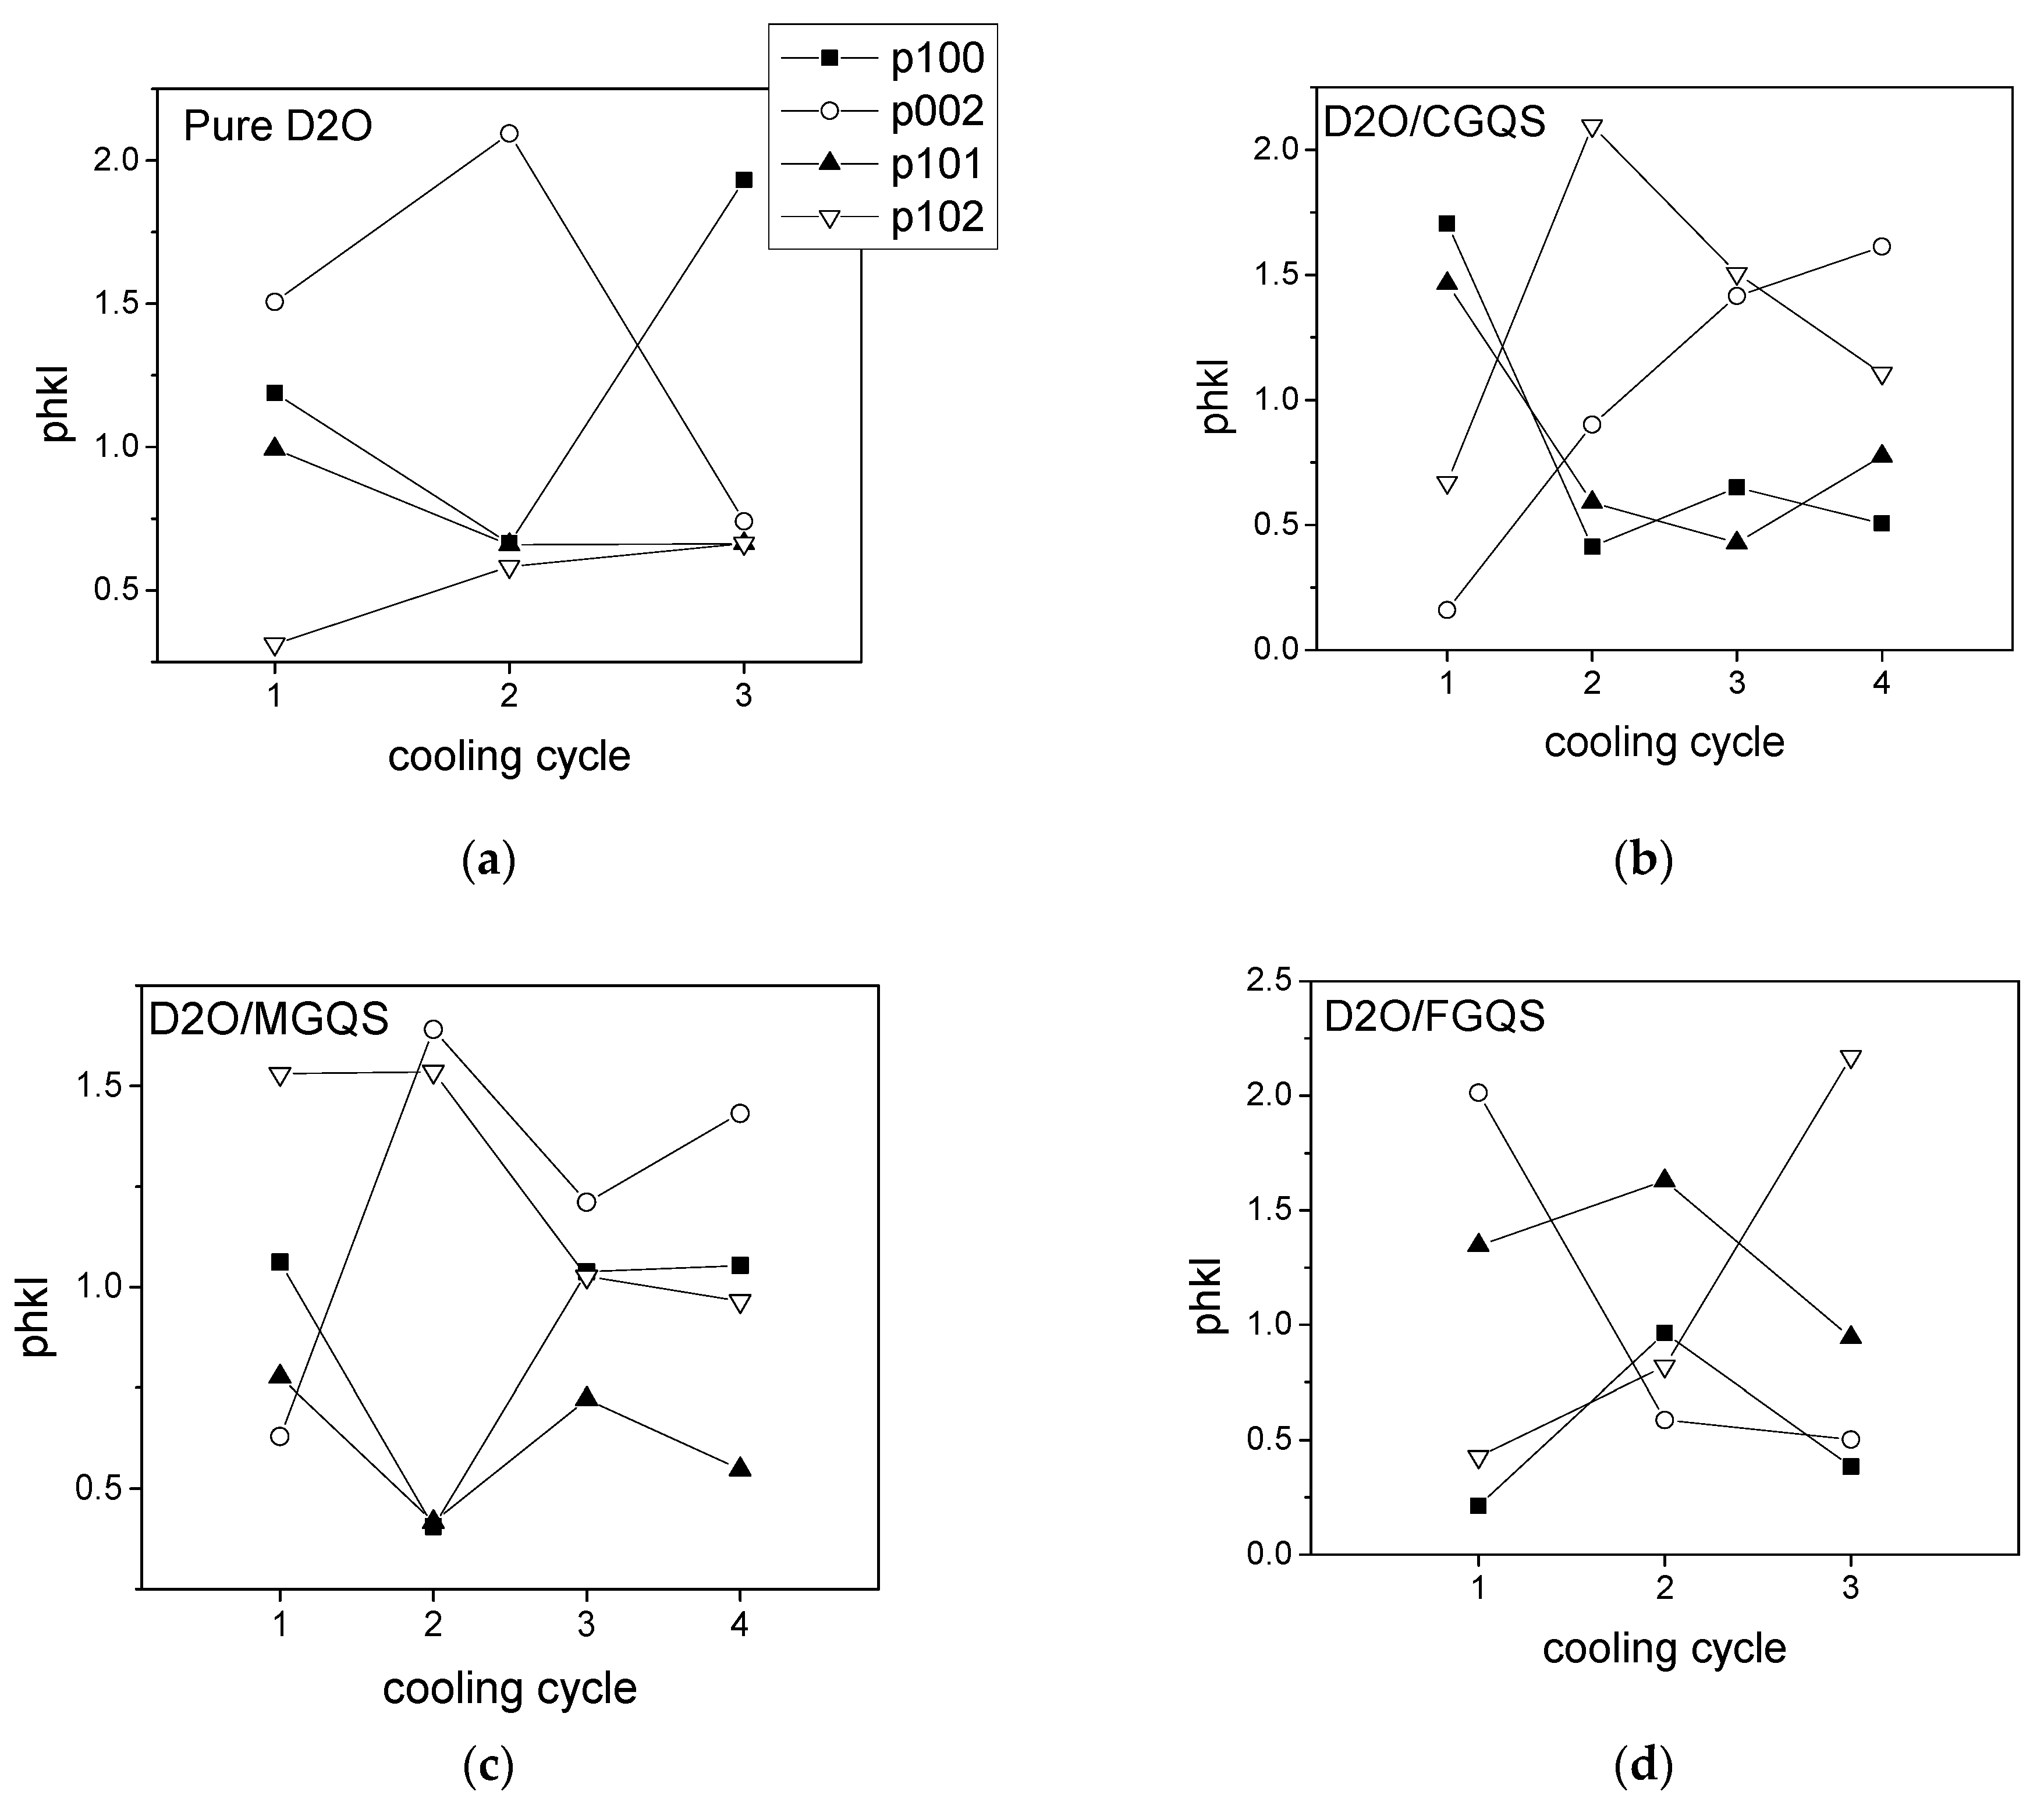
3.1. Analysis of D2O Ice Texture Changes during the Repeated Freezing and Thawing of Samples

Thermal cycling with the temperature ranging between RT and 250 K was applied to all the studied sample types. Within one cycle, the specimen was cooled down with the mean rate ΔT = −2.5 K/min and, after reaching the target value 250 K, let stabilized for next 20 min, reaching the temperature variation level well below 0.1 K. Then, neutron diffraction patterns were recorded; afterwards, the specimen temperature was raised up back to RT.
The Harris method [22] is used to approximate the radial inverse pole figure (IPF) values (phkl) for the poles (100), (002), (101) and (102) of hexagonal Ih D2O ice using the observed diffraction lines’ intensities (AShkl) and the theoretical intensities (ARhkl) corresponding to a ‘random sample’ of the same volume and composition as the tested sample but possessing a random crystallographic texture (c.f. Rel. 1); the structure parameters of hexagonal D2O ice given in [16] were used in calculation of the theoretical intensities.
p h k l = 4 A h k l S / A h k l R h k l A h k l S / A h k l R ; h k l = 100 ,   002 ,   101 , 102 .
The obtained phkl values characterize the volumetric frequency of ice grains oriented with the <hkl> direction parallel to the radial direction of the cylindrical sample container. For the case of a random preferential orientation (crystallographic texture) of grains, the normalization used in Rel. (1) gives phkl = 1.
For all tested sample types, the observed IPFs of D2O ice show complex changes during the successive thermal cycles (Figure 2).
The texture evolution observed during the repeated freezing and thawing differs for samples of different composition and does not show any systematic trend. Since a complete ice melting occurs between the successive cycles, the observed changes in texture are conformal with an orientation randomness in the nucleation of ice grains. However, taking into account a small number of cycles tested, these results must be taken as only approximate ones.
The character of the texture evolution is further quantified by the mean texture index (MTI) calculated as the arithmetic mean of the squared difference of the observed phkl values from unity (representing for us a random texture state), averaged over all tested hkl sets (Nhkl) and the performed thermal cycles (Nsteps)
MTI = 1 N s t e p s × N h k l s t e p s h k l ( p h k l 1 ) 2 .
The obtained low MTI values (Figure 3) confirm a generally weak texture strength observed for all tested samples (let us note that a specimen possessing a fully random texture should show MTI = 0).

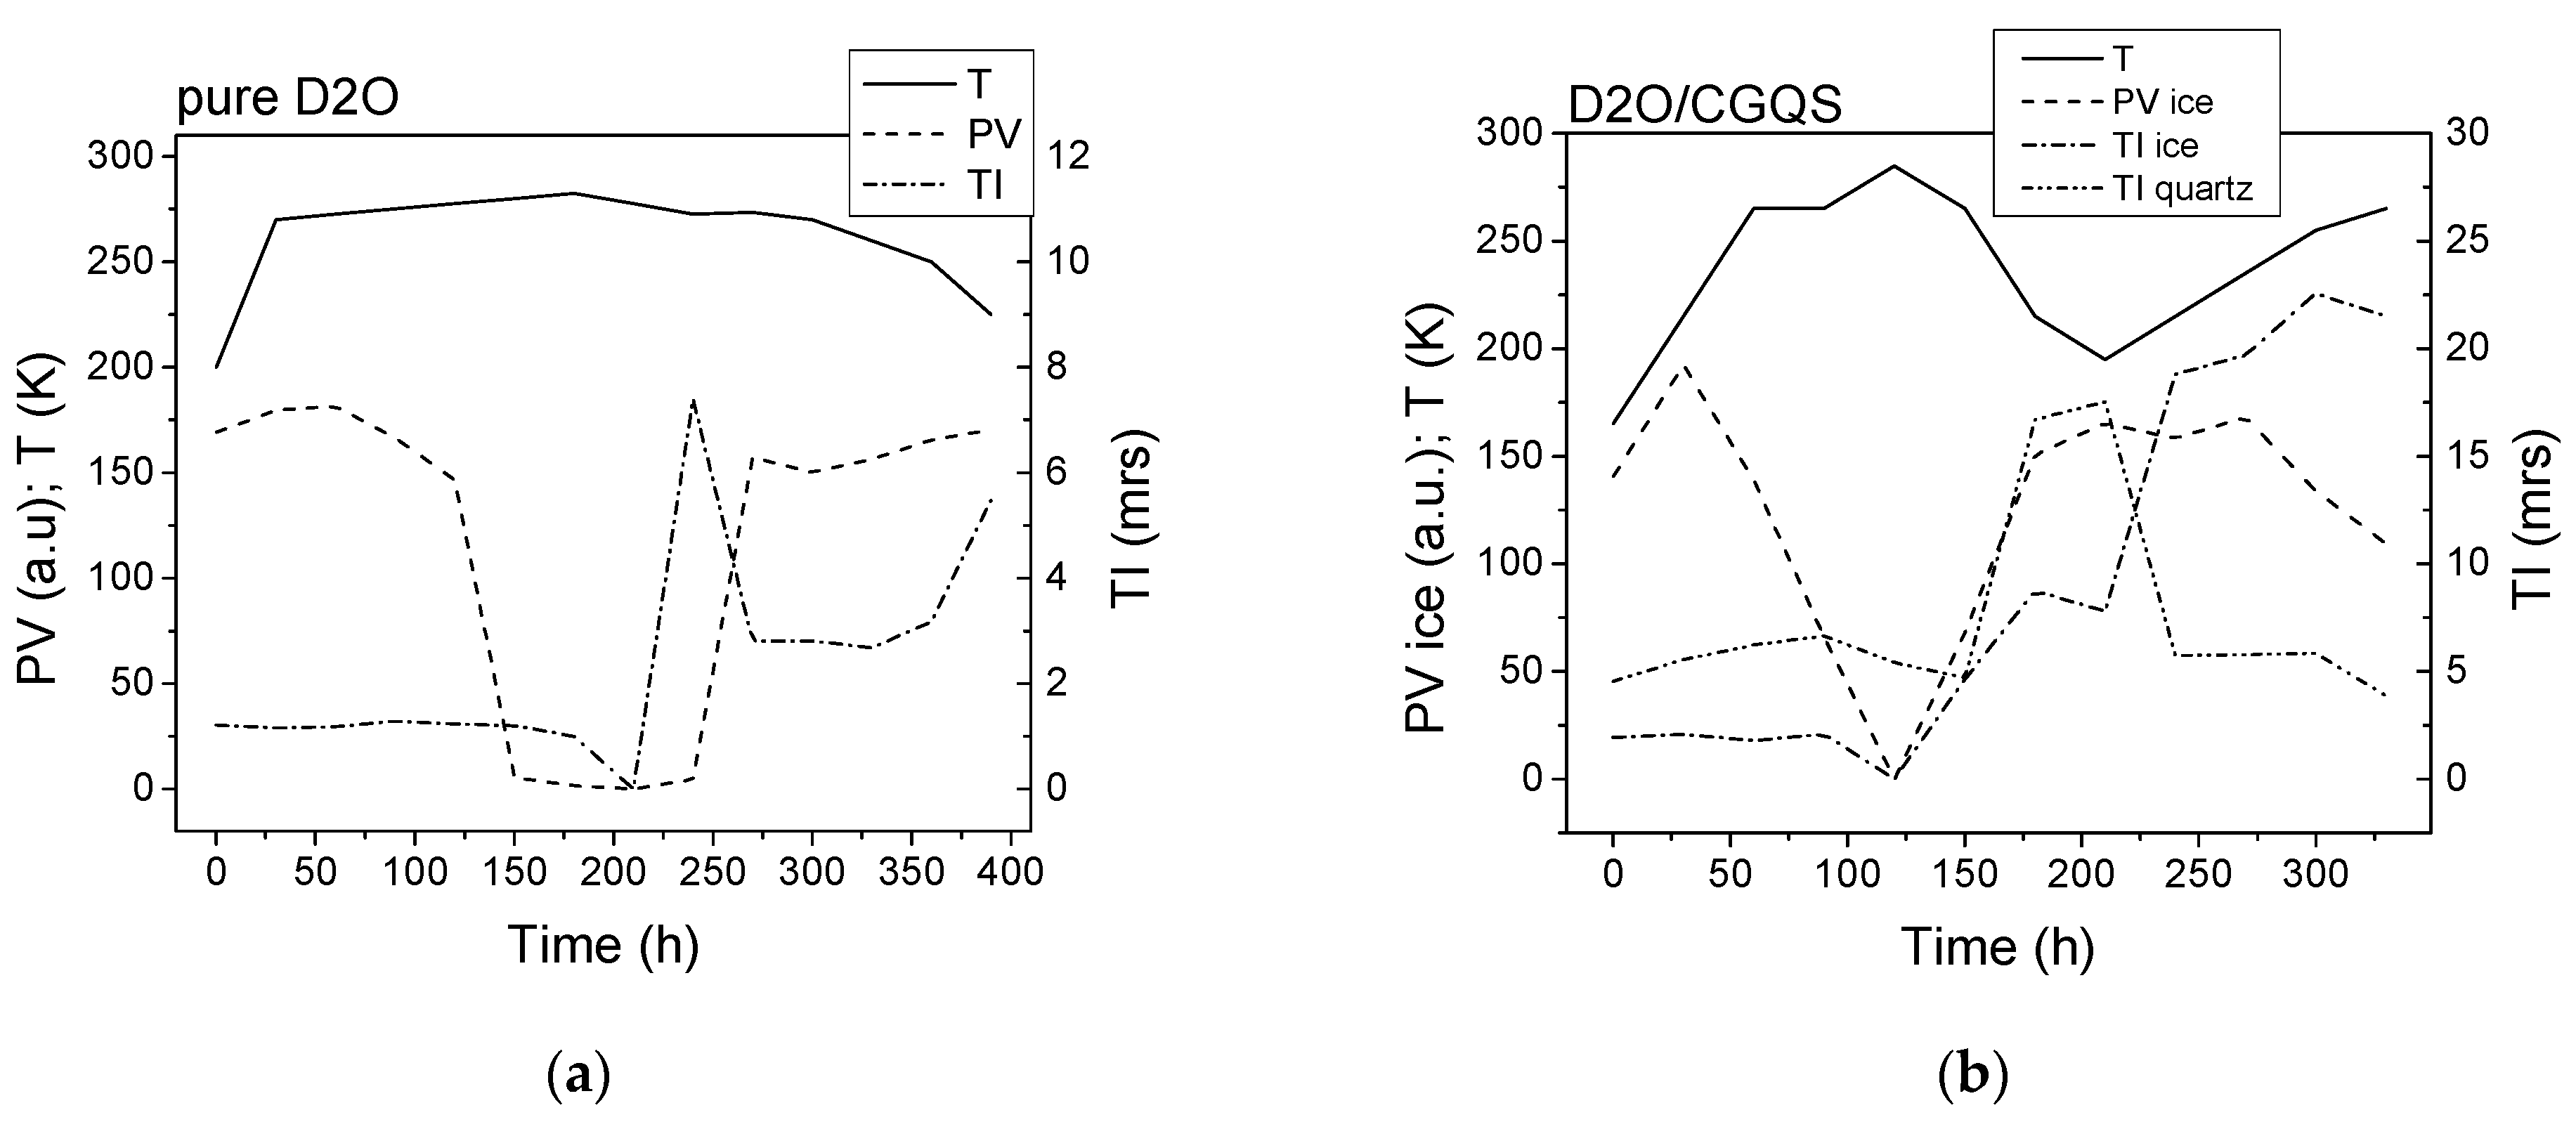
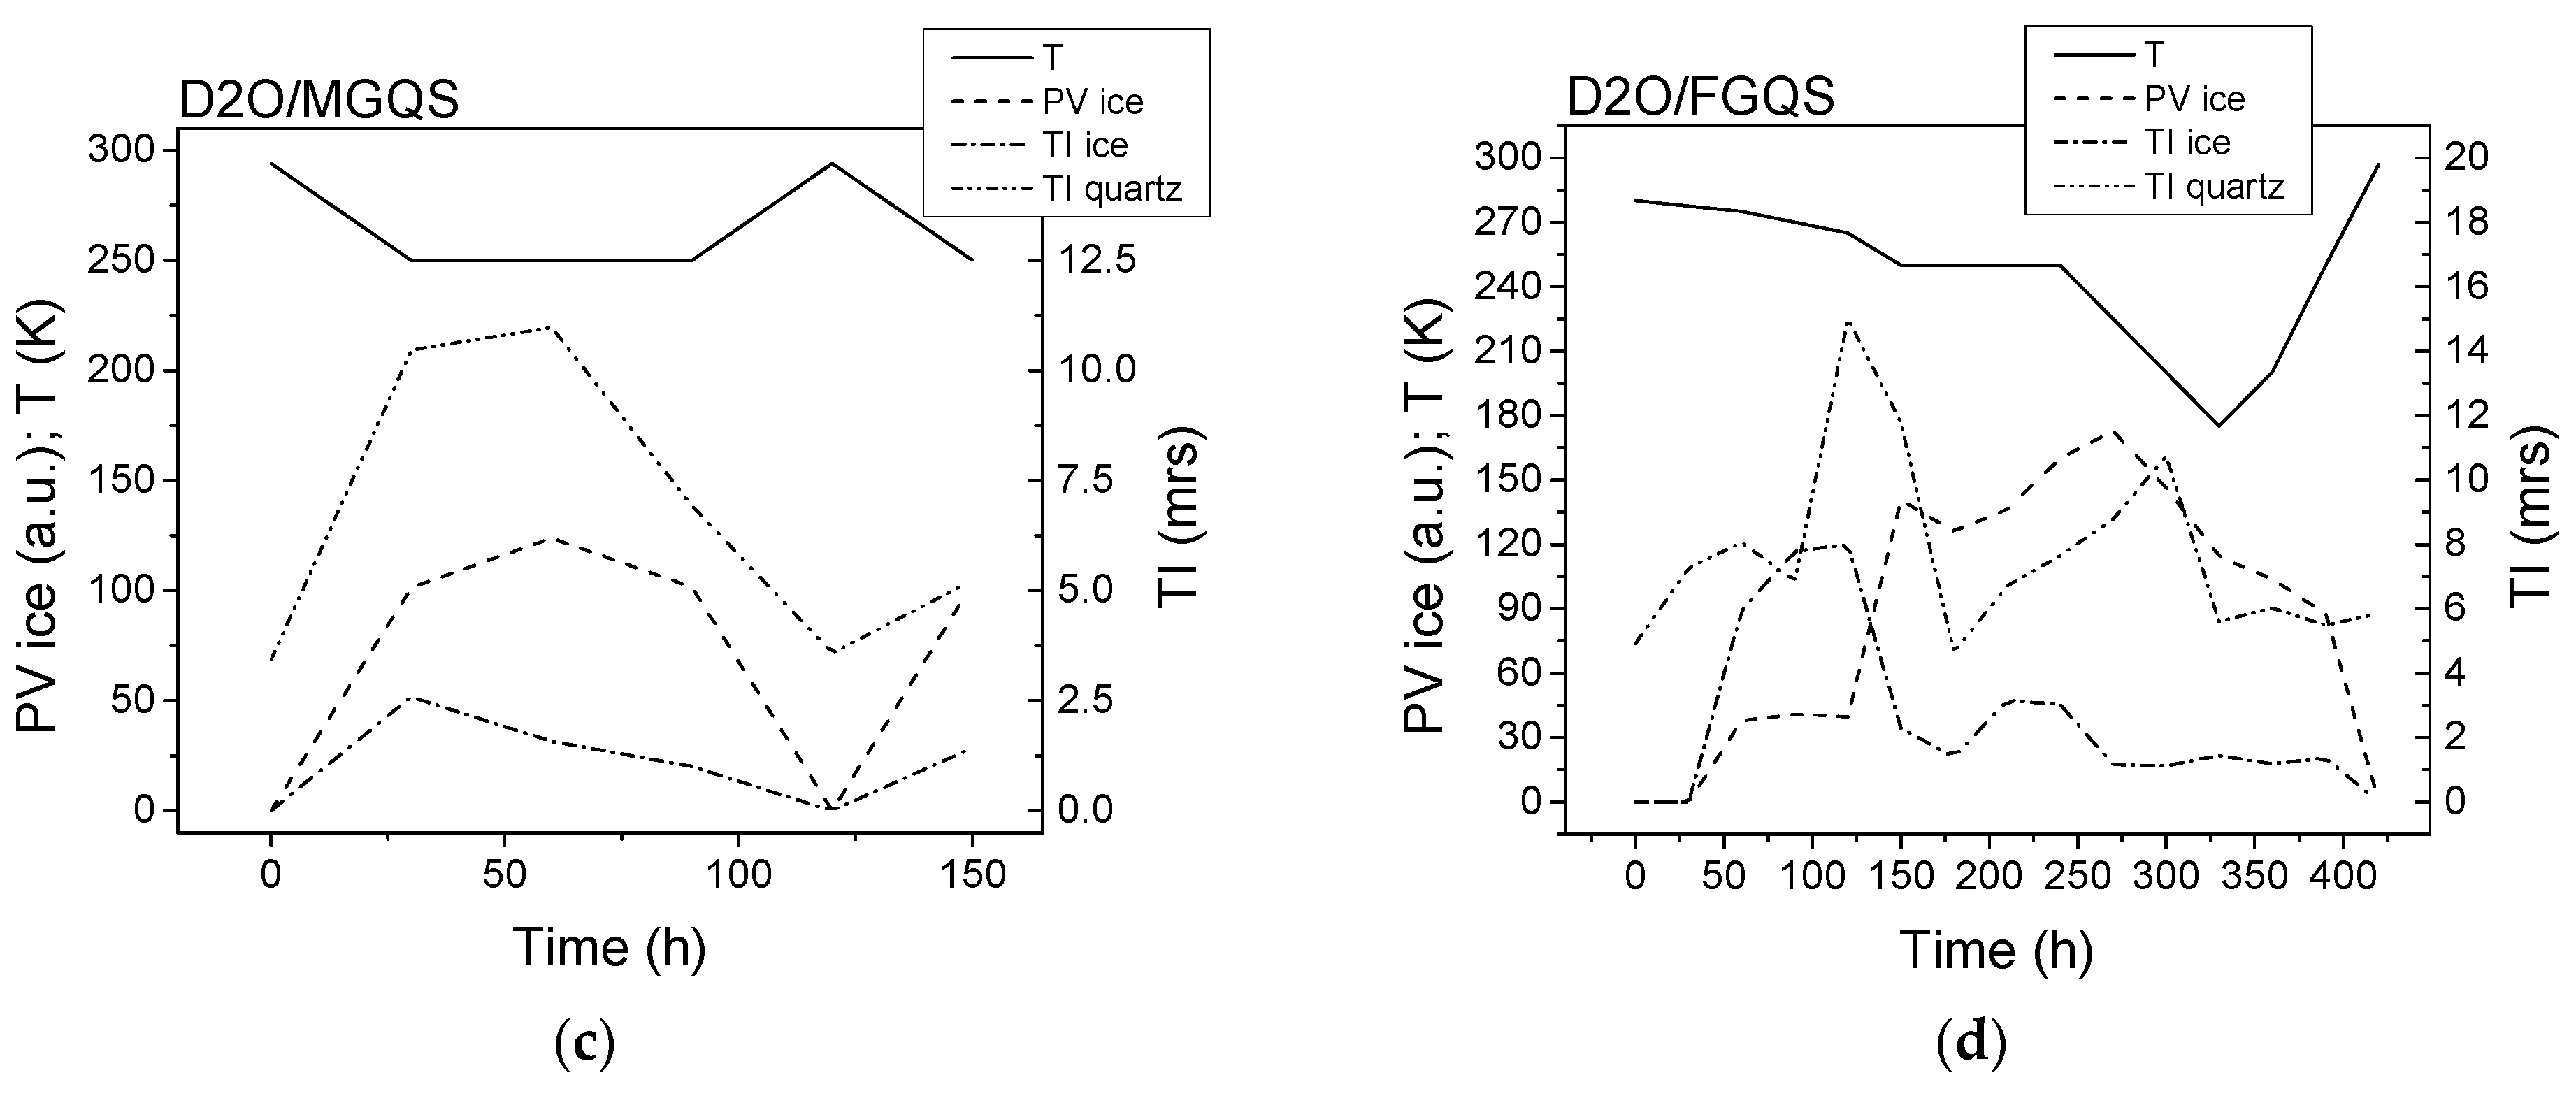
3.2. Texture Changes within Single Freezing/Thawing Cycle

In order to gain a deeper insight into the process of ice grains growth and its possible changes caused by addition of quartz sand of different grain coarseness, the phase composition and crystallographic texture evolution of studied sample types occurring within one single thermal cycle were further tested in detail. The sample temperature was gradually (ΔT = 0.2 K/min) varied between the cooled state and the state with the ice phase partially melted. Neutron diffraction patterns were recorded at the selected temperature points, after the proper stabilization of the specimen temperature was achieved (characterized by fluctuations in the sample temperature bellow 0.1 K). The Rietveld method and harmonic texture analysis procedure implemented in the SW package GSAS was then used to determine evolution of the phase volume (PV) and the crystallographic texture index (TI) with temperature. The results obtained for the studied samples are shown in Figure 4, together with the applied temperature courses.
As expected, the PV of ice follows the temperature course, growing with cooling specimen down and vice versa. The obtained TI values fluctuate for both analyzed phases (ice and quartz), suggesting re-orientation of not only ice grains but also the quartz particles. Shape anisotropy of the latter, together with action of surrounding ice grains, is likely contributing to this effect. An intermittent maximum of both texture indices appears at the beginning of the temperature descent, but the further observed evolution of TI values differs for different sample types. It can be only speculated that the observed effects reflect a directionally uneven growth rate and habitus of the just geminated ice crystals, influencing then the orientation arrangement of surrounding quartz grains with the form of tiny platelets; during the further cooling, the texture evolution is then likely influenced by growing interactions among adjacent ice grains. These interactions might then contribute to the increase in local non-zero stress levels, relaxing then partially through induced visco-plastic ice grains deformation leading to re-orientation of ice grains and influencing preferential orientation of quartz grains. Theoretical simulations of nucleation and ice grain growth in studied sand/water mixtures are necessary in order to interpret in detail the observed data. The calculations are already in progress and the results will be published in a separate forthcoming paper.

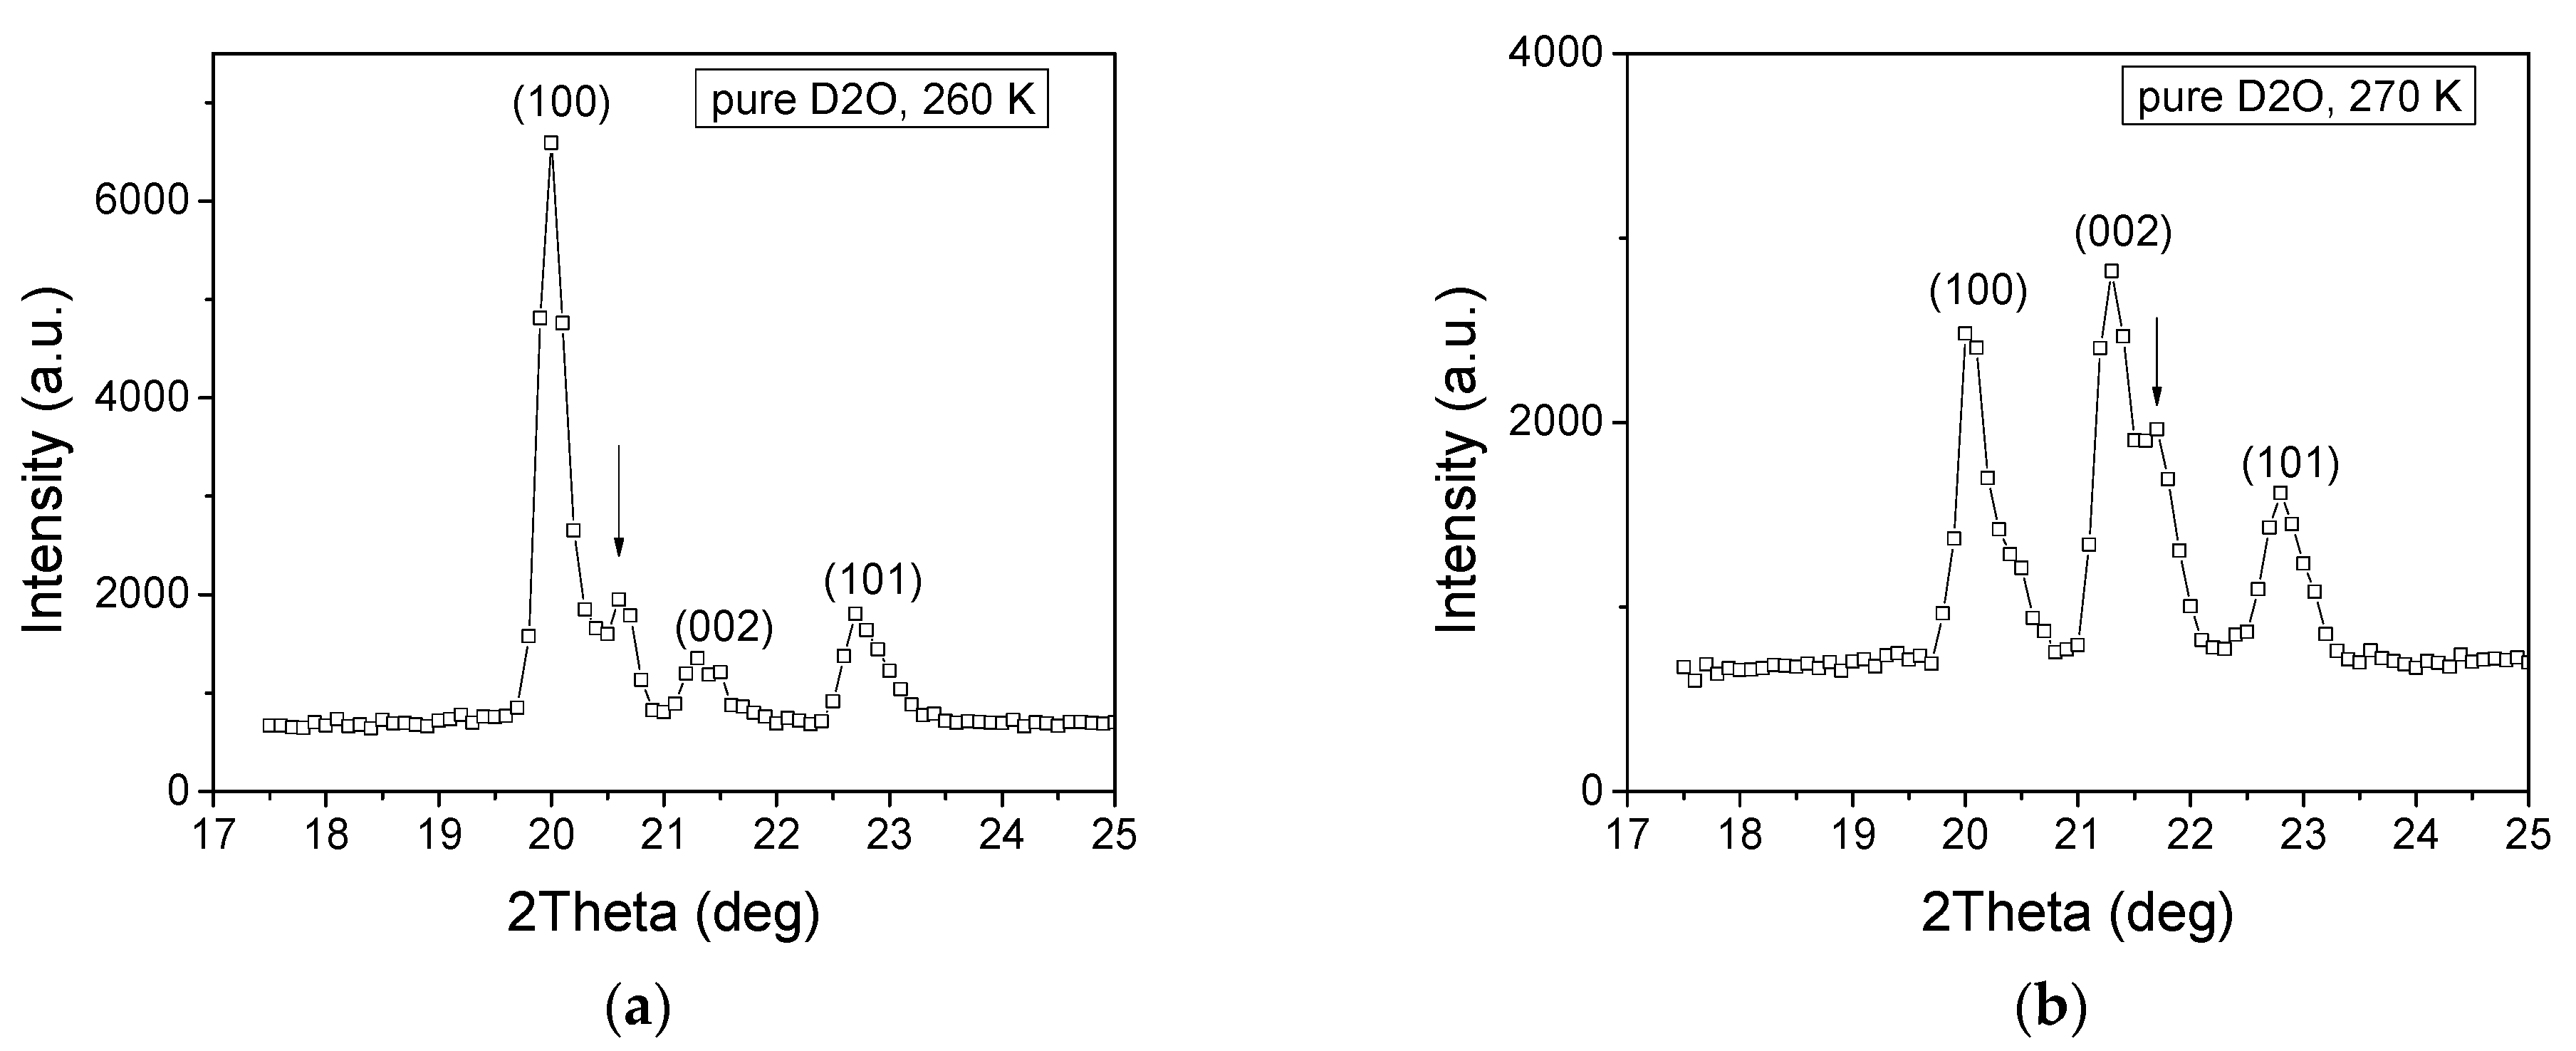
3.3. Split of Diffraction Maxima and Internal Stress Load

Independent experimental evidence for existence of radial stresses in volume of the tested specimens (vertical axis of the cylindrical container being perpendicular to the scattering plane) is provided by the observed split of (100) and (002) diffraction lines of D2O ice. Figure 5 shows two examples of the effect for the case of the pure D2O sample. On several specimens of this composition, the accumulated internal stresses manifested themselves by the mechanical breakage of experimental containers.
The estimated radial stresses σ100 and σ002 are calculated from the split of (100) and (002) Ih D2O ice diffraction lines recorded with the specimens cooled down to T = 250 K
σ 100 = B   ( a E     a 0 ) / a 0       σ 002   =   B   ( c E     c 0 ) / c 0   .
Here, aE and cE are the deformed lattice parameters following from the angular positions of the particular (100) and (002) split components; a0 and c0 are the ‘zero stress’ standard lattice parameters of D2O ice at 250 K: a0 = 4.522 Ǻ, c0 = 7.363 Ǻ [16]. The bulk modulus (B) of Ih D2O ice is approximated by the value obtained for Ih H2O ice, calculated as arithmetic mean of the isothermal and adiabatic moduli at T = 250 K [23]. The obtained value B = 8.8 GPa was used in further calculations. In case of multiple split diffraction maxima, an effective radial stress value (σeff) averaged over the specimen volume is then estimated as the arithmetic mean of stress values following from the individual observed split components, weighted by their relative integral intensities (Ahkl) calculated from a Gaussian fit. The obtained results are summarized in Table 1.
The mixed D2O/sand samples show c-split only; both a- and c-splits were then observed in the case of pure D2O samples. The mixtures and pure D2O samples differ also in the prevailing type of the observed radial stress: only compressive effective stress is observed with pure water samples, both tensile and compressive effective stresses then appear in the case of mixtures. This finding seems to be conformal with the fact that the container breakage issue was only observed in case of the pure D2O specimens.
According to the recent article by Monz and coworkers [13] and the state-of-the-art review herein, crystallographic preferential orientation (CPO) of Ih ice develops during a plastic deformation preferentially by dislocation slide on the basal plane, modified/intensified by optional dynamic recrystallization. Taking into account the overall size of our container, the granularity of our samples belongs very likely to a ‘fine-grained’ type, with the mean grain diameter below ca 20 mm.
Due to the cylindrical symmetry of our specimens, vertical orientation of their axis, and filling ensuring presence of a small free volume above the specimen mass, we can suppose that the only possible kinematic ‘flow’ direction of the ice mass is directed upwards, along the container axis. In such case, transformed into the geometry of our experiment, the theory as well as experimental data suggest the CPO of ice grains by the crystallographic c-axis along the radial direction of container [13]. Since, at the same time, ice expansion along the radial direction is limited by the toughness of the container, a radial pressure stress is likely to accommodate during the freezing progression, leading to local compressive deformation resulting in a split in the Ih c-axis length. The perpendicular a-axis length remains unchanged. These expectations are fully conformal with our results obtained for pure D2O. Let us note that all the mentioned effects must be considered statistically, with the actual intensiveness depending on the real present CPO strength.
In case of mixtures, the situation is more complex. The presence of sand particles influences the resulting CPO of ice and the actual stress field distribution and relaxation in the mixtures. Size, shape, and concentration of the particles might be likely estimated and addressed as the key parameters involved in the physical mechanisms behind the observed results. Elucidation of the role of particular parameters, supported by theoretical simulations, will be the subject of our further research.

4. Conclusions

The obtained results demonstrate the capability of the neutron diffraction method to characterize in detail complex structural processes accompanying freezing/thawing transitions in wet soil mixtures. With regard to the coarse-grained nature of both the ice phase and the usual solid admixtures, application of highly penetrating neutron radiation, allowing studies of voluminous samples, provides an indispensable tool for collecting statistically relevant data about the studied systems.
Random variations of the ice grains’ crystallographic texture were observed for all the tested sample types, reflecting likely the ambient orientation of ice nuclei during the repeated melting and freezing. The onset of oriented ice grains growth is reflected by an intermittent enhancement of the ice texture index observed shortly after the start of the specimens’ cooling, accompanied by similar behavior of quartz sand grains’ orientation. Formation of radial internal stresses in the volume of the tested samples was then demonstrated by the observed split of (002) and (100) diffraction maxima of ice. The corresponding effective radial stress values are calculated. Only compressive stress was obtained for pure D2O samples; both tensile and compressive effective stresses components then appeared in case of mixed samples.

Author Contributions

Conceptualization, L.K. and S.V.; methodology, S.V. and M.D.; software, M.D.; validation, L.K., M.K. and S.V.; formal analysis, L.K., M.D., M.K. and S.V.; investigation, S.V.; data curation, L.K. and S.V.; writing—original draft preparation, L.K.; writing—review and editing, L.K., M.K. and S.V.; visualization, L.K.; supervision, L.K.; project administration, L.K.; funding acquisition, L.K., M.K. and S.V. All authors have read and agreed to the published version of the manuscript.

Funding

This research was funded by CSF grant 21-09093S, MEYS CR grant CZ.02.1.01/0.0/0.0/16_019/0000778, and the Joint Institute for Nuclear Research 04-4-1142-2020/2025 (Czech-JINR Projects no. 182/18.03.2021 item 23 and Grant of the Plenipotentiary of the government of the Czech Republic in JINR 181/18.03.2021 item 14).

Institutional Review Board Statement

Not applicable.

Informed Consent Statement

Not applicable.

Data Availability Statement

The data supporting reported results can be obtained on request from the article authors.

Conflicts of Interest

The authors declare no conflict of interest. The funders had no role in the design of the study; in the collection, analyses, or interpretation of data; in the writing of the manuscript, or in the decision to publish the results.

References

  1. Saruya, T.; Nakajima, K.; Takata, M.; Homma, T.; Azuma, N.; Goto-Azuma, K. Effects of microparticles on deformation and microstructural evolution of fine-grained ice. J. Glaciol. 2019, 65, 531–541. [Google Scholar] [CrossRef] [Green Version]
  2. Montagnat, M.; Löwe, H.; Calonne, N.; Schneebeli, M.; Matzl, M.; Jaggi, M. On the Birth of Structural and Crystallographic Fabric Signals in Polar Snow: A Case Study from the EastGRIP Snowpack. Front. Earth Sci. 2020, 8, 365. [Google Scholar] [CrossRef]
  3. Das, S.; Castaneda, P.P. A multiphase homogenization model for the viscoplastic response of intact sea ice: The effect of porosity and crystallographic texture. Int. J. Multiscale Comp. Eng. 2019, 17, 121–150. [Google Scholar] [CrossRef]
  4. Montagnat, M.; Bourcier, M.; Philip, A.; Bons, P.D.; Bauer, C.C.; Deconinck, P.; Hereil, P. Texture characterization of some large hailstones with an automated technique. J. Glaciol. 2021, 1–15. [Google Scholar] [CrossRef]
  5. Litwin, K.L.; Zygielbaum, B.R.; Polito, P.J.; Sklar, L.S.; Collins, G.C. Influence of temperature, composition, and grain size on the tensile failure of water ice: Implications for erosion on Titan. J. Geophys. Res. 2012, 117, E08013. [Google Scholar] [CrossRef]
  6. Deville, S.; Viazzi, C.; Leloup, J.; Lasalle, A.; Guizard, C.; Maire, E.; Adrien, J.; Gremillard, L. Ice Shaping Properties, Similar to That of Antifreeze Proteins, of a Zirconium Acetate Complex. PLoS ONE 2011, 6, e26474. [Google Scholar] [CrossRef] [PubMed] [Green Version]
  7. Hu, F.; Li, Z.; Tian, Y.; Hu, R. Failure Patterns and Morphological Soil–Rock Interface: Characteristics of Frozen Soil–Rock Mixtures under Compression and Tension. Appl. Sci. 2021, 11, 461. [Google Scholar] [CrossRef]
  8. Cook, K.L.K.; Hartel, R.W. Mechanisms of Ice Crystallization in Ice Cream Production. CRFSFS 2010, 9, 213–222. [Google Scholar] [CrossRef]
  9. Bronfenbrener, L. The modelling of the freezing process in fine-grained porous media: Application to the frost heave estimation. Cold Reg. Sci. Technol. 2009, 56, 120–134. [Google Scholar] [CrossRef]
  10. Style, R.W.; Peppin, S.S.L. The kinetics of ice-lens growth in porous media. J. Fluid Mech. 2012, 692, 482–498. [Google Scholar] [CrossRef] [Green Version]
  11. Chen, P.; Luo, H.; Liu, E. Moisture transfer and formation of separate ice in the freezing process of saturated soils. Water 2020, 12, 1044. [Google Scholar] [CrossRef] [Green Version]
  12. Deville, S.; Adrien, J.; Maire, E.; Scheel, M.; Di Michiel, M. Time-lapse, three-dimensional in situ imaging of ice crystal growth in a colloidal silica suspension. Acta Mater. 2013, 61, 2077–2086. [Google Scholar] [CrossRef] [Green Version]
  13. Monz, M.E.; Hudleston, P.J.; Prior, D.J.; Michels, Z.; Fan, S.; Negrini, M.; Langhorne, P.J.; Qi, C. Full crystallographic orientation (c and a axes) of warm, coarse-grained ice in a shear-dominated setting: A case study, Storglaciären, Sweden. Cryosphere 2021, 15, 303–324. [Google Scholar] [CrossRef]
  14. Tseng, Y.-H.; Cheng, C.-C.; Cheng, H.-P.; Lee, D. Novel Real-Time Diagnosis of the Freezing Process Using an Ultrasonic Transducer. Sensors 2015, 15, 10332–10349. [Google Scholar] [CrossRef] [PubMed] [Green Version]
  15. Tamtögl, A.; Bahn, E.; Sacchi, M.; Zhu, J.; Ward, D.J.; Jardine, A.P.; Jenkins, S.J.; Fouquet, P.; Ellis, J.; Allison, W. Motion of water monomers reveals a kinetic barrier to ice nucleation on graphene. Nat. Commun. 2021, 12, 3120. [Google Scholar] [CrossRef]
  16. Fortes, A.D. Accurate and precise lattice parameters of H2O and D2O ice Ih between 1.6 and 270 K from high resolution time-of-flight neutron powder diffraction data. Acta Cryst. 2018, B74, 196–216. [Google Scholar] [CrossRef]
  17. Wilson, C.J.L.; Hunter, N.J.R.; Luzin, V.; Peternell, M.; Piazollo, S. The influence of strain rate and presence of dispersed second phases on the deformation behavior of polycrystalline D2O ice. J. Glaciol. 2019, 65, 101–122. [Google Scholar] [CrossRef] [Green Version]
  18. Kalvoda, L.; Kichanov, S.E.; Kucerakova, M.; Lukin, E.V.; Vratislav, S. Ice Melting Kinetics in Sand-Water Mixtures Investigated by Neutron Radiography and Diffraction. J. Cold Reg. Eng. 2019, 33, 04019003. [Google Scholar] [CrossRef]
  19. Searf, V.F. Neutron scattering lengths and cross sections. Neutron News 1992, 3, 29–37. [Google Scholar]
  20. Petkov, V.; Bakaltchev, N. FIT, a computer program for decomposition of powder diffraction patterns and profile analysis of pair correlation functions. J. Appl. Crystallogr. 1990, 23, 138–140. [Google Scholar] [CrossRef] [Green Version]
  21. Toby, B.H.; Von Dreele, R.B. GSAS-II: The genesis of a modern open-source all-purpose crystallography software package. J. Appl. Crystallogr. 2013, 46, 544–549. [Google Scholar] [CrossRef]
  22. Harris, G.B. Quantitative measurement of preferred orientation in rolled uranium bars. Philos. Mag. 1952, 43, 113–123. [Google Scholar] [CrossRef]
  23. Neumeier, J.J. Elastic Constants, Bulk Modulus, and Compressibility of H2O Ice Ih for the Temperature Range 50 K–273 K. J. Phys. Chem. Ref. Data 2018, 47, 033101. [Google Scholar] [CrossRef] [Green Version]
Figure 1. Example of neutron diffraction patterns recorded with the D2O/MGQS mixture at T = 250 K; λ = 0.1362 nm; crosses—the experimental data points; full line—the Rietveld fit. Diffraction maxima corresponding to α-quartz (sand), aluminum (container) and hexagonal Ih D2O are indicated below the profile by the green, blue and red lines, respectively. At the bottom, the pink curve shows the residual difference between the observed and fit intensity.
Crystals 11 00961 g001
Figure 2. Evolution of phkl, hkl = 100, 002, 101, 102 during the successive thermal cycles (see the text for details) observed for the indicated sample types: (a) pure D2O, (b) CGQS, (c) MGQS, (d) FGQS. The pure D2O and D2O/FGQS specimens were subjected to 3 consecutive cooling–heating cycles, the D2O/MGQS and D2O/CGQS then to 4 cycles.
Crystals 11 00961 g002
Figure 3. MTI values calculated for the indicated samples according to Rel. (2); estimated standard deviations are indicated.
Crystals 11 00961 g003
Figure 4. Evolution of the phase volume (PV) of Ih ice and texture indices (TI) of Ih ice and α-quartz during the indicated temperature courses (T): (a) pure D2O, (b) CGQS, (c) MGQS, and (d) Figure 2. O in the mixed samples amounts represents 3.5/1.
Crystals 11 00961 g004aCrystals 11 00961 g004b
Figure 5. The split of D2O ice diffraction lines (100) and (002) (marked by an arrow) observed for a pure D2O sample cooled down to 260 K (a) and 270 K (b); the difference in intensity of the diffraction lines caused by crystallographic texture changes is also apparent.
Crystals 11 00961 g005
Table 1. Lattice parameters (cE, aE) and radial stress values (σ100, σ002, σeff) calculated from the observed split diffraction lines (with Miller indices hkl and integral intensity Ahkl) for the studied sample types; T = 250 K; the positive/negative stress value corresponds to a tensile/compressive stress, respectively.
SampleLine
(hkl)
Ahkl
(a.u.)
cE (Å)aE (Å)σhkl (MPa)σeff (MPa)
CGQS00290617.362-−1.256.12
56147.566-242.62
34687.282-−96.81
MGQS00258247.323-−47.81−54.48
30987.367-4.78
27637.252-−132.66
FGQS00219497.370-8.37−1.12
14807.394-37.05
8367.287-−90.83
Pure D2O10011,924-4.517−9.73−55.08
4442-4.431−177.09
00215,2637.366-3.59−61.91
10,1667.229-−160.15
Publisher’s Note: MDPI stays neutral with regard to jurisdictional claims in published maps and institutional affiliations.

