Article

Effect of Full Temperature Field Environment on Bonding Strength of Aluminum Alloy

School of Mechanical Engineering, North China University of Water Resources and Electric Power, Zhengzhou 450045, China
*
Author to whom correspondence should be addressed.
Crystals 2021, 11(6), 657; https://doi.org/10.3390/cryst11060657
Submission received: 10 May 2021 / Revised: 2 June 2021 / Accepted: 5 June 2021 / Published: 9 June 2021
(This article belongs to the Special Issue Advances in Sustainable Concrete System)

Abstract

:
In this paper, the influence of temperature on the bonding strength of aluminum alloy joints under the full temperature field is studied. Based on the service temperature range of vehicle bonding structures, the failure strength of aluminum alloy joints at different temperature points, namely −40 °C, −20 °C, 0 °C, 25 °C (RT), 40 °C, 60 °C and 80 °C, is tested. The results showed that compared with the failure strength of the adhesive at −40 °C, it decreased by 47.69% and 68.15% at RT and 80°C, respectively; the Young’s modulus of the adhesive decreased by 57.63% and 75.42% at RT and 80°C, respectively; with the increase of temperature, the young’s modulus, tensile strength and failure strain of the adhesive decreased. In addition, the failure strength of aluminum alloy joints varied with temperature. To be specific, the stiffness of joints decreased gradually from 25 °C to 80 °C and increased gradually from −40 °C. Based on the failure strength data of bonded joints at different temperature points, the secondary stress failure criteria of bonded joints at different temperatures were obtained. Then, the surface function of failure criteria under the full temperature field was established to provide reference for failure prediction of bonded structures under different temperatures and stresses.

1. Introduction

In recent years, with the increasing application of new materials such as aluminum alloy, high strength steel and composite materials in automobiles as well as the continuous development of multi-material hybrid design concept in the automobile industry, the traditional mechanical connection technology (such as welding and riveting) cannot meet the connection requirements between different materials [1,2]. As a new connection method, bonding technology has the advantages of uniform stress distribution, fatigue resistance, light weight, etc. [3,4,5]. In this case, the connection needs of dissimilar materials can be effectively realized. Therefore, compared with other connection technologies, increasing attention has been paid to bonding technology. As a tough adhesive, polyurethane adhesive is gradually being widely used in automobiles, since it not only has high tear strength, good impact resistance and excellent toughness, but also provides relatively uniform stress distribution due to its low elastic modulus.
However, as a kind of polymer material, adhesive relies on temperature to some extent. The change of temperature will directly affect the mechanical properties of the material, and its failure strength and failure form change with different temperatures [6]. In the process of service, the ambient temperature range of adhesive structure is large. During the process of vehicle operation, the adhesive structure needs to provide enough strength in the service temperature range. The performance of the bonding structure is closely related to the service temperature, and the bonding structure significantly affects the overall strength and fatigue characteristics of the car body. Therefore, the research on the influence of the whole service temperature field on the performance of the body bonding structure is the technical guarantee to realize the lightweight design of the body structure. Scholars at home and abroad have carried out relevant studies on the static performance and strength-checking criteria of temperature bonding structures [7,8].
Temperature is the main factor affecting the performance of the adhesive, and the mechanical properties of the adhesive will change in different temperature ranges. The bonding strength, strain and fracture toughness show temperature sensitivity [9]. The joint strength of the bonding structure is determined by the performance change of the adhesive and the influence of thermal stress [10]. The effect of temperature on the properties of the bonding structure is obvious, especially when the temperature is close to the glass transition temperature (Tg) of the material [11,12]. In addition, when the temperature is higher than Tg, the adhesive is featured with high elasticity, and its failure strength and elastic modulus decrease rapidly, while the elongation increases; however, when the temperature is lower than Tg, its performance is opposite [13]. Adams et al. [14] tested the single lap joint at different temperatures and also compared and analyzed the influence of thermal stress caused by the difference of thermal expansion coefficients and shrinkage stress caused by curing on the joint performance, which lead to the change concerning the stress state of the lap joint; the stress/strain performance of polymer adhesive also changes with the change of temperature. Na et al. [15,16] studied the effect of temperature on the mechanical properties of basalt fiber-reinforced composite/aluminum alloy bonded joints and found that with the increase in temperature, the Young’s modulus and tensile strength of the joint decreased, while the tensile strain increased. The closer the temperature to Tg, the more significant the change in mechanical properties. Silva et al. [17] conducted a test on the mechanical properties of the single lap joint at low temperature and high temperature and revealed that the adhesive was brittle at low temperature and ductile at high temperature. They also analyzed the effect of porosity on failure. Banea et al. [12] investigated the stress-strain properties of polyurethane and epoxy adhesives at −40 °C, room temperature and 80 °C. It was found that with an increase in temperature, the failure strength and the Young’s modulus of epoxy adhesives decreased, while the failure strain increased, which resulted from the increase of adhesive toughness at high temperature. Zhang et al. [18] conducted a study on the tensile properties of double lap joints in the temperature range of −35~60 °C and found that the load-elongation response was mainly affected by the thermomechanical properties of the adhesive, while it was less affected by the adhesive base material. When the temperature was higher than Tg, the strength and stiffness of the joint decreased, while the elongation increased dramatically, and the failure mechanism changed with the increase in temperature. To be specific, crack growth rate is higher at low temperature. In addition, the critical strain energy release rate for crack initiation and propagation increases continuously with increasing temperature.
Adhesion technology provides technical support for mixed material body design, but it also brings some problems. The service temperature of the bonding structure used in vehicles varies to a great extent in practical application. As a macromolecule material, the performance of the bonding structure is greatly affected by temperature, which causes the mechanical properties of the bonding structure to change with temperature. In order to achieve the safety design of the vehicle, the bonding structure must ensure the reliability of the connection within the full temperature field of the vehicle service. Therefore, temperature is one of the important factors that must be considered in the design of a bonded structure. It is of great significance to study the changing rules of bonded joint performance at different temperatures and propose the failure prediction method of bonded joints under the full temperature field for guiding the design of bonded structures.

2. Material Selection and Specimen Design

2.1. Adhesive and Substrate

The experimental selective adhesive was a modified silane polyurethane adhesive widely used in the window bonding of cars, trucks and trains. ISR-7008 is produced by Bostik China Co., Ltd. The mechanical parameters of the adhesive and adhesive substrate are shown in Table 1. The working temperature range provided in the technical manual is −40 °C~−90 °C. A permanent elastomer is formed by reaction with moisture in the air. 6005A aluminum alloy was selected as the adhesive substrate; it is widely used in automotive body structures. Table 2 shows the main performance parameters of ISR-7008 adhesive (provided by suppliers).

2.2. Design and Processing of Specimens

To investigate the durability of adhesive joints under different stress states, the single lap joint (SLJ), the scarf joint (SJ) and the butt joint (BJ) were selected. When adherends are isotropic metallic and when the bondline thickness is very thin, the stress of the adhesive is assumed to be uniform and equal to the average values [8,19]. Thus, the SLJ and the BJ represent the shear stress and normal stress, respectively, while the SJ refers to the combined shear and normal stress. Furthermore, the normal and shear stress components with an infinitesimal block of adhesive within the central region of the scarf joints are calculated by assuming the coordinate and stress system as shown in Figure 1. The ratio between the tensile force and shear force of the adhesive layer can be changed by changing the angle α between the adhesive interface and the axis of specimens. It can be seen from the force decomposition that F represents the tensile force on both ends of the specimen. F sin α is the tensile force component of F on the bonding interface, and F cos α indicates the shear force component of F on the bonding interface. The normal σ and shear stress τ components are given by Equation (1), where F is the uniaxial failure load, A denotes the bonding area and   α refers to the scarf angle.
σ = F sin α A ,   τ = F cos α A
The docking and lap specimens were designed to study the mechanical properties of the adhesive joints under tensile stress and shear stress, separately. The overall size of the butt joint is 201 × 25 × 25 mm3, and the adhesive area is 25 × 25 mm2, while the overall size of the lap joint is 175 × 25 × 11 mm3, and the adhesive area is 25 × 25 mm2. The butt joint and the shear joint are shown in Figure 2, where the thickness of the adhesive layer is 1 mm.
In the actual service process, the adhesive structure is often affected by tensile stress and shear stress; thus, it is of great significance to study the failure behavior of adhesive joints under the coupling of tensile stress and shear stress through reasonable joint design, thus being conducive to establishing the failure prediction of adhesive joints under complex stress. In order to study the failure behavior of the adhesive layer under different stress conditions, scarf joints with adhesive angles of 15°, 30°, 45°, 60°and 75° were designed and processed (as shown in Figure 3). The adhesive thickness of all specimens is unified as 1 mm.

2.3. Dumbbell Sample

ISR-7008 is a kind of flexible polyurethane adhesive. As the completely cured adhesive sheet is extremely soft, it is not feasible to use machined tensile test samples. Therefore, molding technology is adopted to process the sample for further avoiding the scratch problem in the cutting process and ensuring that the sample is obtained without defects. Apart from that, for achieving the above purpose, the related metal abrasive tool is designed as shown in Figure 4. The grinding tool consists of three parts: the lower part is the base to play a supporting role; the middle is the template to determine the sample size and shape; the upper part is the compression plate and bolts.
During the process of making samples, in order to prevent adhesive from sticking to the mold, a layer of polytetrafluoroethylene (PTFE) material is spread on the upper surface of the base and the lower surface of the pressure plate, and a layer of release agent is applied on all the surfaces of the template. After the die groove is coated with adhesive, the pressure plate on the cover is pressed with bolts. ISR-7008 adhesive is moisture curing. In order to ensure complete curing, it is solidified in 25 °C/50%RH environment for 7 days to remove the pressure plate (the reference manufacturer provides curing conditions), as shown in Figure 4, and then curing continues for 21 days. The geometric dimensions of the dumbbell stretch samples used refer to the NF ISO 527-2 standards.

2.4. Design and Manufacture of Fixture

There are two main difficulties to be overcome in the adhesive process of docking and scarf specimens: the accurate control of neutral and adhesive thickness of the upper and lower square test rods of the specimen. To address these, it is necessary to first design and make the corresponding adhesive fixture. While the fixture is being made, the upper and lower grooves of the fixture are milled with one knife, thus ensuring the neutrality of the upper and lower test rods in the adhesive process of the specimen. At the same time, there is a calibration line next to the groove on one side of the fixture, and it is employed to control the thickness of the adhesive layer. The metal strip in the upper part of the groove is used to fix the adhesive specimen, and the knob on one side is adopted to push the adhesive test rod to the bond, as shown in Figure 5.
There are also some difficulties in the adhesive process of lap specimens; the main ones are the parallelism of the two adhesive test rods and the warping of the upper and lower surfaces. In order to solve these problems, in this paper, the corresponding fixtures, including the lateral fastening fixture and the gantry tightening fixture, are designed as shown in Figure 6. The parallelism of the adhesive specimen is guaranteed by the screw rotation clamping of the lateral fastening fixture, and the metal block between the two rods is used to control the lap width of the shear specimen, while the flatness of the upper and lower planes of the adhesive is ensured by the screw compression of the downward rotating gantry compression fixture.

2.5. Bonding Process

All specimens are adhesive in a clean and stable environment (temperature: 25 ± 3 °C; relative humidity: 50 ± 5%). The preparation process is as follows:
  • An 80 mesh sandpaper is used for the cross grind concerning the adhesive surface of aluminum alloy along the 45° direction to increase the surface roughness and facilitate the adhesive.
  • Acetone is used to clean the specimen, thus removing the oil pollution and dust produced in processing. Wiping paper is dipped in acetone, and the adhesive surface is wiped in one direction until the surface of the tissue is clean. The surface is allowed to dry for 10 min.
  • Surface pretreatment coating agent Primer M is used to clean the adhesive surface again. The surface is again allowed to dry for 10 min.
  • As for adhesive ISR-7008, on its surface, the corresponding fixture described above is used to complete the specific adhesive work, and then it is solidified for a period of 4 weeks in the experimental environment.

2.6. Testing of Strength under the Condition of the Full Temperature Field

The cured fully adhesive joints are placed in the hot and humid environment box as shown in Figure 7 and are subject to the test temperature for two hours. To be specific, the temperature range is −40 °C~150 °C, the humidity range is 20% RH~99% RH, the temperature fluctuation is ±0.1 °C and the humidity fluctuation is ±1%. For each test joint, the load and displacement curves are acquired by the tensile test. It should be noticed that all the joints are tested at 25 °C/50%RH to obtain the residual strength of the adhesive joint.

3. Experimental Data Analysis

3.1. Dumbbell Sample Test

Typical temperature conditions are selected according to the temperature range (−40 °C~80 °C) in body service environment, and typical temperature points of −40 °C, RT and 80 °C are chosen. The dumbbell specimens manufactured are placed in the environmental test box according to the temperature conditions for 6 h to achieve full uniformity of the joint temperature. Immediately after taking out the dumbbell samples and loading them into the electronic universal testing machine, the dumbbell-type adhesive specimens are subjected to quasi-static tensile tests at −40 °C, RT and 80 °C, and the bonded joints are tested at a constant speed of 5 mm/min until destroyed. The stress and strain curves of dumbbell samples are recorded. The temperature required for the test is provided by a high-low temperature environment chamber; a high temperature environment can be provided by resistance wire heating, while a low temperature environment can be achieved by liquid nitrogen cooling. Apart from this, temperature changes can be accurately controlled by a temperature controller.
To accurately measure the strain of dumbbell specimens during tension, a non-contact full-field strain measurement system (VIC-3D, Correlated Solutions, Inc.) is adopted as shown in Figure 8. The whole-field displacement and strain measurements are carried out by the system, based on three-dimensional digital image correlation technology. The test procedure is as follows: the dumbbell specimen is set to 20 mm in test length and is fixed on the universal testing machine; then, two CCD cameras are installed and calibrated. The strain of the specimen is obtained by analyzing the images collected in the tensile test. Each test is repeated three times to ensure the validity of the data, taking the average as the result.

3.2. Mechanics Performance Testing

Table 3 shows the experimental test data concerning seven groups of adhesive specimens from different angles. It can be seen from the data in the table that there is a certain degree of dispersion between the experimental test data of the same group of adhesive specimens. In order to ensure that the failure strength of each adhesive specimen is more accurate and reasonable, the experimental data shown in Table 3 are screened and extracted, and two experimental data extraction methods—the section method and the statistical method—are adopted.
In the statistical method, the confidence interval in statistics is used to extract the experimental data. The confidence interval refers to the estimated interval of the overall parameters constructed by sample statistics. In this paper, the 95% confidence interval, which is commonly used in engineering data statistics, is selected to screen the experimental data falling into the confidence interval. At the same time, the failure section of the adhesive joint after static tension is analyzed and the test results of cohesion failure are selected as the effective data. Table 4, Table 5, Table 6, Table 7, Table 8, Table 9 and Table 10 show the failure strength values concerning seven groups of test specimens at different angles.

4. Analysis and Discussion of Experimental Results

4.1. Dumbbell Sample Test

The stress-strain curves at the high temperature of 80 °C, room temperature and the low temperature of −40 °C, as shown in Figure 9, show that the Young’s modulus and tensile strength of the adhesive decrease with an increase in temperature, which is contrary to the increase of failure strain of epoxy adhesive with the increase of temperature due to the difference of glass transition temperature between the two kinds of adhesive [20]. The glass transition temperature of epoxy adhesive is higher, and the toughness of the material is enhanced with the increase in temperature. However, for polyurethane adhesive ISR-7008, the glass transition temperature is low (Tg = −59 °C), and the toughness is better at low temperature. The variation of the Young’s modulus, tensile strength and failure strain of adhesive ISR-7008 with temperature is displayed in Table 11, and all show a downward trend with an increase in temperature.
The failure strength and the Young’s modulus of the adhesive vary greatly at different temperatures. The failure strength of the adhesive decreases by 47.69% and 68.15% at RT and 80 °C, respectively, compared with −40 °C, while the Young’s modulus of the adhesive decreases by 57.63% and 75.42% at RT and 80 °C, respectively. The increase in temperature results in a declining degree of failure strength and Young’s modulus. The closer the glass transition temperature of the adhesive is, the more obvious the change in the properties of the adhesive [14]. For the failure strain of the adhesive, it decreases with increasing temperature, but the decrease is slight. When the temperature rises from a low level, the ductility of the adhesive clearly changes. With the increase in temperature, the change range of ductility decreases, and that of failure strength is smaller. The adhesive fracture occurs before reaching large deformation, which leads to the decrease in failure strain of dumbbell samples with the increase in temperature. Banea et al. [21] studied room temperature silicone sulfide adhesives and similarly found that the failure displacement of the adhesives decreases with increasing temperature.

4.2. BJ and SLJ Tests

The average lap shear strength and tensile strength for joints tested at seven temperature points were obtained. In addition, the variation curves of the average lap shear and tensile strength of joints as a function of temperature are presented in Figure 10.
It was found that the adhesive strength of SLJs and BJs decreased gradually with an increase in temperature: the higher the temperature, the lower the adhesive strength. The highest adhesive strength appeared at the low temperature of −40 °C, and the lowest adhesive strength appeared at the high temperature of 80 °C. For SLJ adhesive strength, the adhesive strengths at −40 °C and −20 °C are 28.68% and 18.52%, respectively; 8.33% higher than that of room temperature. The adhesive strengths at high temperatures of 80 °C, 60 °C and 40 °C are 26.92%, 15.73% and 9.09%, respectively, lower than that at room temperature. In addition, for the adhesive strength of BJs, the adhesive strengths at high temperatures of 80 °C, 60 °C and 40 °C are 20.00%, 14.75% and 7.19% lower than that at room temperature, respectively.
The adhesive strengths at low temperatures of −40 °C, −20 °C and 0 °C are 27.60%, 8.25% and 4.47% higher than that at room temperature, respectively, which is explained by the fact that polyurethane adhesive has low glass transition temperatures (Tg = −60 °C for ISR-7008, provided by the supplier). It remains ductile, and its strength increases at low temperatures, which leads to a higher joint strength. With regard to polyurethane flexible adhesive, the adhesive strength of the joint depends not only on the strength of the adhesive but also on the toughness of the material. By comparing the changing trend concerning tensile strength and shear strength of adhesive joints, it can be found that the shear strength increases more than the tensile strength at low temperature, and it decays more than the tensile strength at high temperature, which indicates that the adhesive strength of the single lap joint is more sensitive to changes in temperature.

4.3. SJ Tests

In practical engineering applications, most stress forms of adhesive structures are basically tensile shear interaction. The adhesive strength of lap joints and butt joints decreases with the increase in temperature, while that of scarf joints under the action of tensile shear need further study. The same quasi-static tests were performed on the 15°, 30°, 45°, 60° and 75° SJs at −40 °C, −20 °C, 0 °C, 25 °C, 40 °C, 60 °C and 80 °C. In order to ensure the credibility of the experimental data, each temperature point has three samples. The average value of failure strength of the three samples is called adhesive strength. By observing the failure forms of all joints, it is found that the failure modes of scarf joints are cohesion failure, and the adhesive strength of 15°, 30°, 45°, 60° and 75° SJs changes with temperature, as shown in Figure 11.
As can be seen from Figure 11, with the decrease of adhesive strength with increased temperature, the change trend of adhesive strength is similar to that of the single tensile joint and the single shear joint. First, the 15° and 30° scarf joints are analyzed. They have the same characteristics: the joint is subjected mainly to shear action, and the joint strength measured at room temperature (RT) is taken as a reference, while the strength of 15° joints decreased by 25.79%, 16.96% and 89.89% with an increase in temperature to 40 °C, 60 °C and 80 °C, respectively. When the temperature drops to 0 °C, −20 °C and −40 °C, the strength of the joint increases by about 29.60%, 14.50% and 8.41%, respectively. When the temperature increases from room temperature (RT) to 40 °C, 60 °C and 80 °C, the adhesive strength of 30° joints decreases by 9.82%, 16.72% and 25.79%, respectively. When the temperature decreases from room temperature (RT) to 0°C, −20 °C and −40°C, the joint strength increases by 9.54%, 14.60% and 30.90%, respectively.
The 60° and 75° joints possess the same characteristics: the joint is subjected mainly to tensile action. Taking the joint strength tested at room temperature as a reference, when the temperature reaches 80 °C, the strength of 60° and 75° joints decreases by 21.13% and 20.50%, respectively; when the temperature decreases to −40 °C, the joint strength increases by 31.70% and 29.50%, respectively. The 45° scarf joint is subjected to the same tensile and shear loads. The joint strength tested at room temperature (RT) is taken as a reference. With the temperature rising to 40 °C, 60 °C and 80 °C, the joint strength decreases by 8.03%, 16.42% and 23.72%, respectively. When the temperature decreases to 0°C, −20°C and −40 °C, the adhesive strength increases by 10.16%, 19.88% and 31.70%, respectively. By analyzing the variation trend regarding the adhesive strength of several kinds of scarf joints and combining the strength variation rule of single lap joints and butt joints, it is found that when the temperature rises to the highest level (80 °C) and decreases to the lowest (−40 °C), the attenuation and increase of adhesive strength of the butt joint are at least 20.00% and 27.60%, respectively. It is speculated that the docking joint is the least sensitive to temperature change compared with the lap joint and the butt joint.

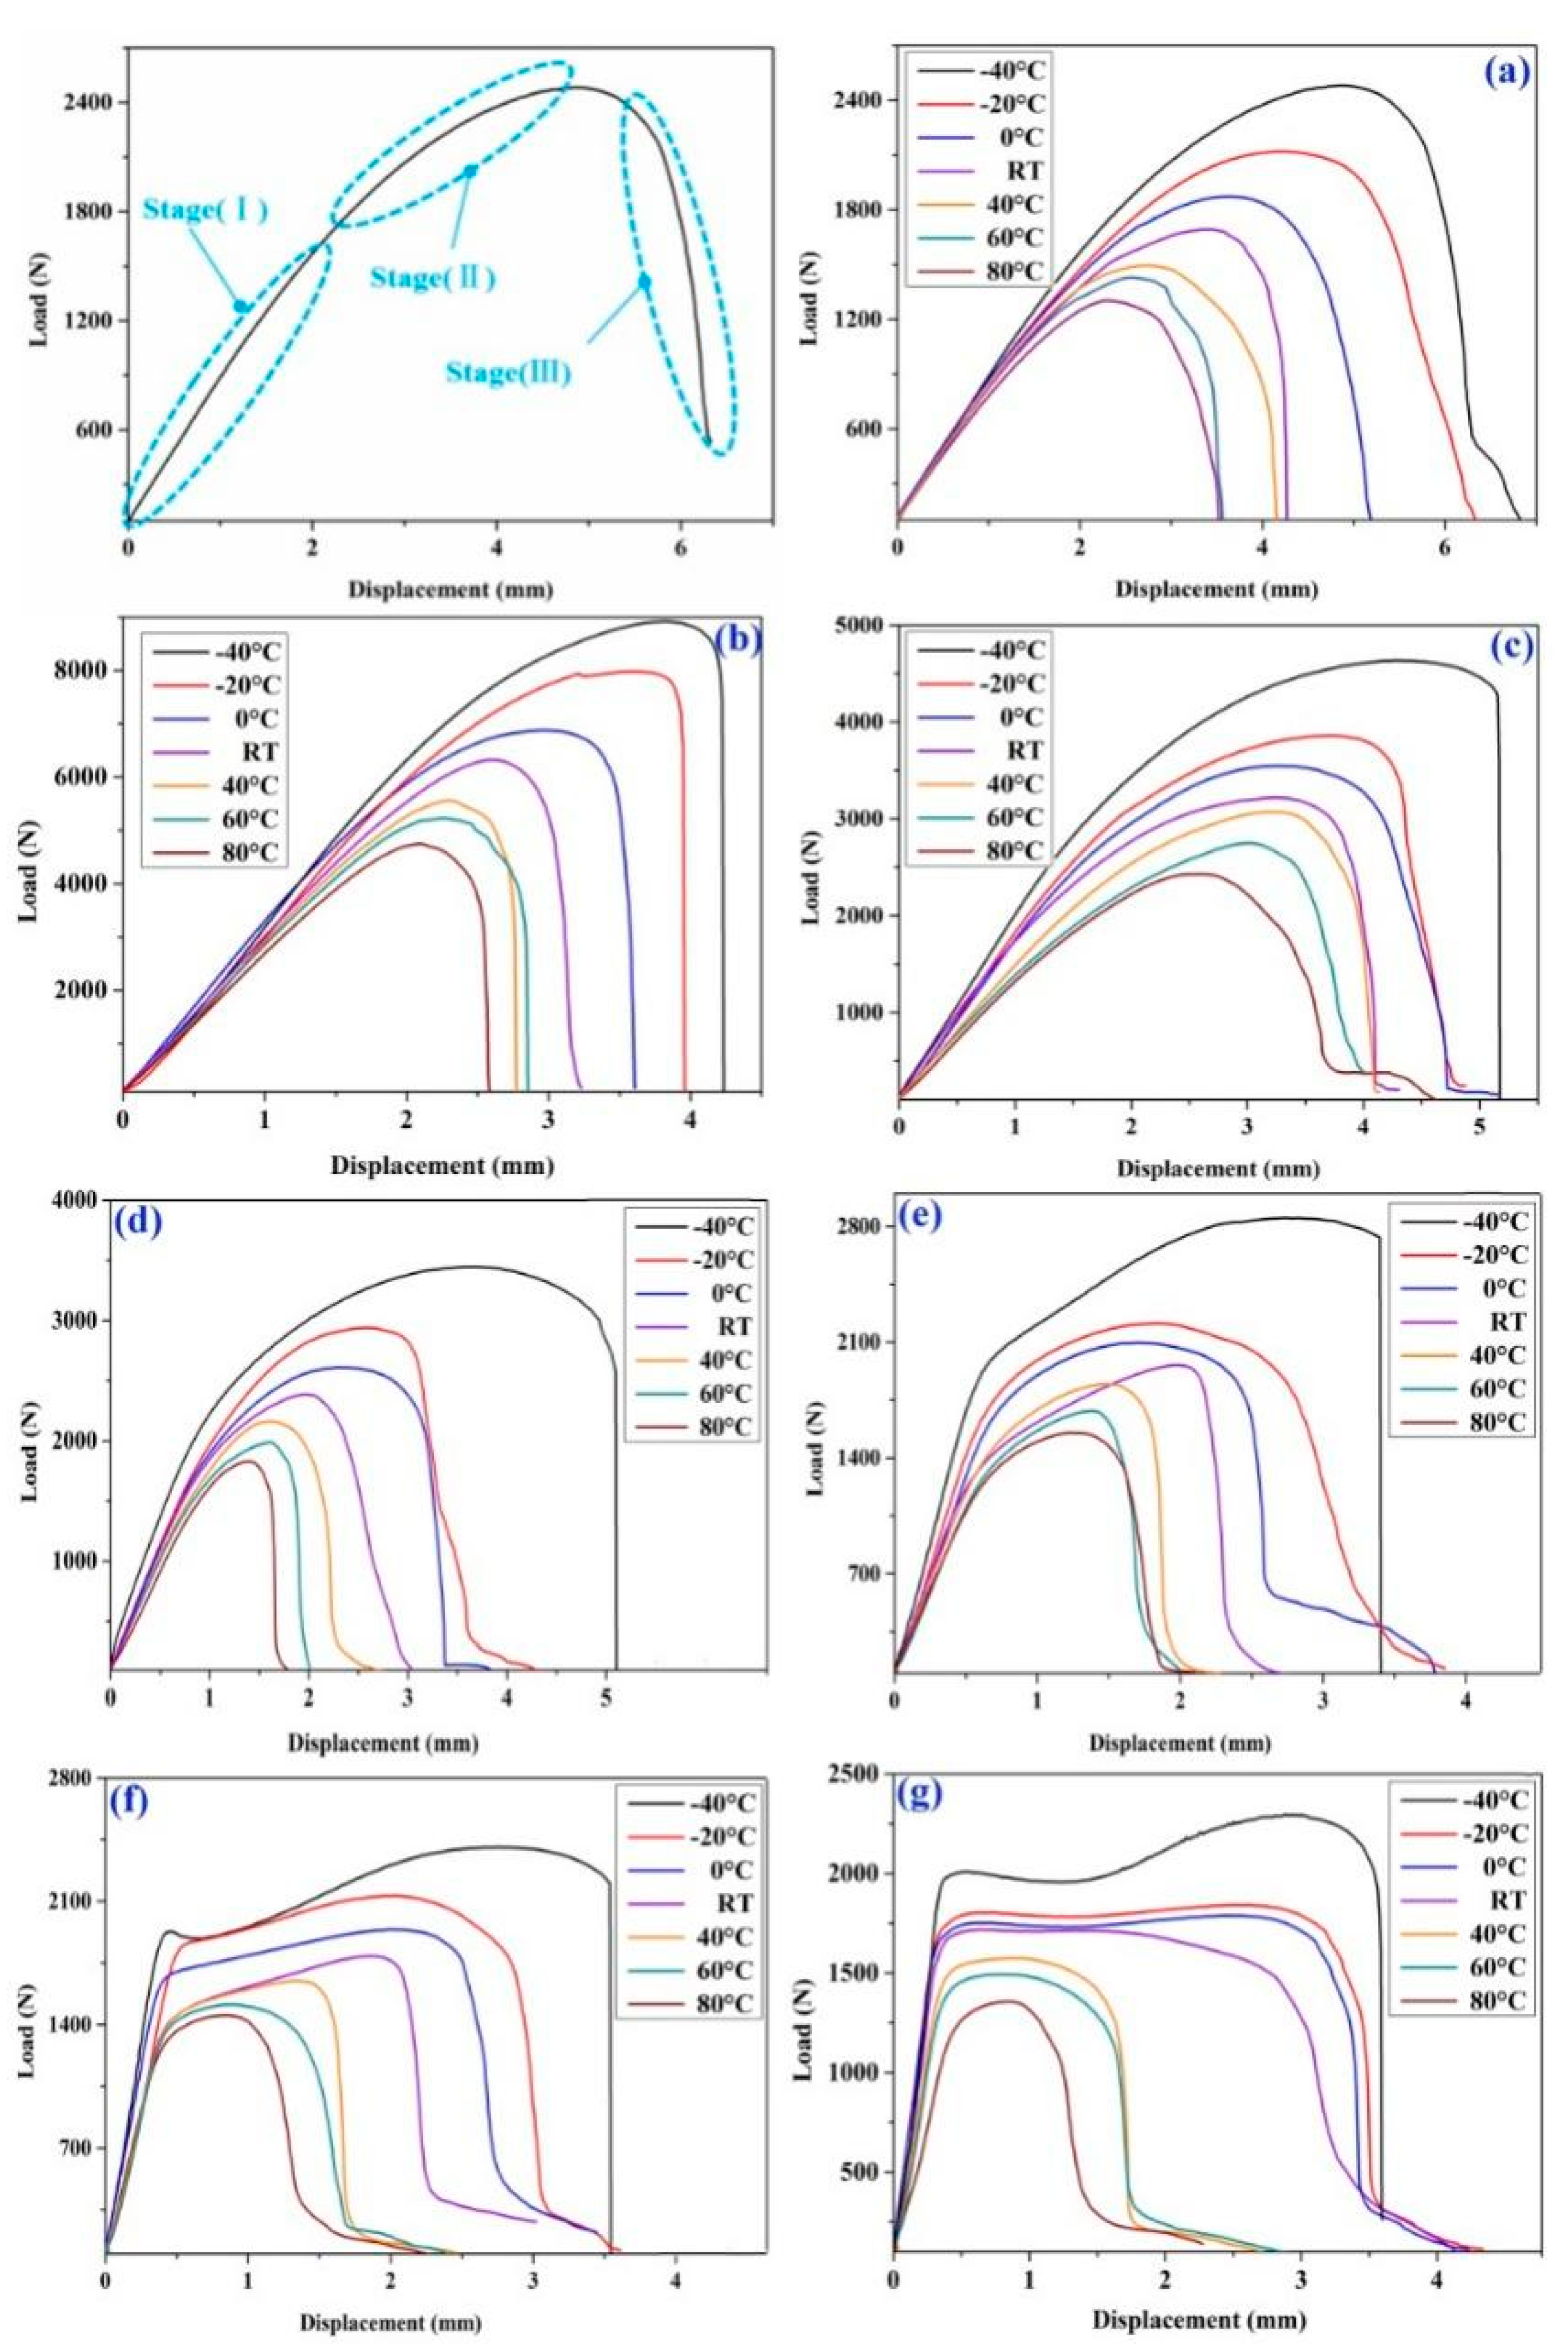
4.4. Force-Displacement Curve Comparison

Representative load-displacement curves of SLJs, 15°, 30°, 45°, 60° and 75° scarf joints and BJs as a function of temperature are shown in Figure 12. By comparing the mechanical properties of adhesive and adhesive substrate, it can be found that the elastic modulus of aluminum alloy substrate is 1.6E4 times that of adhesive. In this case, it can be considered that the deformation of adhesive joints is mainly that of the adhesive. The force-displacement curves of seven kinds of joints with different stress forms are nonlinear at all test temperature points. Furthermore, it should be noted that similar findings were obtained by I. Lubowiecka et al. [22,23,24] for flexible adhesive Terostat MS 9360. From the force-displacement curve, it can be found that the failure displacement of single lap joints, butt joints and scarf joints gradually decreases with the increase in temperature when the temperature changes from the low temperature of −40 °C to the high temperature of 80 °C. The lower the temperature, the larger the failure displacement, and vice versa. Similar findings were obtained by Mariana et al. [25] for Sikaflex-552 and Banea et al. [26] for SikaForce 7888. In addition, the slope of the force-displacement curve is weighed as the stiffness of the joint; it is found that the stiffness of the joint varies slightly with the increase in temperature, which indicates that the change of temperature affects the stiffness of the joint.
The cutoff point is 45° scarf joints with equal tensile and shear loads on the adhesive surface. Based on the SLJs and 15° and 30° scarf joints with shear load on the adhesive surface, the curve of tensile force displacement change was observed. Therefore, it was found that the curve of tensile force displacement basically presented three consecutive stages in both high and low temperature environments: I. near-linear increase; II. nonlinear variation; III. the failure phase (shown in Figure 12a). To be specific, stage I corresponds to the linear elastic behavior, because the elastic modulus of ISR-7008 adhesive is relatively low, and all the curves deviate slightly from a straight line, which is mainly due to the characteristics of the polymer itself. Polyurethane adhesive is featured with nonlinear elastic behavior and low elastic modulus, which is obviously different from the linear elasticity of the epoxy adhesive curve with high elastic modulus [12,27].
In stage II, the joint stiffness is reduced due to the yield of the adhesive, and the slight rotation of SLJs may also affect the joint stiffness during the tensile process: the change from stage I to stage II is obviously dependent on the characteristics of the joint itself, and stage III is mainly the failure and fracture of the joint, which is very important for material characterization. Because of the difference in the characteristics of the joint, the tension-displacement curve of 60° and 75° scarf joints and BJs is different from that of SLJs and 15° and 30° scarf joints, and stage I is closer to a straight line. In addition, the tensile displacement curve concerning the 75° scarf joints and BJs at the low temperature of −40 °C has a yield point that becomes less and less obvious with the increase in temperature, as shown in Figure 12f–g.

4.5. Joint Stiffness

The effect of temperature on the properties of adhesives is evaluated through the change of adhesive joint stiffness. The stiffness of SLJs, 15°, 30°, 45°, 60°, 75° scarf joints and BJs varies with temperature, as shown in Figure 13. It can be clearly seen from the diagram that temperature has a significant effect on the stiffness of the joint. With the increase in temperature, the stiffness of the joint decreases gradually, and vice versa. For SLJs, when the temperature increases from RT to 80 °C, the stiffness of the joint decreases by 8.73%, and when the temperature of the joint decreases from RT to −40°C, the stiffness of the joint increases by 3.83%. For 15°, 30°, 45°, 60° and 75° scarf joints, temperature increases from RT to 80 °C, and the joint stiffness decreases by 10.48%, 30.45%, 19.98%, 9.70% and 0.88%, respectively. When the temperature decreases from RT to −40 °C, the joint stiffness increases by 9.85%, 3.29%, 20.70%, 37.99% and 46.47%, respectively. When the temperature of BJs increases from RT to 80 °C, the stiffness of the joint decreases by 43.97%, while it increases by 8.35% from RT to −40 °C. Through the above analysis, it is found that in addition to the 15° scarf joint, the stiffness of the joint increases gradually with the increase of the specimen angle, or in other words, the greater the proportion of tensile load on the adhesive area of the joint, the greater the stiffness of the joint when the smallest SLJ stiffness appears, which can also explain this law.

4.6. Energy Absorption

The experimental results show that temperature significantly affects the adhesive strength, joint stiffness and joint failure displacement. The area surrounded by the experimental force-displacement curve of the joint is the energy absorbed in the failure process of the joint (called absorption energy). Temperature affects the fracture energy of adhesive joints in a way similar to the maximum load, or in other words, there is an ongoing reduction from low to high temperatures [28]. Temperature strongly affects the energy absorption of adhesive joints. The decrease of adhesive strength is accompanied by the decrease of energy absorption. From the absorption energy histogram, it can be seen that with the reference of room temperature (RT), the fracture energy of all joints decreases with the increase in temperature, and that of all joints increases with the decrease in temperature, as shown in Figure 14. When the temperature of SLJs increases from RT to 40 °C, 60 °C and 80 °C, the fracture energy decreases from 4.811/J to 4.114/J, 3.292/J and 2.882/J, respectively, and when the temperature decreases from RT to 0 °C, −20 °C and −40 °C, the fracture energy increases to 6.46/J, 8.767/J and 10.836/J, with an increase of 34.276%, 82.23% and 125.23%, respectively.
When the temperature of 15°, 30°, 45°, 60° and 75° scarf joints rises to 80 °C, the fracture energy of the joint decreases from 12.282/J, 8.063/J, 4.432/J, 3.328/J and 3.078/J to 7.513/J, 5.363/J, 1.899/J, 1.886/J and 1.505/J, respectively, and the attenuation rates are 38.83%, 33.49%, 57.15%, 43.33% and 51.10%, respectively. When the temperature drops to −40 °C, the fracture energy of the joint increases to 24.103/J, 17.368/J, 13.919/J, 7.806/J and 7.213/J, respectively, and the growth rates are 96.25%, 115.40%, 214.06%, 134.56% and 134.34%, respectively. In this case, it is found that the fracture energy of 45° scarf joints at the high temperature of 80 °C decreases the most, while the fracture energy of −40 °C joints increases to the greatest extent. The effect of temperature on the fracture energy of BJs is similar to that of other joints. When the temperature decreases to 0 °C, −20 °C and −40 °C, the fracture energy increases from 4.602/J to 5.245/J, 5.803/J and 7.479/J, respectively, or has an increase of 13.97%, 26.10% and 62.52%. When the temperature rises to 40 °C, 60 °C and 80 °C, the fracture energy decreases to 1.441/J, 2.031/J and 2.301/J, respectively; that is to say, 5.0%, 55.87% and 68.69%. Through the analysis of seven different stress forms of joints, it is found that the fracture energy of BJs is specially affected by temperature; the fracture energy attenuation at the high temperature of 80 °C is the largest, and the fracture energy at the low temperature of −40 °C increases the least.

4.7. Failure Criterion Surface of Adhesive Joint

In order to predict the failure behavior of adhesive joints, realize safety design, and provide further reference and guidance for the practical application of adhesive structures in the automotive industry, it is necessary to establish reasonable failure criteria. The secondary stress criterion is widely used to predict the failure of adhesive joints, and its expressions are shown as Equation (2).
( σ N ) 2 + ( τ S ) 2 = 1
With tangential shear stress τ as the abscissa and normal stress σ as the ordinate, a coordinate system of adhesive positive shear stress was built. According to the experimental data shown in Table 4, Table 5, Table 6, Table 7, Table 8, Table 9 and Table 10, the least square method was adopted to fit the secondary stress failure criterion curve of adhesive joints at different temperatures (as shown in Figure 15). It can be seen from the figure that with the increase in temperature, the range between the failure criterion curve and the coordinate axis of the adhesive joint is gradually reduced, which indicates that the adhesive joint is more likely to be destroyed at high temperature. The parameter values ( N ,   S ) and corresponding goodness of fit (R2) of the failure criterion formula at seven test temperatures are shown in Table 12.
The parameters ( N ,   S ) in the failure criterion formula under different temperature conditions were extracted, the change law was fitted by the exponential function (0.9241 and 0.9827, respectively) according to their change characteristics with temperature, and Equations (3) and (4) were obtained as follows. When Equations (3) and (4) are brought in Equation (5), the failure criterion formula of the adhesive joint under the condition of the full temperature field is obtained.
N = 2.07 + 0.82 × 0.98 T
S = 1.26 + 1.85 × 0.99 T
( σ 2.07 + 0.82 × 0.98 T ) 2 + ( τ 1.26 + 1.85 × 0.99 T ) 2 = 1
where T represents any temperature value between −40 °C and 80 °C. When the ambient temperature is brought into Equations (3) and (4), the failure criterion of adhesive joints at this temperature can be obtained, which provides the basis for the failure prediction of the adhesive structure. In order to reflect the variation of failure criterion with temperature more intuitively, the failure criterion surface of adhesive joints is established by MATLAB software, as shown in Figure 16. Therefore, it can be seen that with the increase in temperature, the failure criteria of adhesive joints shrink gradually.

5. Conclusions

In this paper, the influence of ambient temperature on the mechanical properties and joint strength of the adhesive body was studied, and the failure criterion surface under the full temperature field was also established. The specific research content is summarized as follows:
  • The effect of ambient temperature on the mechanical properties of ISR-7008 adhesive was studied. The results show that the Young’s modulus, tensile strength and failure strain of the adhesive decrease with the increase in temperature.
  • Quasi-static tensile tests were carried out on lap joints, scarf joints (15°, 30°, 45°, 60° and 75°) and butt joints at different temperatures. The results show that the strength of the joint decreases with the increase in temperature. Compared with lap joints and scarf joints, the strength of butt joints is the least sensitive to the change in temperature. With the increase of the adhesive angle, the stiffness of the joint increases gradually, while with the increase in temperature, the stiffness of all the tested joints decreases gradually. At the same time, with the increase in temperature, the failure displacement and energy absorbed by the joint also witness a downward trend.
  • Based on the experimental data, the secondary stress failure criteria of adhesive joints at different temperatures are obtained. Considering this, the surface function of failure criteria under the full temperature field environment is proposed, which provides a reference for the failure prediction of adhesive structures under different temperatures and complex stress conditions.

Author Contributions

Conceptualization, Y.F.; methodology, H.L.; writing—original draft preparation, Y.F.; writing—review and editing, Y.F.; project administration, H.P.; funding acquisition, Y.F. All authors have read and agreed to the published version of the manuscript.

Funding

This research was funded by the Science and Technology Project of Henan Province, grant number 202102210044.

Data Availability Statement

The datasets analyzed during the current study are available from the corresponding author on reasonable request.

Conflicts of Interest

The authors declare no conflict of interest.

References

  1. Li, Y. Advances in Welding and Joining Processes of Multi-material Lightweight Car Body. Chin. J. Mech. Eng. 2016, 52, 1–23. [Google Scholar] [CrossRef]
  2. Lai, W.-J.; Pan, J. Failure mode and fatigue behavior of weld-bonded lap-shear specimens of magnesium and steel sheets. Int. J. Fatigue 2015, 75, 184–197. [Google Scholar] [CrossRef] [Green Version]
  3. Sakundarini, N.S.; Taha, Z.; Abdul-rashid, S.H.; Ghazila, R.A. Optimal multi-material selection for lightweight design of automotive body assembly incorporating recyclability. Mater. Des. 2013, 50, 846–857. [Google Scholar] [CrossRef]
  4. Banea, M.; Rosioara, M.; Carbas, R.; da Silva, L. Multi-material adhesive joints for automotive industry. Compos. Part B Eng. 2018, 151, 71–77. [Google Scholar] [CrossRef]
  5. Sousa, J.; Correia, J.; Gonilha, J.; Cabral-Fonseca, S.; Firmo, J.; Keller, T. Durability of adhesively bonded joints between pultruded GFRP adherends under hygrothermal and natural ageing. Compos. Part B Eng. 2019, 158, 475–488. [Google Scholar] [CrossRef]
  6. Banea, M.D.; De Sousa, F.S.M.; Da Silva, L.; Campilho, R.D.S.G.; De Pereira, A.M.B. Effects of Temperature and Loading Rate on the Mechanical Properties of a High Temperature Epoxy Adhesive. J. Adhes. Sci. Technol. 2011, 25, 2461–2474. [Google Scholar] [CrossRef]
  7. Kang, S.-G.; Kim, M.-G.; Kim, C.-G. Evaluation of cryogenic performance of adhesives using composite–aluminum double-lap joints. Compos. Struct. 2007, 78, 440–446. [Google Scholar] [CrossRef]
  8. Fan, Y.; Shangguan, L.; Zhang, M.; Peng, H.; Na, J. Effect of cyclic hygrothermal aging on mechanical behaviours of adhesive bonded aluminum joints. J. Adhes. Sci. Technol. 2021, 35, 199–219. [Google Scholar] [CrossRef]
  9. Banea, M.D.; Da Silva, L.; Campilho, R. Effect of Temperature on Tensile Strength and Mode I Fracture Toughness of a High Temperature Epoxy Adhesive. J. Adhes. Sci. Technol. 2012, 26, 939–953. [Google Scholar] [CrossRef]
  10. Viana, G.; Costa, M.; Banea, M.D.; Da Silva, L. A review on the temperature and moisture degradation of adhesive joints. Proc. Inst. Mech. Eng. Part L J. Mater. Des. Appl. 2017, 231, 488–501. [Google Scholar] [CrossRef]
  11. Grant, L.; Adams, R.; Da Silva, L.F. Effect of the temperature on the strength of adhesively bonded single lap and T joints for the automotive industry. Int. J. Adhes. Adhes. 2009, 29, 535–542. [Google Scholar] [CrossRef]
  12. Banea, M.D.; Da Silva, L.F.M. The effect of temperature on the mechanical properties of adhesives for the automotive industry. Proc. Inst. Mech. Eng. Part L J. Mater. Des. Appl. 2010, 224, 51–62. [Google Scholar] [CrossRef]
  13. Marques, E.; Da Silva, L.F.M.; Banea, M.D.; Carbas, R.J.C. Adhesive Joints for Low- and High-Temperature Use: An Overview. J. Adhes. 2014, 91, 556–585. [Google Scholar] [CrossRef]
  14. Adams, R.; Coppendale, J.; Mallick, V.; Al-Hamdan, H. The effect of temperature on the strength of adhesive joints. Int. J. Adhes. Adhes. 1992, 12, 185–190. [Google Scholar] [CrossRef]
  15. Na, J.; Mu, W.; Qin, G.; Tan, W.; Pu, L. Effect of temperature on the mechanical properties of adhesively bonded basalt FRP-aluminum alloy joints in the automotive industry. Int. J. Adhes. Adhes. 2018, 85, 138–148. [Google Scholar] [CrossRef]
  16. Tan, W.; Na, J.X.; Mu, W.L.; Shen, H.; Qin, G. Effect of service temperature on static failure of BFRP/aluminum alloy adhesive joints. J. Traffic Transp. Eng. 2020, 20, 171–180. [Google Scholar]
  17. Da Silva, L.F.; Adams, R.; Gibbs, M. Manufacture of adhesive joints and bulk specimens with high-temperature adhesives. Int. J. Adhes. Adhes. 2004, 24, 69–83. [Google Scholar] [CrossRef]
  18. Zhang, Y.; Vassilopoulos, A.; Keller, T. Effects of low and high temperatures on tensile behavior of adhesively-bonded GFRP joints. Compos. Struct. 2010, 92, 1631–1639. [Google Scholar] [CrossRef]
  19. Pascal, J.; DarqueCeretti, E.; Felder, E.; Pouchelon, A. Rubber-like adhesive in simple shear: Stress analysis and fracture mor-phology of a single lap joint. J. Adhes. Sci. Technol. 1994, 8, 553–573. [Google Scholar] [CrossRef]
  20. Hu, P.; Han, X.; Li, W.D. Research on the static strength performance of adhesive single lap joints subjected to extreme tem-perature environment for automotive industry. Int. J. Adhes. Adhes. 2013, 41, 119–126. [Google Scholar] [CrossRef]
  21. Banea, M.D.; Silva, L.F.M.D. Static and fatigue behaviour of room temperature vulcanising silicone adhesives for high tem-perature aerospace applications. Mater. Werkst. 2010, 41, 325–335. [Google Scholar] [CrossRef]
  22. Lubowiecka, I.; Rodríguez, M.; Rodriguez, E.; Martinez, D. Experimentation, material modelling and simulation of bonded joints with a flexible adhesive. Int. J. Adhes. Adhes. 2012, 37, 56–64. [Google Scholar] [CrossRef]
  23. Da Silva, L.F.; Carbas, R.; Critchlow, G.; Figueiredo, M.; Brown, K. Effect of material, geometry, surface treatment and environment on the shear strength of single lap joints. Int. J. Adhes. Adhes. 2009, 29, 621–632. [Google Scholar] [CrossRef] [Green Version]
  24. Karachalios, E.; Adams, R.; da Silva, L.F. Single lap joints loaded in tension with ductile steel adherends. Int. J. Adhes. Adhes. 2013, 43, 96–108. [Google Scholar] [CrossRef]
  25. Banea, M.D.; Silva, L.F.M.D. Mechanical Characterization of Flexible Adhesives. J. Adhes. 2009, 85, 261–285. [Google Scholar] [CrossRef]
  26. Banea, M.D.; Silva, L.F.M.D.; Campilho, R.D.S.G. The Effect of Adhesive Thickness on the Mechanical Behaviour of a Structural Polyurethane Adhesive. J. Adhes. 2015, 91, 331–346. [Google Scholar] [CrossRef]
  27. Loureiro, A.L.; Da Silva, L.F.M.; Sato, C.; Figueiredo, M.A.V. Comparison of the Mechanical Behaviour Between Stiff and Flexible Adhesive Joints for the Automotive Industry. J. Adhes. 2010, 86, 765–787. [Google Scholar] [CrossRef]
  28. Moroni, F.; Pirondi, A.; Kleiner, F. Experimental analysis and comparison of the strength of simple and hybrid structural joints. Int. J. Adhes. Adhes. 2010, 30, 367–379. [Google Scholar] [CrossRef]
Figure 1. Orientation of stress vectors within adhesive of scarf joints.
Crystals 11 00657 g001
Figure 2. Schematic diagram of docking and lap joints (mm).
Crystals 11 00657 g002
Figure 3. Schematic diagram of 15°, 30°, 45°, 60° and 75° scarf joints (mm).
Crystals 11 00657 g003
Figure 4. (a) Forming mold. (b) Dumbbell sample.
Crystals 11 00657 g004
Figure 5. Adhesion fixture for docking and scarf specimens.
Crystals 11 00657 g005
Figure 6. Diagram of lateral fastening jig (left) and gantry clamping jig (right).
Crystals 11 00657 g006
Figure 7. High- and low-temperature hygrothermal cycle experimental chamber.
Crystals 11 00657 g007
Figure 8. VIC-3D measurement system.
Crystals 11 00657 g008
Figure 9. Stress-strain curve of adhesive.
Crystals 11 00657 g009
Figure 10. Average SLJ and BJ strength as a function of temperature.
Crystals 11 00657 g010
Figure 11. Average 15°, 30°, 45°, 60°, 75° SJ strength as a function of temperature.
Crystals 11 00657 g011
Figure 12. Load-displacement curves: (a) SLJ; (b) 15° SJ; (c) 30° SJ; (d) 45° SJ; (e) 60° SJ; (f) 75° SJ; (g) BJ.
Crystals 11 00657 g012
Figure 13. Column diagram of joint stiffness varying with temperature.
Crystals 11 00657 g013
Figure 14. Joint energy absorption histogram as a function of temperature.
Crystals 11 00657 g014
Figure 15. Failure criterion curves of adhesive joints at different temperatures.
Crystals 11 00657 g015
Figure 16. ISR-7008 adhesive joint failure criterion surface.
Crystals 11 00657 g016
Table 1. Mechanical property parameters of adhesive and adhesive substrate.
Material AttributeISR-70086005A Aluminum Alloy
Young’s modulus (MPa)4.371,000
Poisson’s ratio0.440.33
Density (kg/m3)14002730
Table 2. Technical performance parameters of ISR-7008 adhesive.
PerformanceISR-7008
Tensile failure strength (MPa)2.9
Shear failure strength (MPa)2.5
Extension at break curing condition225%
Curing conditions (T/RH)20 °C/50%RH
Curing rate (mm/24 h)3
Glass transition temperature (°C)−59 °C
Table 3. Experimental test data of seven groups of adhesive specimens at different angles.
Temperature
(°C)
Adhesive
Angle (°)
Strength (MPa)Average Strength
(MPa)
ST
(%)
CV
(%)
Failure
Mode
No. 1No. 2No. 3No. 4No. 5
80902.272.152.192.232.212.214.472.03CF
752.112.322.292.032.052.1613.606.30CF
601.982.112.052.22.112.098.153.90CF
452.121.961.972.232.172.0912.065.77CF
302.112.081.932.052.232.0810.825.20CF
152.102.252.281.872.002.1017.168.17CF
01.982.232.052.012.232.1012.125.77CF
60902.222.452.542.282.362.3712.855.42CF
752.262.502.382.492.372.409.874.11CF
601.982.112.052.202.112.3014.026.09CF
452.092.352.242.372.402.2912.715.55CF
302.112.132.322.402.492.2916.667.27CF
152.242.312.462.502.242.3512.285.23CF
02.482.442.312.292.532.4110.564.38CF
40902.402.572.642.732.562.5812.144.70CF
752.632.542.412.702.472.5511.734.60CF
602.602.612.572.362.462.5210.754.26CF
452.422.352.562.662.612.5213.085.18CF
302.512.442.602.382.472.488.213.31CF
152.362.482.582.562.772.5515.035.89CF
02.642.532.662.472.702.609.623.70CF
RT902.762.612.992.932.612.7817.666.35CF
752.662.822.572.832.622.7011.854.39CF
602.562.482.822.772.622.6514.255.38CF
452.78NA2.642.612.932.7414.675.35CF
302.562.622.872.912.792.7515.385.59CF
153.012.922.692.70NA2.8316.025.66CF
03.012.873.122.782.522.8611.423.99CF
0903.012.772.952.823.002.919.653.74CF
603.043.132.992.752.692.9214.066.52CF
452.902.783.123.203.253.0516.796.61CF
302.882.982.903.173.273.0411.455.66CF
753.013.083.132.852.832.9810.574.53CF
153.113.033.003.063.253.094.063.18CF
02.813.203.033.343.223.1219.786.59CF
−20903.203.113.052.783.013.0315.705.18CF
752.963.113.232.923.233.0914.614.72CF
603.113.212.972.853.163.0614.764.82CF
453.233.513.373.293.703.4218.845.51CF
303.013.073.333.423.273.2217.465.41CF
153.223.443.193.503.203.3114.794.47CF
03.673.553.293.343.703.5118.745.43CF
−40903.683.923.844.023.743.8413.643.55CF
753.823.773.903.913.753.837.311.91CF
604.043.903.783.823.863.8810.002.58CF
454.324.183.993.843.724.0124.416.08CF
303.843.993.724.134.223.9820.455.14CF
154.124.034.213.873.874.0215.093.75CF
03.894.164.233.873.904.0117.104.26CF
Table 4. Failure strength values of seven groups of adhesive specimens at different angles at −40 °C.
Adhesive Angle (°C)0153045607590
Average failure load (N)2400 8893 4683 3445 2814 2573 2458
Adhesive area (mm2)62523221207859707640613
Normal stress (MPa)0.001.041.992.833.363.703.84
Shear stress (MPa)4.013.883.452.831.940.990.00
Table 5. Failure strength values of seven groups of adhesive specimens at different angles at −20 °C.
Adhesive Angle (°C) 0153045607590
Average failure load (N)1894 7175 3693 2938 2277 2118 2152
Adhesive area (mm2)62523221207859707640613
Normal stress (MPa)0.000.861.612.222.652.983.04
Shear stress (MPa)3.513.202.792.221.530.800.00
Table 6. Failure strength values of seven groups of adhesive specimens at different angles at 0 °C.
Adhesive Angle (°C) 0153045607590
Average failure load (N)1819692035242620214919781913
Adhesive area (mm2)62523221207859707640613
Normal stress (MPa)0.000.801.522.162.532.882.91
Shear stress (MPa)3.122.982.632.161.460.770.00
Table 7. Failure strength values of seven groups of adhesive specimens at different angles at 25 °C.
Adhesive Angle (°C) 0153045607590
Average failure load (N)1738 6269 3199 2354 1944 1811 1753
Adhesive area (mm2)62523221207859707640613
Normal stress (MPa)0.000.731.371.942.292.612.78
Shear stress (MPa)2.862.732.381.941.330.700.00
Table 8. Failure strength values of seven groups of adhesive specimens at different angles at 40 °C.
Adhesive Angle (°C) 0153045607590
Average failure load (N)1613 5921 3042 2165 1753 1632 1594
Adhesive area (mm2)62523221207859707640613
Normal stress (MPa)0.000.661.241.782.182.462.58
Shear stress (MPa)2.502.432.151.781.260.660.00
Table 9. Failure strength values of seven groups of adhesive specimens at different angles at 60 °C.
Adhesive Angle (°C) 0153045607590
Average failure load (N)1481 5573 2776 1967 1619 1504 1477
Adhesive area (mm2)62523221207859707640613
Normal stress (MPa)0.000.611.151.621.992.322.37
Shear stress (MPa)2.452.271.981.621.150.620.00
Table 10. Failure strength values of seven groups of adhesive specimens at different angles at 80 °C.
Adhesive Angle (°C) 0153045607590
Average failure load (N)1381 5016 2523 1795 1471 1344 1287
Adhesive area (mm2)62523221207859707640613
Normal stress (MPa)0.000.541.031.481.802.092.21
Shear stress (MPa)2.092.031.801.481.040.560.00
Table 11. Young’s modulus, tensile strength and failure strain of adhesives at −40 °C, RT and 80 °C.
Temperature (°C)Young’s Modulus (MPa)Tensile Strength (MPa)Failure Strain
−4011.8 ± 1.616.5 ± 0.195.2 ± 0.23
RT5.0 ± 0.273.4 ± 0.134.2 ± 0.18
802.9 ± 0.242.07 ± 0.103.72 ± 0.11
Table 12. Parameters of failure criteria and corresponding goodness of fit at seven temperatures.
Temperature (°C) NSR2
−403.84434.03370.9948
−203.01423.39140.9838
02.92963.10550.9903
252.70422.81390.9819
402.55492.49210.9919
602.34592.35580.9709
802.16392.06950.9791
Publisher’s Note: MDPI stays neutral with regard to jurisdictional claims in published maps and institutional affiliations.

