Article

Preparation of Magnesia Partially Stabilized Zirconia Nanomaterials from Zirconium Hydroxide and Magnesium Carbonate Precursors Using PEG as a Template

Center for Ceramics, Ministry of Industry of Indonesia, Jl. Ahmad Yani 392, Bandung 40272, Indonesia
*
Authors to whom correspondence should be addressed.
Crystals 2021, 11(6), 635; https://doi.org/10.3390/cryst11060635
Submission received: 31 March 2021 / Revised: 27 May 2021 / Accepted: 29 May 2021 / Published: 1 June 2021

Abstract

:
Stabilized zirconia is a promising material due to its great physical and chemical properties, and thermal stability. In this work, MgO was used as a stabilizer in ZrO2 to obtain Magnesia Partially Stabilized Zirconia (MSZ) nanomaterials assisted with PEG as a template through conventional mixing process. Zirconium hydroxides prepared from local zircon and MgCO3 were used as MSZ precursors. Meanwhile, the stabilizer concentration was varied from 1 to 4 wt% of ZrO2. The effect of the stabilizer concentration and the calcination temperature to the crystallinity and the morphological properties of the MSZ nanoparticles were studied using X-ray diffraction and scanning and transmission electron microscopy. The ZrO2 content in the zirconium hydroxides precursors is accounting 89.52 wt% of the total and exhibits the dominant m-phase at 1000 °C. Meanwhile, the tetragonal and the monoclinic phases were formed in all MSZ samples at a temperature of 800–1000 °C. The as-synthesized MSZ samples show typical FT-IR spectra, consisting of the metal–oxygen bonds at below 500 cm−1 and the organic functional groups ranging at 1000–3000 cm−1. The ZrO2 morphologies exhibit spherical-like shapes with elongated agglomeration at 800 °C. In addition, the average particle sizes of the final product ranges from 20 to 50 nm. At a sintering temperature of 1500 °C, MSZ samples show the monoclinic phase of ZrO2 and densities in the range of 3.95–4.14 g/cm3.

1. Introduction

Zirconia is a promising material with unique properties. It has great chemical and thermal stability, excellent flexural strength, and good wear resistance. Zirconia is mainly used in some fields such as biomaterials, refractories, high-strength tools, solid oxide fuel cells (SOFCs), thermal barrier coating, and also catalysis [1]. Zirconia has three crystalline forms: The monoclinic, the tetragonal, and the cubic [2]. The monoclinic phase is the most stable phase under room temperature. Transformation of the monoclinic to the tetragonal phases occurs around 1170 °C in heating and 800 °C in cooling, resulting in volume change and a shear strain of ~4% and ~0.16%, respectively [3]. The monoclinic zirconia has no practical application due to its volume expansion, which presents a crumbling of the ceramic component [4]. Various studies attempted to prevent this transformation. The tetragonal and the cubic phases have to be stabilized at a lower temperature. Stabilized zirconia can be obtained by adding stabilizers such as Yttria (Y2O3), Calcia (CaO), Magnesia (MgO), and Ceria (CeO2) [5,6,7,8].
In this work, MgO was doped into ZrO2 to obtain Magnesia Partially Stabilized Ziconia (MSZ), which consists of two or more phases as sediments. The most commonly used techniques for preparing magnesia-zirconia ceramics are spray pyrolysis, plasma spray, sol-gel, precipitation, and co-precipitation [9].
Previous studies showed that some types of precursors had been successfully used to present stabilized zirconia with great properties. For instance, a zirconium salt such as zirconyl chloride was used as a precursor for the preparation of ZrO2-MgO systems [7,8,10,11]. A metal organic compound such as zirconium-propoxide was also used as a precursor in the synthesis of magnesia stabilized ZrO2 nanoparticles [12]. In addition to pure MgO, the other materials used as MgO precursors were Mg(NO3)3 [10,12] and MgCl2 [13,14]. In order to synthesize material oxides with unique microstructures such as nanoscales or one-, two, and three-dimension structures, some organic compounds are applied as a dispersing agent or a structure-directing template during synthesis [15,16,17]. Previously, Riaz et al. and Septawendar et al. synthesized stabilized ZrO2 nano particles using sugar as a template, for instance [16,17]. The other organic compounds used as templates were polymers such as polyvinyl alcohol (PVA), polyethylene glycol (PEG), and polyvinyl pyrrolidone (PVP) [15,18,19,20]. All the organic polymer templates were used as 1-D directing templates to synthesize ZrO2 nanorods [15,18,19] and nanofibers [20].
To the best of our knowledge, there has been no report on the synthesis of magnesia partially stabilized zirconia (MSZ) from zirconium hydroxides derived from the local zircon. Thus, the present paper reports on the synthesis of MSZ nanomaterials from local zircon-based zirconium hydroxides and MgCO3 precursors and PEG as a template via a conventional mixing process. This study aims to evaluate the characteristics of the resulting MSZ, including infrared spectra of the as-synthesized MSZ, mineral phase transformation, and microstructures. In addition, the effect of stabilizer concentration on the ZrO2 phase transformation at elevated temperatures was also studied with respect to the characteristics of the resulting ZrO2.

2. Materials and Methods

2.1. Materials

In this study, the ZrO2 precursor used was local zircon-based zirconium hydroxides (exhibiting pH 5 and containing 15 wt% ZrO2). Meanwhile, the materials used were MgCO3, a 12.5% NH4OH solution, and PEG-6000. All materials were used without further purification. The laboratory apparatus used in this study was a dual-speed mixer with the maximum speed of 2000 rpm and an electric furnace with the maximum temperature of 1700 °C. Meanwhile, the instruments used for the material characterization were an X-ray fluorescence system, an X-ray diffractometer, a FT-IR Spectrophotometer, a Scanning Electron Microscope, and a Transmission Electron Microscope.

2.2. Synthesis of MSZ

The zirconium hydroxide precursor was initially calcined at 1000 °C and was then characterized by X-ray Fluorescence to investigate the purity of the resulting ZrO2 and X-ray diffractometer to study the mineralogy characteristic of the calcined precursor. The synthesis of MSZ was started by preparing a single component of zirconia and magnesia separately from the respective zirconium hydroxides and MgCO3 precursors with the varied MgO concentration such as 1, 2, and 4 wt% of the ZrO2. Thus, the samples were labeled as 1MSZ, 2MSZ, and 4MSZ. A proper amount of zirconium hydroxides was dissolved in aquadest and followed by stirring at a constant rate. Then, the calculated portion of the MgCO3 solution was also prepared. The MgO precursor solution was added into the ZrO2 precursor solution under vigorous stirring. The PEG solution with a concentration of 20 wt% of the ZrO2 was then added into the MSZ precursor solution and thoroughly stirred. The pH of the solution mixture was adjusted to pH 8 by adding a 12.5% (v/v) NH4OH solution. The precipitated product and liquid were separated by decantation and filtration. The precipitates were dried in an oven at 80 °C and then calcined at 600 °C, 800 °C, and 1000 °C. However, the as-synthesized MSZ samples were initially characterized by the FT-IR method. The characteristics of the calcined products were then figured out including their mineral phases and microstructures. The as-synthesized MSZ samples were also sintered at 1500 °C to appraise further ZrO2 characteristics including phase transformation, density, porosity, and water adsorption. The standard method of ASTM C-20 was used to measure the density, water adsorption, and porosity of the sintered MSZ samples.

2.3. Characterization

Typical FT-IR spectra of the as-synthesized MSZ samples were acquired using a Prestige 21 Shimadzu FT-IR Spectrophotometer with an attenuated total reflection (ATR) module and a monochromatic Al Kα (1486.6 eV) source under operation at 12 kV and 3 mA (K-alpha, Thermo VG), respectively. Meanwhile, a Bruker D8 Advance X-ray diffractometer was used to collect diffraction data of all calcined MSZ samples at 40 kV, 40 mA with a Cu/Kα (λ = 1.54060 A) radiation source. The diffraction patterns were scanned from 10.00 to 90.00 (2θ) with a step size of 0.020. A JEOL-JSM-IT300LV SEM and a JEM-1400 120 kV TEM were utilized to recognize the microstructures of all calcined MSZ.

3. Results

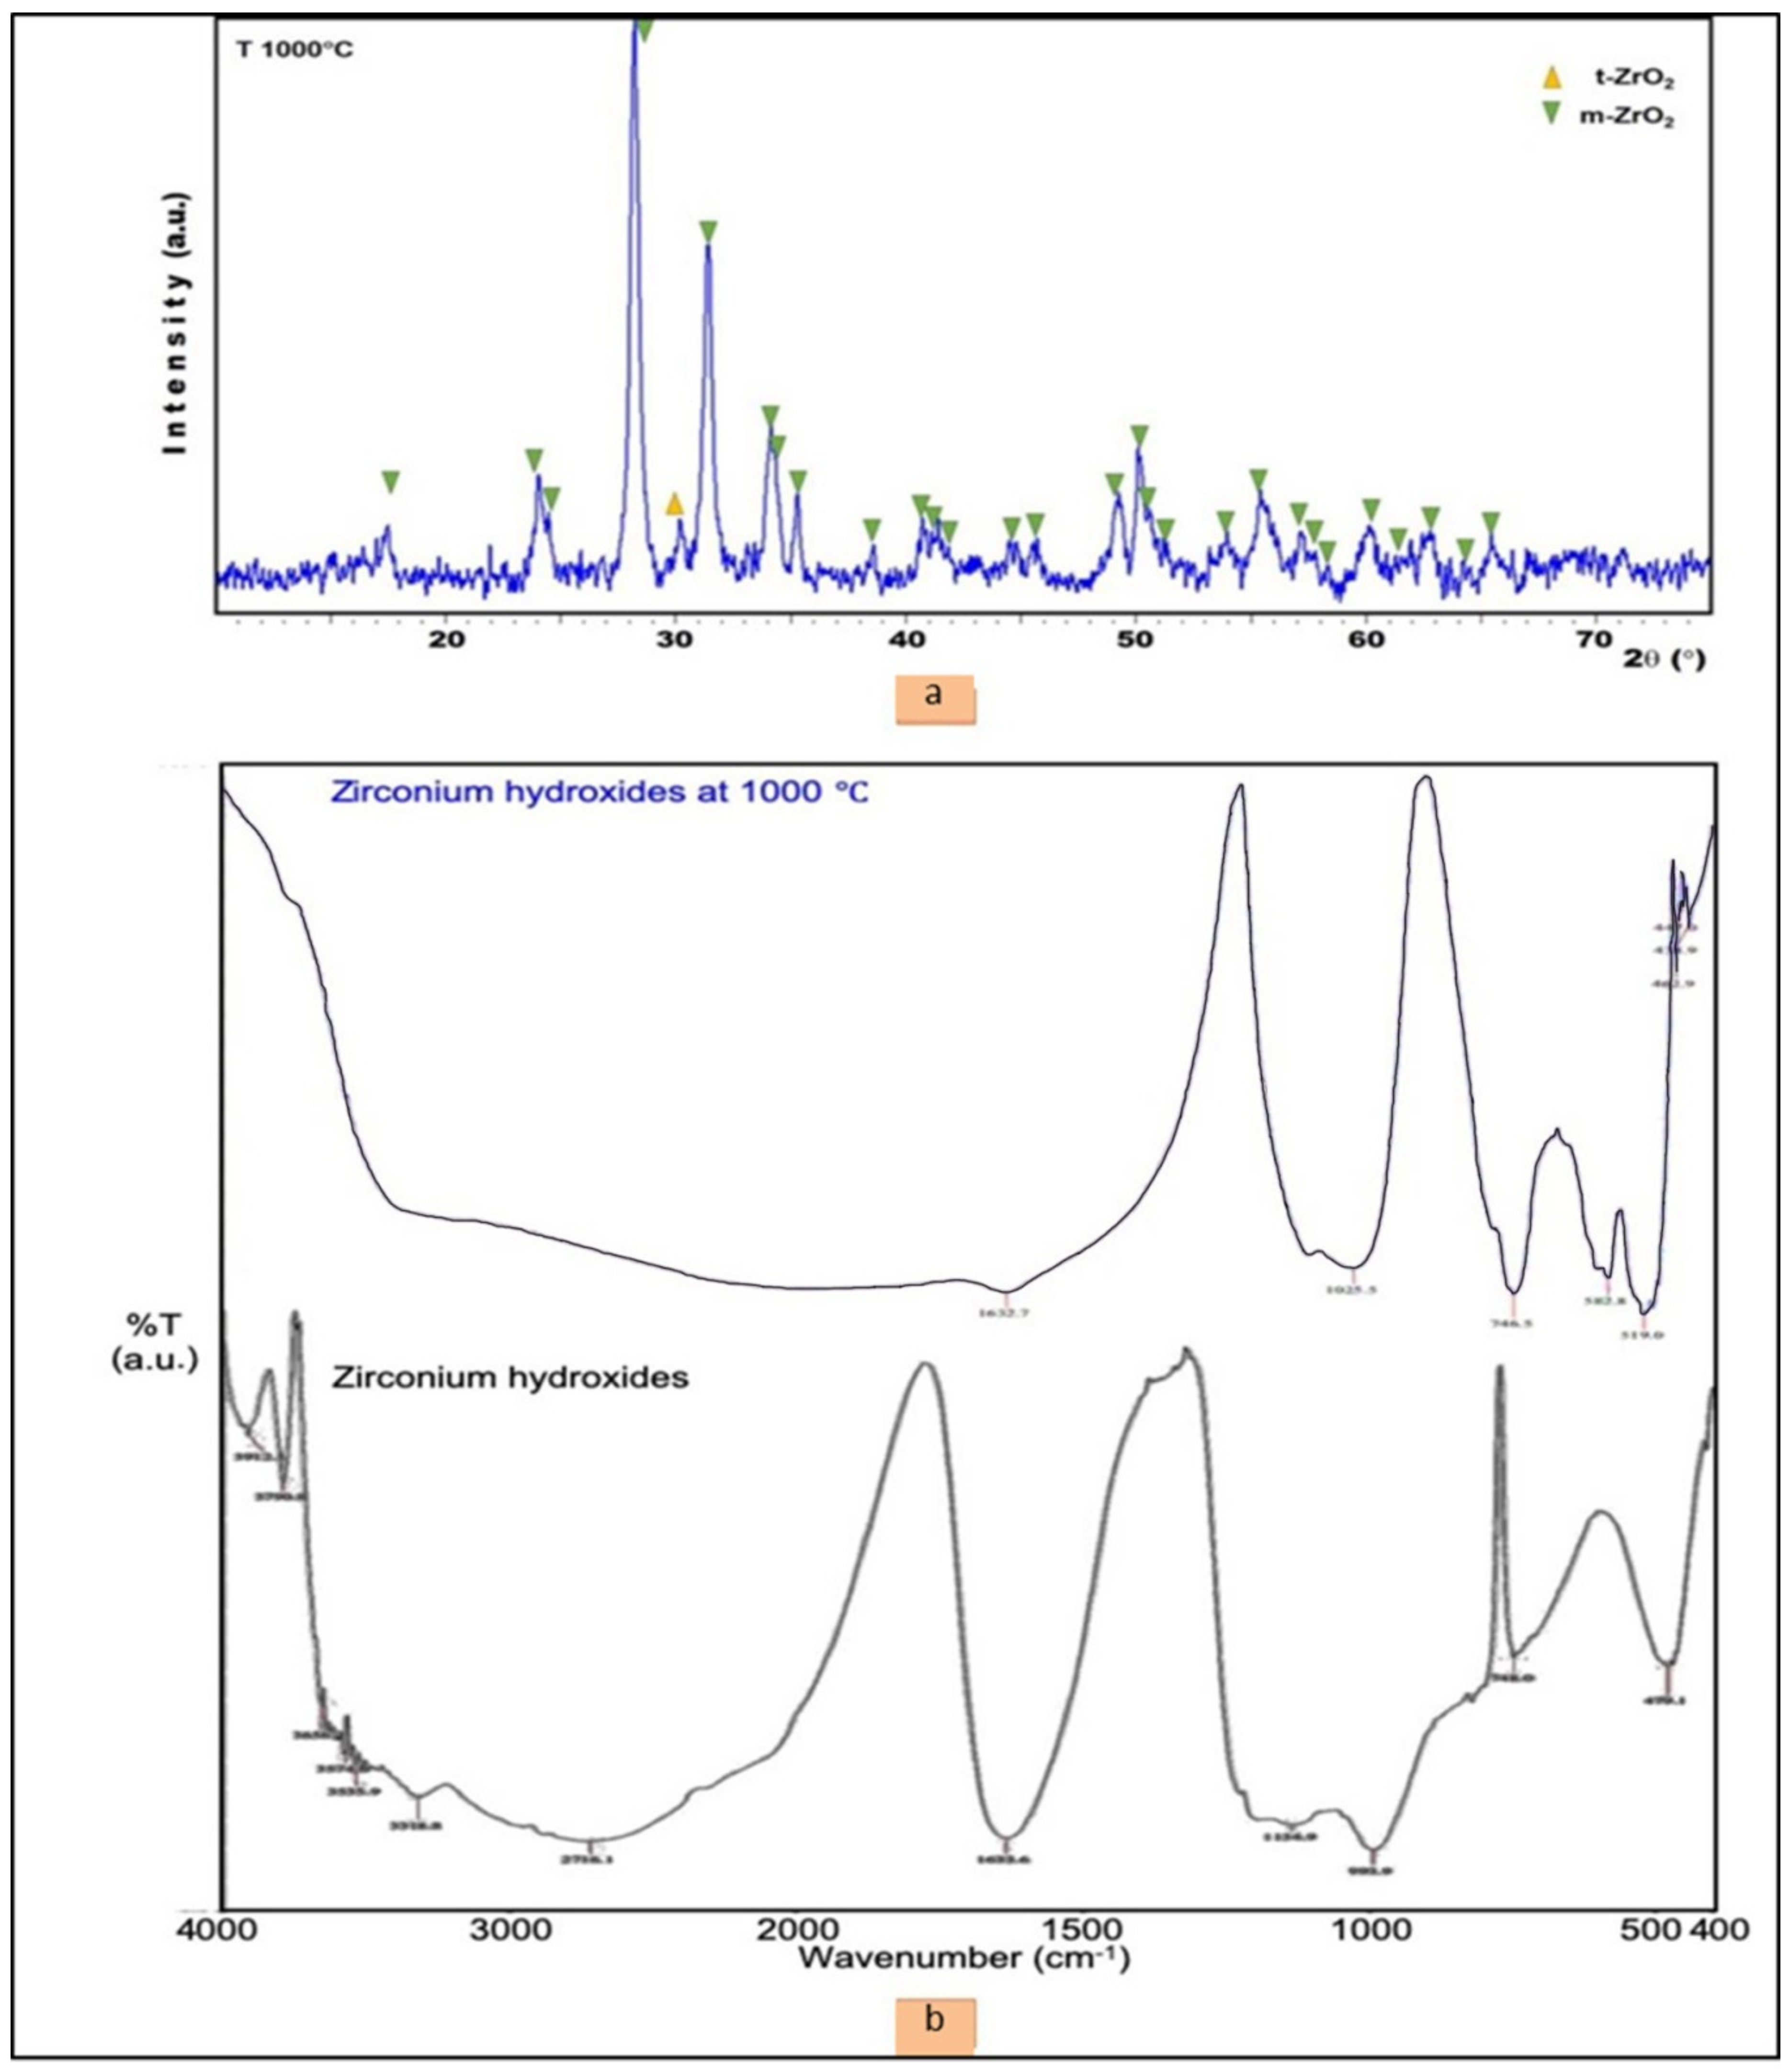
3.1. Characteristics of the Local Zircon-Based Zirconium Hydroxide Precursor

Table 1 presents the XRF identification result on the local zircon-based zirconium hydroxide precursor after calcination at 1000 °C. According to Table 1, the precursor consists of 89.52 wt% ZrO2 as the main constituent, and 3.26 wt% SiO2, 1.34 wt% Al2O3, 1.27 wt% Na2O, and 1.18 wt% HfO2 as the major impurities. The existence of SiO2, Al2O3, and HfO2 originated from the raw material of local zircon. Meanwhile, the presence of Na2O must be produced from the salt of Na2SO4, the by-product during preparation of zirconium hydroxides from local zircon through a sodium carbonate sintering method [21,22].
Figure 1a shows the FT-IR spectra of the zirconium hydroxide precursor before and after calcination at 1000 °C, displaying the transmission bands in the region of 4000–400 cm−1. The vibration modes of the Zr-O bonds in the precursor show the transmission bands in the range of 750–400 cm−1 [19]. Meanwhile, the bands at 993.9 and 1025.5 (the calcined zirconium hydroxide) cm−1 are assigned to the stretching vibration of the Si–O–Si [19].
At 1134.9 cm−1, the band is corresponding to the stretching vibration of the S=O bond, and it must be related to the salt of (Na+SO42−) in the precursor [19]. The band at 1633.6 cm−1 is attributed to the –OH on the surface of –ZrOH– [19,22]. These FT-IR results corroborate the XRF semiquantitative result, showing the presence of SiO2 and Na2SO4 compounds in the calcined zirconium hydroxides.
Figure 1a demonstrates the XRD identification result on the calcined zirconium hydroxide at 1000 °C, showing the existences of the monoclinic and the tetragonal phases of ZrO2. The monoclinic phase is detected by the appearance of its main diffraction peaks at diffraction angles, 2Ө, of around 28° and 31° that relate to the (−111) and (111) crystal planes of the m-ZrO2 structure in accordance with PDF 2. 830943. Nevertheless, based on PDF2. 791771, the t-ZrO2 phase is detected at diffraction angles, 2Ө, of around 30° and corresponding to the (101) crystal plane of the t-ZrO2 structure. However, the presence of ZrO2 impurities as shown in the XRF measurements are not found in the XRD analysis results. This result confirms that the impurities exist randomly in the zirconium hydroxide. Therefore, all the characterization results of the zirconium hydroxide are only valid for the tested samples.

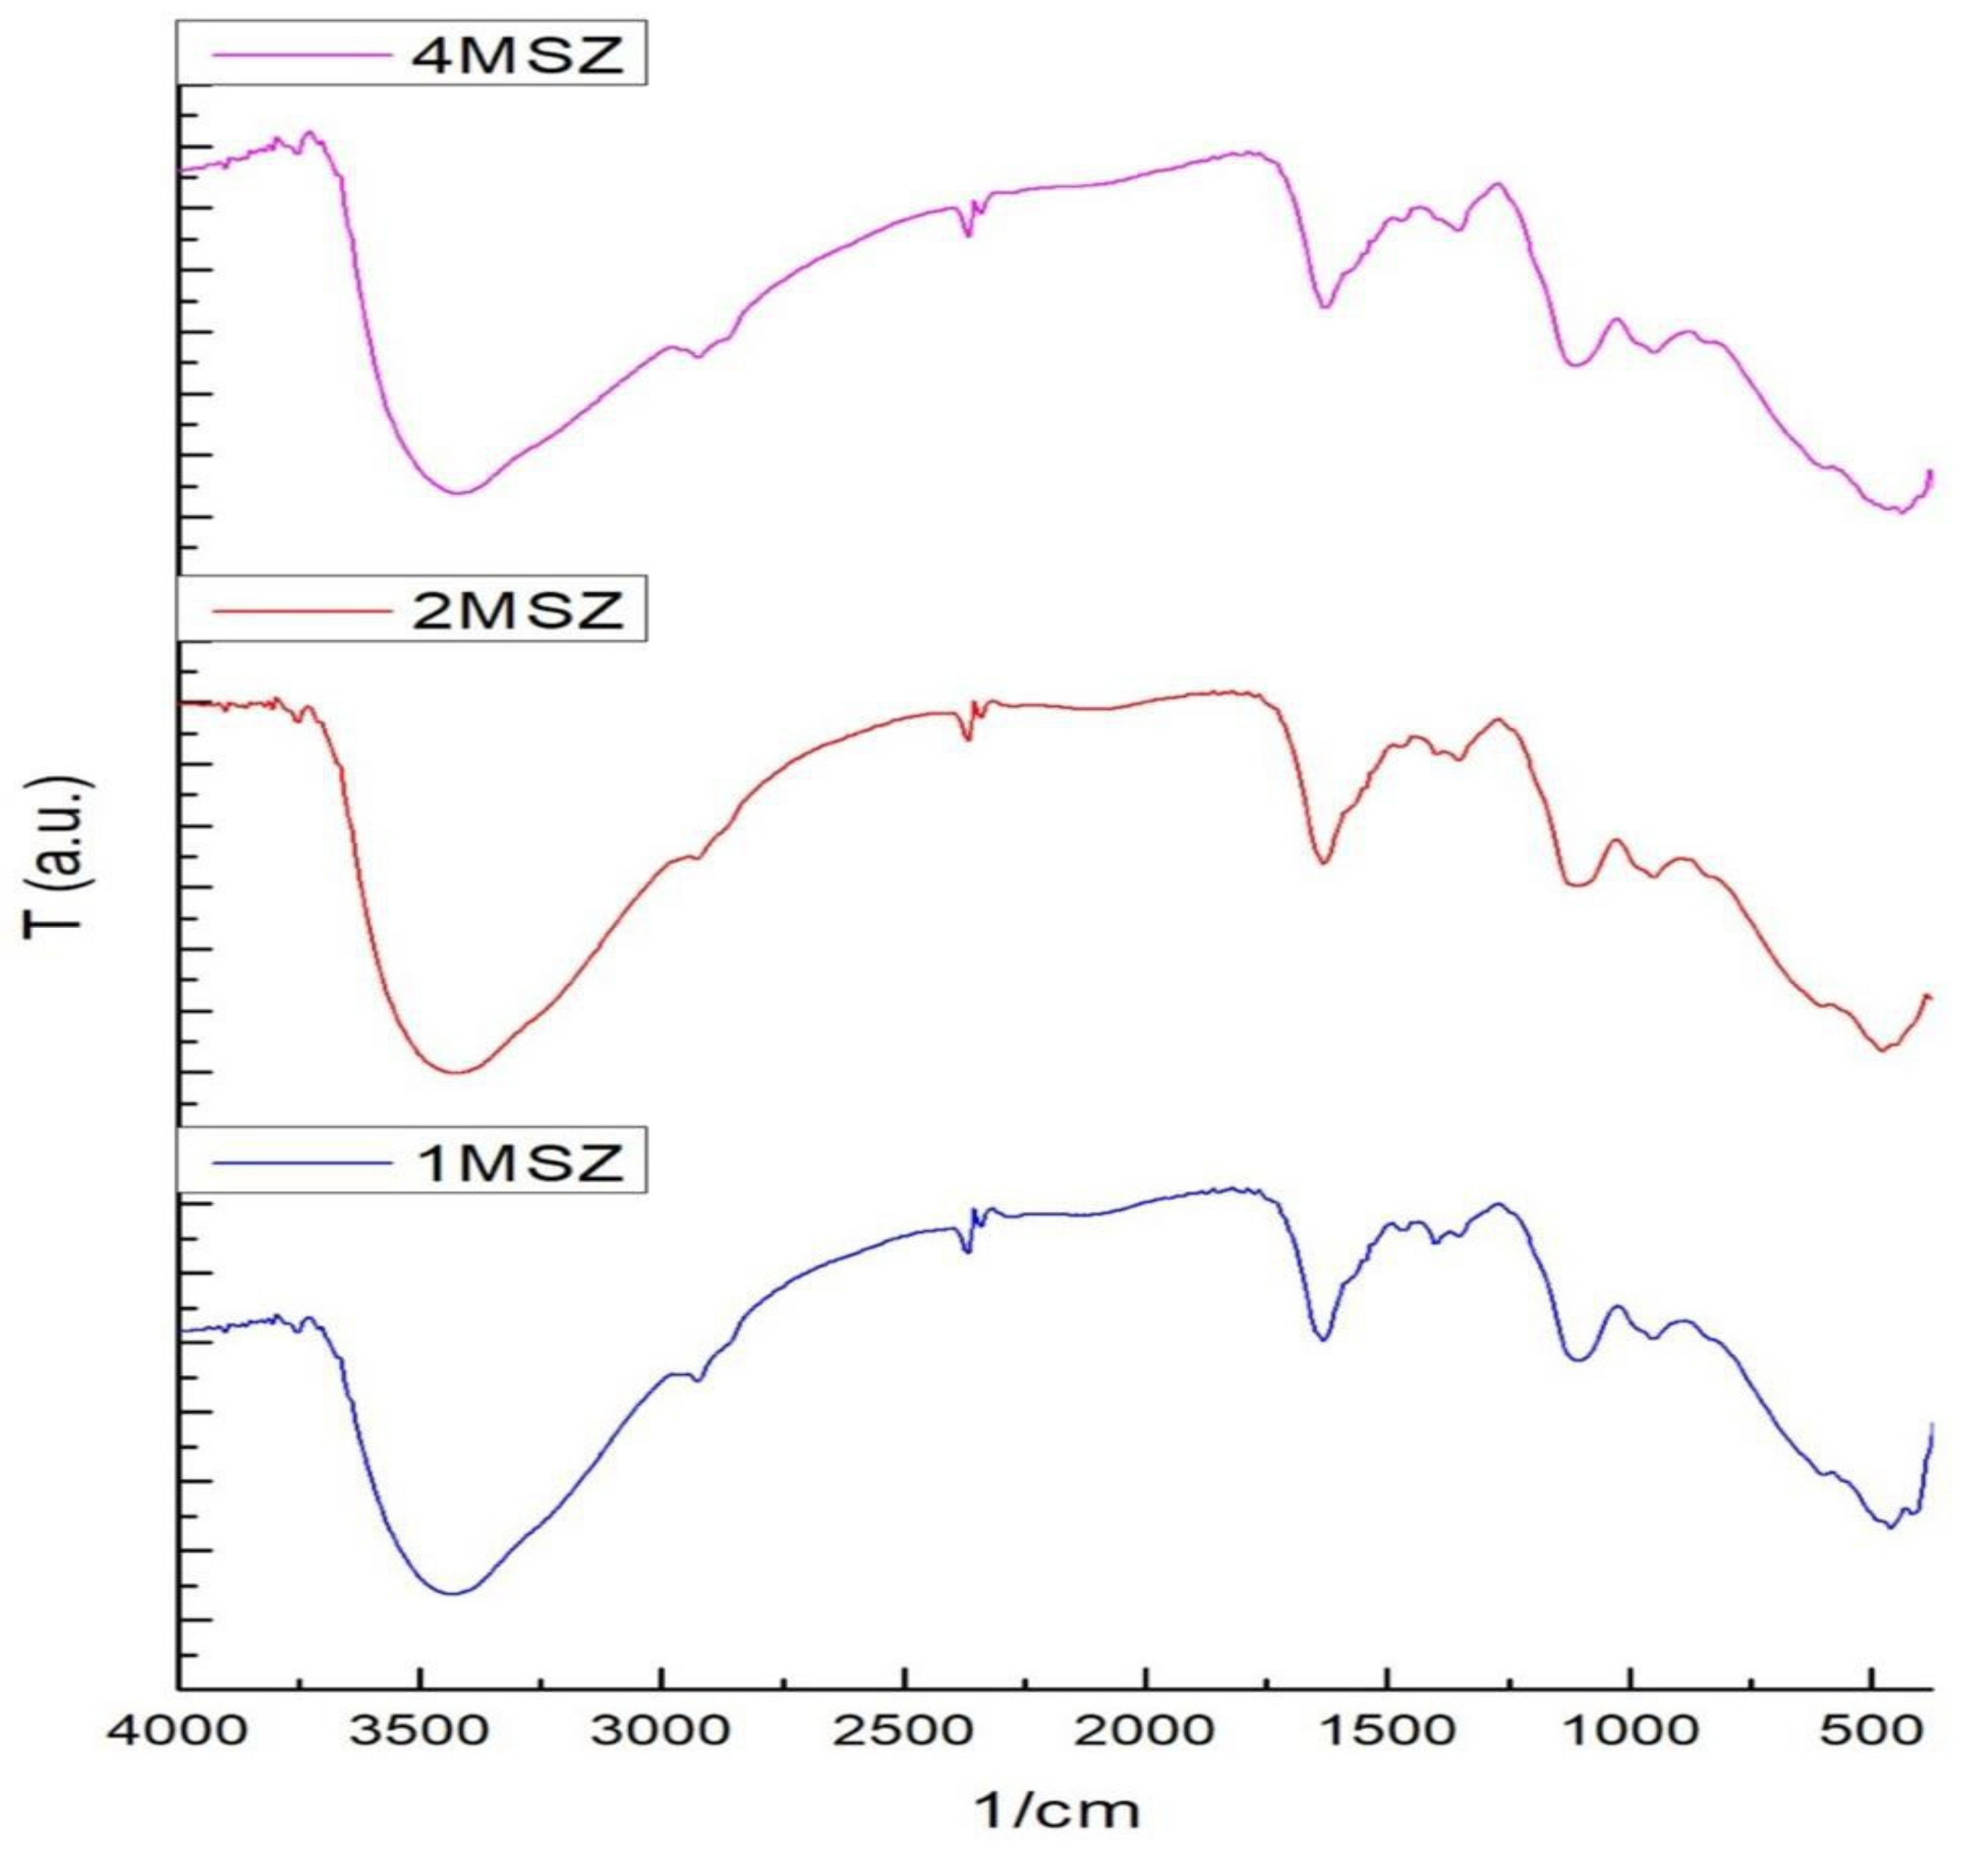
3.2. FT-IR Spectra Characteristics of the As-Synthesized MSZ Samples

The ZrO2 precursor used exhibited pH 5, consisting of a mixture of ZrO(OH)2 and ZrO(OH)2·×H2O compounds [19]. However, in our present work, we used zirconium hydroxides (pH 5) and MgCO3 as the precursors and water as the medium/ a solvent. Since MgCO3 is less soluble in water and the ZrO2 precursor consists of the sulfate impurity, it is necessary to briefly describe the proposed reaction that should be occurred during MSZ preparation. So, we would like to write the possible reaction mechanism one by one.
2 M g C O 3 + H 2 O     M g 2 O H 2 C O 3   s slurry   +   C O 2
( Z r O O H 2 + Z r O O H 2 · x H 2 O ) g e l + 2 M g C O 3 + H 2 O     ( Z r O O H 2 + Z r O O H 2 · x H 2 O ) g e l + M g 2 O H 2 C O 3   s + C O 2
( Z r O O H 2 + Z r O O H 2 · x H 2 O ) g e l + M g 2 O H 2 C O 3   s + N H 4 O H + x H 2 O p H   8   ( Z r O O H 2 · x H 2 O + Z r O H 4 · x H 2 O ) g e l + M g 2 O H 2 C O 3   s + N H 3
An FT-IR spectroscopy is a useful tool to analyze the functional group of any organic molecules and chemical structure changes in a compound. The IR spectrum of the as-synthesized MSZ samples is shown in Figure 2, demonstrating the transmission bands in the region of 4000–400 cm−1. There are two possible reaction mechanisms between the ZrO2 precursors and PEG. The first is via the intermolecular hydrogen bonding of the hydroxyl groups of the ZrO2 precursors and the ether groups (–O–) in PEG that can be confirmed by a weak band at around 3235 cm−1. The second possible mechanism is the interaction through the coordinate covalent bonding of the ligand atom of the ether group(–Ö–) in the PEG chains to the metal ions of Zr4+. As displayed in Figure 2, the vibration modes of the oxygen and metal bonds in the precursor show the transmission bands in the range of 750–400 cm−1 [19]. The appearance of the peak at around 3400 cm−1 corresponded to the H-O–H stretching of the hydroxyl groups (the intramolecular hydrogen bonding). The bands of PEG are assigned as the CH2 stretching vibration of PEG at around 2900–2800 cm−1, the C–H scissor bending vibration at 1450–1292 cm−1, the C–O stretching vibration of alcohol at around 1250 cm−1, and the C–O–C asymmetric stretching vibration at 1100–1060 cm−1 [23]. Table 2 presents the elucidation results of the IR-spectra of all the as-synthesized MSZ samples [24,25,26,27].

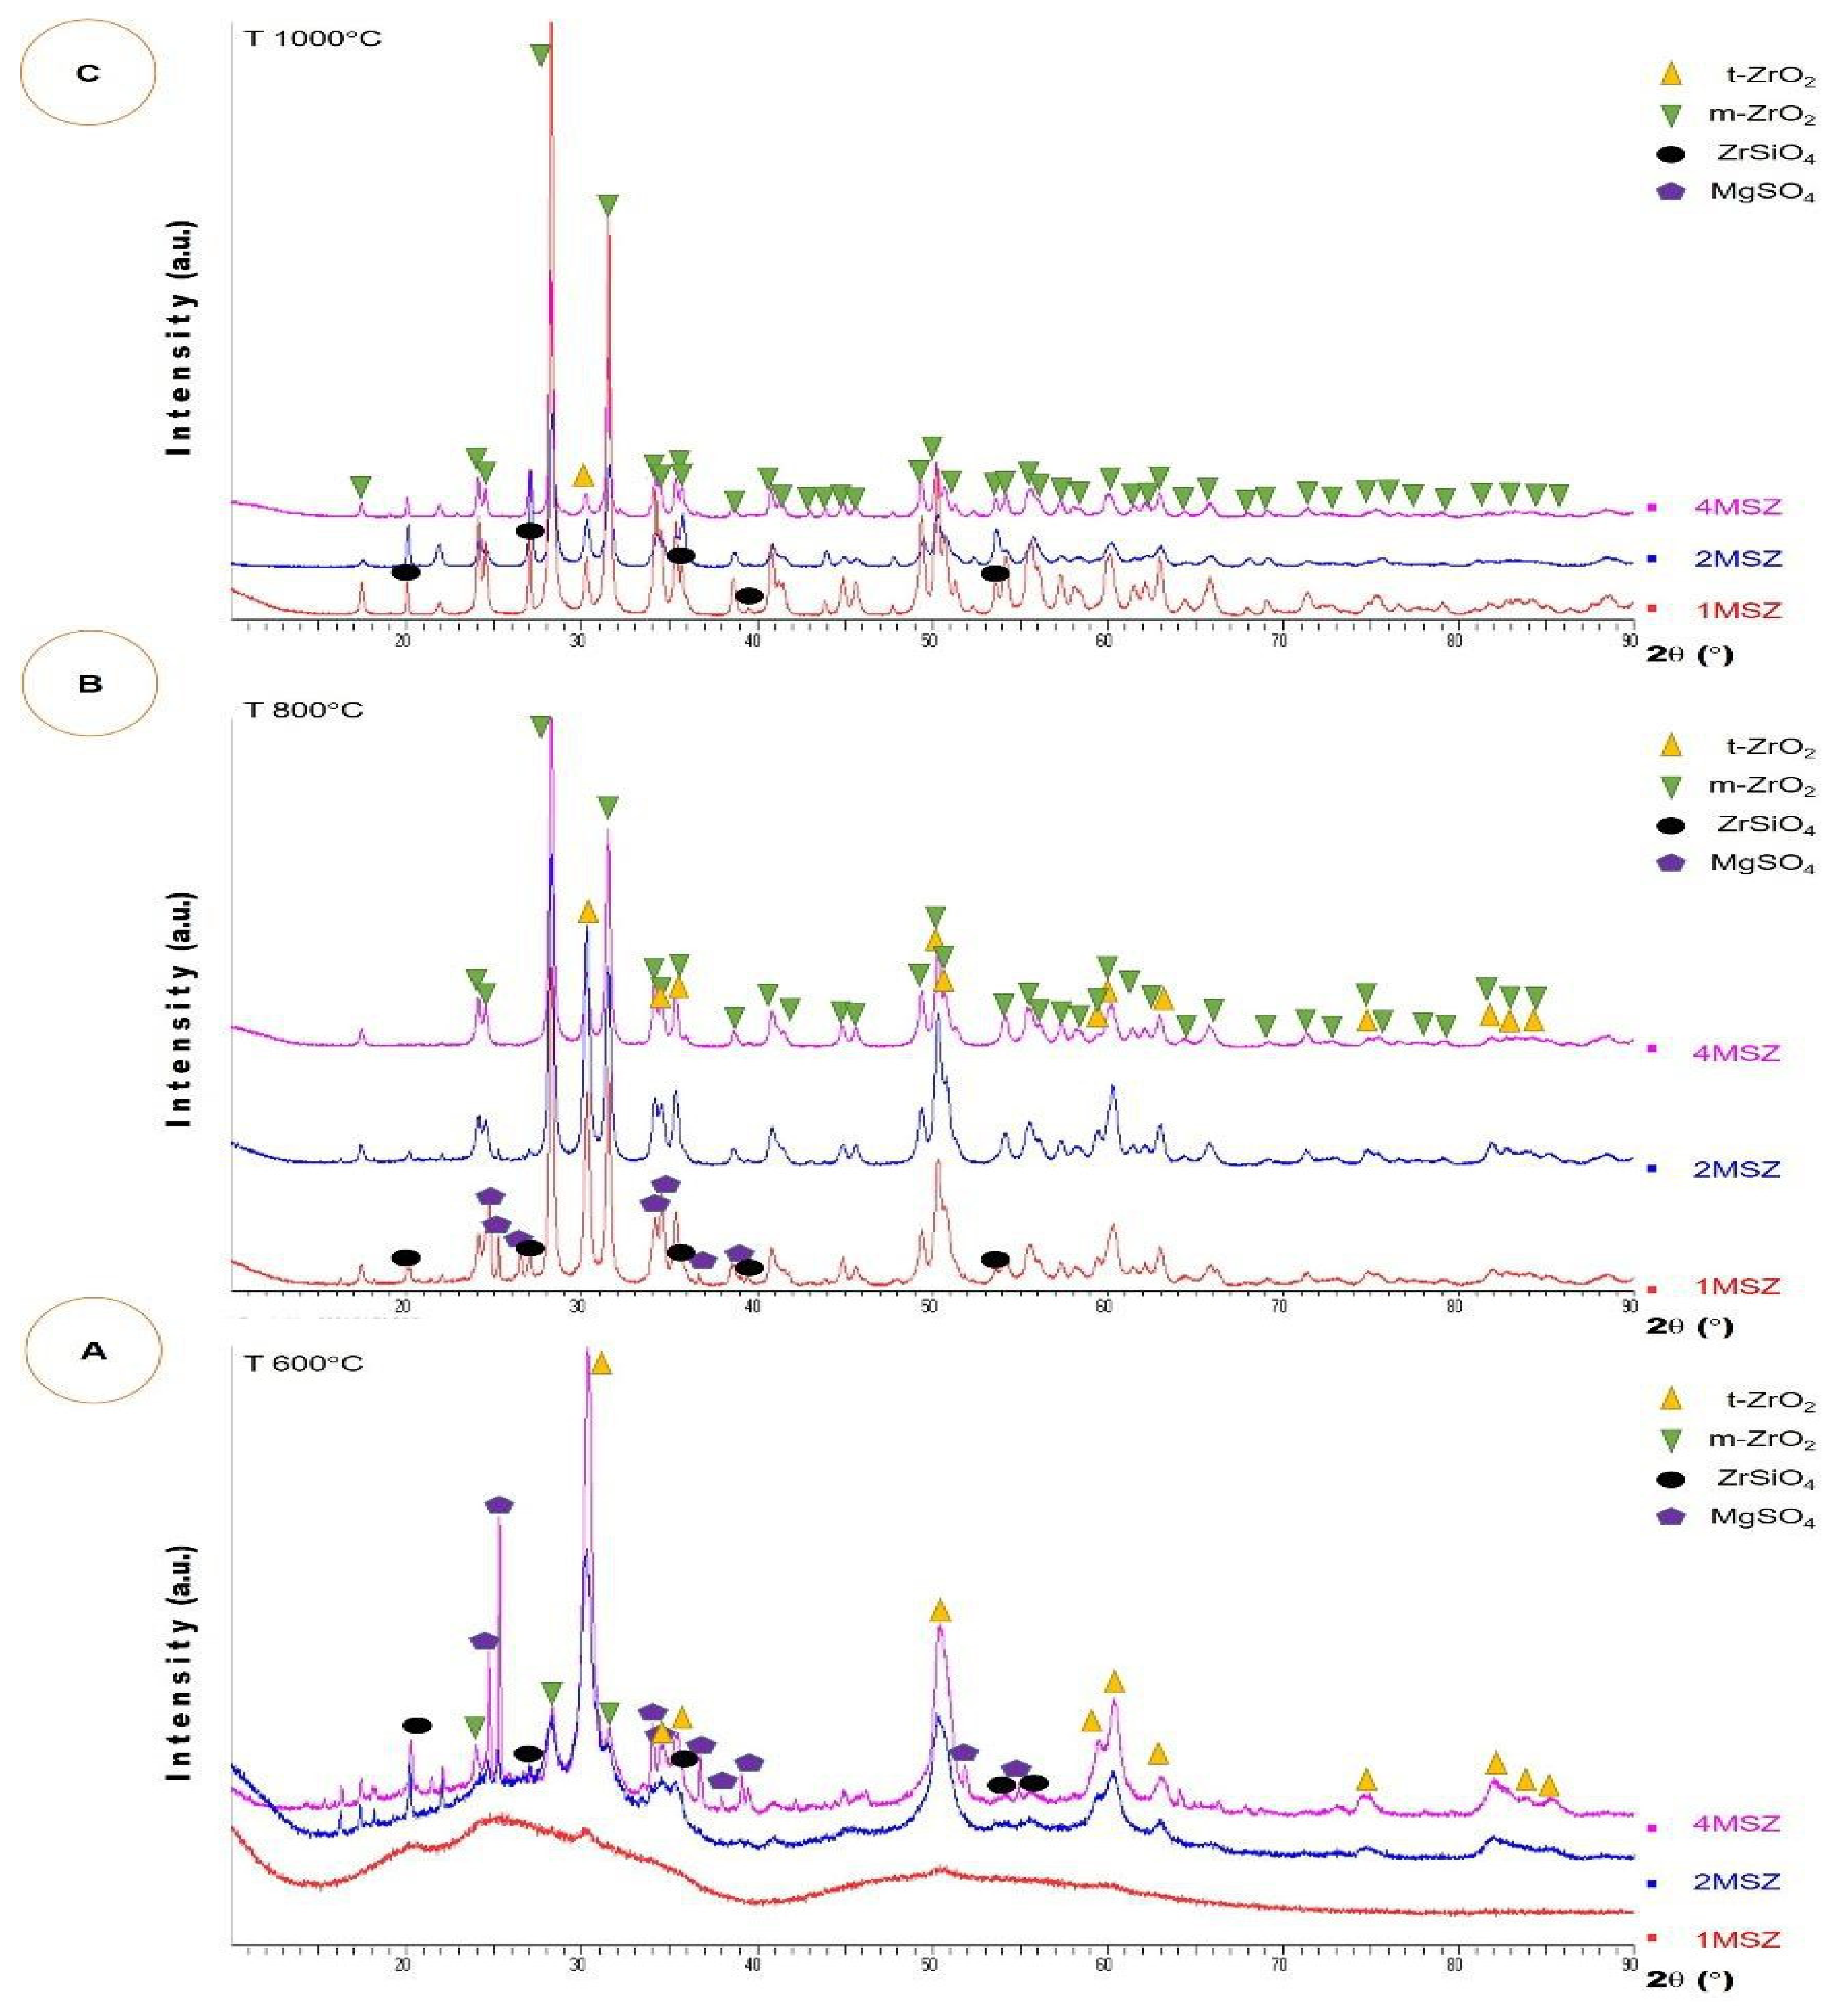
3.3. Phase Transformation of ZrO2 in a MSZ System

The effects of the calcination temperatures and the stabilizer concentration on the phase composition of MSZ have been evaluated by XRD analysis. Figure 3 demonstrates the XRD patterns of the as-synthesized MSZ samples calcined at elevated temperatures of 600 °C, 800 °C, and 1000 °C. According to Figure 3A, all the as-synthesized MSZ samples show different diffractogram patterns after calcination at 600 °C. However, sample 1MSZ with 1 wt% MgO content, exhibits a different diffraction pattern from the other samples. The XRD result shows wide broadened multiple peaks at diffraction angles, 2θ, starting from around 15° to 40° and from around 45° to 40°. However, the peaks consist of many phases, which is in agreement with the XRD investigation in Figure 3A. Based on PDF2.791771, the t-ZrO2 phase is detected at diffraction angles, 2θ, of around 30° and 50°, corresponding to the (101) and (112) crystal planes of the t-ZrO2 structure, respectively. Some impurity phases such as ZrSiO4 and MgSO4 are also observed at the respective diffraction angles, 2θ, of around 20°, and 25°, in accordance with PDF2. 831375 and 210546, respectively. These impurities are obviously identified in 2MSZ and 4MSZ samples in which the MgO content is increasing. The existence of the impurities in MSZ samples may have originated from the ZrO2 precursors of local zircon-based zirconium hydroxides used. According to our previous study, the impurities arose during the preparation of zirconium hydroxides from local zircon in the form of Na2SO4, unhydrolyzed silica, and undecomposed zircon [21,22]. These impurities occur in ultrafine particles. The presence of the Na2SO4 impurity can be caused by the incomplete washing process of the precursors. Furthermore, apart from ZrSiO4, another impurity appearing as a sulfate compound, which is originally from one of the raw materials used for the preparation of zirconium hydroxide precursors, may be found. Based on the XRF result, the zirconia precursor contains sodium sulfate as one of the impurities. This can react with magnesium hydroxide carbonate in the presence of water, resulting in a (MgSO4 and Na2CO3) solution. Meanwhile, Na2CO3 dissolves in water to generate NaOH and CO2.
M g 2 O H 2 C O 3 + 2 N a 2 S O 4 + H 2 O 2 M g S O 4 + 4 N a O H + C O 2
As given by XRD diffractograms in Figure 3A, the m-ZrO2 phase appears in 2MSZ and 4MSZ samples at 600 °C in accordance with PDF 2. 830943. It is noticed by its diffraction main peaks at diffraction angles, 2θ, of around 28° and 31° that attribute to the (−111) and (111) crystal planes of the m-ZrO2 structure, respectively.
Along with the temperature elevation, the peak intensities of the m-phase in all MSZ samples increase. At 800 °C and 1000 °C, the XRD results showing MSZ samples exhibit different diffractograms. At 800 °C, MSZ samples generally comprise both the monoclinic and the tetragonal phases. In addition, the peak of MgSO4 disappears at diffraction angles, 2θ, of around 25° in the XRD diffractograms of 2MSZ and 4MSZ samples. This phenomenon considers the Mg salt transforming to MgO; then, it metathetically reacts with ZrO2 to form a solid solution. Meanwhile, at a higher temperature of 1000 °C, it can be seen that the monoclinic phase of ZrO2 is more dominant than the tetragonal phase in all MSZ samples. Based on the XRD results in this study, the higher the MgO concentration used, as especially at 800 °C and 1000 °C, the more dominant the m-phase exhibited in the ZrO2 structure.
However, the existence of the zircon impurity in all MSZ samples at elevated calcination temperatures was corroborated by the results of the FT-IR identification on the as- synthesized MSZ samples in Figure 2. The band at 949 cm−1 is specific for the vibrational band of the Si–O–Zr bridges [27]. Nevertheless, these results are only valid for the examined samples in this work.

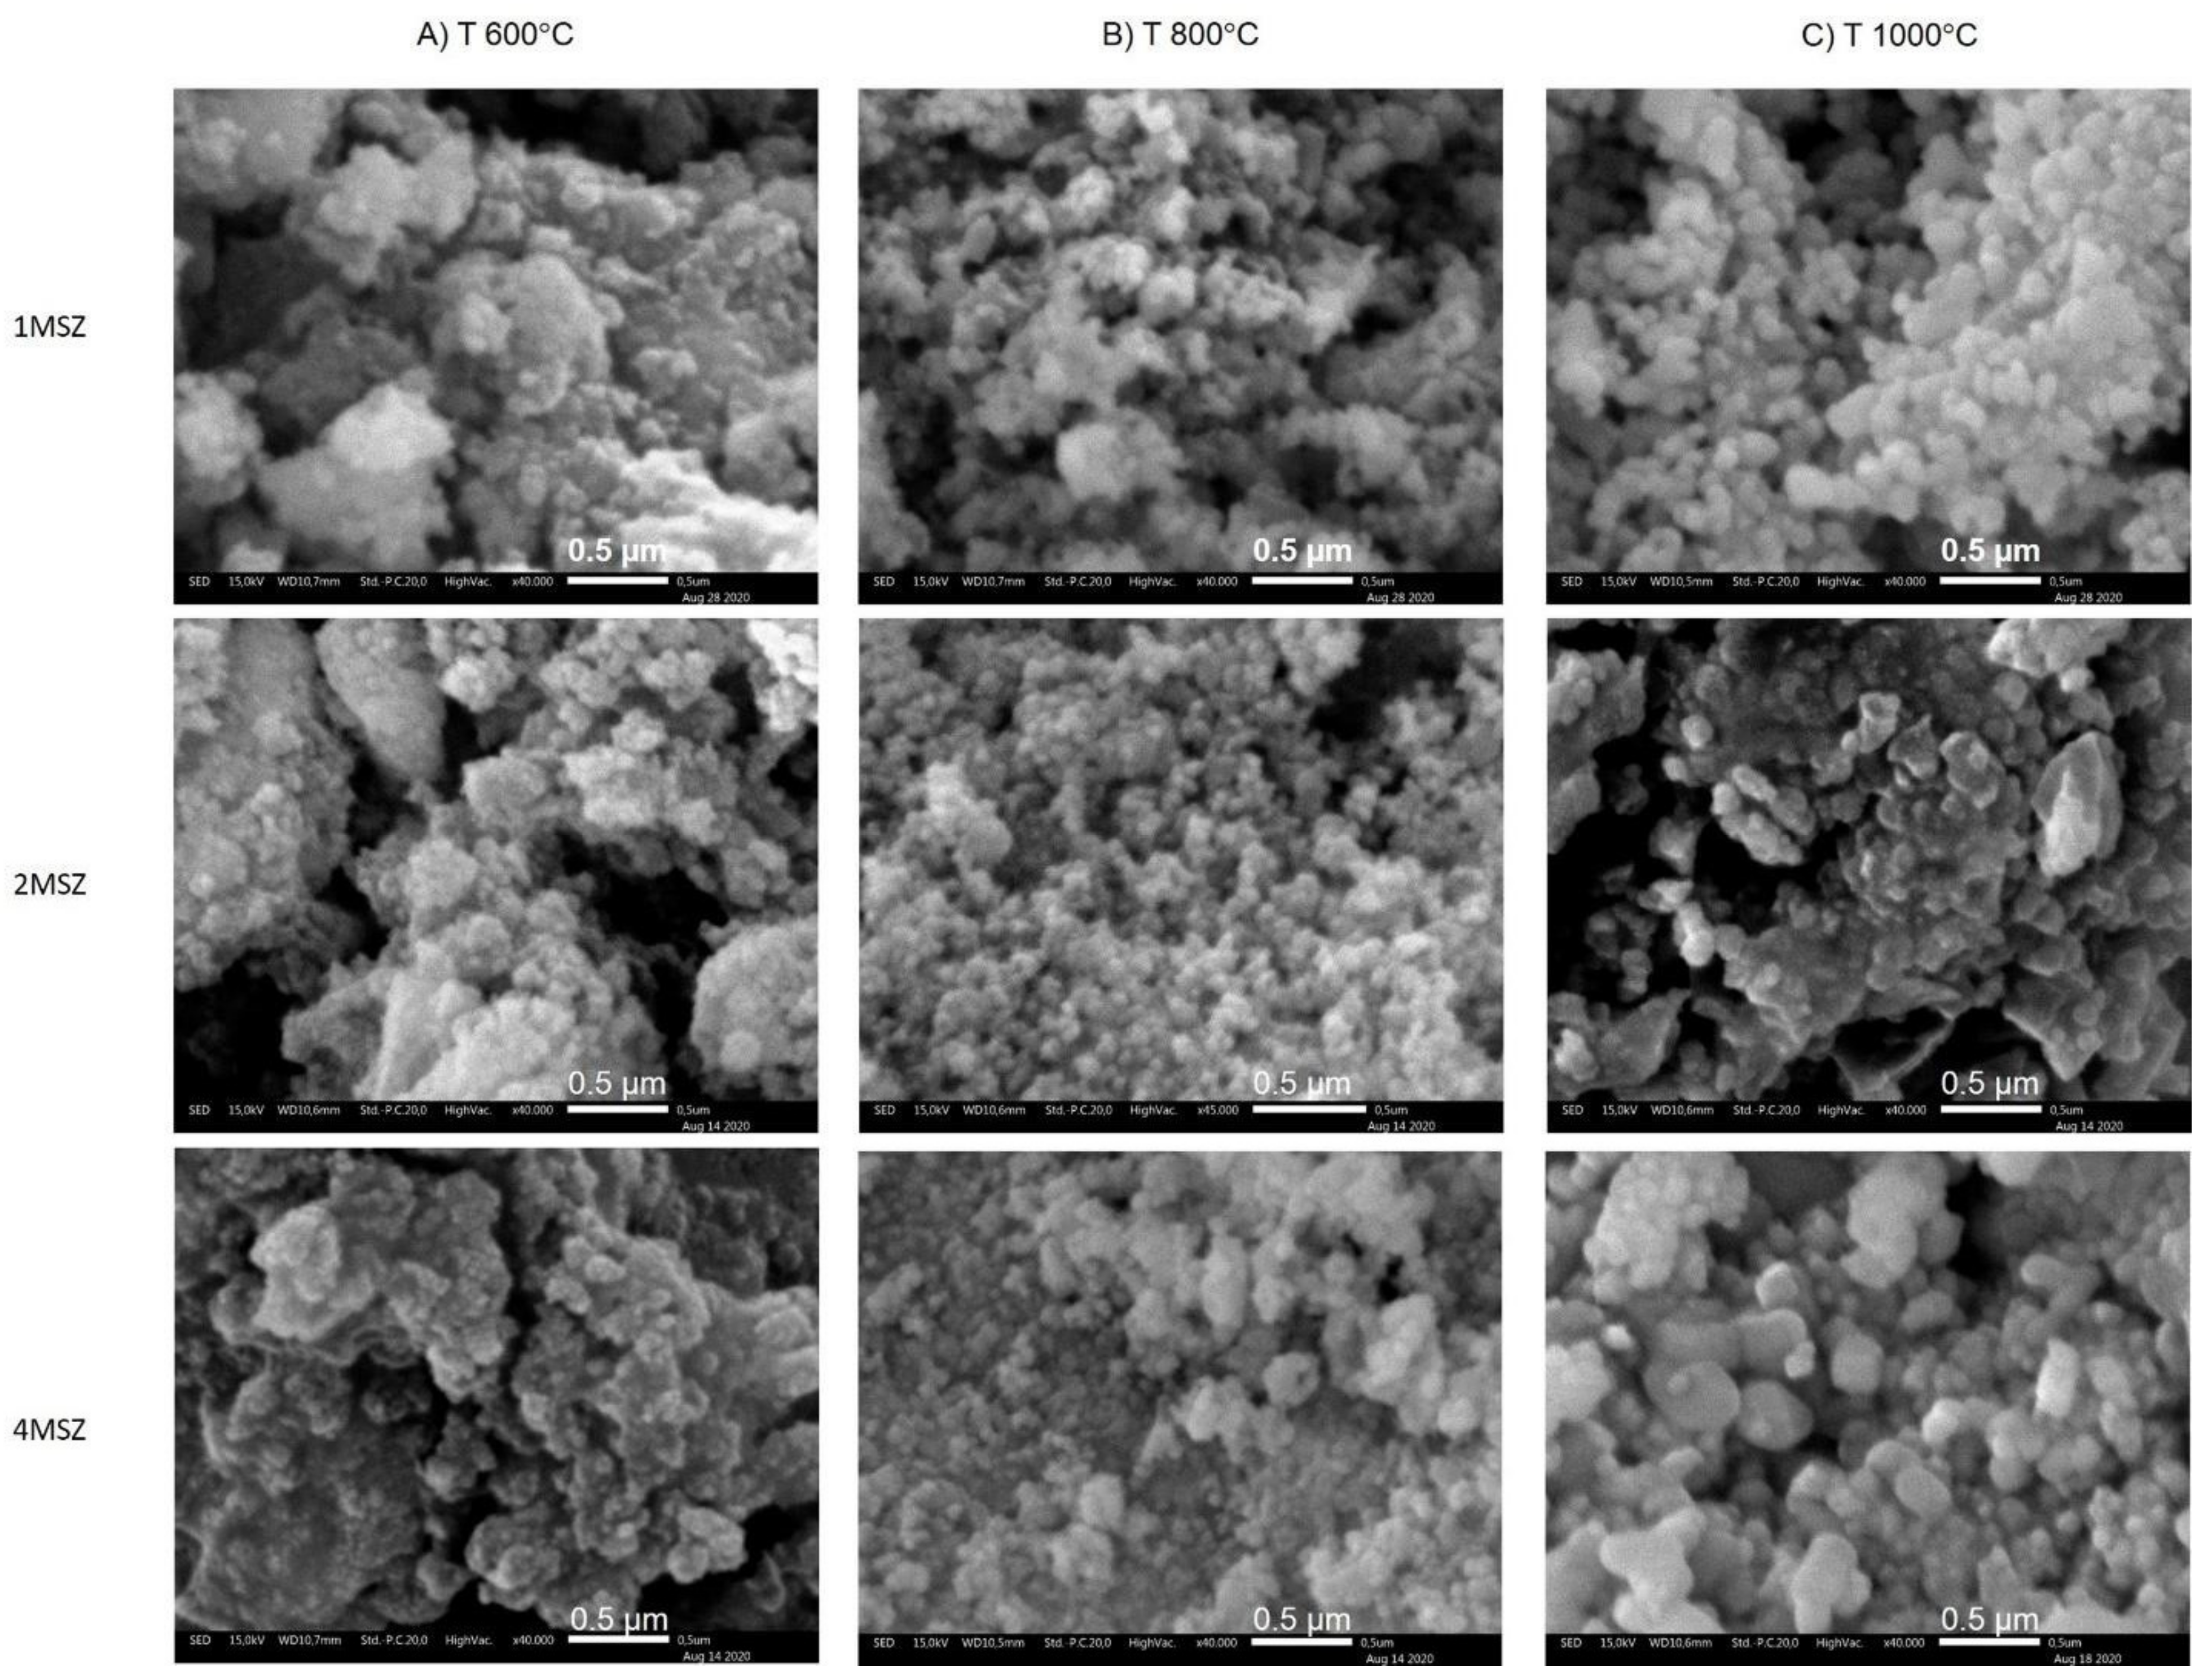
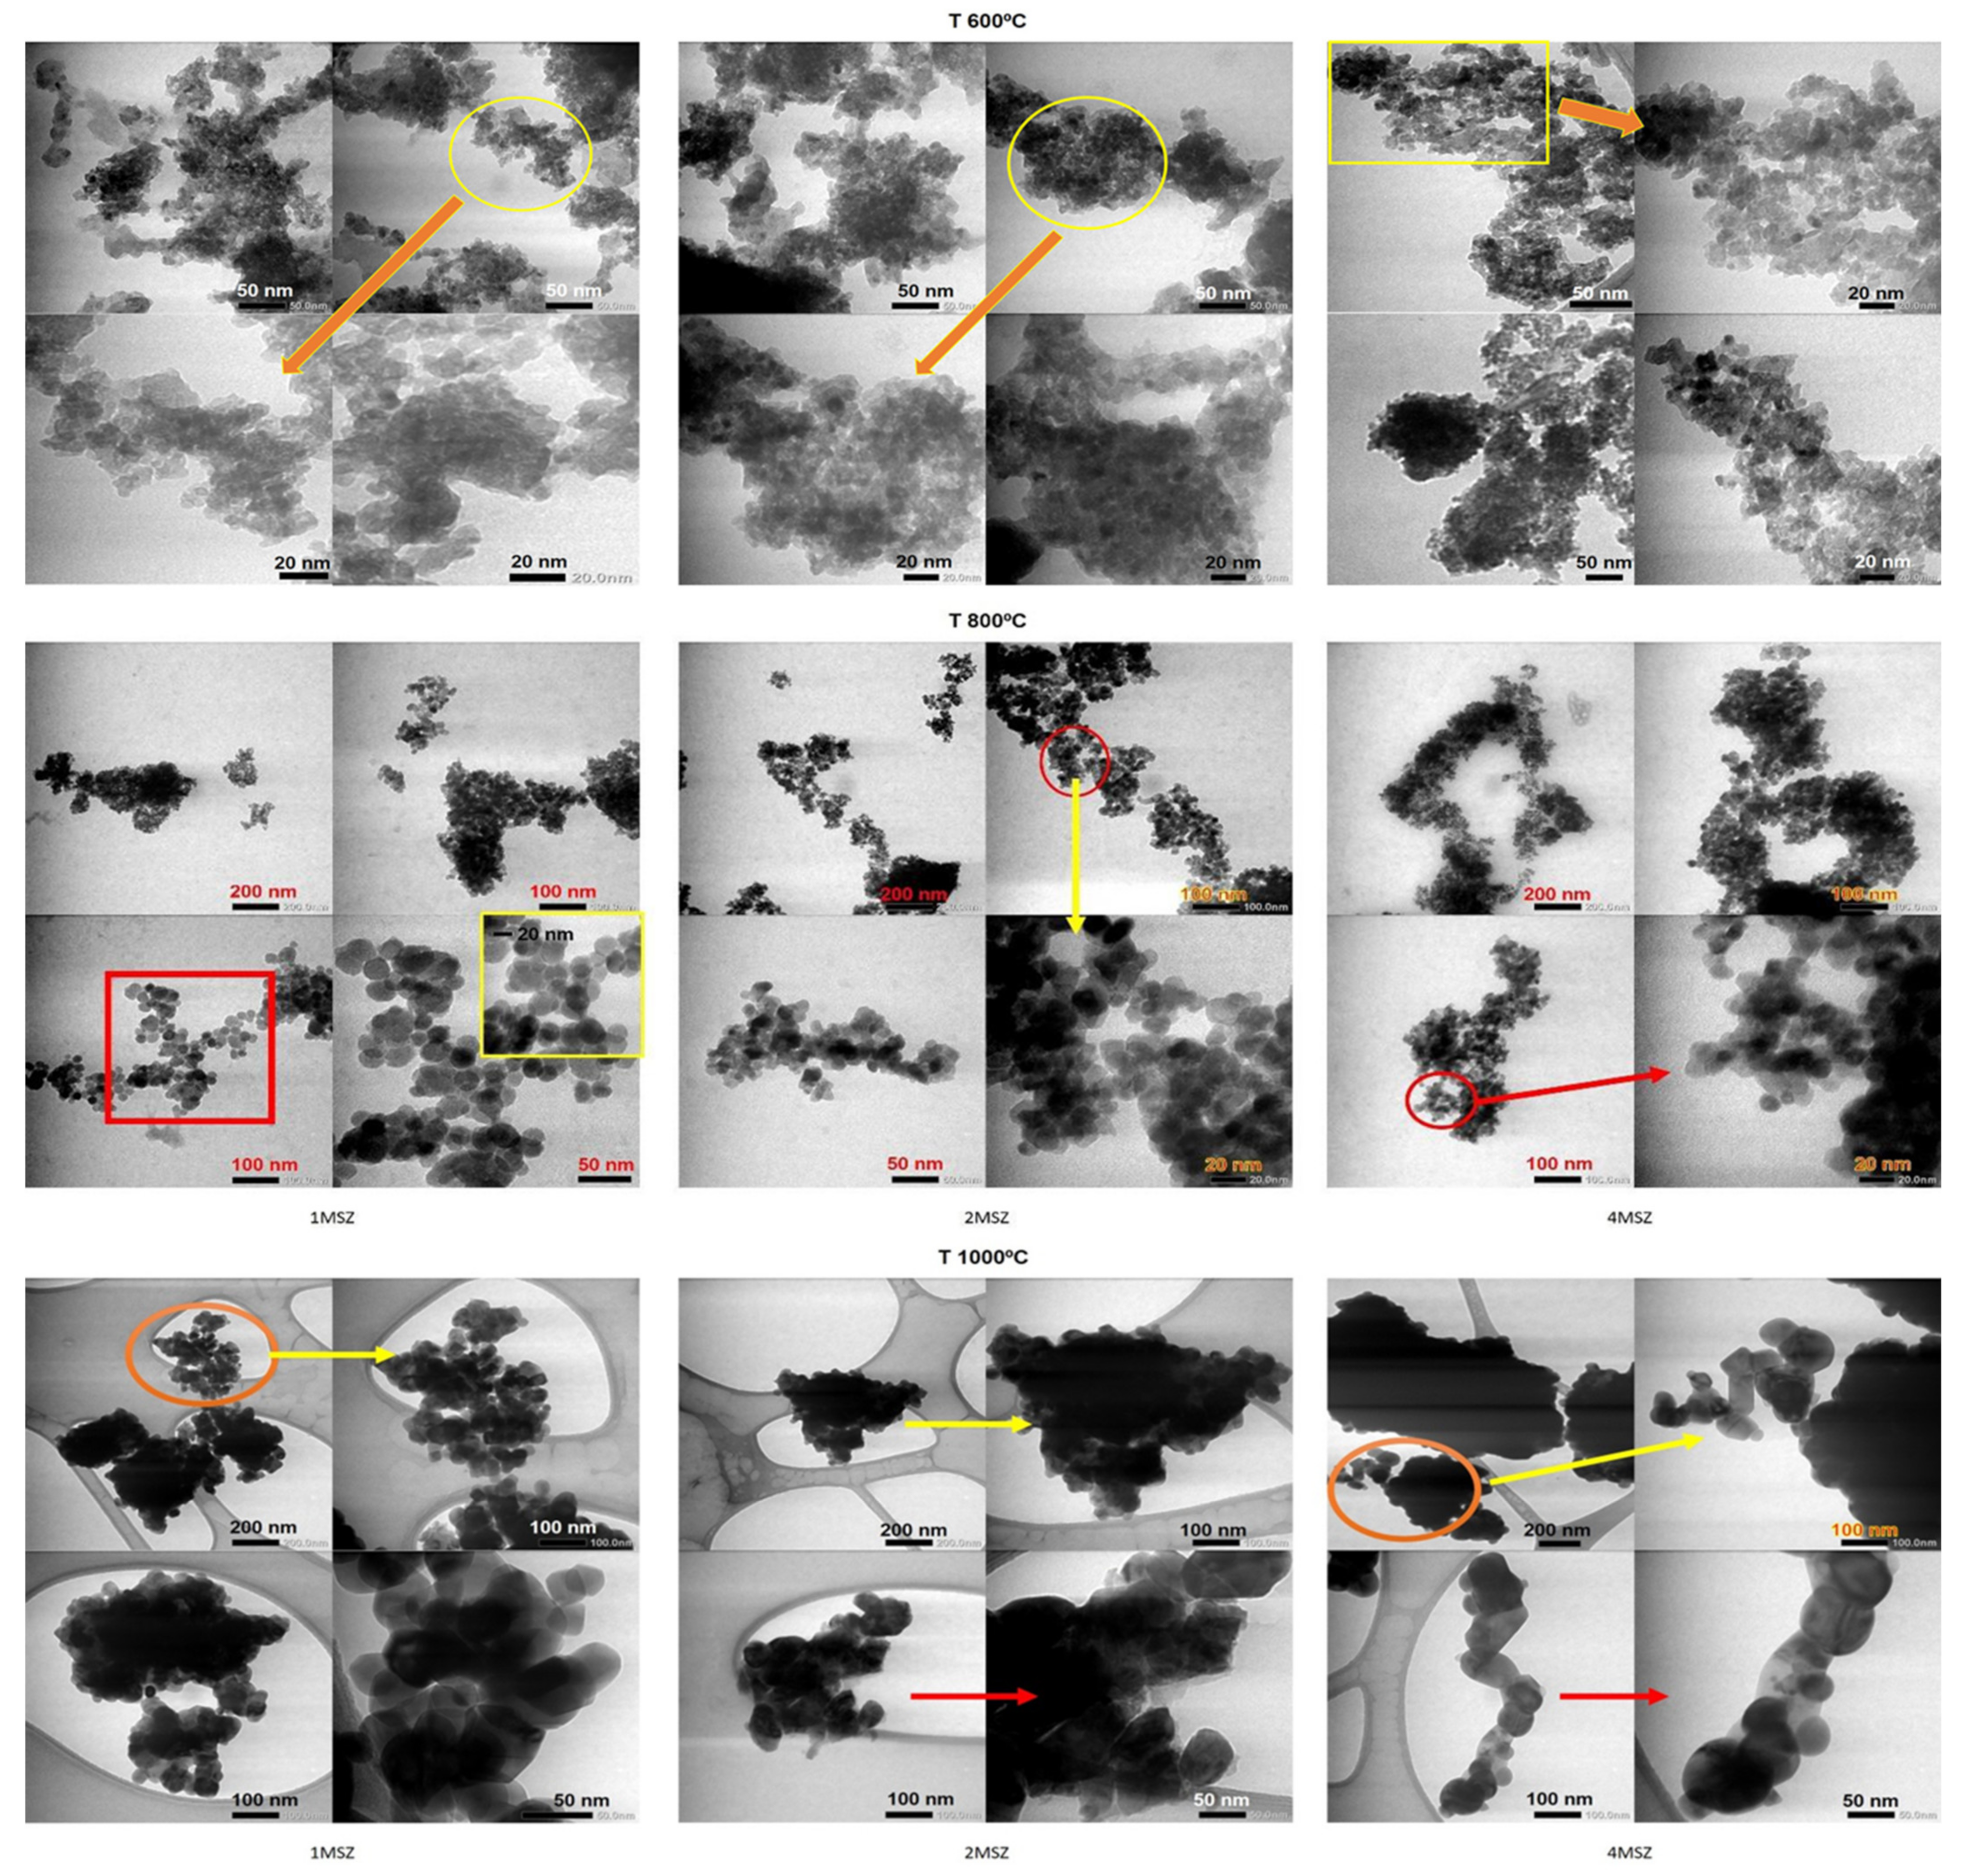
3.4. Microstructure Analysis by SEM and TEM

The typical microstructures of the as-synthesized MSZ powders calcined at elevated temperatures and different weight percent of MgO were analyzed by SEM, as per the results shown in Figure 4. According to the SEM micrographs MSZ samples with a magnification of 40,000× in Figure 4, it is very clear that the MSZ grain sizes dependence significantly on the temperature. The almost spherical-like structure of MSZ particles can be observed in all samples. As can be seen in Figure 4, all sample MSZ particles calcined at 600 °C form huge agglomerations. Based on Figure 4, 2MSZ appears to have the finest grain size and the smallest agglomeration compared to the others.
According to Figure 4, at a calcination temperature of 800 °C, overall, the agglomeration of MSZ particles is smaller than calcined at 600 °C. Meanwhile, at a calcination temperature of 1000 °C, the MSZ particles tend to have large agglomerations and exhibit dissimilar grain sizes. In addition, 4MSZ seems to have the largest particle size compared to the others. The tetragonal phase has a smaller volume than the monoclinic phase. The XRD results in Figure 3C show that 4MSZ exhibit the tetragonal phase with the lowest peak intensity, which means that the tetragonal phase composition is expected to be the lowest among MSZ samples. Thus, the 4MSZ sample exhibits the highest content of the monoclinic phase among the samples, resulting in the largest particles in its microstructure.
Figure 5 presents the TEM results of MSZ samples after calcination at 600 °C, 800 °C, and 1000 °C. The results of TEM observation on MSZ samples at 600 °C revealed that all particles size were less than 20 nm. Meanwhile, at a temperature of 800 °C, elongated agglomeration was formed in all samples. At this temperature, 2MSZ and 4MSZ samples exhibit the finer particles, acquiring less than 20 nm and being almost homogenous in size. Then 1MSZ sample has more a varied size in the range of less than 20 nm and more than 50 nm. Furthermore, at a temperature of 1000 °C, MSZ particles’ size tends to be larger as the Mg concentration increase. The particles size at 1000 °C seems to be larger than 50 nm.
In addition, the presence of PEG during the reaction affects the particle size of ZrO2. PEG attaches to the ZrO(OH)2 molecule through hydrogen bonding. As a result, the hydroxyl group of the ZrO2 precursor is covered by PEG molecules so that the aggregation between particles is reduced. During calcination, the organic substance was burnt out as gases, leaving particles in the nanostructures.

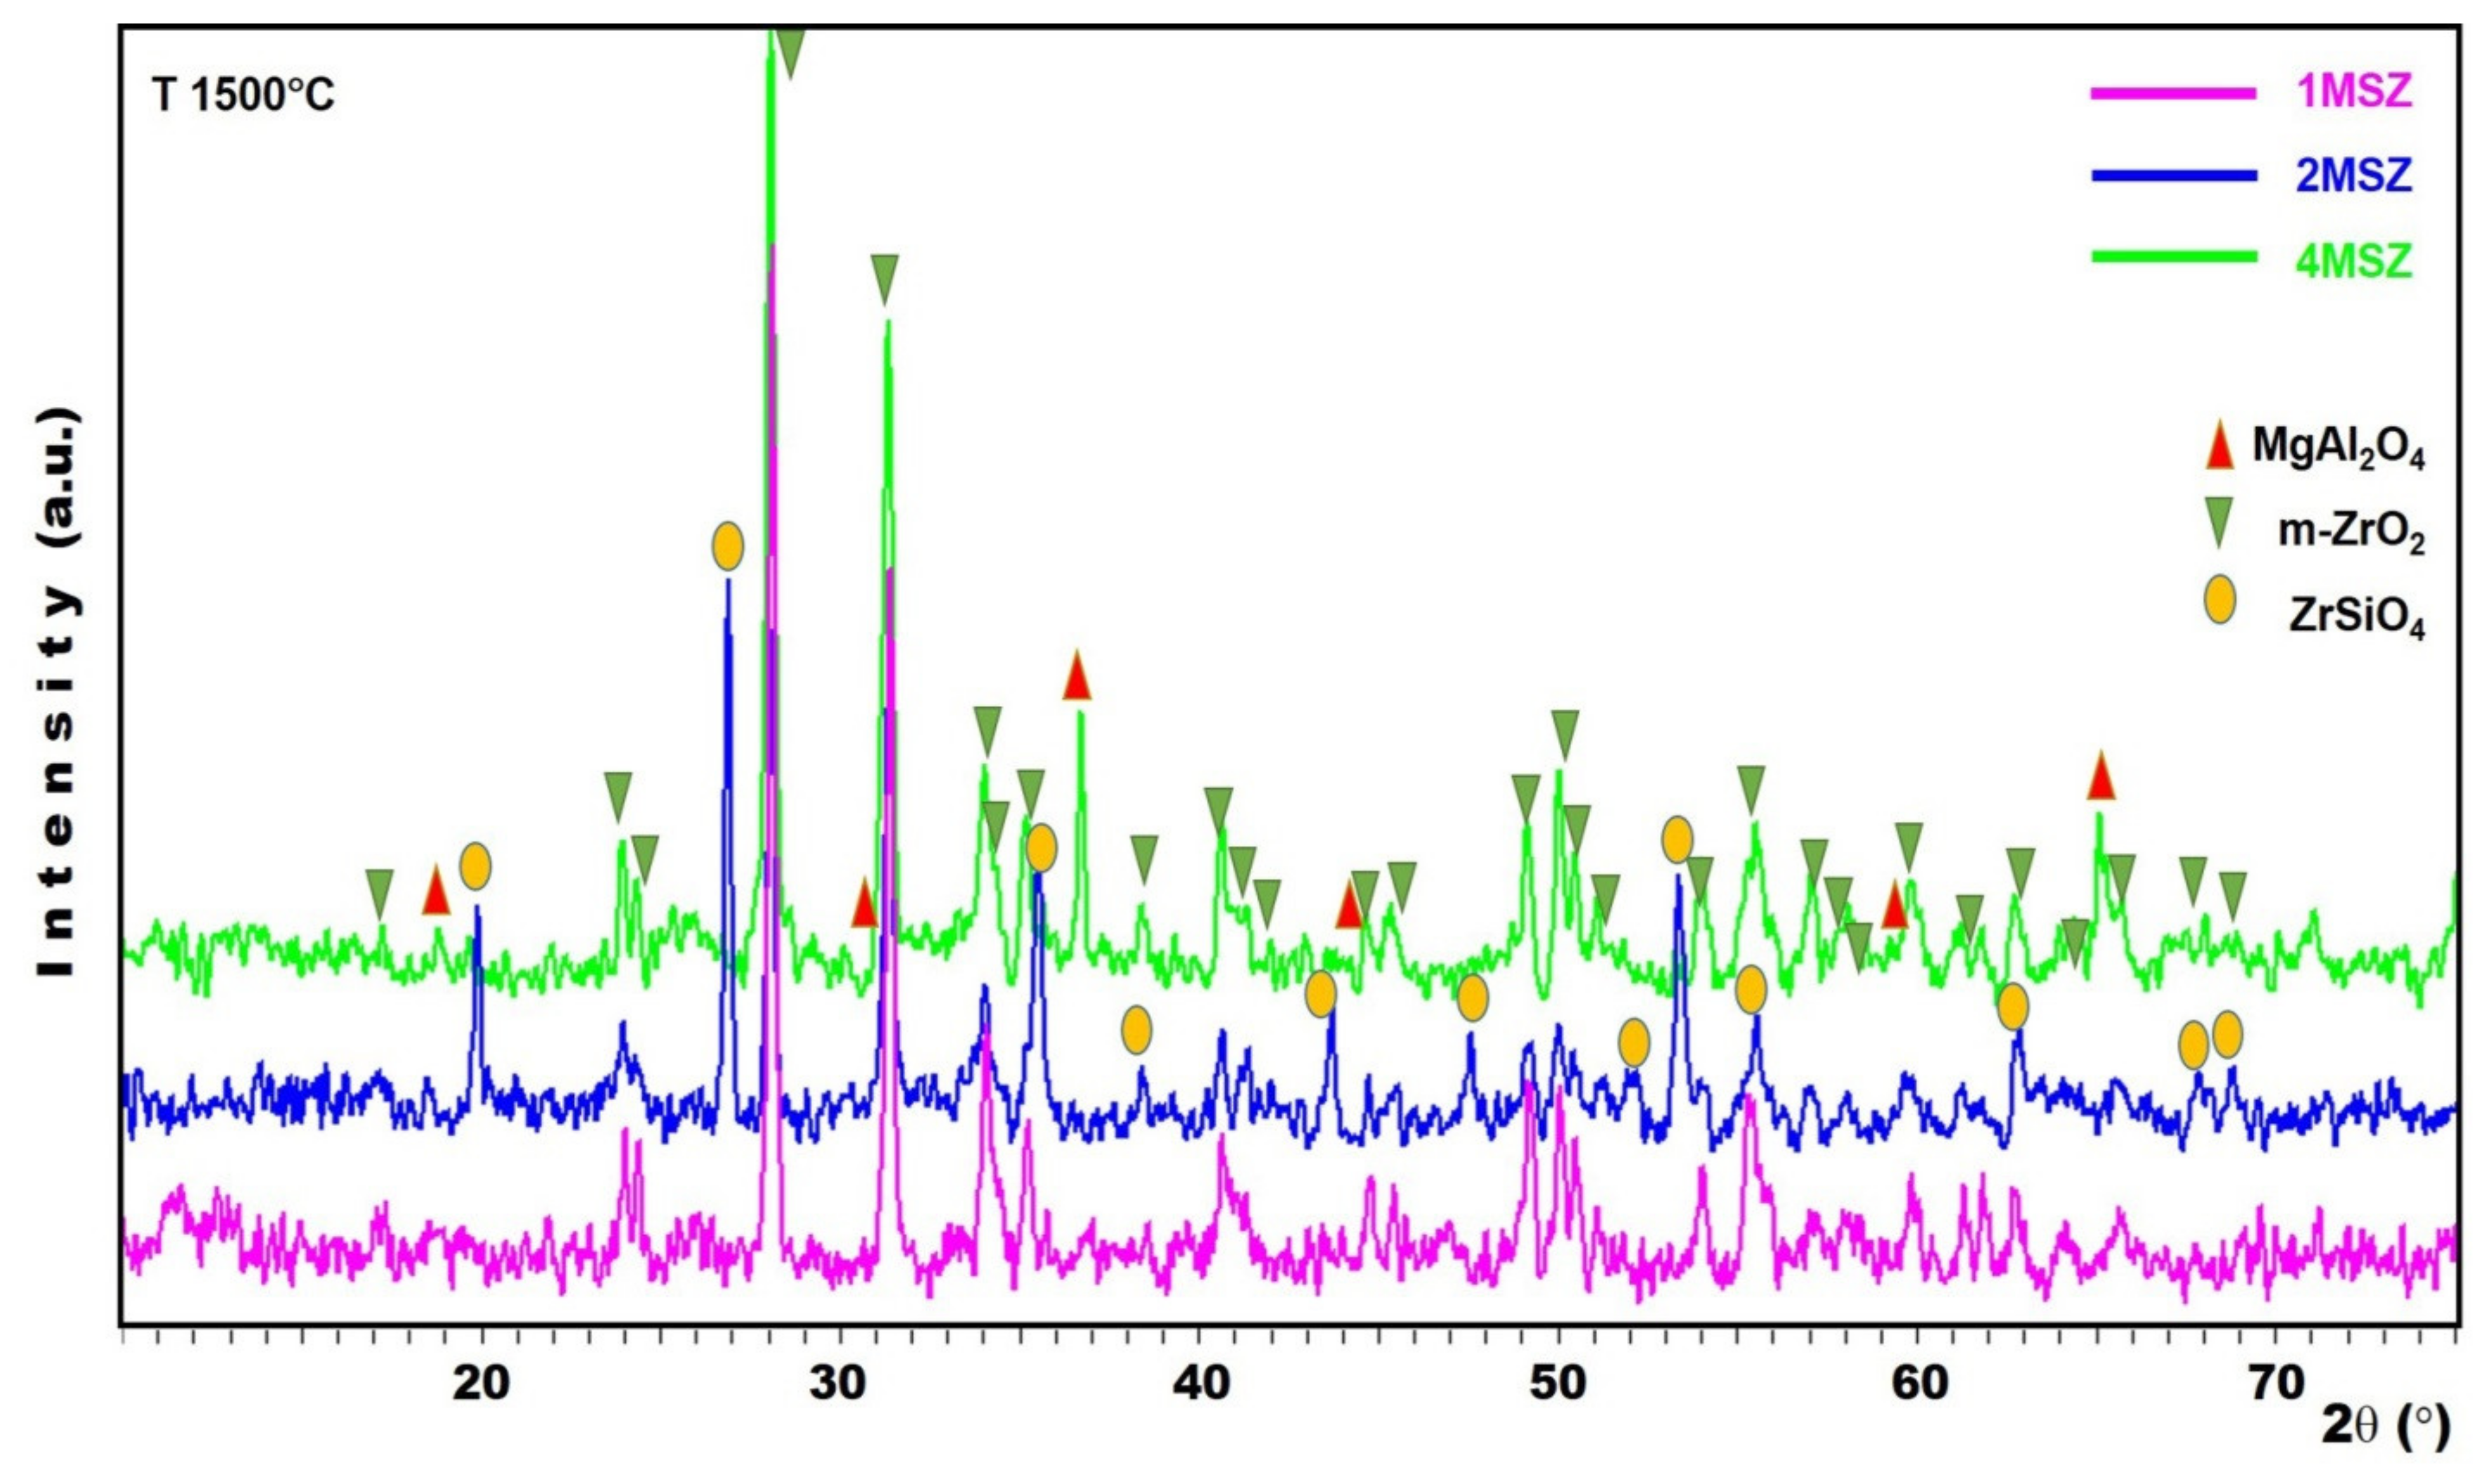
3.5. The Characteristics of the Sintered MSZ Samples at 1500 °C

Further investigation was conducted on the sintered MSZ samples at 1500 °C including mineralogy, density, porosity, and water adsorption properties. Figure 6 demonstrates the mineralogy characteristics of MSZ samples at 1500 °C analyzed by an X-ray diffractometer. Unusual and diverse XRD patterns are shown by each MSZ sample. 1MSZ shows only the pure monoclinic ZrO2, and the other phases that include MgO or zircon are not detected in the sample. Meanwhile, 2MSZ indicates the presence of the monoclinic ZrO2 and zircon phases. The more bizarre XRD pattern is shown by 4MSZ, whereby in addition to showing the presence of a monoclinic phase, it also displays the presence of the MgAl2O4 spinel phase.
This unwanted phase must be produced by the reaction between MgO and Al2O3 that originated from zircon-based zirconium hydroxides. Table 3 presents some physical properties such density, porosity, and water adsorption according to the ASTM C-20 method. However, in this study, the results of the ASTM C-20 measurement on the sintered MSZ samples cannot be compared because of the mineral phase diversity in MSZ samples.
Overall, further study and analysis is considered important to improve the current results. The biggest concern in this study is the local zircon-based zirconium hydroxide used as the ZrO2 precursor. The ZrO2 precursors must be washed with cool and hot water then pressed with a filter press to remove impurities. The initial treatment of the ZrO2 precursor must be highlighted in the next study to avoid or to prevent the occurrence of the unusual phenomena.

4. Conclusions

Magnesia partially stabilized zirconia was prepared from local zircon-based zirconium hydroxides using PEG as a template. The MgO concentration varied from 1 to 4 wt% ZrO2. The zirconium hydroxide precursor contains 89.52 wt% ZrO2 and exhibits a pure monoclinic phase at 1000 °C. Meanwhile, the tetragonal and the monoclinic phases form in all MSZ samples at a temperature of 800–1000 °C. The ZrO2 morphologies exhibit spherical-like shapes with elongated agglomeration at 800 °C. The addition of PEG during synthesis results in the elongated particles of MSZ microstructures. In addition, the average particle sizes of the final product are close to 20 nm and are less than 50 nm. At a sintering temperature of 1500 °C, MSZ samples show the monoclinic phase of ZrO2 and densities in the range of 3.95–4.14 g/cm3.

Author Contributions

Conceptualization, R.S.; formal analysis, R.B.W. and R.S.; funding acquisition, K.W., E.M. and H.H.; investigation, R.S.; methodology, R.B.W., I.R. and R.S.; project administration, R.B.W., K.W., E.M. and H.H.; Resources, R.B.W., I.R., K.W., E.M. and H.H.; supervision, R.S.; writing—original draft, R.B.W., I.R. and R.S.; writing—review and editing, R.S. All authors have read and agreed to the published version of the manuscript.

Funding

This work was supported by the 2020 RISPRO Grant SK No.32/LPDP/2020 from Indonesia Endowment Fund for Education (LPDP), the Ministry of Finance and the 2020 Development of Industrial Technology and Policy DIPA from Center for Ceramics, the Ministry of Industry, the Republic of Indonesia.

Data Availability Statement

Not applicable.

Conflicts of Interest

The authors declare no conflict of interest.

References

  1. Gankhuyag, S.; Bae, D.S. Effect of pH Values on the Formation of Magnesia Doped Zirconia by Ball-Mill Assisted Co-precipitation Method. J. Phys. Sci. Appl. 2016, 6, 31–36. [Google Scholar]
  2. Ali, S.A.; Karthigeyan, S.; Deivanai, M.; Mani, R. Zirconia: Properties and Application—a Review. Pak. Oral Dent. J. 2014, 34, 178–183. [Google Scholar]
  3. Gauna, M.R.; Conconi, M.S.; Gomez, S.; Suárez, G.; Aglietti, E.F.; Rendtorff, N.M. Monoclinic-tetragonal Zirconia Quantification of Commercial Nanopowder Mixtures by XRD and DTA. Ceram. Silikaty 2015, 50, 318–325. [Google Scholar]
  4. Shukla, S.; Seal, S. Mechanisms of Room Temperature Metastable Tetragonal Phase Stabilisation in Zirconia. Int. Mater. Rev. 2005, 50, 45–64. [Google Scholar] [CrossRef]
  5. Maridurai, T.; Balaji, D.; Sagadevan, S. Synthesis and Characterization of Yttrium Stabilized Zirconia Nanoparticles. Mater. Res. 2016, 19, 812–816. [Google Scholar] [CrossRef] [Green Version]
  6. Ghani, N.A.A.; Ghani, Z.A.; Ismail, Y.M.B.; Syariff, K.A.; Mat, A.N.C.; Ariffin, Z.; Liszen, T.; Noor, A.F.M. Non-aqueous sol-gel derived calcia partially stabilized zirconia: Synthesis and characterizations. Malays. J. Microsc. 2020, 16, 67–74. [Google Scholar]
  7. Davar, F.; Shayan, N.; Najafabadi, A.H.; Sabaghi, V.; Hasani, S. Development of ZrO2-MgO Nanocomposite powders by the modified sol-gel method. Int. J. Appl. Ceram. Technol. 2017, 14, 211–219. [Google Scholar] [CrossRef]
  8. Septawendar, R.; Sunendar, B.; Suhanda, S. Penyiapan Nanopartikel Zirkonia Terstabilkan Magnesia (Mg-PSZ) pada Suhu Kalsinasi Rendah dengan Metode Gel Koloidal. J. Keramik dan Gelas Indones. 2012, 21, 44–59. [Google Scholar]
  9. Narayanan, K.; Sakthivel, C.; Prabha, I. MgO–ZrO2 Mixed Nanocomposites: Fabrication Methods and Applications. Mater. Today Sustain. 2019, 3, 100007. [Google Scholar]
  10. Judes, J.; Kamaraj, V. Study on Process Development and Property Evaluation of Sol-Gel Derived Magnesia Stabilized Zirconia Minispheres. Mater. Sci. Pol. 2014, 32, 145–156. [Google Scholar] [CrossRef] [Green Version]
  11. Xia, J.; Li, C.; Wang, Z.; Jiang, D.; Li, Q. Preparation of MgO-Partially Stabilized Zirconia Nano-powder by Coprecipitation Pressing. Key Eng. Mater. 2012, 492, 89–92. [Google Scholar] [CrossRef]
  12. Mirtaleb, A.H.; Mamoory, R.S. Enhanced Thermoluminescence of Magnesia Doped Zirconia Nanoparticles Expose to UV/beta Irradiation. Nanotechnology 2020, 31, 115601. [Google Scholar] [CrossRef]
  13. Abi, C.B.E.; Yazici, E.G. Effects of Magnesium Chloride Addition on Stabilization Zirconia. Acad. J. Sci. 2014, 3, 177–185. [Google Scholar]
  14. Zhao, L.; Yao, S.; Li, Y.; Zhao, Z.; Xue, Q. Effects of Calcium Oxide and Magnesium Oxide Stabilizing Agents on the Critical Transformation Size of Tetragonal Zirconia. Mater. Sci. Forum. 2019, 980, 15–24. [Google Scholar] [CrossRef]
  15. Septawendar, R.; Nurrudin, A.; Maryani, E.; Suhanda, S. Synthesis of Zirconia 1-D Nanomaterials from Local Zircon Based Zr(OH)4 Mediated by PEG-6000. Res. J. Chem. Environ. 2018, 22, 163–171. [Google Scholar]
  16. Riaz, S.; Bashir, M.; Naseem, S. Synthesis of Stabilized Zirconia Hollow Nanoparticles: Sugar as a Template. J. Sol Gel Sci. Technol. 2015, 74, 275–280. [Google Scholar] [CrossRef]
  17. Septawendar, R.; Purwasasmita, B.S.; Suhanda, S. Effect of Hydrolysis Catalyst NH4OH on the Preparation of Calcia Stabilized Zirconia with Sugar as a Masking Agent at Low Temperature. J. Aust. Ceram. Soc. 2013, 49, 101–108. [Google Scholar]
  18. Sofiyaningsih, N.; Suhanda, S.; Septawendar, R. Pengaruh Jenis Prekursor terhadap Karakteristik Mineralogi dan Mikrostruktur Zirkonia Nano dengan Metode Templat. J. Keramik dan Gelas Indones. 2020, 29, 45–56. [Google Scholar] [CrossRef]
  19. Septawendar, R.; Nuruddin, A.; Suhanda, S.; Asri, L.A.T.W.; Maryani, E.; Setiawan, A.R.; Purwasasmita, B.S. Synthesis of one-dimensional ZrO2 nanomaterials from Zr(OH)4 precursors assisted by glycols through a facile precursor-templating method. Mater. Res. Express. 2019, 6, 065037. [Google Scholar] [CrossRef]
  20. Heuer, C.; Storti, E.; Graule, T.; Aneziris, C.G. Electrospinning of Y2O3- and MgO-stabilized Zirconia Nanofibers and Characterization of the Evolving Phase Composition and Morphology During Thermal Treatment. Ceram. Int. 2020, 46, 12001–12008. [Google Scholar] [CrossRef]
  21. Septawendar, R.; Sutardi, S.; Karsono, U.; Sofiyaningsih, N. A Low-Cost, Facile Method on Production of Nano Zirconia and Silica from Local Zircon in a Large Scale Using a Sodium Carbonate Sintering Technology. J. Aust. Ceram. Soc. 2016, 52, 92–102. [Google Scholar]
  22. Septawendar, R.; Nuruddin, A.; Sutardi, S.; Maryani, E.; Asri, L.A.T.W.; Purwasasmita, B.S. Low-temperature metastable tetragonal zirconia nanoparticles (NpMTZ) synthesized from local zircon by a modified sodium carbonate sintering method. J. Aust. Ceram. Soc. 2018, 54, 643–654. [Google Scholar] [CrossRef]
  23. Pramono, E.; Utomo, S.B.; Wulandari, V.; Clegg, F. FTIR studies on The Effect of Concentration of Polyethylene Glycol on Polimerization of Shellac. J. Phys. Conf. Ser. 2016, 776, 776. [Google Scholar] [CrossRef]
  24. Pilarska, A.; Wysokowski, M.; Markiewicz, E.; Jesionowski, T. Synthesis of magnesium hydroxide and its calcinates by a precipitation method with the use of magnesium sulfate and poly(ethylene glycols). Powder Technol. 2013, 235, 148–157. [Google Scholar] [CrossRef]
  25. Ovalles, F.; Gallignani, M.; Rondón, R.; Brunetto, M.R.; Luna, R. Determination of Sulphate for Measuring Magnesium Sulphate in Pharmaceuticals by Flow Analysis-Fourier Transforms Infrared Spectroscopy. Lat. Am. J. Pharm. 2009, 28, 173–182. [Google Scholar]
  26. Zahir, M.H.; Rahman, M.M.; Irshad, K.; Rahman, M.M. Shape-Stabilized Phase Change Materials for Solar Energy Storage: MgO and Mg(OH)2 Mixed with Polyethylene Glycol. Nanomaterials 2019, 9, 1773. [Google Scholar] [CrossRef] [PubMed] [Green Version]
  27. Skoda, D.; Styskalik, A.; Moravec, Z.; Bezdicka, P.; Pinkas, J. Templated Non-Hydrolytic Synthesis of Mesoporous Zirconium Silicates and Their Catalytic Properties. J. Mater. Sci. 2015, 50, 3371–3382. [Google Scholar] [CrossRef]
Figure 1. XRD pattern of the calcined zirconium hydroxide (a); and the FT-IR spectra of zirconium hydroxides before and after calcination at 1000 °C (b).
Crystals 11 00635 g001
Figure 2. FT-IR spectrum of the as-synthesized MSZ samples in various MgO wt%.
Crystals 11 00635 g002
Figure 3. The XRD Diffractograms of all MSZ samples at elevated calcination temperatures. (A) 600 °C, (B) 800 °C and (C) 1000 °C.
Crystals 11 00635 g003
Figure 4. SEM micrographs of MSZ samples after calcination at 600 °C (A), 800 °C (B), and 1000 °C (C).
Crystals 11 00635 g004
Figure 5. TEM images of MSZ samples calcined at 600 °C, 800 °C and 1000 °C.
Crystals 11 00635 g005
Figure 6. The XRD diffractograms of the sintered MSZ samples at 1500 °C.
Crystals 11 00635 g006
Table 1. Semiquantitative result of XRF identification on the chemical composition of local zircon-based zirconium hydroxide calcined at 1000 °C.
CompoundZirconium Hydroxides at 1000 °C
wt%Std. Err
ZrO289.520.15
SiO23.260.09
Al2O31.340.06
Na2O1.270.06
HfO21.180.05
Fe2O30.7550.038
MoO30.4290.025
SO30.3190.016
CaO0.2240.011
Y2O30.1870.009
P2O50.1260.017
MgO0.1110.006
TiO20.09510.0047
ThO20.0650.026
Yb2O30.04410.0034
U3O80.03350.0056
Cr2O30.02430.0018
Er2O30.02420.0039
La2O30.02180.0035
K2O0.0240.0017
ZnO0.01780.0014
Sc2O30.01580.0017
Rest = 0.83 LOI
Table 2. The results of FT-IR identification on the as-synthesized MSZ samples.
Vibration Modes1MSA2MSZ4MSZ
Wavenumber (1/cm)
Zr–O, Mg–O (overlapped peaks)463, 416463, 424470, 440
Mg–OH375037503754
ν Si–O–Zr 949949949
δ SO42-601601601
δ CH PEG-60001396, 135013501350
δ CH2–PEG-6000146614661474
ν CH2–PEG-60002924, 28572924, 28572924, 2857
ν C–O–C PEG-6000110311111111
–OH on surface163616361628
–O–H2 (hydrogen bonding)3426, 32353426, 32353426, 3235
Table 3. Some physical properties of MSZ samples at 1500 °C.
CodeBulk Density, g/cm3Water Adsorption, %Porosity, %
4MSZ (1500) 4.143.4514.29
2MSZ (1500) 4.124.0516.67
1MSZ (1500) 3.954.1216.28
Publisher’s Note: MDPI stays neutral with regard to jurisdictional claims in published maps and institutional affiliations.

