Article

Evaluation of Glass Coatings with Various Silica Content Corrosion in a 0.5 M HCl Water Solution

1
Tubular Goods Research Institute of CNPC, Xi’an 710077, China
2
State Key Laboratory of Performance and Structural Safety for Petroleum Tubular Goods and Equipment Materials, Xi’an 710077, China
3
CNPC Bomco Drilling & Production Equipment Co. LTD., Guanghan 618300, China
4
Shenyang National Laboratory for Materials Science, Northeastern University, Shenyang 110819, China
*
Author to whom correspondence should be addressed.
Crystals 2021, 11(4), 346; https://doi.org/10.3390/cryst11040346
Submission received: 11 March 2021 / Revised: 23 March 2021 / Accepted: 26 March 2021 / Published: 28 March 2021
(This article belongs to the Special Issue Nanocrystalline Coating Alloy)

Abstract

:
Two enamel coatings with a high and a low silica content were prepared on 35CrMo steels via vacuum firing. Their corrosion behavior in a 0.5 M HCl solution including corrosion kinetics, microstructures and electrochemistry performance were studied in comparison with uncoated steels. The results show that catastrophic corrosion occurred for uncoated steels while enamel coatings significantly decreased the corrosion rate. Enamel coatings with a high silica content exhibited the best corrosion resistance against hydrochloric acid due to their highly connected silicate network, which inhibited the leaching process of alkali metals in the acid solution. The corrosion inhibition efficiency for enamel containing a high silica content reached a maximum of 94.3%.

1. Introduction

Carbon steels have various applications in many kinds of fields due to their superior mechanical strength [1,2]. As a few significant fields of their application are acid pickling such as the oil industry and petrochemical processes (during which strong acid solutions, particularly hydrochloric acid, are always used [3,4,5,6,7]), metallic components suffer from severe corrosion and their service lives are reduced significantly. Therefore, much attention has been paid to looking for efficient approaches to improving the corrosion resistance of metallic components, particularly carbon steels in an acidic medium.
Many methods for protecting carbon steels against acid corrosion are available such as surface coating techniques, e.g., metallic oxide films, corrosion inhibitors and electrochemical sacrificial anodic protection [8,9,10]. Among them, a chemical inhibitor is always utilized to retard the acid corrosion of carbon steels effectively [11,12]. Work done by Saeed [11] reported that the corrosion resistance of carbon steels was significantly improved in a sulfuric acid medium by a bicyclic isoxazolidines inhibitor. Berrissoul et al. [13] used Lavandula mairei, a novel kind of corrosion inhibitor for mild steel, in an HCl solution and indicated that its inhibitory effect could reach up to 92% maximally. Meanwhile, metallic oxide coatings prepared by the sol-gel method such as ZrO2 [14], SnO2 [15] and SiO2 [16] also have shown a superior acid corrosion resistance. Ates et al [15] reported that SnO2 prepared by the sol-gel method was a suitable coating that could protect mild steel from corrosion in an HCl solution. However, generally, regardless of the sol-gel solutions or most of the corrosion inhibitors, they are expensive synthetic chemicals and may contaminate the environment. Therefore, non-toxicity and eco-friendly aspects are always required for environmental concerns.
Enamel coatings possess a superior corrosion resistance against most corrosive media (salt [17], gas [18], molten aluminum [19], saline solution [20], etc.) owing to their inertness and compactness with the underlying matrix. In addition, the preparation process and raw material of enamel coatings are eco-friendly and cost-effective [21]. Some previous research is available on the corrosion behavior of enamel coatings in an acid solution but most of them focused on the corrosion performance of titanium enamel for steel cookware in a light acetic acid solution [22,23,24,25]. Few investigations have been conducted on the corrosion mechanism of enamel in strong hydrochloric acid.
Silica has been reported to have a significant effect on the microstructure and acid corrosion resistance of enamel coatings [26,27,28]. However, the relationship between the silica content and corrosion resistance in strong acid has not been reported yet. Therefore, two enamel coatings with a high and a low silica content were designed and prepared on carbon steels. As carbon within the matrix may produce a volatile gas and cause enamel coatings porosity during the coating preparation, this can lead to acid easily invading inward and a rapid degradation of the coating. Therefore, in this study, enamel coatings were fired in a vacuum. The corrosion behavior, i.e., corrosion kinetics, microstructures and the electrochemistry performance of the two enamels in a 0.5 M HCl solution, was investigated in comparison with that of the bare carbon steel.

2. Materials and Methods

2.1. Sample Preparation

A typical carbon steel, 35CrMo (composition: C: 0.32–0.40, Mn: 0.4–0.7, Si: 0.17–0.37, Cr: 0.8–1.1, Mo: 0.15–0.25, Ni: < 0.03, Cu: < 0.03 and balanced Fe, wt.%), was used as the substrate alloy. Test samples of approximate dimensions 15 mm × 15 mm × 1.5 mm were cut from the pipe using a spark discharge machine. The bare samples were ground with a final 400 mesh SiC sandpaper and then blasted with a 200 mesh glass ball. They were then cleaned ultrasonically in acetone and ethanol for 30 min, respectively.
The nominal composition of the enamel is presented in Table 1. The enamels containing the high and the low silica contents were named as HS and LS, respectively hereafter. The enamel frits were gained first by melting at a high temperature followed by quenching in water. After that, the enamel powder was obtained by milling the frits. The preparation method of the enamel powder has been previously described in detail elsewhere [29].
The enamel powder was then blended with ethanol in a ratio of 10 g enamel powder to 150 mL ethanol to form a slurry. The enamel coating was prepared by air spraying onto the prepared steel. In order to obtain a uniform enamel coating, spraying was carried out in the following order: from left to right, from right to left, from top to bottom, from bottom to top. These four times of spray were defined as a spray cycle. To get ~90 μm thick single layer enamels, 40 cycles of spray were carried out for each side of the sample. It was then baked at 70 °C for 10 min. The coated sample was then taken into the furnace and heated in a vacuum (<6 × 10⁻² Pa) at 750 °C for 2 min for the LS and 880 °C for 10 min for the HS, respectively. Both enamel coatings were approximately 100 μm in thickness. It should be noted here that the high content of silica decreases the flowability of the enamel coating and increases the firing temperature. Therefore, the chemical composition of enamel coatings should not be adjusted within a large scale taking the firing process into consideration.

2.2. Corrosion Test

To avoid hydrochloric acid invading inside the hanging hole in priority and leading to a false mass change, only the bottom half of the test samples was immersed in 0.5 M HCl solution in a Teflon container at 30 °C. Samples were taken out from the container after 24 h corrosion and flushed by deionized water for 1 min to remove the residual solution on their surface. The specimens then were dried using a blow drier and weighed using an electronic balance with a sensitivity of 10−5 g (Sartorius BP211D). The above steps constituted a cycle of acid corrosion. The acid solution used in the former cycle was replaced by a fresh one before starting the next cycle of the corrosion test. Three parallel samples of each coating were used to acquire the average value of the mass change.

2.3. Characterization

Surface and cross-sectional morphologies were observed using a field-emission scanning electron microscope (SEM, Inspect F50, FEI Co., Hillsboro, OR, USA) equipped with an energy dispersive X-ray spectrometer (EDS, X-Max, Oxford Instruments Co., Oxford, UK). To observe the surface morphology, a second electron (SE) mode was adopted while the back-scattered electron (BSE) mode was utilized to characterize the cross-sectional morphologies of the coating samples.

2.4. Electrochemical Measurements

The electrochemical measurements were carried out using a CHI660E Electrochemical Analyzer under computer control. An electrochemical cell with a three-electrode configuration consisting of the test sample electrode, a platinum sheet (with a 2.25 cm2 surface area) auxiliary electrode and a saturated calomel electrode (SCE) as a reference were used. All potentials were measured with respect to this reference electrode. The uncoated and enamel coated test samples were exposed to the 0.5 M HCl solution at 30 °C. The open circuit potential (OCP) was recorded as a functional of time up to 300 s. As a result, the Eocp, which corresponded with a steady-state OCP, was obtained. Electrochemical impedance spectroscopy (EIS) and potentiodynamic polarization measurements were carried out after establishing a steady-state OCP. The polarization curves were potentiodynamically obtained in the potential ranges from –300 mV to +600 mV based on the Eocp with a scan rate of 1 mV/s. The EIS experiments were conducted in the frequency range from 100 kHz to 0.01 Hz at the Eocp with a perturbation amplitude of 5 mV peak to peak.

3. Results

3.1. Vacuum Firing

Figure 1 shows the initial cross-sectional morphologies of the HS firing in air and in a vacuum at 880 °C. It can be observed from Figure 1a that a large number of bubbles were scattered within the enamel coating while the number of bubbles decreased dramatically when the enamel was fired in a vacuum (Figure 1b). This is mainly because the low oxygen partial pressure in the vacuum significantly inhibited the oxidation of carbon from the matrix. The content of carbon in the 35CrMo steel ranged from 0.32 wt.% to 0.40 wt.%, belonging to medium carbon steel. During the coating preparation when the steel was fired in air at 880 °C, the carbon in the steel was oxidized to produce gas; some of the gas could not escape out due to the coverage of enamel and was trapped in the enamel. By contrast, the low oxygen partial pressure in the vacuum suppressed the decarburization reaction making the enamel layer almost free of bubbles.
It should be noted that vacuum firing provides a feasible method of applying enamel on steels that produce volatile gas at relatively high temperatures especially for high-carbon steels and cast iron. All of the enamel coated samples for corrosion were fired in a vacuum to avoid the acid invading through the bubbles and affecting the experimental validity.

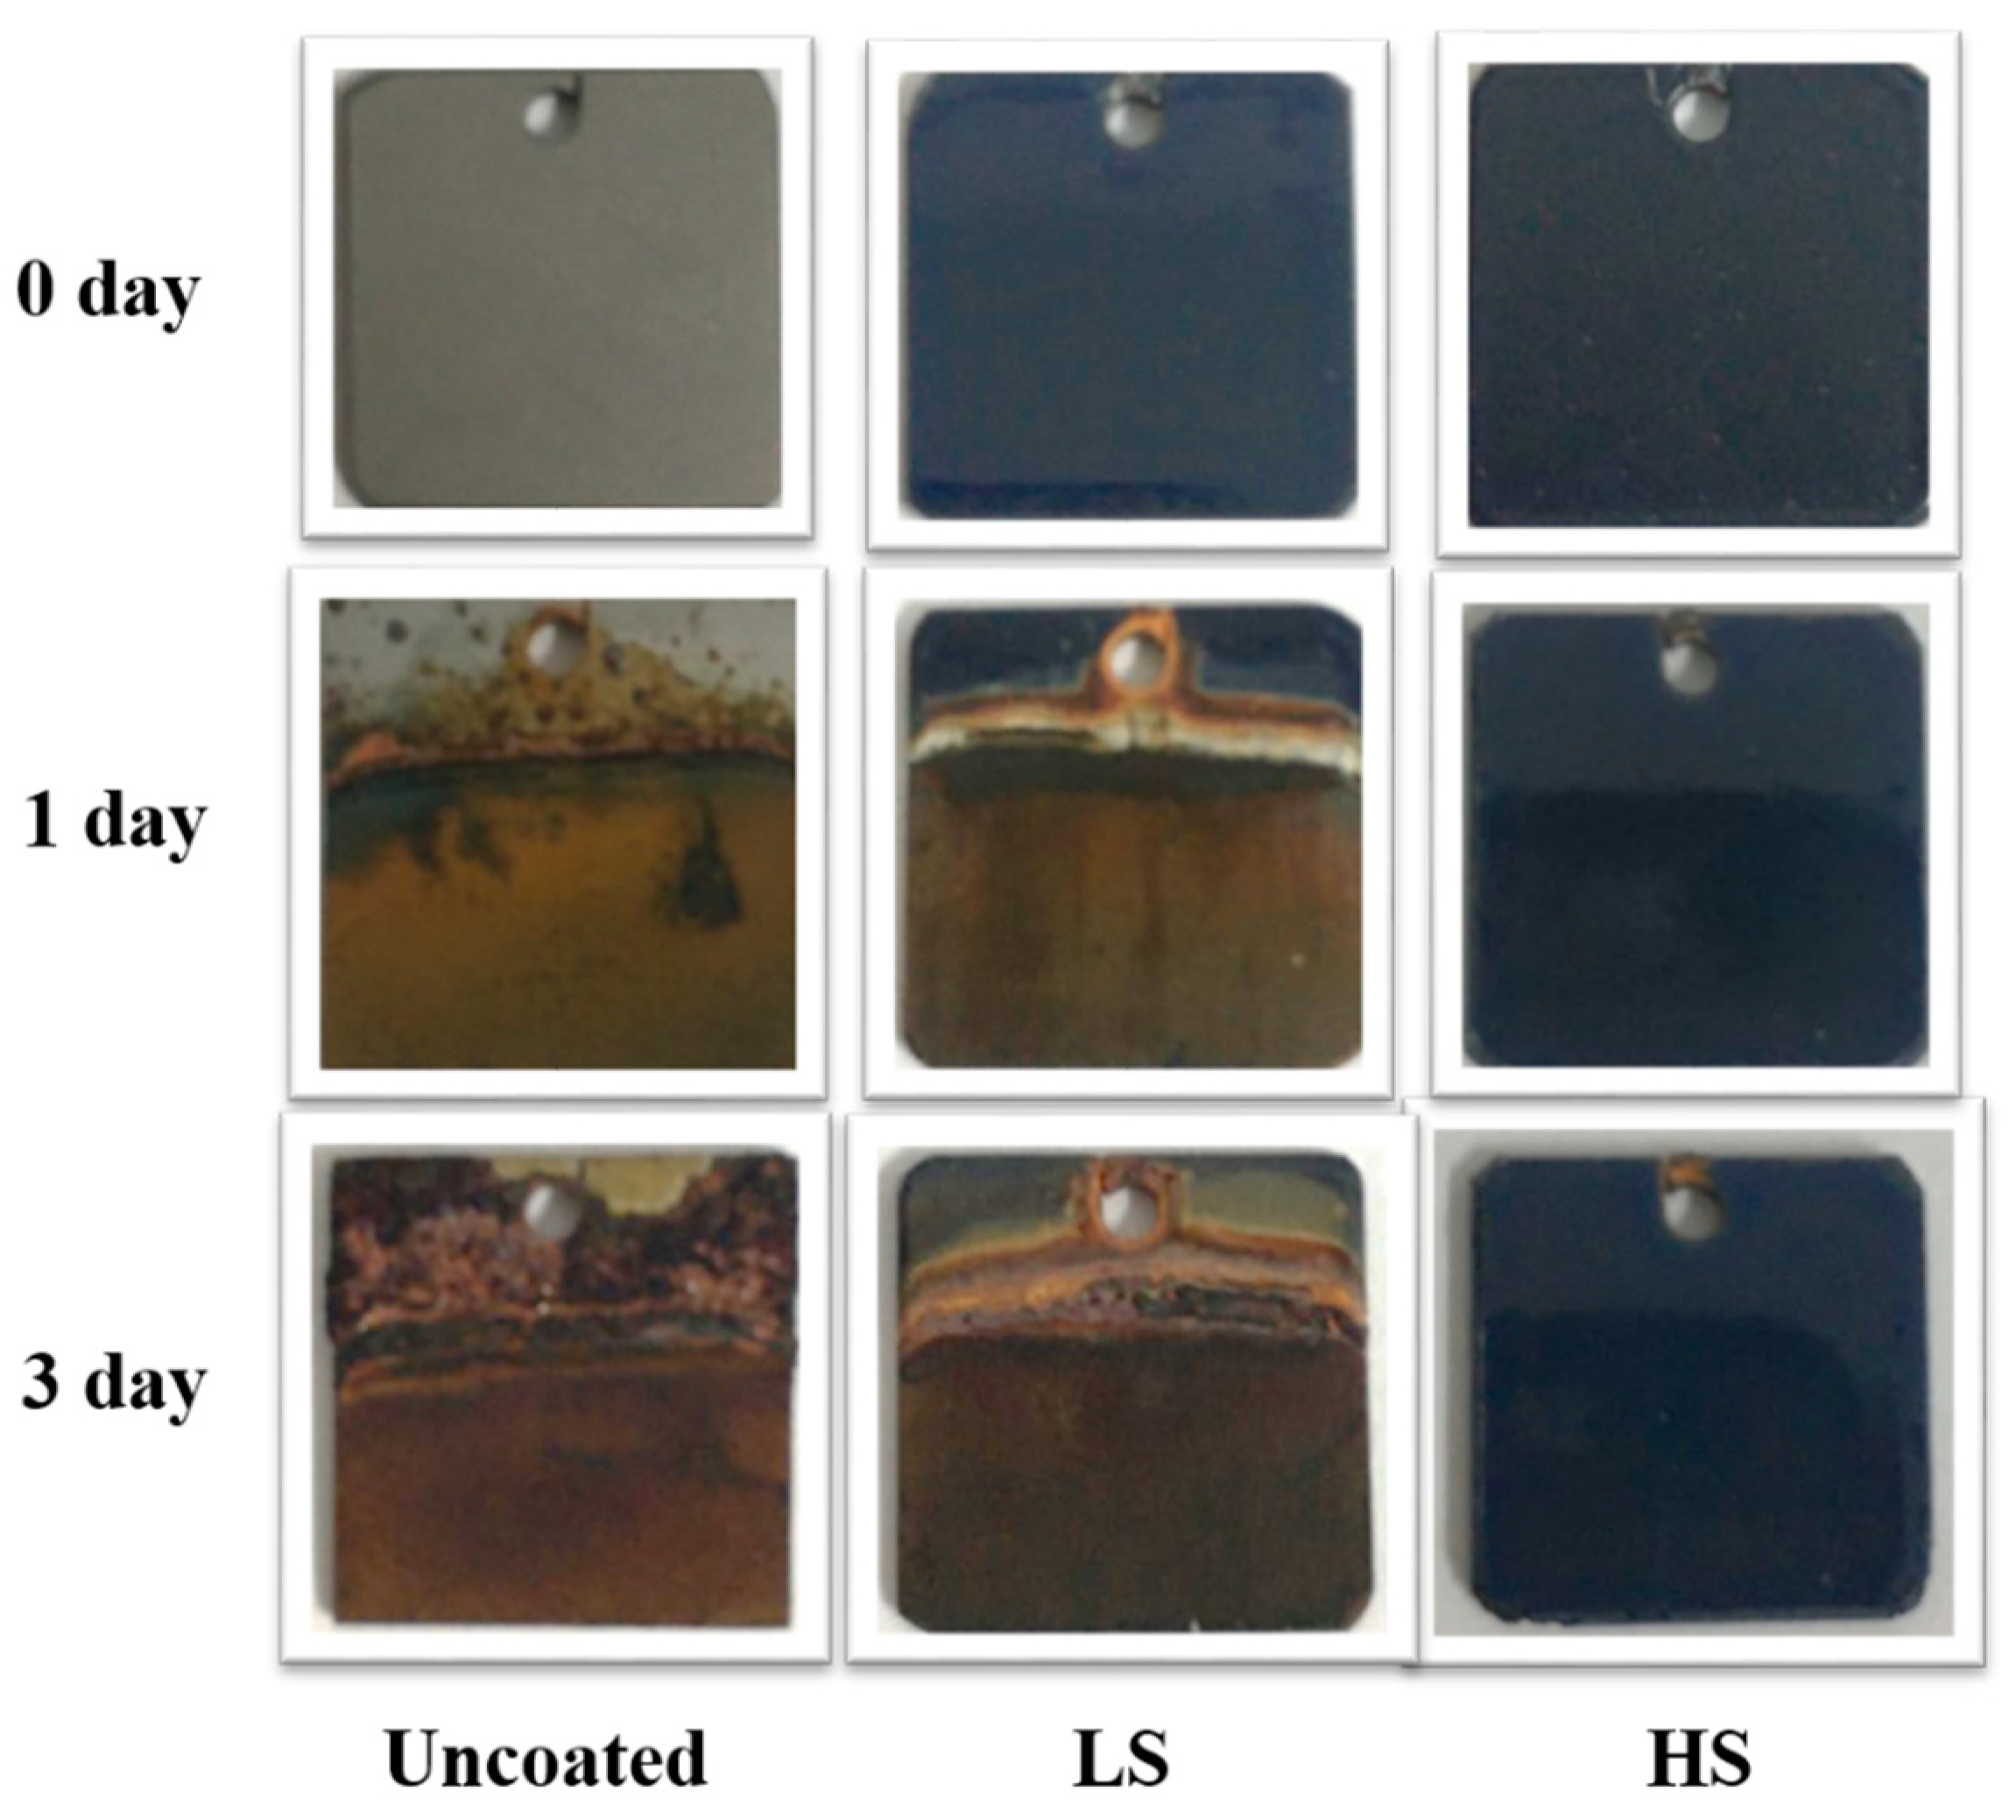
3.2. Macro Morphology and Corrosion Kinetics

Figure 2 shows the macro morphologies of the three test samples before and after corrosion in the 0.5 M HCl solution for different days. Before corrosion (0 d), the uncoated sample displayed the original metallic frosted color due to sand blasting. While both enamels were blue, the HS showed a little darker than the LS due to the compositional difference. After one day of corrosion, red rust was formed on the surface of the uncoated samples. The LS lost its gloss and its color faded from blue to red. With the corrosion time increased to three days, the uncoated sample suffered from disastrous corrosion; the red rust grew to be looser and thicker. The original blue color of the LS faded away completely regardless of the immersed or non-immersed part. By contrast, the HS maintained its gloss and only the color of the immersed part faded a little during the entire corrosion test.
Figure 3 shows the corrosion kinetics of the three test samples in the 0.5 M HCl solution. The mass loss of the uncoated sample was catastrophic and much larger than that of the two enamel coated samples. It obeyed a linear relationship with the slope k = −2.87 mg/(cm2·d). The LS lost its weight slowly following a linear relationship as well within the initial one day corrosion but became faster with further increasing corrosion time. In the case of the HS, its weight loss was the lowest and it was difficult to define clearly the corrosion law. After corrosion for three days, the total mass loss of the uncoated, LS and HS samples was 8.38 mg/cm2, 4.30 mg/cm2 and 0.10 mg/cm2, respectively.

3.3. Surface and Cross-Sectional Microstructures

Figure 4 shows the XRD patterns of the three test samples after corrosion for three days. It was observed that the uncoated sample was mainly composed of a matrix as most of the corrosion products had been dissolved into the acid. As for the LS sample, a broad peak appearing around 25° indexed the existence of an amorphous phase. As the outer enamel layer was corroded, diffraction peaks corresponding with the matrix were detected at around 45° and 81°. In contrast, the HS sample still consisted of the amorphous phase exclusively with a little matrix phase detected. Figure 5 shows the surface morphologies of the three test samples after corrosion in the 0.5 M HCl solution for three days. It can be observed from Figure 5a that a substantial number of corrosion holes formed at the surface of the uncoated sample. The specimen surface was pretty rough and strongly damaged due to the excessive dissolution of the steel in the presence of H+ and Cl ions. Similarly, the surface of the LS was also unsmoothed with a large number of spallation sites (Figure 5b). In contrast, neither cracks nor spallation were observed on the surface of the HS, which retained its superior protection against acid corrosion.
Figure 6a–c shows corresponding cross-sectional morphologies of the three test samples after corrosion in the 0.5 M HCl solution for three days. A porous and unprotected Fe2O3 layer was observed to form at the surface of the bare sample, as shown in Figure 6a. For the LS, the external enamel layer remained covered on the matrix but there were a few vertical and horizontal cracks within it (Figure 6b), which have previously been reported and normally named as the leached layer (LL) [30,31]. The contrast difference between the external layer and inlayer was obvious. An EDS analysis indicated that the external layer was in the absence of an alkali metal, e.g., Na, K, Ca, Mg, while Si was rich at the outer layer, as shown in Table 2. It is clear that the leaching of elements broke the Si–O network of the enamel layer, which led to cracking and spalling. This process of leaching-cracking-spalling occurred successively until the LS was reduced to merely 20 μm thick. In the case of the HS, the enamel layer remained integrated and adhered well with the underlying matrix (Figure 6c). Its thickness remained almost unchanged after three days of immersion. From the high-magnification SEM images (Figure 6d), a gray layer with approximately 1 μm in thickness was observed at the outermost part of the corroded HS. This gray layer is normally named as the gel layer (GL), which is observed typically at the surface of other corroded glass systems [26,32,33,34]. Meanwhile, it could be seen from the corresponding line profile (Figure 6e) that there was little difference in the composition of the whole enamel, i.e., elements leaching from the Si–O network of the HS were largely retarded.

3.4. Electrochemical Performance

3.4.1. Electrochemical Impedance Spectroscopy

Figure 7 shows the Nyquist plots of the uncoated, LS and HS samples in the 0.5M HCl solution. Generally, all of the plots exhibited single capacitive semi-circles [35,36]. Based on the curves, the corrosion process was mainly charge transfer controlled. The total diameter of the Nyquist plots, which determined the polarization resistance (Rp), considerably increased when the sample was coated by enamel and with the increase of the silica content. Correspondingly, the polarization resistance was the lowest for the uncoated sample while it reached the highest value for the HS, which indicated a great enhancement of the corrosion resistance achieved by the HS.
Bode and phase angle plots for three test samples in the 0.5 M HCl solution are presented in Figure 8a,b, respectively. The bode of the HS reached the maximum value while that of the uncoated sample was the minimum. Similarly, the phase angle, which referred to the formation of an effective protection layer on the surface [37], was also the highest for the HS and lowest for the uncoated sample, indicating that the most homogeneous surface with a good corrosion resistance was formed on the HS. These results were also consistent with the Nyquist curves.
Equivalent circuits were used to interpret the EIS data quantitatively (Figure 9). The EIS spectrum of the uncoated sample could be simulated and corresponded well by an impedance plot that had one time constant (Figure 9a). In the equivalent circuit, Rs represented the solution resistance, R1 was the charge transfer resistance at the metal/electrolyte interface and CPE1 was the constant phase element (CPE) that was used to replace the ideal double layer capacitance. The impedance function of the CPE was as follows [38]:
Z C P E = 1 Y 0 ( j w ) n
where Y0 was the admittance of the CPE. j2 = −1 was defined as an imaginary number and ω was the angular frequency. n was a CPE exponent determining the phase shift that could be utilized as a gauge of roughness or heterogeneity of the surface (0 < n < 1).
In comparison, two time constants were used to simulate the EIS data obtained from the enamel coated samples [39]. The LS and HS were well fitted to the equivalent circuit, as shown in Figure 9b. As mentioned above, Rs represented the solution resistance and R1 was the coating resistance, which was deeply influenced by defects (such as flaws and pores). CPE1 was the coating capacitance. R2 and L corresponded with the charge transfer resistance and the inductance at the coating/substrate interface, respectively.
The polarization resistance, as mentioned above, was defined as the difference between the intersection of the real axis and the impedance in the case of an infinitesimal and infinite frequency. The reciprocal of Rp was proportional to the corrosion rate, which was an important parameter. The disturbing alternating current signal could be interpreted as the direct current signal when the frequency became infinitesimal. In this case, the capacitance and the inductance could be regarded as an insulating component and a zero-resistance component, respectively. Therefore, for the uncoated sample, Rp was equal to R1 while for the enamel coated samples, the reciprocal of Rp could be expressed by the following equation:
R p = R 1 R 2 R 1 + R 2 .
The impedance parameters are presented in Table 3. The value of Rs, Y0-CPE1, R1, R2, L and Rp, could be used to determine the corrosion resistance of the three test samples. It could be seen that the uncoated sample had a polarization resistance of (66 ± 1) Ω·cm−2 while for the enamel coated samples, the polarization resistance improved significantly than that of the uncoated samples with (960 ± 5) Ω cm−2 for the LS and (1178 ± 23) Ω cm−2 for the HS, respectively, suggesting that the enamel coatings could markedly enhance the corrosion resistance of the 35CrMo steel. In particular, the HS showed the highest corrosion resistance among the three test samples. Moreover, the L increased from 2502 ± 14 H cm−2 to 3718 ± 34 H cm−2 when the silica content increased from LS to HS. According to the EIS theory, the increase of L implied the increase of the phase angle of the inductive loop.

3.4.2. Potentiodynamic Polarization Measurements

The polarization curves of the three test samples in the 0.5 M HCl solution are exhibited in Figure 10. The study of these polarization measurements allowed us to have information related to the cathodic and anodic reactions. The electrochemical parameters including the potential of corrosion (Ecorr), corrosion current density (icor), anodic Tafel slope (βa) and cathodic Tafel slope (βc) were obtained and are given in Table 4. Using polarization curves and electrochemical diagrams, the percentage of inhibition efficiency η Tafel was obtained following Equation (3), as listed in Table 4:
η Tafel = ( i cor 0 i cor i cor 0 ) × 100
where i cor 0 and i cor were, respectively, current densities without and with enamel coatings.
As can be seen from Figure 10 and Table 4, it was clear that the value of icor was much smaller for enamel compared with the uncoated samples and decreased with the increase of the silica content. The most decreased corrosion current density belonged to the HS with 0.007 mA/cm2. Correspondingly, based on Equation (3), the inhibition efficiency raised up with an increase in the concentration of silica due to the decrease in the corrosion current density, which reached the highest value (94.3%) for the HS. The cathodic curves gave rise to parallel Tafel lines, meaning that the evolution of the hydrogen was activation controlled [40]. A reduction in both anodic Tafel slopes was observed for the sample coated by enamel coatings, which indicated that the enamel decreased the anodic metal dissolution. It should be noted that there was no difference in the cathodic Tafel slope between the LS and the HS, implying that the silica concentration did not affect the mechanism of the hydrogen evolution reaction. The decrease of the anodic Tafel slope could be interpreted as the prevention of anodic dissolution due to the formation of a protective enamel layer on the surface [41].

4. Discussion

As was made clear, the corrosion resistance of carbon steels against hydrochloric acid was notably improved by glass coatings and strongly related to the silica content in the glass. All of the results regardless of corrosion kinetics, microstructure evaluation or electrochemical performance corroborated the idea that the HS had the best inhibition efficiency against the attack of corrosive species such as dissolved oxygen and chloride ions. Therefore, the discussion mainly focused on the effect of the silica content within the enamel on corrosion resistance.
As shown in Figure 3, the total weight loss reduced dramatically by 97.6% when the Si content increased by 10 wt% from the LS to the HS. Combined with their microstructure evolutions and elemental distributions, the reason for the difference of the corrosion resistance between the LS and the HS could be speculated to be the distinction in leachability of the alkali metal in the HCl solution, which was directly determined by the compactness of the silica network. In order to shed light on the degree of the network connectivity of the LS and the HS during the corrosion test, Raman spectra of the LS and the HS before and after corrosion for different days were obtained and are shown in Figure 11. It can be seen from Figure 11a that the characteristic peaks of the LS were mainly at ∼330 cm−1 and ∼950 cm−1 before corrosion while after corrosion, the characteristic peak of 950 cm−1 disappeared gradually but 330 cm−1 remained. In the case of the HS, the characteristic peaks remained at ∼1070 cm−1 before and after corrosion (Figure 11b). The characteristic peaks of the bridge oxygen band with Si (Si–Ob–Si) and the non-bridge oxygen band with Si (Si–Onb) have been reported previously [42,43,44] at ∼1070 cm−1 and ∼950 cm−1, respectively, and the band at ∼330 cm−1 belonged to CaF2. Comparing the Raman spectra of the HS with that of the LS, the network connectivity of the HS was obviously higher than that of the LS. The non-bridge oxygen band of the LS was broken easily during the corrosion while the bridge oxygen band of the HS could be very stable. In addition, the intensity of the 330 cm−1 peak weakened significantly with the decrease of the CaF2 content.
Generally, three reactions can occur simultaneously during the leaching process in an aqueous or acid solution: (i) hydration, (ii) hydrolysis and/or (iii) leaching. Hydration involves molecular water penetration into the glass network. Hydrolysis reaction involves the breakage of the M–O–M (M = Si, B, Al) network. Leaching is an ion-exchange reaction during which modifier cations such as sodium and calcium diffuse out of the glass while water or other hydrous species diffuse into the glass hydrating and hydroxylating the surface. As leaching selectively depletes the modifier cations especially alkali ions, a surface layer resembling a silica-like gel forms that may extend up to a few hundred nanometers [45,46,47].
The corrosion process of the LS is illustrated schematically in Figure 12a,b. Based on the Raman spectra for the LS, as there were many non-bridging oxygen bands and the network was loose, although a thin GL layer was formed at the surface of the enamel coating initially, leaching with alkali metals ions such as Ca2+, Na+ and K+ can easily occur, as shown in Figure 12a. Once alkali metals ions were leached out, the enamel became fragile and cracks could initialize and propagate easily within the enamel. Therefore, the dense GL transformed to a porous leached layer full of cracks in the enamel (Figure 12b). Meanwhile, the cracks formed in the leaching process resulted in more of the acid solution invading deep inside the enamel and broke the Si-O networks further. This process explained why the corrosion kinetics decreased slowly on the first day followed by drop dramatically later.
Figure 12c and d shows the schematic diagram of the corrosion process of the HS. In the case of the HS, owing to its high content of silica, the content of the non-bridging oxygen was less and the compactness of the silica network was higher than the LS. Thus, it was difficult to leach out the alkali metal ions after a dense filmy GL was formed at the surface of the HS (Figure 12c). Hence, the enamel had a good toughness and was free from cracks. With such a case, there was no crack formed within the enamel and a dense gel layer still remained and grew thicker at the surface (Figure 12d).

5. Conclusions

Two enamel coatings with a low and a high silica content were prepared on 35CrMo steels via vacuum firing. Corrosion kinetics, a microstructure evaluation and an electrochemical performance of the two enamel coatings in a 0.5 M HCl solution were investigated. The following conclusions could be drawn:
1. Compared with air firing, vacuum firing makes the enamel applied on carbon steels have fewer numbers of bubbles and pores inside.
2. The corrosion resistance of carbon steels was improved notably by enamel coatings; the corrosion inhibition efficiency increased with the increase of the silica concentration.
3. The HS showed a superior corrosion resistance against hydrochloric acid than the LS. As the Raman spectra indicated, a higher content of silica in the enamel caused the connected silicate tetrahedron network to become more compact, leading to the leaching process of alkali metals being more difficult to happen in an acid solution.

Author Contributions

Conceptualization, H.W.; investigation, C.Z. and L.Z.; data curation, L.H. and J.C.; writing—original draft preparation, H.W.; writing—review and editing, C.J.; supervision, S.G. and F.W.; project administration, M.C. All authors have read and agreed to the published version of the manuscript.

Funding

This project is financially supported by the Excellent Youth Foundation of Liaoning Province (No. 2019-YQ-03), the Ministry of Industry and Information Technology Project (No. MJ-2017-J-99), the CNPC Science and Technology Development Project (Nos. 2019B-4013 and 2019A-3911), the National Key Research and Development Program of China (Nos. 2019YFF0217500 and 2016ZX05022-055) and the Science Fund for Distinguished Young Scholars of Shanxi Province.

Institutional Review Board Statement

Not applicable.

Informed Consent Statement

Not applicable.

Data Availability Statement

Not applicable.

Acknowledgments

The authors wish to acknowledge the financial support by the Excellent Youth Foundation of Liaoning Province (No. 2019-YQ-03), the Ministry of Industry and Information Technology Project (No. MJ-2017-J-99), the CNPC Science and Technology Development Project (Nos. 2019B-4013 and 2019A-3911), the National Key Research and Development Program of China (Nos. 2019YFF0217500 and 2016ZX05022-055) and the Science Fund for Distinguished Young Scholars of Shanxi Province.

Conflicts of Interest

The authors declare no conflict of interest.

References

  1. Sireli, G.K.; Bora, A.S.; Timur, S. Evaluating the mechanical behavior of electrochemically borided low-carbon steel. Surf. Coat. Technol. 2020, 381, 125177. [Google Scholar] [CrossRef]
  2. Chen, J.; Liu, Z.Y. The combination of strength and cryogenic impact toughness in low carbon 5Mn-5Ni steel. J. Alloy. Compd. 2020, 837, 155484. [Google Scholar] [CrossRef]
  3. Wang, H.L.; Fan, H.B.; Zheng, H.S. Corrosion inhibition of mild steel in hydrochloric acid solution by a mercapto-triazole compound. Mater. Chem. Phys. 2003, 77, 655–661. [Google Scholar] [CrossRef]
  4. Bentiss, F.; Lagrenee, M.; Traisnel, M.; Hornez, J.C. The corrosion inhibition of mild steel in acidic media by a new triazole derivative. Corros. Sci. 1999, 41, 789–803. [Google Scholar] [CrossRef]
  5. Mourya, P.; Banerjee, S.; Singh, M.M. Corrosion inhibition of mild steel in acidic solution by Tagetes erecta (Marigold flower) extract as a green inhibitor. Corros. Sci. 2014, 85, 352–363. [Google Scholar] [CrossRef]
  6. Ech-chihbi, E.; Nahlé, A.; Salim, R.; Benhiba, F.; Moussaif, A.; El-Hajjaji, F.; Oudda, H.; Guenbour, A.; Taleb, M.; Warad, I.; et al. Computational, MD simulation, SEM/EDX and experimental studies for understanding adsorption of benzimidazole derivatives as corrosion inhibitors in 1.0 M HCl solution. J. Alloy. Compd. 2020, 844, 155842. [Google Scholar] [CrossRef]
  7. Rbaa, M.; Dohare, P.; Berisha, A.; Dagdag, O.; Lakhrissi, L.; Galai, M.; Lakhrissi, B.; Touhami, M.E.; Warad, I.; Zarrouk, A. New Epoxy sugar based glucose derivatives as eco-friendly corrosion inhibitors for the carbon steel in 1.0 M HCl: Experimental and theoretical investigations. J. Alloy. Compd. 2020, 833, 154949. [Google Scholar] [CrossRef]
  8. Zhang, J.; Rahman, Z.U.; Zheng, Y.; Zhu, C.; Tian, M.; Wang, D. Nanoflower like SnO2-TiO2 nanotubes composite photoelectrode for efficient photocathodic protection of 304 stainless steel. Appl. Surf. Sci. 2018, 457, 516–521. [Google Scholar] [CrossRef]
  9. Branzoi, F.; Pahom, Z.; Nechifor, G. Corrosion protection of new composite polymer coating for carbon steel in sulfuric acid medium by electrochemical methods. J. Adhes. Sci. Technol. 2018, 32, 2364–2380. [Google Scholar] [CrossRef]
  10. Ashassi-Sorkhabi, H.; Kazempour, A. Influence of fluid flow on the performance of polyethylene glycol as a green corrosion inhibitor. J. Adhes. Sci. Technol. 2020, 34, 1653–1663. [Google Scholar] [CrossRef]
  11. Saeed, M.T. Corrosion inhibition of carbon steel in sulfuric acid by bicyclic isoxazolidines. Anti-Corros. Method. Mater. 2004, 51, 389–398. [Google Scholar] [CrossRef]
  12. Rahman, S.U.; Saeed, M.T.; Ali, S.A. Cyclic nitrones as novel organic corrosion inhibitors for carbon steel in acidic media. Anti-Corros. Method. Mater. 2005, 52, 154–159. [Google Scholar] [CrossRef]
  13. Berrissoul, A.; Ouarhach, A.; Benhiba, F.; Romane, A.; Zarrouk, A.; Guenbour, A.; Dikici, B.; Dafali, A. Evaluation of Lavandula mairei extract as green inhibitor for mild steel corrosion in 1 M HCl solution. Experimental and theoretical approach. J. Mol. Liq. 2020, 313, 113493. [Google Scholar] [CrossRef]
  14. Li, H.B.; Liang, K.M.; Mei, L.F.; Gu, S.R.; Wang, S.X. Oxidation protection of mild steel by zirconia sol-gel coatings. Mater. Lett. 2001, 51, 320–324. [Google Scholar] [CrossRef]
  15. Ates, S.; Baran Aydin, E.; Yazici, B. The corrosion behavior of the SnO2-coated mild steel in HCl solution at different temperature. J. Adhes. Sci. Technol. 2021, 35, 419–435. [Google Scholar] [CrossRef]
  16. Stambolova, I.; Yordanov, S.; Lakov, L.; Vassilev, S.; Blaskov, V.; Jivov, B. Preparation of sol-gel SiO2 coatings on steel and their corrosion resistance. In Proceedings of the 13th National Congress on Theoretical and Applied Mechanics, Sofia, Bulgaria, 6–10 September 2017; Vassilev, V.M., Nikolov, S.G., Datcheva, M.D., Ivanova, Y.P., Eds.; E D P Sciences: Jules, France, 2017; Volume 3, pp. 154–196. [Google Scholar]
  17. Yang, S.; Yang, L.; Chen, M.; Wang, J.; Zhu, S.; Wang, F. Understanding of failure mechanisms of the oxide scales formed on nanocrystalline coatings with different Al content during cyclic oxidation. Acta Mater. 2021, 205, 116576. [Google Scholar] [CrossRef]
  18. Liao, Y.; Zhang, B.; Chen, M.; Feng, M.; Wang, J.; Zhu, S.; Wang, F. Self-healing metal-enamel composite coating and its protection for TiAl alloy against oxidation under thermal shock in NaCl solution. Corros. Sci. 2020, 167, 108526. [Google Scholar] [CrossRef]
  19. Yu, Z.; Chen, M.; Chen, K.; Xie, D.; Zhu, S.; Wang, F. Corrosion of enamel with and without CaF2 in molten aluminum at 750 °C. Corros. Sci. 2019, 148, 228–236. [Google Scholar] [CrossRef]
  20. Chen, K.; Chen, M.; Yu, Z.; Wang, Q.; Li, X.; Zhu, S.; Wang, F. Corrosion of SiO2-B2O3-Al2O3-CaF2-R2O (R = Na and K) enamels with different content of ZrO2 in H2SO4 and NaOH solutions. Ceram. Int. 2019, 45, 14958–14967. [Google Scholar] [CrossRef]
  21. Wu, M.Y.; Chen, M.H.; Zhu, S.L.; Wang, F.H. Protection mechanism of enamel-alumina composite coatings on a Cr-rich nickel-based superalloy against high-temperature oxidation. Surf. Coat. Technol. 2016, 285, 57–67. [Google Scholar] [CrossRef]
  22. Goleus, V.I.; Nagornaya, T.I.; Rubanova, O.N.; Kozyreva, T.I.; Gurzhii, O.B. Chemical stability of titanium enamel coatings. Glass Ceram. 2012, 69, 274–275. [Google Scholar] [CrossRef]
  23. Rodtsevich, S.P.; Tavgen, V.V.; Minkevich, T.S. Effect of alkali metal oxides on the properties of titanium containing glass enamels. Glass Ceram. 2007, 64, 244–246. [Google Scholar] [CrossRef]
  24. Rodtsevich, S.P.; Eliseev, S.Y.; Tavgen, V.V. Low-melting chemically resistant enamel for steel kitchenware. Glass Ceram. 2003, 60, 23–25. [Google Scholar] [CrossRef]
  25. Svetlov, V.A. Increasing corrosion resistance of titanium enamel coatings by modifying the slip. Glass Ceram. 1989, 46, 293–295. [Google Scholar] [CrossRef]
  26. Gin, S.; Jollivet, P.; Fournier, M.; Angeli, F.; Frugier, P.; Charpentier, T. Origin and consequences of silicate glass passivation by surface layers. Nat. Commun. 2015, 6, 6360. [Google Scholar] [CrossRef] [Green Version]
  27. Cailleteau, C.; Angeli, F.; Devreux, F.; Gin, S.; Jestin, J.; Jollivet, P.; Spalla, O. Insight into silicate-glass corrosion mechanisms. Nat. Mater. 2008, 7, 978–983. [Google Scholar] [CrossRef]
  28. Hellmann, R.; Cotte, S.; Cadel, E.; Malladi, S.; Karlsson, L.S.; Lozano-Perez, S.; Cabie, M.; Seyeux, A. Nanometre-scale evidence for interfacial dissolution-reprecipitation control of silicate glass corrosion. Nat. Mater. 2015, 14, 307–311. [Google Scholar] [CrossRef] [PubMed]
  29. Chen, K.; Chen, M.; Wang, Q.; Zhu, S.; Wang, F. Micro-alloys precipitation in NiO- and CoO-bearing enamel coatings and their effect on adherence of enamel/steel. Int. J. Appl. Glass Sci. 2018, 9, 70–84. [Google Scholar] [CrossRef]
  30. Dohmen, L.; Lenting, C.; Fonseca, R.O.C.; Nagel, T.; Heuser, A.; Geisler, T.; Denkler, R. Pattern Formation in Silicate Glass Corrosion Zones. Int. J. Appl. Glass Sci. 2013, 4, 357–370. [Google Scholar] [CrossRef]
  31. Geisler, T.; Janssen, A.; Scheiter, D.; Stephan, T.; Berndt, J.; Putnis, A. Aqueous corrosion of borosilicate glass under acidic conditions: A new corrosion mechanism. J. Non-Cryst. Solids 2010, 356, 1458–1465. [Google Scholar] [CrossRef]
  32. Gin, S.; Ribet, I.; Couillard, M. Role and properties of the gel formed during nuclear glass alteration: Importance of gel formation conditions. J. Nucl. Mater. 2001, 298, 1–10. [Google Scholar] [CrossRef]
  33. Gin, S.; Guittonneau, C.; Godon, N.; Neff, D.; Rebiscoul, D.; Cabie, M.; Mostefaoui, S. Nuclear glass durability: New insight into alteration layer properties. J. Phys. Chem. C 2011, 115, 18696–18706. [Google Scholar] [CrossRef]
  34. Gin, S. Open scientific questions about nuclear glass corrosion. In Proceedings of the 2nd International Summer School on Nuclear Glass Wasteform: Structure, Properties and Long-Term Behavior, France, 23–27 September 2014; Angeli, F., Delaye, J.M., Schuller, S., Pinet, O., Rebiscoul, D., Gin, S., Peuget, S., Eds.; Elsevier Science: Amsterdam, The Netherlands, 2014; pp. 163–171. [Google Scholar]
  35. Baran, E.; Cakir, A.; Yazici, B. Inhibitory effect of Gentiana olivieri extracts on the corrosion of mild steel in 0.5 M HCl: Electrochemical and phytochemical evaluation. Arab. J. Chem. 2019, 12, 4303–4319. [Google Scholar] [CrossRef] [Green Version]
  36. Behpour, M.; Ghoreishi, S.M.; Khayatkashani, M.; Soltani, N. Green approach to corrosion inhibition of mild steel in two acidic solutions by the extract of Punica granatum peel and main constituents. Mater. Chem. Phys. 2012, 131, 621–633. [Google Scholar] [CrossRef]
  37. Tansug, G.; Tuken, T.; Giray, E.S.; Findikkiran, G.; Sigircik, G.; Demirkol, O.; Erbil, M. A new corrosion inhibitor for copper protection. Corros. Sci. 2014, 84, 21–29. [Google Scholar] [CrossRef]
  38. Hagihara, K.; Okubo, M.; Yamasaki, M.; Nakano, T. Crystal-orientation-dependent corrosion behaviour of single crystals of a pure Mg and Mg-Al and Mg-Cu solid solutions. Corros. Sci. 2016, 109, 68–85. [Google Scholar] [CrossRef] [Green Version]
  39. Jorcin, J.B.; Orazem, M.E.; Pebere, N.; Tribollet, B. CPE analysis by local electrochemical impedance spectroscopy. Electrochim. Acta 2006, 51, 1473–1479. [Google Scholar] [CrossRef]
  40. Khattabi, M.; Benhiba, F.; Tabti, S.; Djedouani, A.; El Assyry, A.; Touzani, R.; Warad, I.; Oudda, H.; Zarrouk, A. Performance and computational studies of two soluble pyran derivatives as corrosion inhibitors for mild steel in HCl. J. Mol. Struct. 2019, 1196, 231–244. [Google Scholar] [CrossRef]
  41. Avci, G. Corrosion inhibition of indole-3-acetic acid on mild steel in 0.5 M HCl. Colloids Surf. A 2008, 317, 730–736. [Google Scholar] [CrossRef]
  42. Brawer, S.A.; White, W.B. Raman spectroscopic investigation of the structure of silicate glasses (II). Soda-alkaline earth-alumina ternary and quaternary glasses. J. Non-Cryst. Solids 1977, 23, 261–278. [Google Scholar] [CrossRef]
  43. Tsuda, H.; Jongebloed, W.L.; Stokroos, I.; Arends, J. Combined Raman and SEM study on CaF2 formed on/in enamel by APF treatments. Caries Res. 1993, 27, 445–454. [Google Scholar] [CrossRef]
  44. Brawer, S.A.; White, W.B. Raman spectroscopic investigation of the structure of silicate glasses. I. The binary alkali silicates. J. Chem. Phys. 1975, 63, 2421–2432. [Google Scholar] [CrossRef]
  45. Sheth, N.; Ngo, D.; Banerjee, J.; Zhou, Y.; Pantano, C.G.; Kim, S.H. Probing hydrogen-bonding interactions of water molecules adsorbed on silica, sodium calcium silicate, and calcium aluminosilicate glasses. J. Phys. Chem. C 2018, 122, 17792–17801. [Google Scholar] [CrossRef]
  46. Sheth, N.; Luo, J.; Banerjee, J.; Pantano, C.G.; Kim, S.H. Characterization of surface structures of dealkalized soda lime silica glass using X-ray photoelectron, specular reflection infrared, attenuated total reflection infrared and sum frequency generation spectroscopies. J. Non-Cryst. Solids 2017, 474, 24–31. [Google Scholar] [CrossRef]
  47. Amma, S.-I.; Kim, S.H.; Pantano, C.G. Analysis of water and hydroxyl species in soda lime glass surfaces using attenuated total reflection (ATR)-IR spectroscopy. J. Am. Ceram. Soc. 2016, 99, 128–134. [Google Scholar] [CrossRef]
Figure 1. Initial cross-sectional morphologies of the HS firing in air (a) and in a vacuum (b) at 880 °C.
Crystals 11 00346 g001
Figure 2. Macro images of the uncoated, LS and HS samples before and after corrosion in a 0.5 M HCl solution at 30 °C for different days.
Crystals 11 00346 g002
Figure 3. Corrosion kinetics of the uncoated, LS and HS samples corroded in the 0.5 M HCl solution at 30 °C. (inset is the magnified corrosion kinetics of the HS)
Crystals 11 00346 g003
Figure 4. XRD patterns of the uncoated, LS and HS samples after corrosion in the 0.5 M HCl solution at 30 °C for three days.
Crystals 11 00346 g004
Figure 5. Surface morphologies of the uncoated (a), LS (b) and HS (c) samples after corrosion in the 0.5 M HCl solution at 30 °C for three days.
Crystals 11 00346 g005
Figure 6. Cross-sectional morphologies of the uncoated (a), LS (b) and HS (c) samples after corrosion in the 0.5 M HCl solution at 30 °C for three days. A corresponding high-magnification view (d) and line scan profile (e) of image c.
Crystals 11 00346 g006aCrystals 11 00346 g006b
Figure 7. The Nyquist plots of the uncoated, LS and HS samples in the 0.5 M HCl solution at 30 °C (inset is a magnified Nyquist plot of the uncoated sample).
Crystals 11 00346 g007
Figure 8. The bode (a) and phase angle (b) plots of the uncoated, LS and HS samples in the 0.5 M HCl solution at 30 °C.
Crystals 11 00346 g008
Figure 9. The equivalent circuit used to fit the EIS results of the uncoated (a), LS and HS (b) samples.
Crystals 11 00346 g009
Figure 10. The polarization curves of the uncoated, LS and HS samples in the 0.5 M HCl solution at 30 °C.
Crystals 11 00346 g010
Figure 11. Raman spectra of the LS (a) and the HS (b) before and after corrosion for different days in the 0.5 M HCl solution at 30 °C.
Crystals 11 00346 g011
Figure 12. Schematic diagram of the corrosion processes of the LS (a,b) and the HS (c,d).
Crystals 11 00346 g012
Table 1. Nominal composition of enamel (wt%). LS = low silica. HS = high silica.
SiO2B2O3Al2O3Na2OK2OCoOCaF2
LS54.612.36.012.36.02.56.3
HS64.69.64.79.64.61.95.0
Table 2. EDS results in Figure 5b (at.%).
ONaMgAlSiKCaFeCo
Zone 173.10.41.23.916.10.62.41.70.6
Zone 272.00.41.14.016.70.72.61.80.7
Zone 362.17.55.72.411.22.57.40.40.8
Zone 460.97.56.02.511.02.68.30.40.8
Zone 560.87.46.02.411.22.68.30.40.9
Table 3. Impedance parameters of the uncoated, LS and HS samples in the 0.5 M HCl solution at 30 °C.
Rs (Ω)R1 (Ω cm−2)Y0-CPE1
(μS s−n cm−2)
R2
(Ω cm−2)
L
(H cm−2)
Rp (Ω cm−2)
Uncoated6 ± 166 ± 1286 ± 5//66 ± 1
LS24 ± 69304 ± 722 ± 91071 ± 142502 ± 14960 ± 5
HS328 ± 28(1583 ± 6) × 10799 ± 241178 ± 233718 ± 341178 ± 23
Table 4. Polarization data of the uncoated, LS and HS samples in the 0.5 M HCl solution at 30 °C.
Sample−Ecorr
(mVSCE)
icor
(mA cm−2)
βa
(mV/dec)
−βc
(mV/dec)
ηTafel
Uncoated4470.12213.988.53-
LS4910.0958.112.9722.1
HS5170.0075.782.9494.3
Publisher’s Note: MDPI stays neutral with regard to jurisdictional claims in published maps and institutional affiliations.

