Article

Transport and Dielectric Properties of Mechanosynthesized La2/3Cu3Ti4O12 Ceramics

1
Department of Physics, College of Science, King Faisal University, Al-Ahsaa 31982, Saudi Arabia
2
Department of Physics, Faculty of Science, The New Valley University, El-Kharga 72511, Egypt
3
Physics Department, Faculty of Science, Assiut University, Assiut 71516, Egypt
4
Department of Physics, University of Petroleum and Energy Studies, Dehradun 248007, Uttarakhand, India
*
Author to whom correspondence should be addressed.
Crystals 2021, 11(3), 313; https://doi.org/10.3390/cryst11030313
Submission received: 17 February 2021 / Revised: 18 March 2021 / Accepted: 19 March 2021 / Published: 22 March 2021
(This article belongs to the Special Issue Advanced Functional Oxide Ceramics)

Abstract

:
La2/3Cu3Ti4O12 (LCTO) powder has been synthesized by the mechanochemical milling technique. The pelletized powder was conventionally sintered for 10 h at a temperature range of 975–1025 °C, which is a lower temperature process compared to the standard solid-state reaction. X-ray diffraction analysis revealed a cubic phase for the current LCTO ceramics. The grain size of the sintered ceramics was found to increase from 1.5 ± 0.5 to 2.3 ± 0.5 μm with an increase in sintering temperature from 975 to 1025 °C. The impedance results show that the grain conductivity is more than three orders of magnitude larger than the grain boundary conductivity for LCTO ceramics. All the samples showed a giant dielectric constant (1.7 × 10³–3.4 × 10³) and dielectric loss (0.09–0.17) at 300 K and 10 kHz. The giant dielectric constant of the current samples was attributed to the effect of internal barrier layer capacitances due to their electrically inhomogeneous structure.

1. Introduction

Electroceramics are materials whose properties and applications depend on a complex mingling of structural, compositional, and processing variables. A giant dielectric constant (GDC) is usually observed in relaxor and perovskite ferroelectric materials with values of dielectric constant (ε′) that are larger than 1000 [1,2,3,4,5,6,7]. For ferroelectric materials such as BaTiO3, the ε′ value at room temperature is ~1500–2000. Insulating materials with high dielectric permittivity and good thermal stability and which are Pb-free are attractive because of their potential practical applications in microelectronics such as capacitors and memory devices. A giant dielectric response with weak temperature-dependent permittivity has been observed in materials such non-ferroelectric CaCu3Ti4O12 (CCTO) [8,9,10,11]. CCTO is the most studied material of the family [A]Cu3Ti4O12 [A = Ca, Na, Cd, Sr, Y2/3, Bi2/3, and Ln2/3; Ln: La, Sm, Ce, Er, Gd, Pr, Nd, Ho, Tb, and Tm) [8,9,10,11,12,13,14,15]. For CCTO ceramics, the value of the dielectric constant increases with increasing grain size, with a value of ε′~2.8 × 10⁵ being reported for 300 μm grained ceramics [10]. Even though the origins of the GDC observed in CCTO and CCTO-like materials are still discussed controversially, the internal barrier layer capacitance (IBLC) effect is still the most accepted model [10,16]. The dielectric properties of ceramics are generally sensitive to the compositional variations and sintering conditions [17,18,19]. The best dielectric properties of CCTO-based ceramic systems are usually obtained using a standard solid-state reaction process which includes several mechanical milling and high temperature (1050–1110 °C) calcination and sintering steps [20,21,22,23]. La2/3Cu3Ti4O12 (LCTO) is a member of the [A]Cu3Ti4O12 family, but is much less studied than CCTO [23,24,25,26]. LCTO ceramics have been reported to exhibit GDC. Liu et al. reported on the preparation of LCTO powder by sol-gel technique [25]. A room temperature GDC value of 0.9–1.6 × 10⁴ at 102–105 Hz could be obtained. The fabrication process included calcination of the powder at 750–950 °C for 10 h, followed by conventional sintering at 1100–1110 °C for 10–20 h. In the current study, we investigate the possibility of reducing the preparation process of LCTO ceramics by using a comparatively shorter time and lower temperatures in the process. The process is based on the mechanochemical synthesis of the LCTO powder followed by conventional sintering. Mechanochemical milling is considered to be a versatile method of producing almost all forms of materials in the nanosize scale [23,24,25,26,27,28]. The advantages of mechanochemical milling are that almost every material is accessible and materials can be produced in large amounts. In the current study, we prepared LCTO powder by mechanochemical milling and the calcination step that is usually done in solid state reaction technique was skipped, leading to a simpler process. Moreover, the sintering temperature in the current work was limited to 1025 °C, which is lower than the sintering temperatures of 1100 °C that is usually reported in the literature for LLCT ceramics [23,25,27]. The prepared ceramics were then studied for the microstructure, dielectric, and relaxation behavior using field-emission scanning electron microscope (FE-SEM), X-ray diffraction (XRD), and impedance spectroscopy (IS) measurements in a wide range of frequencies and temperatures.

2. Materials and Methods

High-purity CuO (99.9%), TiO2 (99.95%), and La2O3 (99.95%) raw powders were weighed according to the chemical formula La2/3Cu3Ti4O12 and mixed with isopropyl alcohol for 30 h at room temperature with a rotation speed of 500 rpm in Fritsch P-7 premium line machine. Tungsten carbide pot and tungsten carbide balls were used, with a powder to balls mass ratio of 1:8. The synthesized powder was then dried for 1 hour at 300 °C. Afterwards, a suitable amount of the powder was pressed into pellet disks of ~1.5 mm thickness and 10 mm diameter under static pressure of 32 MPa. Pellets were conventionally sintered at 975, 1000, and 1025 °C in air for 10 h using a heating rate of 5 °C/min. After the sintering process, the ceramics were allowed to naturally cool down in the furnace. For simplicity, these ceramics are denoted as CS-975, CS-1000, and CS-1025, respectively. Materials characterization was performed by XRD and FE-SEM. XRD measurements were performed by using a Bruker D8 Advance X-ray powder diffractometer (CuKα radiation, Karlsruhe, Germany) in the 10° ≤ 2θ ≤ 90° range with a step of 0.02°. The graphs of the microstructure were obtained by FE-SEM (Joel SM7600F, Tokyo, Japan) without prior sputtering of the samples. For impedance measurements, the studied ceramics were gold sputtered. Impedance spectroscopy measurements were conducted for the prepared ceramics in the 120–460 K temperature range over the 1 Hz to 10 MHz frequency range using Novocontrol concept 50 system with an applied ac voltage of 0.1 V. The IS measurements were performed in dry nitrogen atmosphere where the temperature was controlled by the Quatro Cryosystem (Novocontrol Technologies, Montabaur, Germany).

3. Results

Figure 1 shows the XRD pattern of mechanosynthesized LCTO powder. This figure suggests the formation of CCTO-like structure, with the major peaks indexed in the figure, which confirms the synthesis of LCTO material by the mechanochemical synthesis technique. Figure 2 represents the X-ray diffraction profiles of the CS-975, CS-1000, and CS-1025 LCTO samples analyzed using the Rietveld refinement process with the Im3 space group by FullProf software [29]. The experimental data in Figure 2 are represented with black points, whereas the calculated spectra are shown by the red line. The difference curves between the experimental and fitted spectrum are highlighted by the blue line. The pink vertical lines represent the exact location of Bragg’s position.
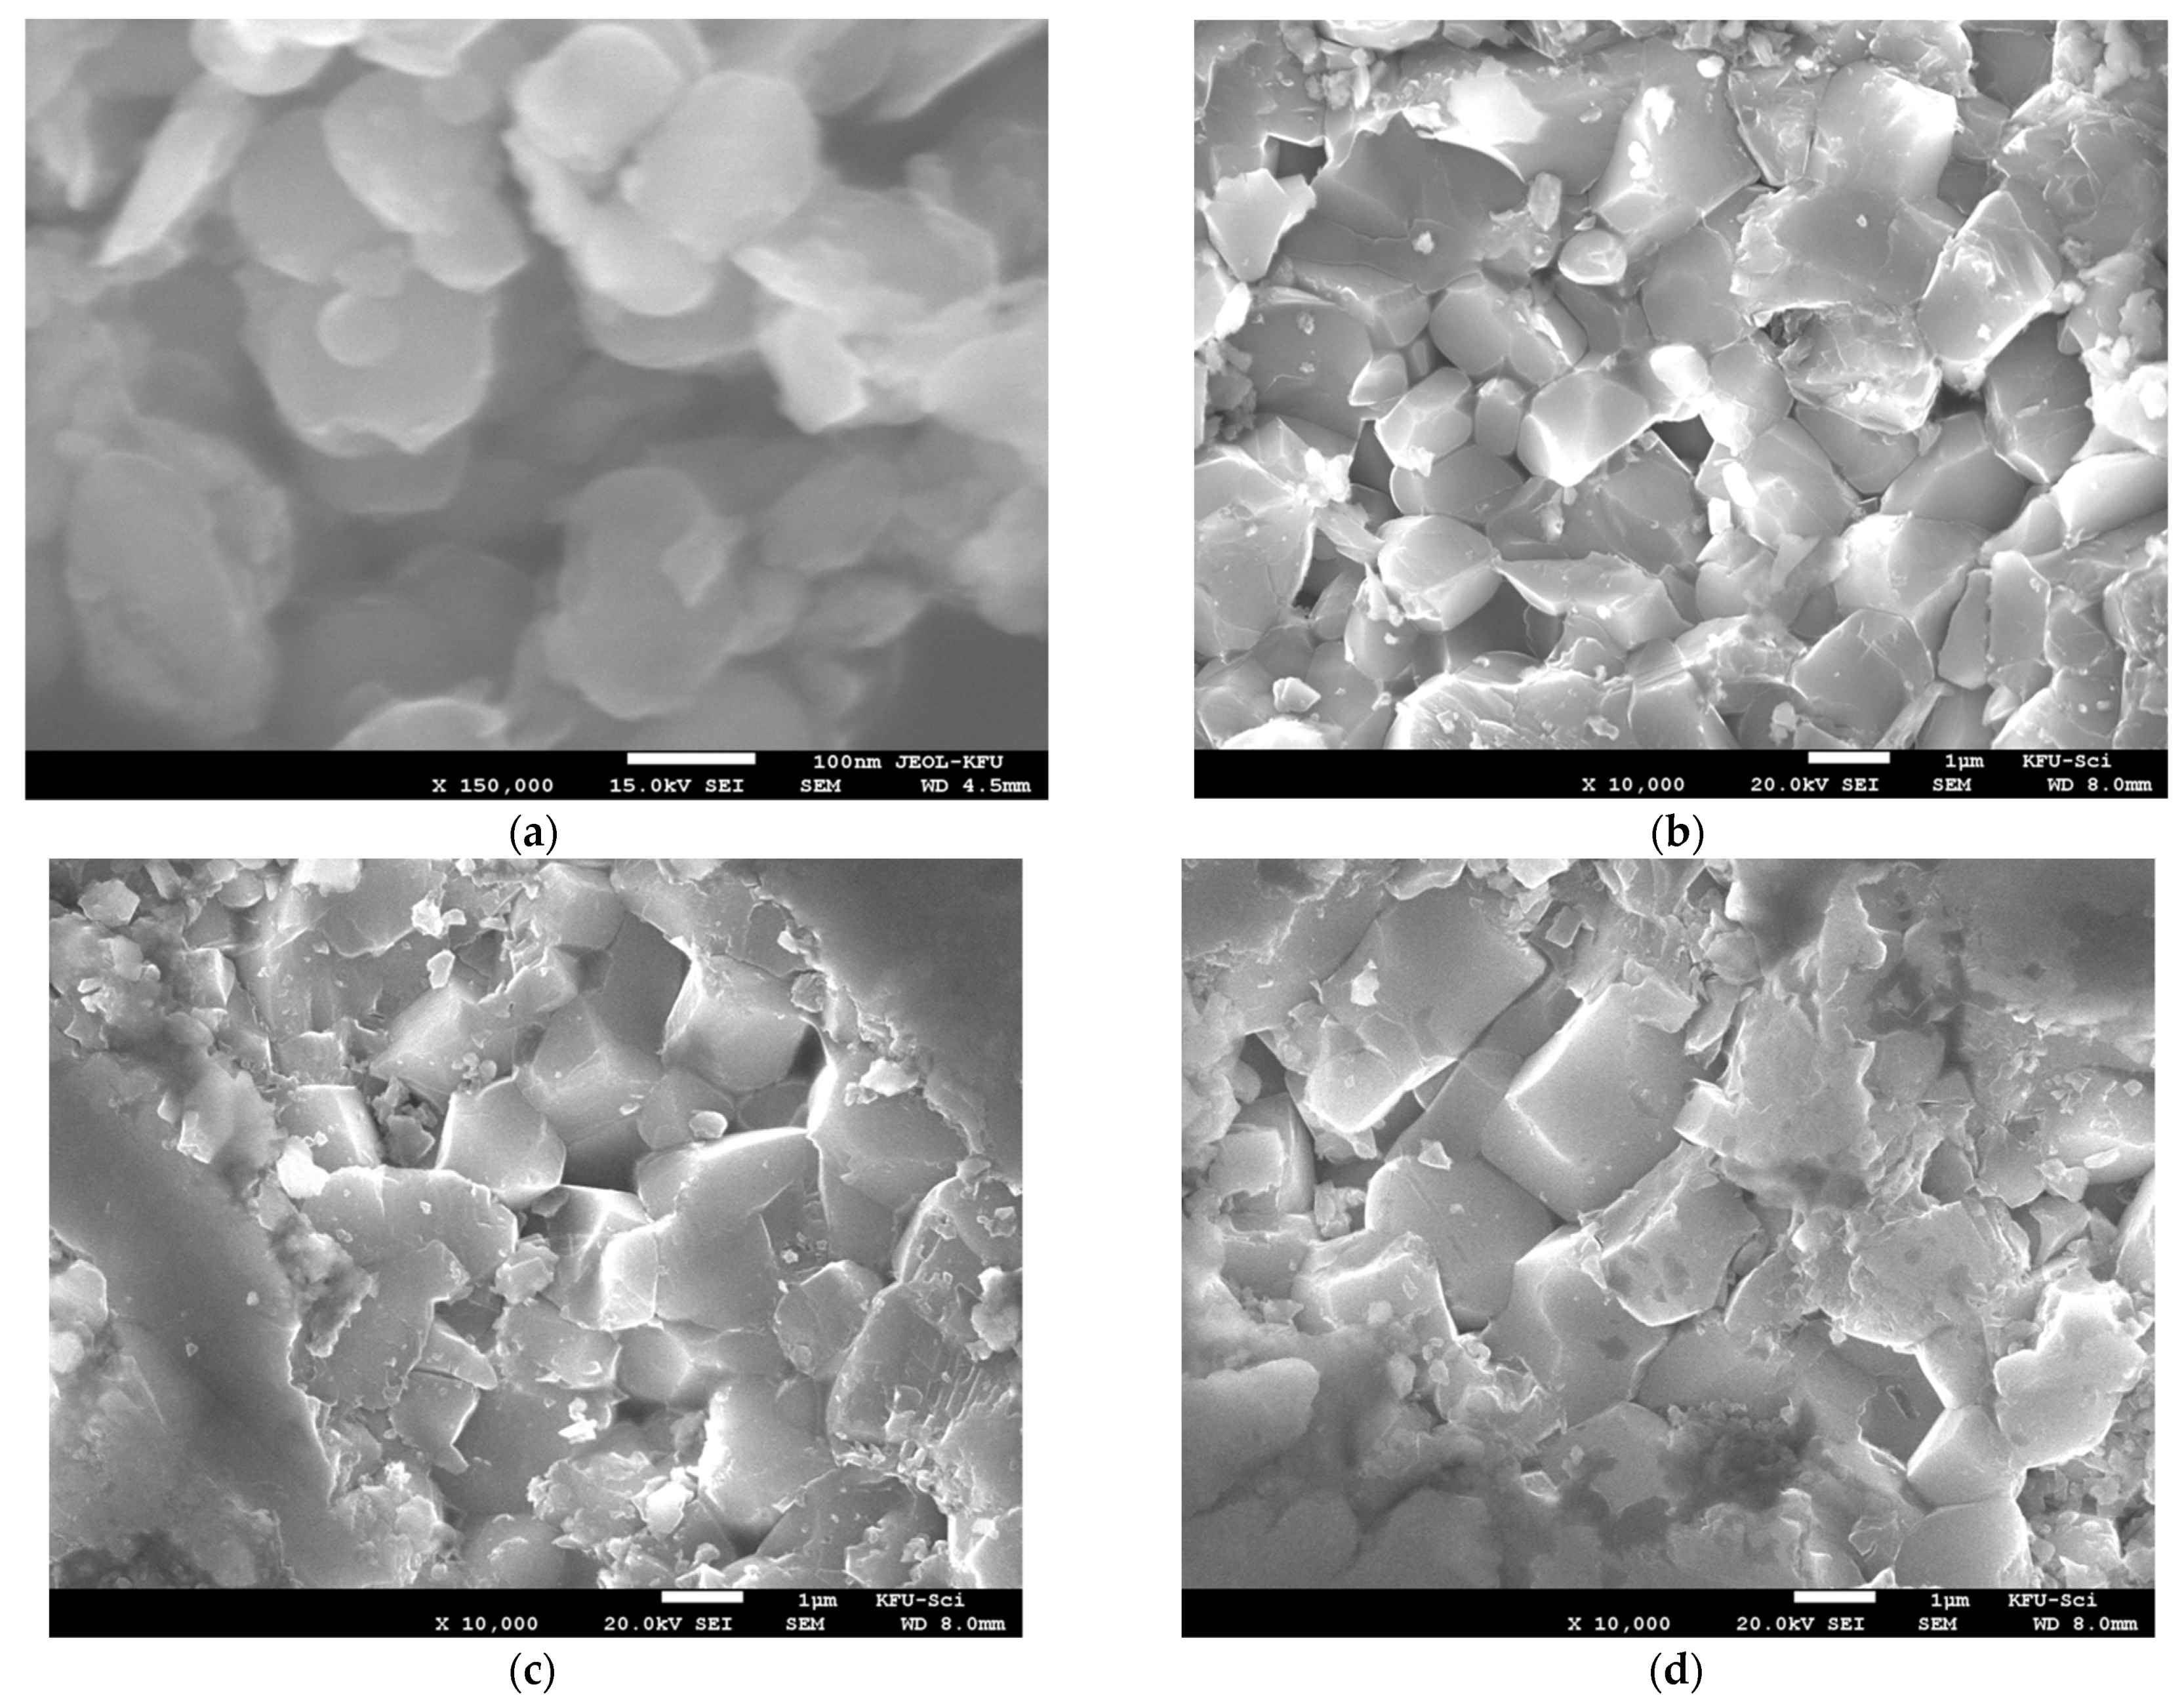
All diffraction peaks at diffraction angles—34.30°, 38.37°, 42.20°, 45.76°, 48.08°, 61.06°, 72.04°, and 82.26°—correspond to the (220), (310), (222), (321), (422), (440), and (620) planes, respectively, and are perfectly indexed based on the body-centered cubic structure with space group Im3. The diffraction peaks of CS-975, CS-1000, and CS-1025 LCTO ceramics are well-matched with the JCPDS card No. 75-2188. The various structural parameters such as lattice parameters and unit cell volume obtained from the Rietveld refinement are shown in Table 1. It is found that lattice parameters and unit cell volume increase slightly with the increase in the sintering temperature. The goodness factor (χ2) values of fitting were obtained in between 1.17 to 1.22, which clearly convince a very good agreement between calculated and experimental spectra as shown in Table 1. Besides the main CCTO-like phase, the minor reflections marked by # at 27.78°, ~36.2°, and 54.62° correspond to the impurity phase of rutile TiO2 [JCPDS card No. 89–4920 with tetragonal structure, space group P42/mnm]. Figure 3 shows FE-SEM images of LCTO powder and the fractured surfaces of the corresponding ceramics. Mechanosynthesized LCTO powder exhibits particle size in the 50–150 nm range (Figure 3a). After conventional sintering, all the studied ceramics showed uniformly distributed microstructure with the average grain size of 1.5 ± 0.5, 1.8 ± 0.4, and 2.3 ± 0.5 µm for CS-975, CS-1000, and CS-1025 ceramics, respectively, as can be seen from Figure 3b–d.
The complex impedance plots for CS-975, CS-1000, and CS-1025 LCTO ceramics are given in Figure 4. The complex impedance plane plot at a given temperature is composed of two semicircular arcs. The semicircle at high frequency is related to the grain response while the grain boundary response is correlated with the low frequency semicircle. This is supported by the capacitance values associated with these semicircles. The capacitance could be estimated from the impedance data by the relation; RC = 1 / 2 π f max , where fmax is the frequency at the top of the semicircles. The estimated values of the capacitance at different temperatures are in the range of 1.4–4 nF for the low frequency semicircles, and 55–85 pF for the high frequency semicircles. These values of the capacitance confirm that the high- and low-frequency semicircles are related to grain and grain boundary contributions, respectively.
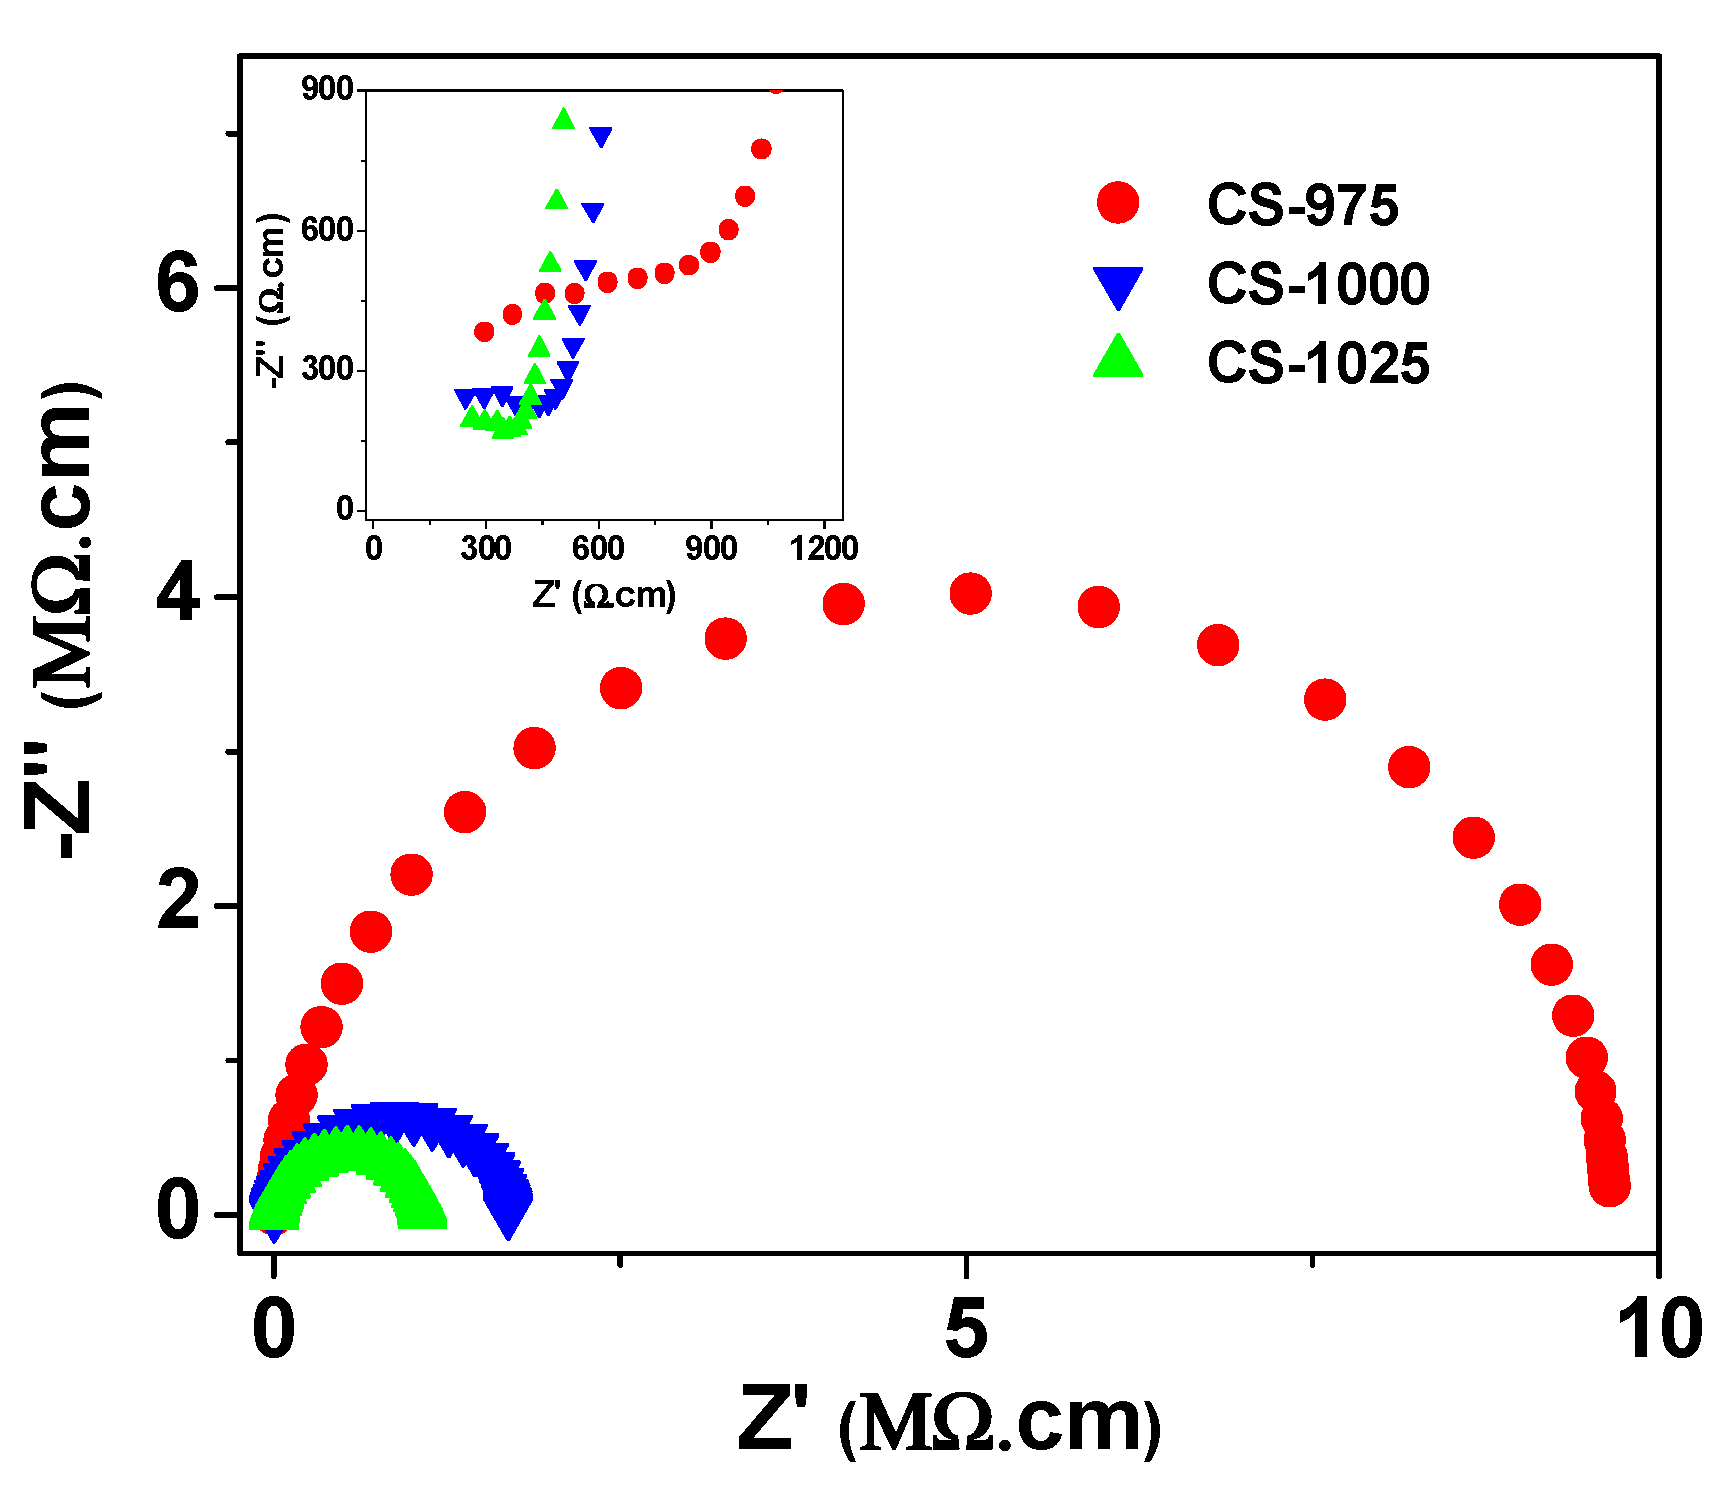
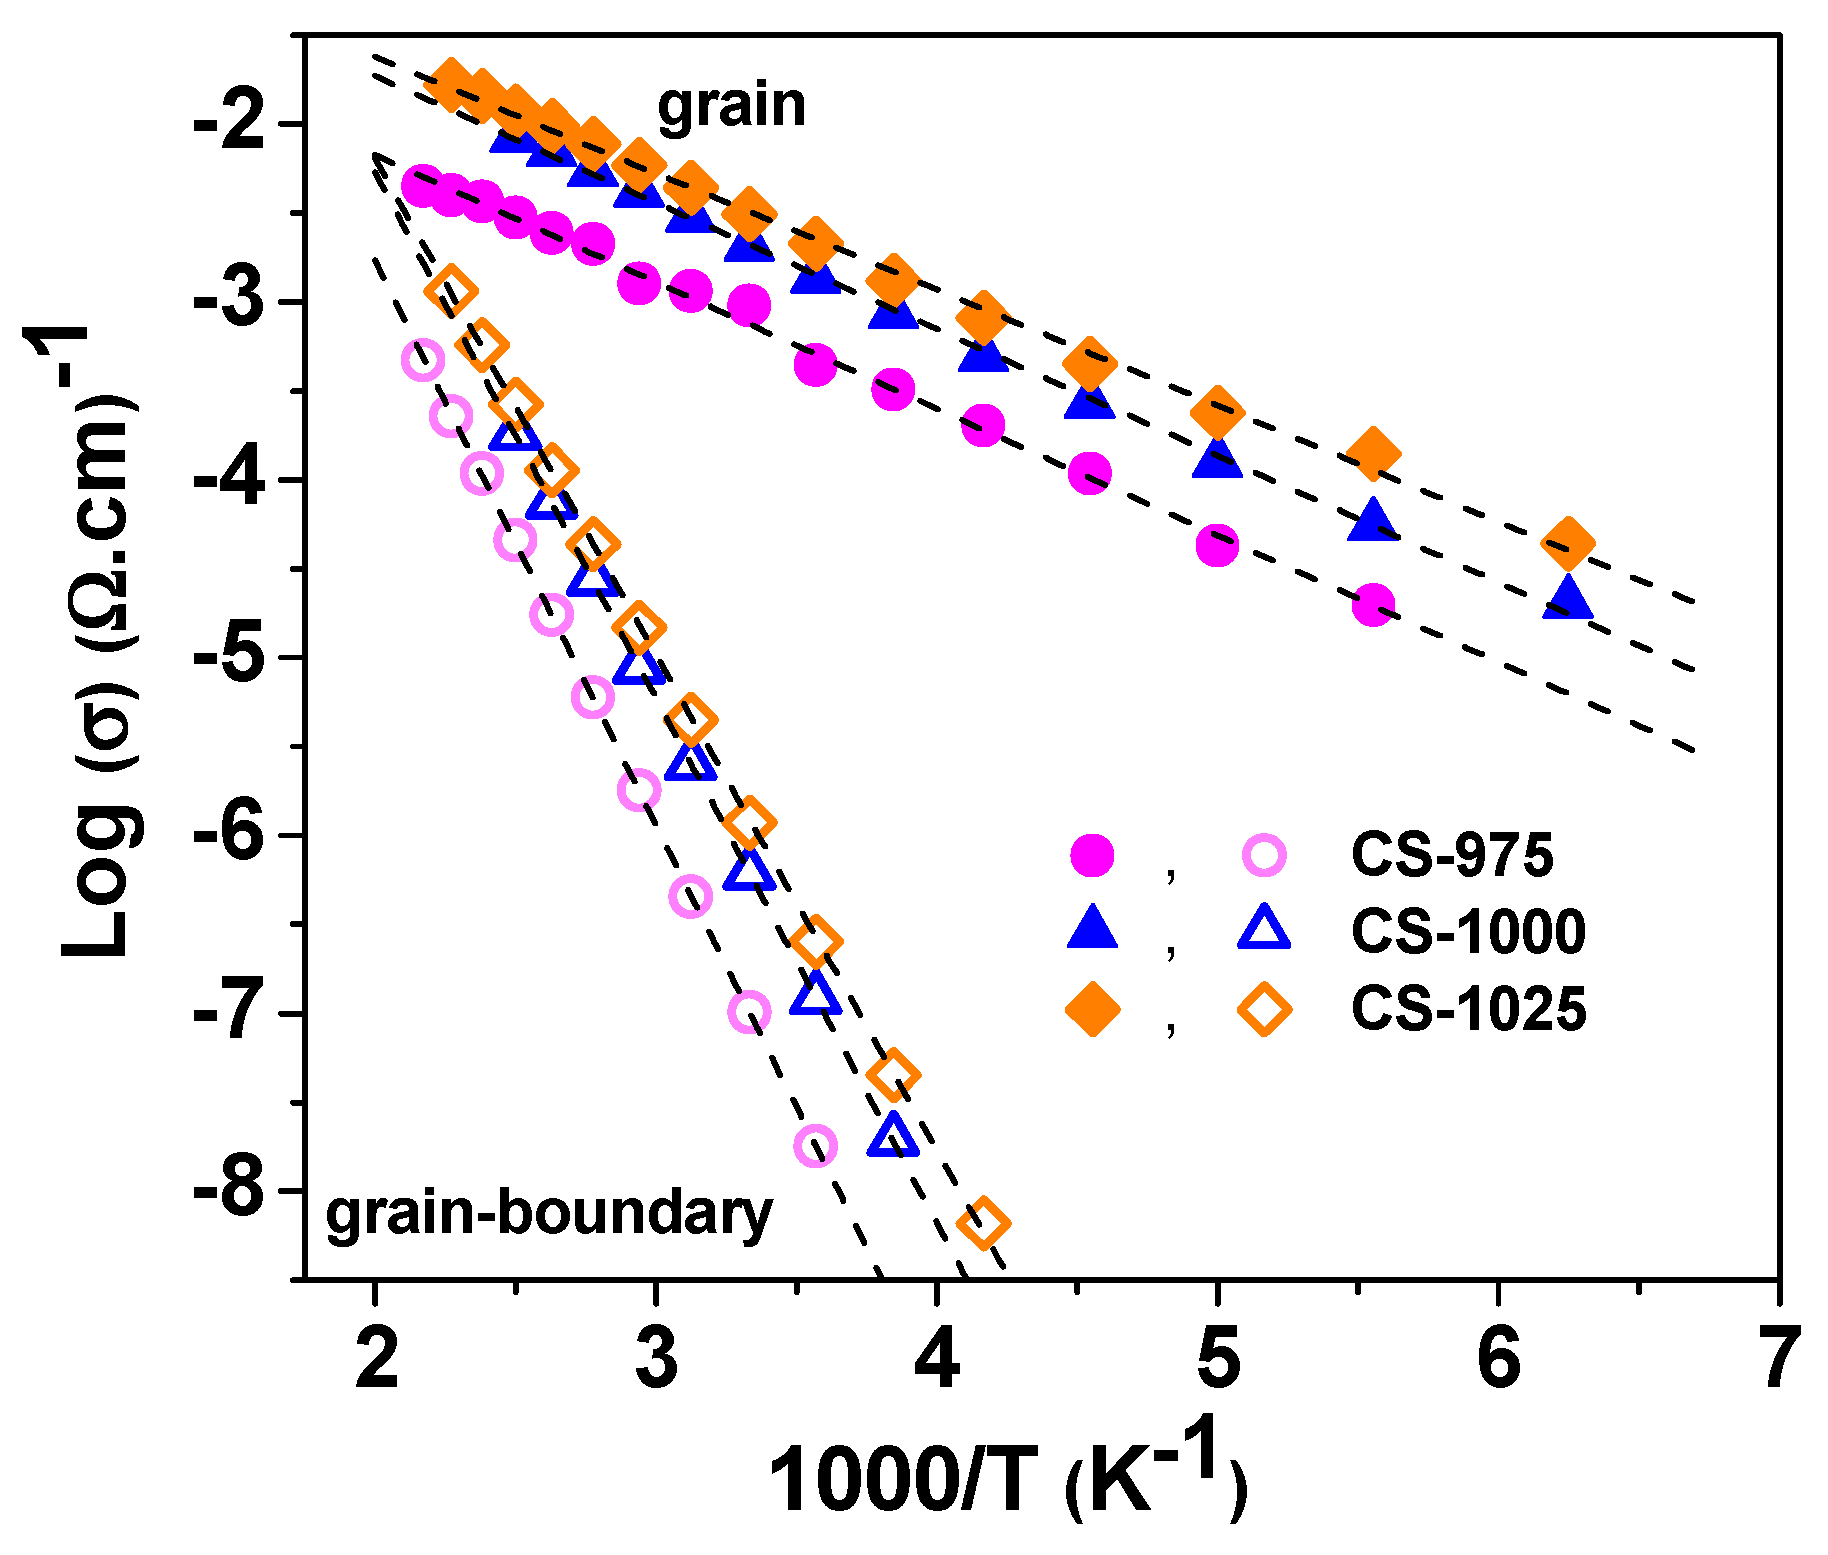
It can be seen from Figure 4 and Figure 5 that the overall resistivity of LCTO ceramic decreases with an increase in the measuring temperature, which is typical semiconductor behavior. Figure 5 shows the complex impedance diagram at 300 K for all three samples. As the sintering temperature increases, the overall resistivity of LCTO ceramics decreases. Moreover, the ratio of resistivity of grain-boundary to the grain in LCTO ceramics is found to be four (CS-975) to three (CS-1000 and CS-1025) orders of magnitude, which indicates the electrical heterogeneity of the ceramics. The temperature dependency of the grain and grain boundary conductivity extracted from the complex impedance plots of the current LCTO ceramics is shown in Figure 6. The solid lines in this figure represent the linear fit according to the Arrhenius relationship:
σ   =   σ 0 exp ( E a k B T )
where σ0 is the pre-exponential factor, kB is Boltzmann constant, and Ea is the activation energy for conduction. Table 2 lists out the conductivity values at 300 K and the associated values of the activation energy of the grain and grain boundaries of the CS-975, CS-1000, and CS-1025 ceramics. The values of the activation energy of the conduction processes are 0.141 and 0.129 eV in the grains and 0.628 and 0.552 eV in the grain-boundary of CS-975 and CS-1025 ceramics, respectively.
The frequency dependence, at selected temperatures, of the dielectric constant ε′ of each LCTO sample is shown in Figure 7, whereas Figure 8 represents the frequency dependence of ε′ and tanδ at 300 K for all LCTO ceramics. As seen in these figures, all the ceramics showed the same behavior where at low temperature a first dielectric plateau exists followed by a large drop in the ε′ value to the bulk dielectric constant value of about 100 at high frequency. This behavior is commonly reported in CCTO-like materials and attributed to the Debye-like relaxation in the grain [27]. With increasing temperature, this plateau shifts towards higher frequency and a second plateau with higher dielectric value appears at low frequency. This second plateau is thought to be due to the Maxwell–Wagner polarization (M-W) effect which manifests in electrically inhomogeneous materials [23,28,30]. As approved by impedance measurements, the current LCTO ceramics have the structure of semi-conductive grains surrounded by resistive grain-boundary. Therefore, at high temperatures and suitable frequencies, the moving charge carriers are piled up at the resistive grain-boundary, which creates internal barrier layer capacitance (IBLC).
The frequency dependence of ε′ and tanδ for LCTO samples is shown in Figure 8. One relaxation peak is observed in the spectra of tanδ at high frequency, which is related to the grain relaxation process. The peak related to the grain-boundary relaxation is not well resolved due to the high conductivity of the sample at room temperature. The dielectric loss for the samples at room temperature and 104 Hz is summarized in Table 2. The sample CS-975 showed the lowest dielectric loss of ~0.09, which increases to 0.17 for CS-1025 sample. These values of tanδ are higher than the values reported previously for LCTO ceramics as in Ref. [25].
The frequency dependence of the electric modulus (M* = M′ + jM″ = 1/ε* where ε* is the complex permittivity) is commonly used to study the relaxation properties of the materials. The spectra of the imaginary part of the electric modulus M” at selected temperatures for CS-975, CS-1000, and CS-1025 ceramics are shown in Figure 9. For all the samples, two relaxation peaks could be detected in the studied temperature and frequency range. A first peak is observed in the temperature range (120–300 K) and high frequency (>105 Hz). A second peak is seen at a higher temperature range (~240–450 K) and lower frequency. The peak maximum of M″ is inversely proportional to the capacitance [31,32]. Thus, considering the higher resistivity and capacitance of the grain-boundary compared to the grain, the low and high frequency relaxation peaks are attributed to the response of grain-boundary and grain contributions, respectively.
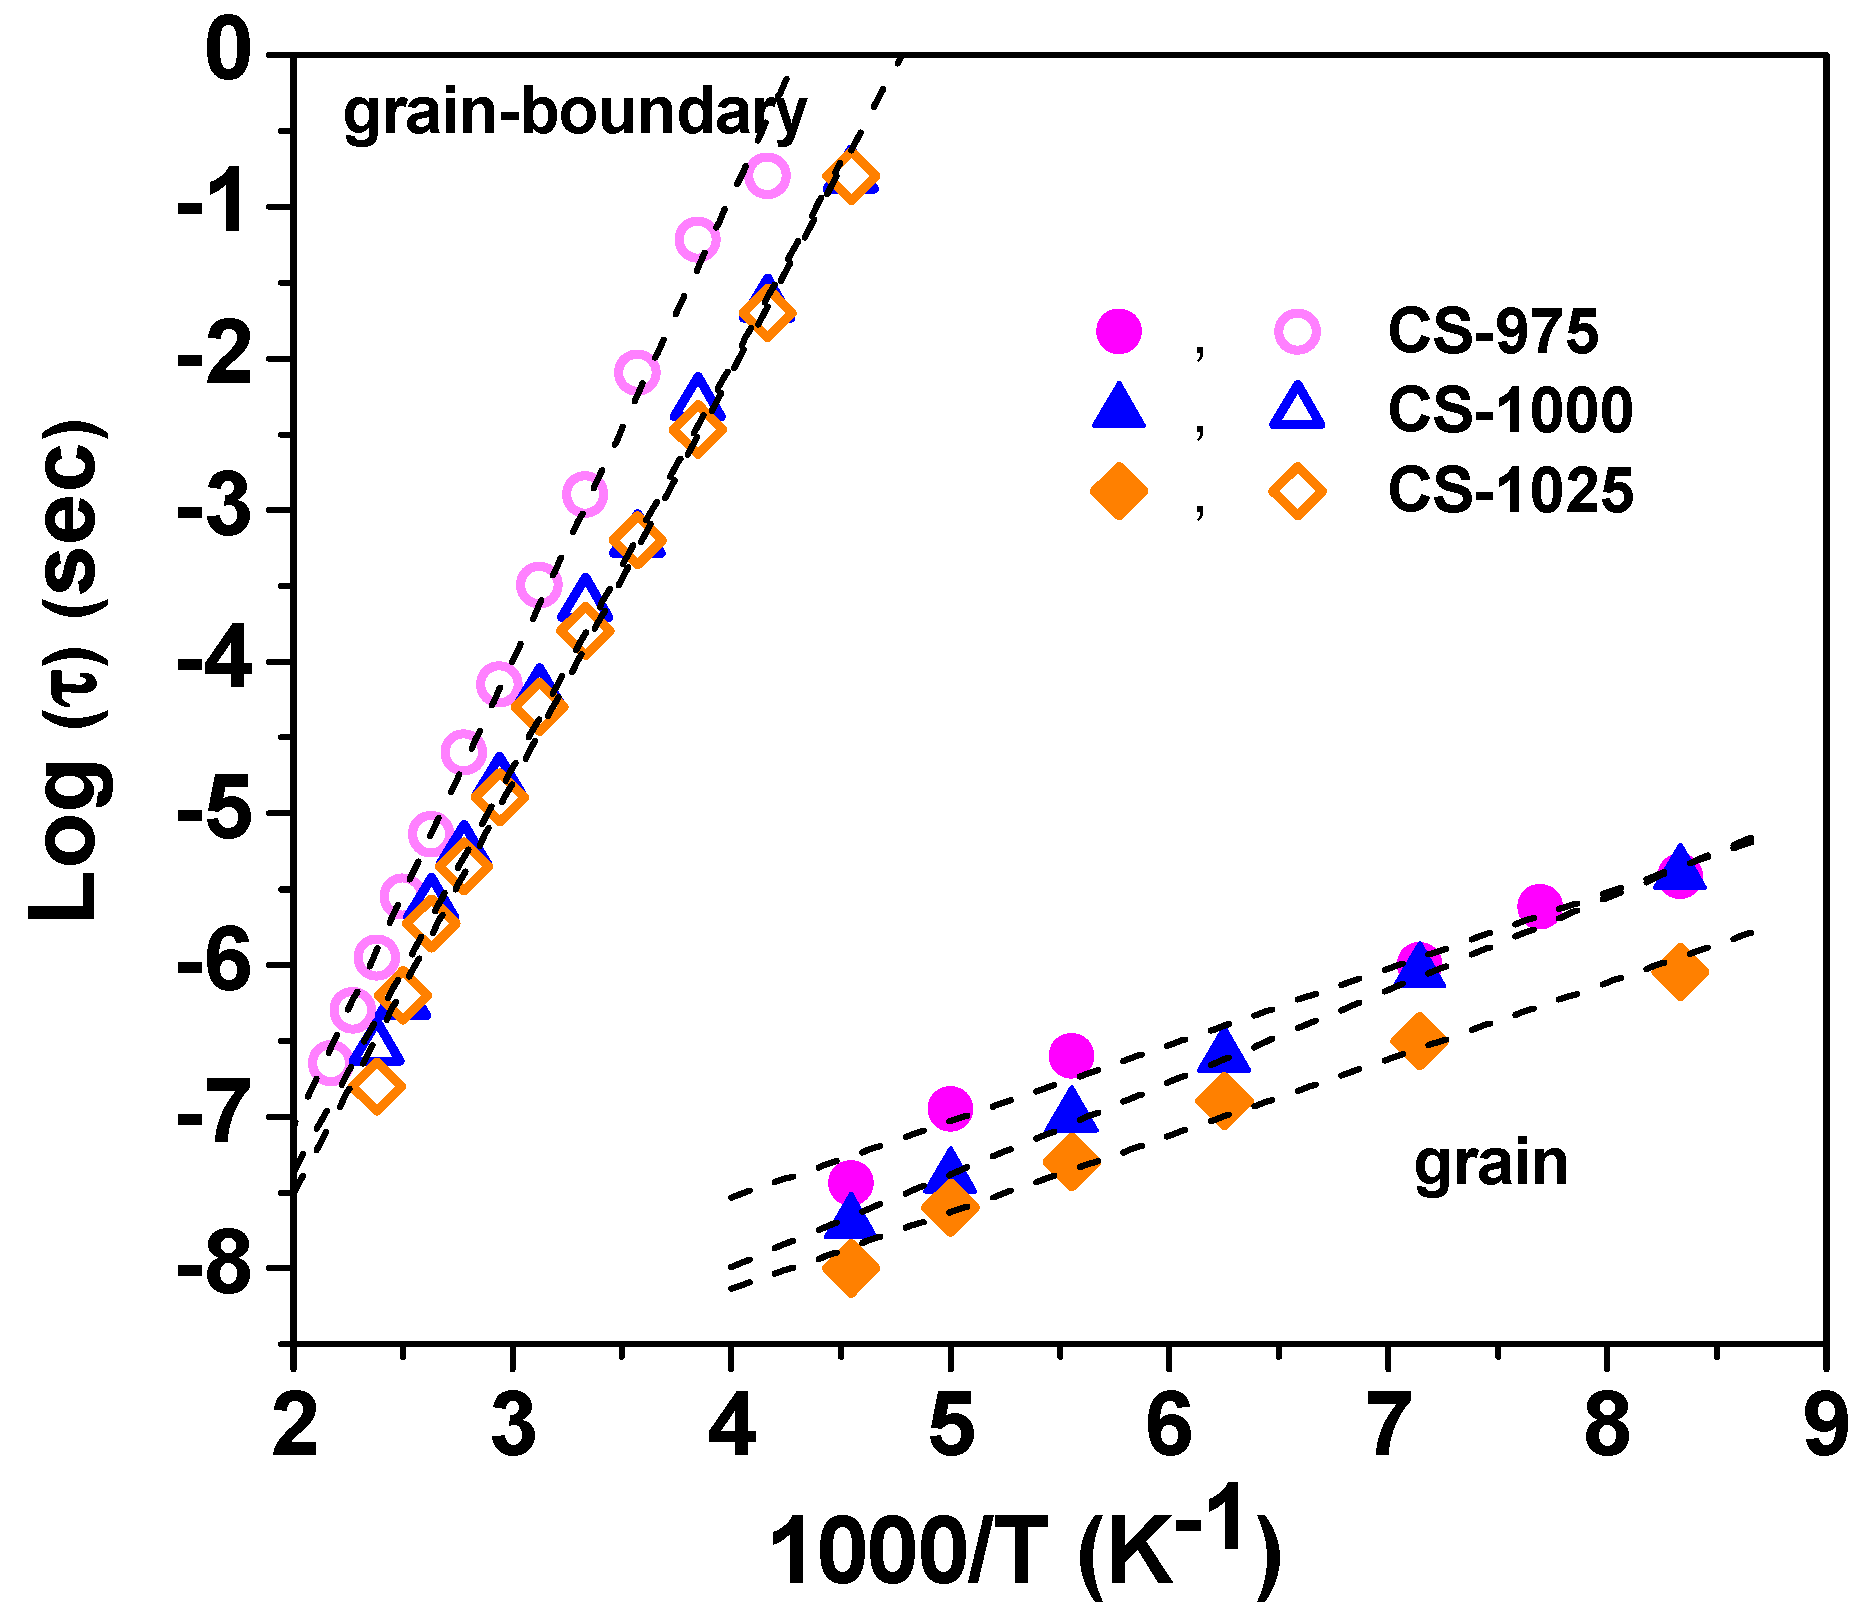
The relaxation time τ is determined from the peak frequency fmax as τ = 1/(2πfmax). Figure 10 shows the inverse temperature dependence of the relaxation time determined from the modulus spectra for the grains and grain boundaries. The activation energy of the relaxation processes was therefore calculated according to the Arrhenius relationship:
τ   =   τ 0 exp ( E R k B T )
where τ0 is the pre-exponential factor and ER is the activation energy for the relaxation process. The values of the relaxation energy in the grain and grain-boundary for the LCTO ceramics are given in Table 2. These values of the activation energies are similar to the reported values for the LCTO ceramics prepared by other techniques [24,25].

4. Conclusions

La2/3Cu3Ti4O12 (LCTO) ceramics were synthesized by mechanosynthesis and conventional sintering (CS) at a comparatively low temperature range (975–1025 °C) without calcination step. All the sintered LCTO ceramics showed CCTO-like body-centered cubic structure with space group Im3. The grain size of the LCTO ceramics is found to increase from 1.5 ± 0.5 to 2.3 ± 0.5 µm with increasing CS temperature from 975 to 1025 °C. The giant dielectric constant was obtained for the LCTO ceramics with the dielectric constant (1.7 × 10³–3.4 × 10³) and dielectric loss (0.09–0.17) at 300 K and 10 kHz. The sintered sample at 1025 °C showed the highest dielectric constant, while the sintered sample at 975 °C exhibited the lowest dielectric loss. The giant dielectric response of the current samples is believed to be related to the Maxwell–Wagner polarization effect of the ceramic samples.

Author Contributions

Conceptualization, M.M.A.; methodology, M.M.A., H.M.K., C.J., A.A.; validation, M.M.A., H.M.K., C.J.; formal analysis, M.M.A., H.M.K., C.J., S.K.; investigation, M.M.A., H.M.K., C.J., A.A.; resources, M.M.A., A.A.; writing—original draft preparation, M.M.A., H.M.K., C.J.; writing—review and editing, M.M.A., H.M.K., S.K., A.A.; project administration, M.M.A.; funding acquisition, M.M.A. All authors have read and agreed to the published version of the manuscript.

Funding

This research was funded by The Deanship of Scientific Research, King Faisal University, Saudi Arabia under the Nasher track project # 186130, and The APC was funded by # 186130.

Institutional Review Board Statement

Not applicable.

Informed Consent Statement

Not applicable.

Data Availability Statement

The data presented in this study are available on request from the corresponding author.

Acknowledgments

The authors are grateful for the financial support from The Deanship of Scientific Research, King Faisal University, Saudi Arabia under the Nasher Track project # 186130.

Conflicts of Interest

The authors declare no conflict of interest.

References

  1. Dobal, P.S.; Dixit, A.; Katiyar, R.S.; Yu, Z.; Guo, R.; Bhalla, A.S. Micro-Raman scattering and dielectric investigations of phase transition behavior in the BaTiO3-BaZrO3 system. J. Appl. Phys. 2001, 89, 8085. [Google Scholar] [CrossRef]
  2. Kim, B.G.; Cho, S.M.; Kim, T.Y.; Jang, H.M. Giant dielectric permittivity observed in Pb-based perovskite ferroelectrics. Phys. Rev. Lett. 2001, 86, 3404. [Google Scholar] [CrossRef] [PubMed] [Green Version]
  3. Yu, Z.; Ang, C.; Guo, R.; Bhalla, A.S. Ferroelectric-relaxor behavior of Ba(Ti0.7Zr0.3)O3 ceramics. J. Appl. Phys. 2002, 92, 2655. [Google Scholar] [CrossRef]
  4. Tang, X.G.; Chew, K.H.; Chan, H.L.W. Diffuse phase transition and dielectric tenability of Ba(ZryTi1-y)O3 relaxor ferroelectric ceramics. Acta Mater. 2004, 52, 5177. [Google Scholar] [CrossRef]
  5. Guillemet-Fritsch, S.; Valdez-Nava, Z.; Tenailleau, C.; Lebey, L.; Durand, B.; Chane-Ching, J.Y. Colossal permittivity in ultrafine grain size BaTiO3-x and Ba0.95La0.05TiO3-x materials. Adv. Mater. 2008, 20, 551. [Google Scholar] [CrossRef]
  6. Ahmad, M.M.; Alismail, L.; Alshoaibi, A.; Aljaafari, A.; Kotb, H.M.; Hassanien, R. Dielectric behavior of spark plasma sintered BaTi0.7Zr0.3O3 relaxor ferroelectrics. Results Phys. 2019, 15, 102799. [Google Scholar] [CrossRef]
  7. Cheng, Z.Y.; Katiyar, R.S.; Yao, X.; Bhalla, A.S. Temperature dependence of the dielectric constant of relaxor ferroelectrics. Phys. Rev. B 1998, 57, 8166. [Google Scholar] [CrossRef]
  8. Subramanian, M.A.; Li, D.; Duan, N.; Reisner, B.A.; Sleight, A.W. High Dielectric Constant in ACu3Ti4O12 and ACu3Ti3FeO12 Phases. J. Solid State Chem. 2000, 151, 323–325. [Google Scholar] [CrossRef]
  9. Ahmad, M.M.; Kotb, H.M. Giant dielectric properties of fine-grained Na1/2Y1/2Cu3Ti4O12 ceramics prepared by mechanosynthesis and spark plasma sintering. J. Mater. Sci. Mater. Electron. 2015, 26, 8939–8948. [Google Scholar] [CrossRef]
  10. Adams, T.B.; Sinclair, D.C.; West, A.R. Giant barrier layer capacitance effects in CaCu3Ti4O12 ceramics. Adv. Mater. 2002, 14, 1321. [Google Scholar] [CrossRef]
  11. Sinclair, D.C.; Adams, T.B.; Morrison, F.D.; West, A.R. CaCu3Ti4O12: One-step internal barrier layer capacitor. Appl. Phys. Lett. 2002, 80, 2153–2155. [Google Scholar] [CrossRef]
  12. Zhao, N.; Liang, P.; Wei, L.; Yang, L.; Yang, Z. Synthesis and dielectric anomalies of CdCu3Ti4O12 ceramics. Ceram. Int. 2015, 41, 8501–8510. [Google Scholar] [CrossRef]
  13. Sebald, J.; Krohns, S.; Lunkenheimer, P.; Ebbinghaus, S.G.; Riegg, S.; Reller, A.; Loidl, A. Colossal dielectric constants: A common phenomenon in CaCu3Ti4O12 related materials. Solid State Commun. 2010, 150, 857–860. [Google Scholar] [CrossRef] [Green Version]
  14. Sangwong, N.; Somphan, W.; Thongbai, P.; Yamwong, T.; Meansiri, S. Electrical responses and dielectric relaxations in giant permittivity NaCu3Ti3TaO12 ceramics. Appl. Phys. A 2012, 108, 385–392. [Google Scholar] [CrossRef]
  15. Hao, W.; Zhang, J.; Tan, Y.; Su, W. Giant Dielectric-Permittivity Phenomena of Compositionally and Structurally CaCu3Ti4O12-like oxide ceramics. J. Am. Ceram. Soc. 2009, 92, 2937–2943. [Google Scholar] [CrossRef]
  16. Schmidt, R.; Stennett, M.C.; Hyatt, N.C.; Pokorny, J.; Prado-Gonjal, J.; Li, M.; Sinclair, D.C. Effects of sintering temperature on the internal barrier layer capacitor (IBLC) structure in CaCu3Ti4O12 (CCTO) ceramics. J. Eur. Ceram. Soc. 2012, 32, 3313–3323. [Google Scholar] [CrossRef]
  17. Leret, P.; de la Rubia, M.A.; Rubio-Marcos, F.; Romero, J.J.; Fernández, J.F. Effect of Processing on the Sintering of High Dielectric constant CaCu3Ti4O12 ceramics. Int. J. Appl. Ceram. Technol. 2011, 8, 1201–1207. [Google Scholar] [CrossRef]
  18. Yu, H.; Liu, H.; Luo, D.; Cao, M. Microwave synthesis of high dielectric constant CaCu3Ti4O12. J. Mater. Process. Techol. 2008, 208, 145–148. [Google Scholar] [CrossRef]
  19. Samanta, B.; Nanda, D.; Kumar, P.; Sahu, R.; Swain, S.; Mahapatra, A. Giant dielectric response in microwave processed CaCu3Ti4O12 ceramics: A correlation among microstructure, dielectric and impedance properties. Process. Appl. Ceram. 2019, 13, 387–400. [Google Scholar] [CrossRef] [Green Version]
  20. Zhao, J.; Zhao, H.; Zhu, Z. Influence of sintering conditions and CuO loss on dielectric properties of CaCu3Ti4O12 ceramics. Mater. Res. Bull. 2019, 113, 97–101. [Google Scholar] [CrossRef]
  21. Boonlakhorn, J.; Kidkhunthod, P.; Thongbai, P. Investigation of the dielectric properties and nonlinear electrical response of CaCu3Ti4O12 ceramics prepared by a chemical combustion method. J. Mater. Sci. Mater. Electron. 2020, 31, 4511–4519. [Google Scholar] [CrossRef]
  22. Boonlakhorn, J.; Srepusharawoot, P.; Thongbai, P. Distinct roles between complex defect clusters and insulating grain boundary on dielectric loss behaviors of (In3+/Ta5+) co-doped CaCu3Ti4O12 ceramics. Results Phys. 2020, 16, 102886. [Google Scholar] [CrossRef]
  23. Prakash, B.S.; Varma, K.B.R. Effect of sintering conditions on the dielectric properties of CaCu3Ti4O12 and La2/3Cu3Ti4O12 ceramics: A comparative study. Phys. B Conden. Matter 2006, 382, 312–319. [Google Scholar] [CrossRef]
  24. Liu, Z.; Chao, X.; Liang, P.; Yang, Z.; Zhi, L.; Ihlefeld, J. Differentiated electric behaviors of La2/3Cu3Ti4O12 ceramics prepared by different methods. J. Am. Ceram. Soc. 2014, 97, 2154–2163. [Google Scholar] [CrossRef]
  25. Liu, Z.; Yang, Z.; Chao, X. Structure, dielectric property and impedance spectroscopy of La2/3Cu3Ti4O12 ceramics by sol–gel method. J. Mater. Sci. Mater. Electron. 2016, 27, 8980–8990. [Google Scholar] [CrossRef]
  26. Fu, Z.; Nie, H.; Wei, Y.; Zhang, B.; Chang, A. Effect of Mn-doping on microstructure and electrical properties of La2/3Cu3Ti4O12 ceramics. J. Alloys Compd. 2020, 847, 156525. [Google Scholar] [CrossRef]
  27. Liu, J.; Duan, C.G.; Mei, W.N.; Smith, R.W.; Hardy, J.R. Dielectric properties and Maxwell-Wagner relaxation of compounds ACu3Ti4O12 (A = Ca, Bi2/3, Y2/3, La2/3). J. Appl. Phys. 2005, 98, 093703. [Google Scholar] [CrossRef]
  28. Pelster, R.; Simon, U. Nanodispersions of conducting particles: Preparation, microstructure and dielectric properties. Colloid Polym. Sci. 1999, 277, 2–14. [Google Scholar] [CrossRef]
  29. Cabanas, M.C.; Reynaud, M.; Rikarte, J.; Horbach, P.; Carvajal, J.R. FAULTS: A program for refinement of structures with extended defects. J. Appl. Crystallogr. 2016, 49, 2259. [Google Scholar] [CrossRef]
  30. Koops, C.G. On the dispersion of resistivity and dielectric constant of some semiconductors at audiofrequencies. Phys. Rev. 1951, 83, 121–124. [Google Scholar] [CrossRef]
  31. Sinclair, D.C.; West, A.R. Impedance and modulus spectroscopy of semiconducting BaTiO3 showing positive temperature coefficient of resistance. J. Appl. Phys. 1989, 66, 3850–3856. [Google Scholar] [CrossRef]
  32. Costa, S.I.R.; Li, M.; Frade, J.R.; Sinclair, D.C. Modulus spectroscopy of CaCu3Ti4O12 ceramics: Clues to the internal barrier layer capacitance mechanism. RSC Adv. 2013, 3, 7030–7036. [Google Scholar] [CrossRef]
Figure 1. XRD pattern of mechanosynthesized La2/3Cu3Ti4O12 (LCTO) powder.
Crystals 11 00313 g001
Figure 2. Rietveld refinement of XRD profiles of the LCTO CS-975, CS-1000, and CS-1025 ceramics. The reflections marked by # at 27.78°, ~36.2°, and 54.62° are corresponding to the impurity phase of tetragonal rutile TiO2 phase (P42/mnm).
Crystals 11 00313 g002
Figure 3. FE-SEM micrographs of (a) LCTO powder and (b) CS-975, (c) CS-1000 and (d) CS-1025 LCTO ceramics.
Crystals 11 00313 g003
Figure 4. Complex impedance diagrams at selected temperatures for (a) CS-975, (b) CS-1000, and (c) CS-1025 LCTO ceramic. The insets show the high-frequency semicircles that correspond to grain response, whereas the large semicircles in the main graph represent the grain boundary contribution.
Crystals 11 00313 g004
Figure 5. Impedance complex plane plot of LCTO ceramics at 300 K where the inset shows the magnification at high frequencies.
Crystals 11 00313 g005
Figure 6. The temperature dependence of the grains and grain-boundary conductivity of LCTO ceramics.
Crystals 11 00313 g006
Figure 7. Frequency dependence of ε′ at selected temperatures for LCTO ceramics; (a) CS-975, (b) CS-1000, and (c) CS-1025.
Crystals 11 00313 g007
Figure 8. Frequency dependence of ε′ and tanδ at 300 K for LCTO ceramics.
Crystals 11 00313 g008
Figure 9. Modulus spectra of LCTO ceramics at selected temperatures: (a) CS-975, (b) CS-1000, and (c) CS-1025.
Crystals 11 00313 g009
Figure 10. Temperature dependence of the relaxation time determined from the modulus spectra.
Crystals 11 00313 g010
Table 1. Structural parameters obtained from Rietveld refinement of the XRD data of LCTO ceramics.
SampleCS-975CS-1000CS-1025
Space groupIm3Im3Im3
a = b = c (Å)7.416(3)7.417(1)7.422(1)
V (Å3)407.858(2)408.023(1)408.848(9)
χ21.171.191.22
Table 2. Room temperature resistivity (R), dielectric constant (ε′), dielectric loss (tanδ), and the value of activation energy (E) for conduction in the grain and grain boundary of CS-975, CS-1000, and CS-1025 LCTO ceramics.
SampleRg
(Ω·cm)
Rgb
(Ω·cm)
ε′
(at 10 kHz)
tanδ
(at 10 kHz)
Eg
(eV)
Egb
(eV)
ER(g)
(eV)
ER(g.b)
(eV)
CS-9759459.6 × 1061.7 × 1030.090.1410.6280.0990.608
CS-10004521.7 × 1063 × 1030.160.1410.5850.1210.535
CS-10254001.1 × 1063.4 × 1030.170.1290.5520.0990.528
Publisher’s Note: MDPI stays neutral with regard to jurisdictional claims in published maps and institutional affiliations.