Article

Upconversion Visible Light Emission in Yb/Pr Co-Doped Yttria-Stabilized Zirconia (YSZ) Single Crystals

School of Physical Science and Technology, Guangxi University, 100 East Daxue Road, Nanning 530004, China
*
Author to whom correspondence should be addressed.
These authors contributed equally to this work and should be considered co-first authors.
Crystals 2021, 11(11), 1328; https://doi.org/10.3390/cryst11111328
Submission received: 12 September 2021 / Revised: 29 September 2021 / Accepted: 28 October 2021 / Published: 31 October 2021

Abstract

:
As a development on previous research on single crystals of Pr3+-doped yttria-stabilized zirconia (YSZ), we report here the preparation and optical properties of Yb/Pr co-doped YSZ single crystals with different Yb2O3 concentrations. Results from X-ray diffraction (XRD) and Raman spectroscopy indicated that all of the crystal samples had a cubic phase structure, and transmission was ≥88% in the 550–780 nm range. Photoluminescence (PL) under excitation with a 980 nm laser showed upconversion emission, and several peaks were observed centered on 448 nm, 508 nm, 525 nm, 542 nm, 617 nm and 656 nm. The effects of excited state absorption (ESA), energy transfer upconversion (ETU), cross relaxation (CR), and cooperative energy transfer (CET) on the upconversion luminescence and energy transition mechanism in YSZ crystals were further studied. The fluorescence lifetime of the 3P03H5 transition at 542 nm reached 207 μs, which shows that the samples are of potential use for laser and fluorescence output.

Graphical Abstract

1. Introduction

Among the various hosts that have been used for the development of materials for luminescence, ZrO2 is favored for many applications because of its excellent thermal stability, chemical resistance, robust mechanical properties, and low phonon energy [1,2]. However, pure ZrO2 can exist in three distinct structures, and transformation between these phases involves appreciable changes in volume, which frequently results in the formation of cracks when preparing crystals from melts [3,4,5]. This problem can be overcome by doping ZrO2 with various metal oxides, such as for example Y2O3, to form solid solutions in which the presence of O-site vacancies decreases the Coulomb repulsion between the O2- ions [6,7,8]. Cooling calcined samples of yttria-stabilized zirconia (YSZ) to room temperature, different crystal phases may be formed dependent on their Y2O3 contents, but ZrO2 doped with 8 mol% Y2O3 (8YSZ) has been found to be adequate for complete stabilization of the high-temperature cubic structure at room temperature [4,9,10], and to be a good matrix for doping with various rare earth ions that exhibit valuable luminescence properties [11]. These include upconversion (UC) luminescence, which corresponds to the emission of light of higher energy than that responsible for the excitation, and results from the consecutive absorption of two or more photons. Such upconversion luminescence materials have widespread use in, for example, light harvesting, color displays, solar cells, cancer diagnosis and treatment, 3D photonic devices, and high-density optical storage, etc. [12,13]. The energy transfer modes vary between ions, and the different mechanisms for upconversion luminescence processes can be categorized as: excited state absorption (ESA), energy transfer upconversion (ETU), cooperative energy transfer (CET), photon avalanche (PA), and energy transfer medium upconversion (EMU) [14,15].
The Pr3+ ion has a wide range of potential applications as a result of high color purity emissions in the blue, green, red, and infrared regions that result from various 4f–4f transitions [16,17]. Although commercial praseodymium oxide is in the form Pr6O11, which presumably contains Pr3+ and Pr4+ valence states, it decomposes reversibly to a mixture of Pr2O3 and O2 at temperatures > 770 °C, and the dispersal of the Pr3+ in the YSZ matrix prevents the recombination reaction on cooling. Single doped Pr crystal samples were grown by the optical floating zone method using YSZ as the matrix material. X-ray photoelectron spectroscopy (XPS) analysis shows that Pr only exists in the form of Pr3+ in the YSZ crystal, and its downconversion emission peaks are located at 564, 587, 614, 639, and 716 nm under the excitation of 450 nm [18]. However, absorptions of Pr3+ in the infrared to near-infrared range have a low intensity, and it is necessary to incorporate appropriate sensitizers in the YSZ matrix in order to improve the intensity of these transitions for practical uses [10]. One such sensitizer is the Yb3+ ion, which has a relatively large absorption cross section for pumped photons near 980 nm (the 2F7/22F5/2 transition) [19,20]. The Yb3+ ion can then transfer energy to Pr3+ (via resonance energy transfer), because of the similarity in energy of the 2F5/2 (Yb3+) and 1G4 (Pr3+) states [21], which has been demonstrated in various investigations of Pr3+ and Yb3+ doubly doped materials [22,23]. This results in population of the Pr3+ 3P0 excited state, which decays by the spin-allowed 3P03Hj transition, which has a greater intensity than the alternative spin-forbidden 1D23Hj emission.
In the present paper, we report the preparation of large, high-quality Pr/Yb co-doped YSZ single crystals by the optical floating zone (FZ) method. These samples were all prepared with 0.15 mol% Pr6O11, which was shown in previous work to produce the maximum Pr3+ luminescence intensity [18], and the influence of different concentrations of Yb2O3 on the upconversion emission in the visible region was investigated following stimulation by a 980 nm laser.

2. Materials and Methods

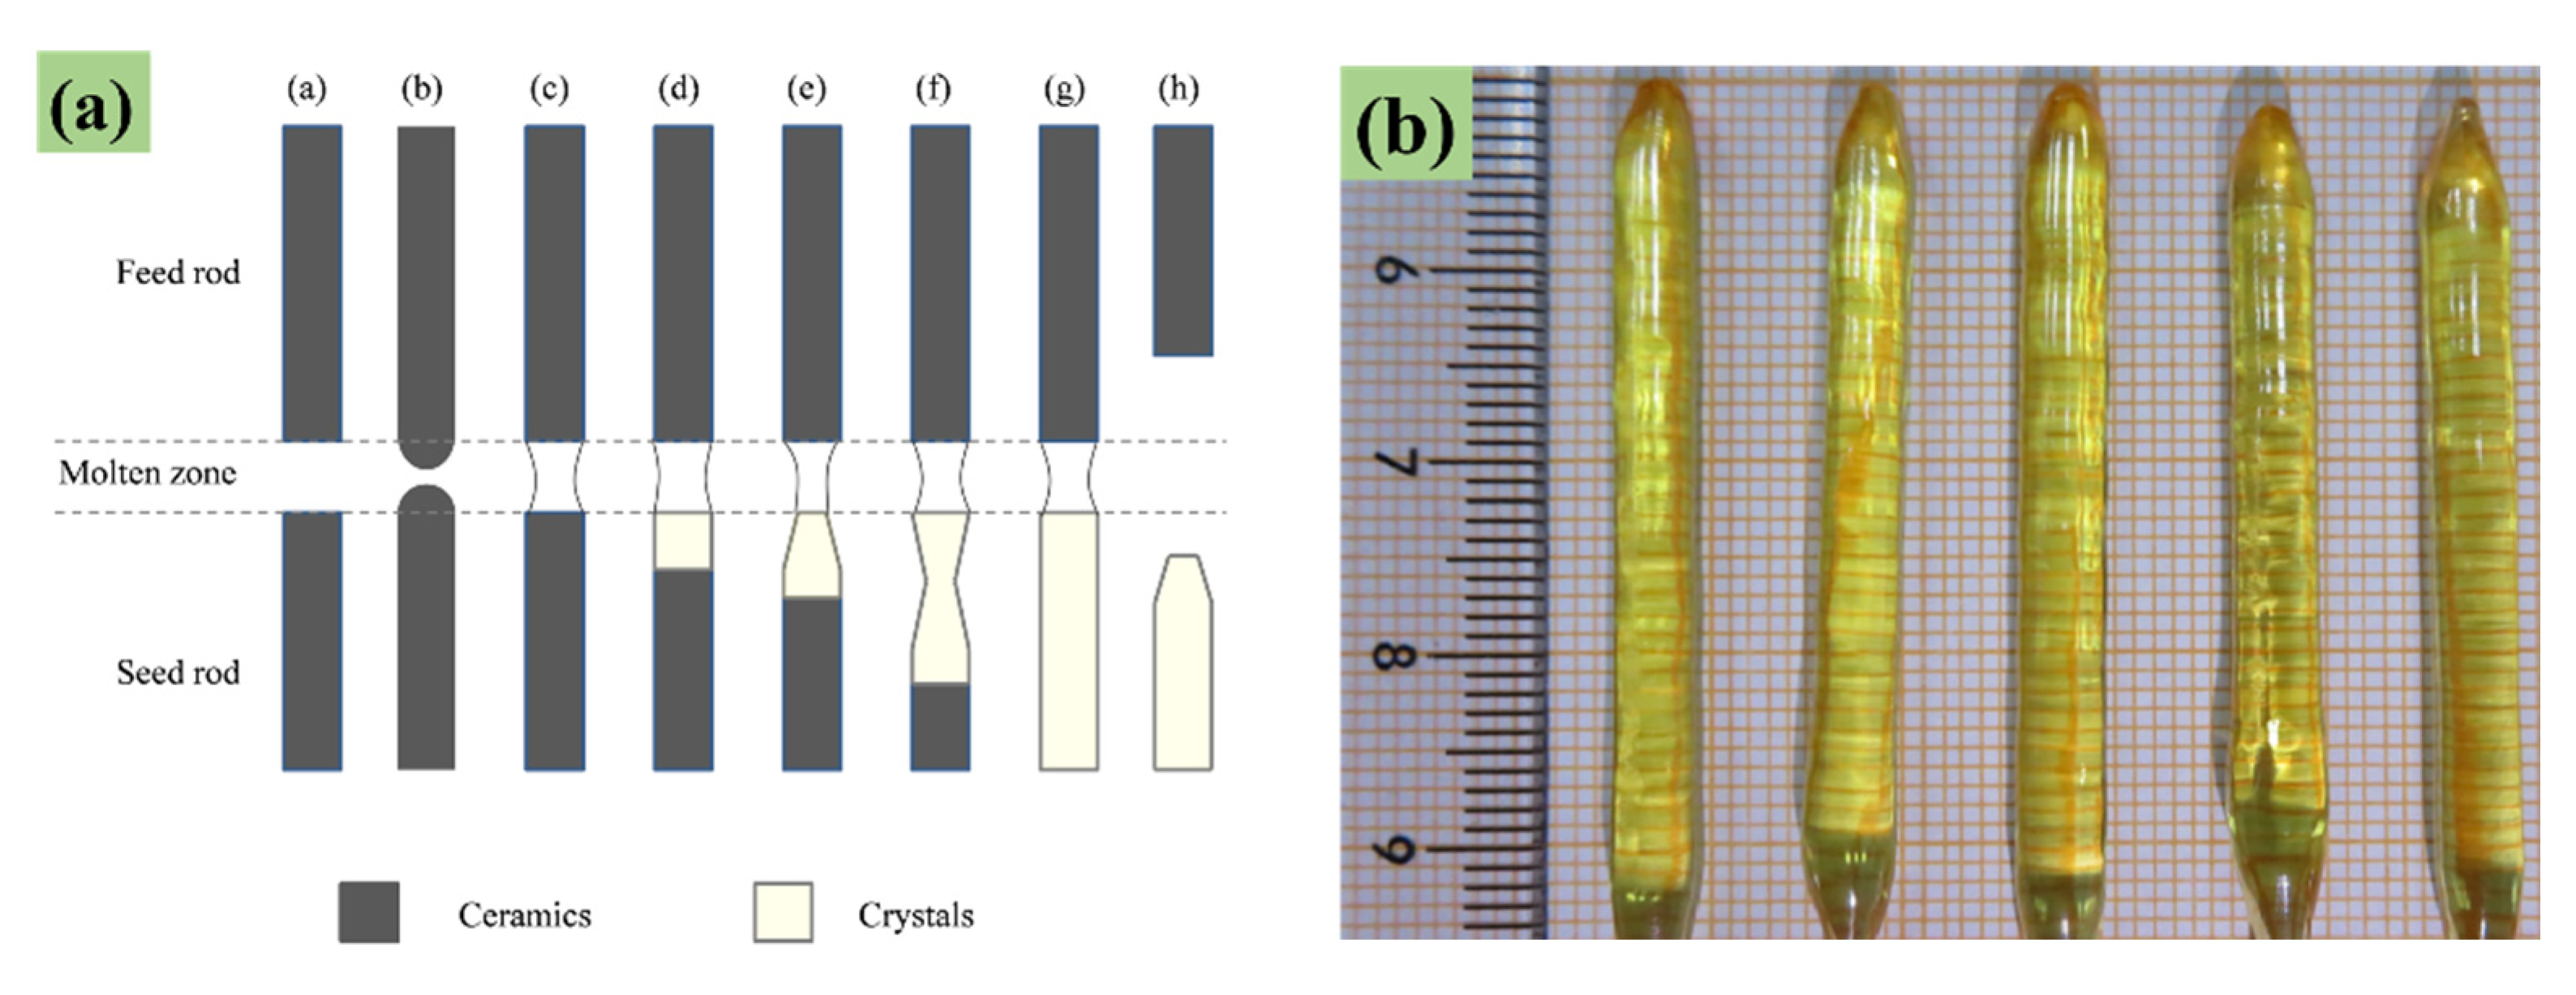
2.1. Sample Preparation

Samples were prepared with a composition based on 8YSZ (92 mol% ZrO2 + 8 mol% Y2O3) and contained 0.15 mol% Pr6O11 + x mol% Yb2O3 + (99.85 − x) mol% 8YSZ (x = 1.0, 1.5, 2.0, 2.5, 3.0 and 3.5), and used high-purity ZrO2 (99.99%, D50 ≈ 20 nm), Pr6O11 (99.9%), Yb2O3 (99.99%), and Y2O3 (99.99%, D50 ≈ 50 nm) nano-powders from Shanghai Aladdin Company. The raw materials were weighed in the proportions described in Table 1, mixed with anhydrous ethanol on a magnetic agitator for 24 h, and then dried. The dry mixture was then thoroughly ground in a mortar and pressed into balloon molds, using a hydraulic pressure of 68 MPa to form dense, uniform, and straight rods. These were then calcined at 1500 °C for 12 h to form pyknotic ceramic rods, which were used as seed and feed rods for an optical floating zone (FZ) furnace (FZ-T-12000-X-VII-VPO-GU-PC, Crystal Systems Corporation, Japan).
A schematic diagram for crystal growth from polycrystalline ceramic rods in the optical floating zone furnace is shown in Figure 1a, and the various steps can be summarized as follows: (a) two prepared ceramic rods are fixed to the upper and lower rods of the optical floating zone furnace and function as the feed and seed rods; (b) the power of the heating source is adjusted so that the top of the feed rod and bottom of the seed rod are fully melted; (c) during crystal growth, the feed and seed rods are rotated in opposite directions to improve the uniformity, and help prevent incorporation of impurities; (d) the assembly of the upper and lower rods is moved so that crystallization commences on the seed rod and the melting zone moves along the feed rod; (e) the rate of growth of a single-phase structure is controlled along the direction of movement; (f) shoulder spreading is performed to gradually increase the crystal diameter to the target size; (g) the crystal is grown to the target length with a relatively constant diameter under the controlled heating power and rate of movement; and (h) the melting zone is then reduced by adjusting the assembly speed and power of the heat source, and the crystal and the remaining ceramic materials are removed from the furnace when the temperature in the floating zone has decreased to an appropriate value.
In the present study, crystals were grown at a tension rate of 5 mm/h using a rotation speed of 10 rpm in a N2 atmosphere. The resulting crystals were about 50 mm in length and 5 mm in diameter, tawny in color (Figure 1b), and are denoted here as Yb/Pr: YSZ. In order to release residual thermal stress, the crystals were re-heated in a muffle furnace at 1500 °C for 24 h, after which they were cut into 1.2 mm-thick slices using a CN-XJ2012303 wire cutting machine, and polished on both sides to a thickness of about 1.0 mm using an XB-PG0013864 uniaxial polishing machine for Raman spectroscopic and optical measurements. In addition, ceramic and crystal samples were ground in an agate mortar to produce powders for X-ray diffraction (XRD) measurements.

2.2. Sample Characterization

Sample structures were characterized by XRD (Dandong Haoyuan Instrument Co., Ltd., Dandong, China) using Cu Kα radiation (λ = 1.5418 Å) and Raman spectroscopy (measured with a confocal Raman microprobe spectroscope equipped with a 532 nm laser, Zolix Instrument Co., Ltd., Beijing, China). Optical absorbance and transmittance of the crystal discs in the visible light region were determined with a UV-2700 UV-Vis spectrophotometer (Shimadzu Company, Kyoto, Japan) at room temperature. Upconversion photoluminescence spectra (UC PL) of the crystal discs were measured with a ZLF-325 photoluminescence spectrometer (Beijing Zolix Instrument Co., Ltd., Beijing, China) at room temperature using a 980-nm-wavelength laser as the pump light source; the luminescence spectra were continuously transformed in different energy ranges by three grating monochromators. Fluorescence decay was measured with an Edinburgh FLS1000 instrument (Edinburgh, UK) in order to characterize the probability of spontaneous transitions between the energy levels and the quantum efficiency and energy transfer of the luminescent ions in the host material. Chromaticity coordinates were calculated using Go-CIE software (, CIE1931xy.V.1.6.0.2).

3. Results and Discussion

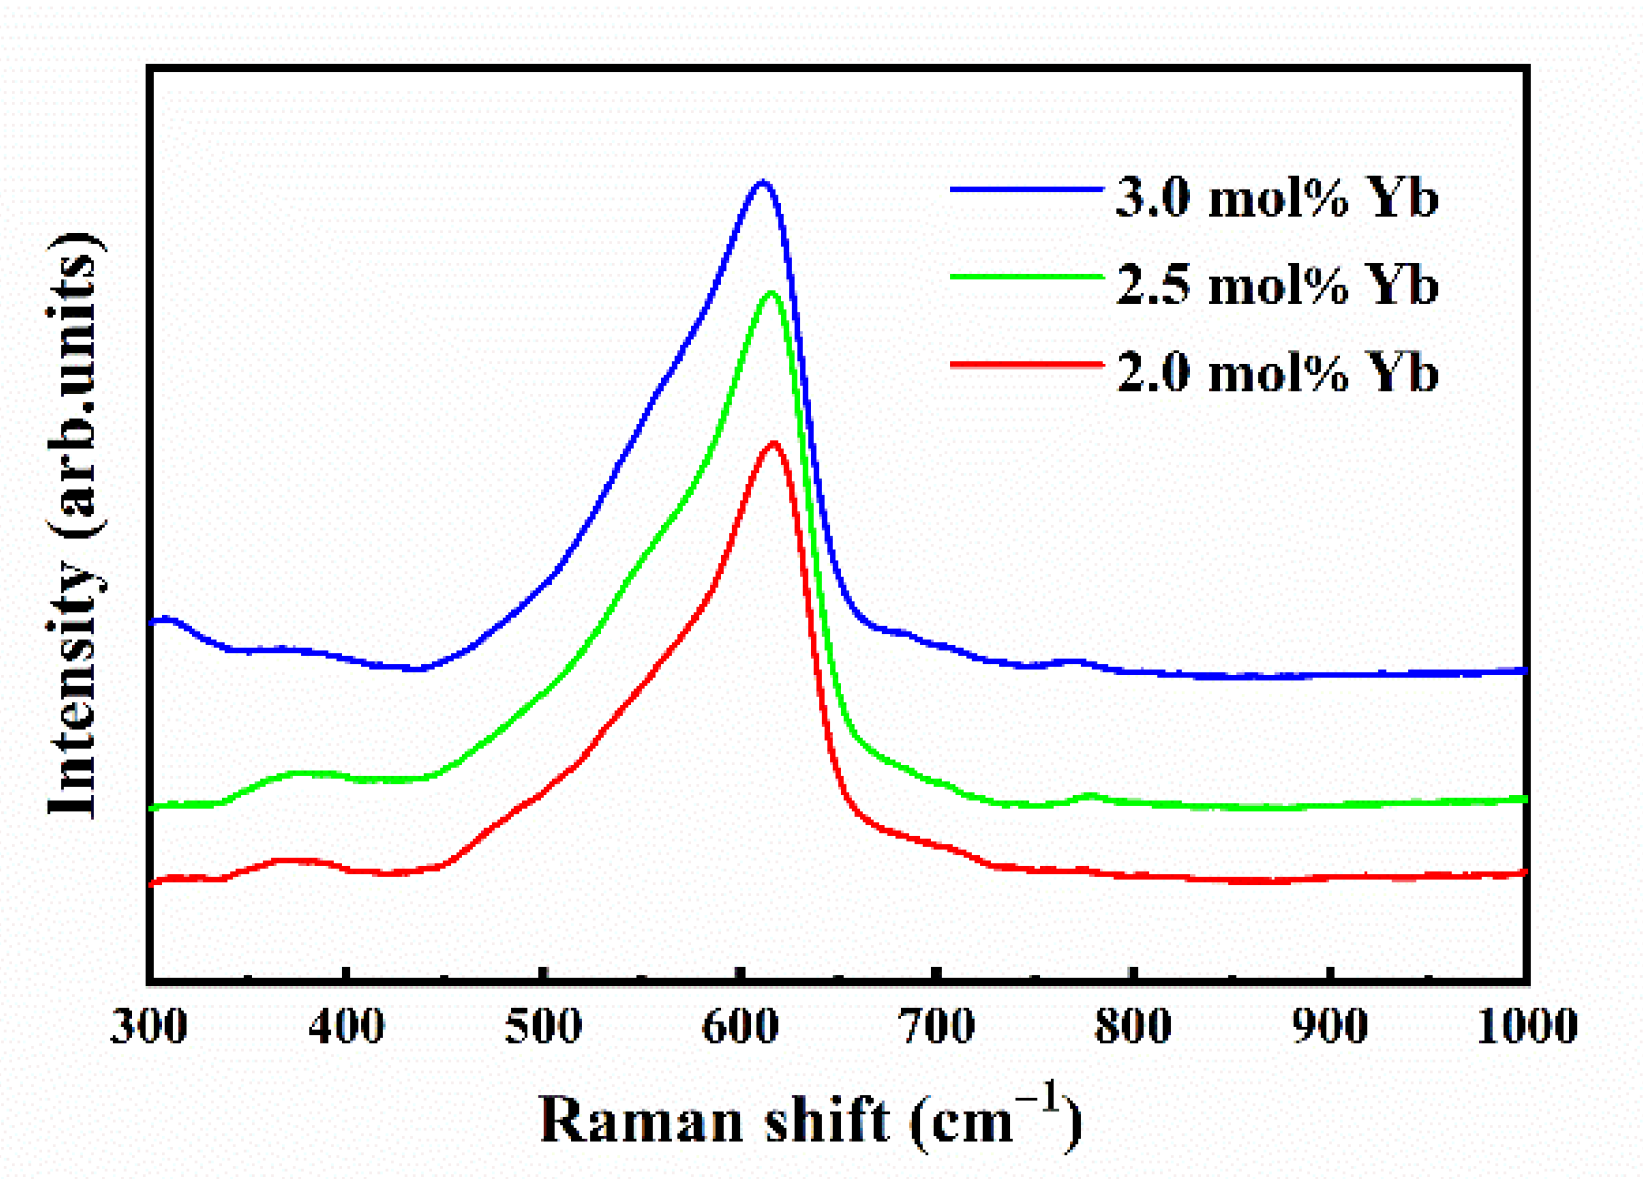
3.1. Raman Spectroscopic Analysis

Raman spectroscopy is a convenient method for distinguishing between the three structures of ZrO2: the monoclinic phase has 18 peaks (9Ag + 9Bg) [24], the tetragonal phase 6 peaks (A1g + 2B1g + 3Eg) [25], and the cubic phase just one peak (F2g) [26]. Examples of Raman spectra of Pr/Yb: YSZ crystal samples with Yb2O3 concentrations of 2.0 mol%, 2.5 mol%, and 3.0 mol%, are shown in Figure 2 for the range 3001000 cm1. Only one peak near 619 cm1 was detected with each sample, and its energy is very close to that reported for the cubic phase of YSZ (~ 620 cm1) [27]. Thus, all of the prepared samples are in the stable cubic-phase structure.

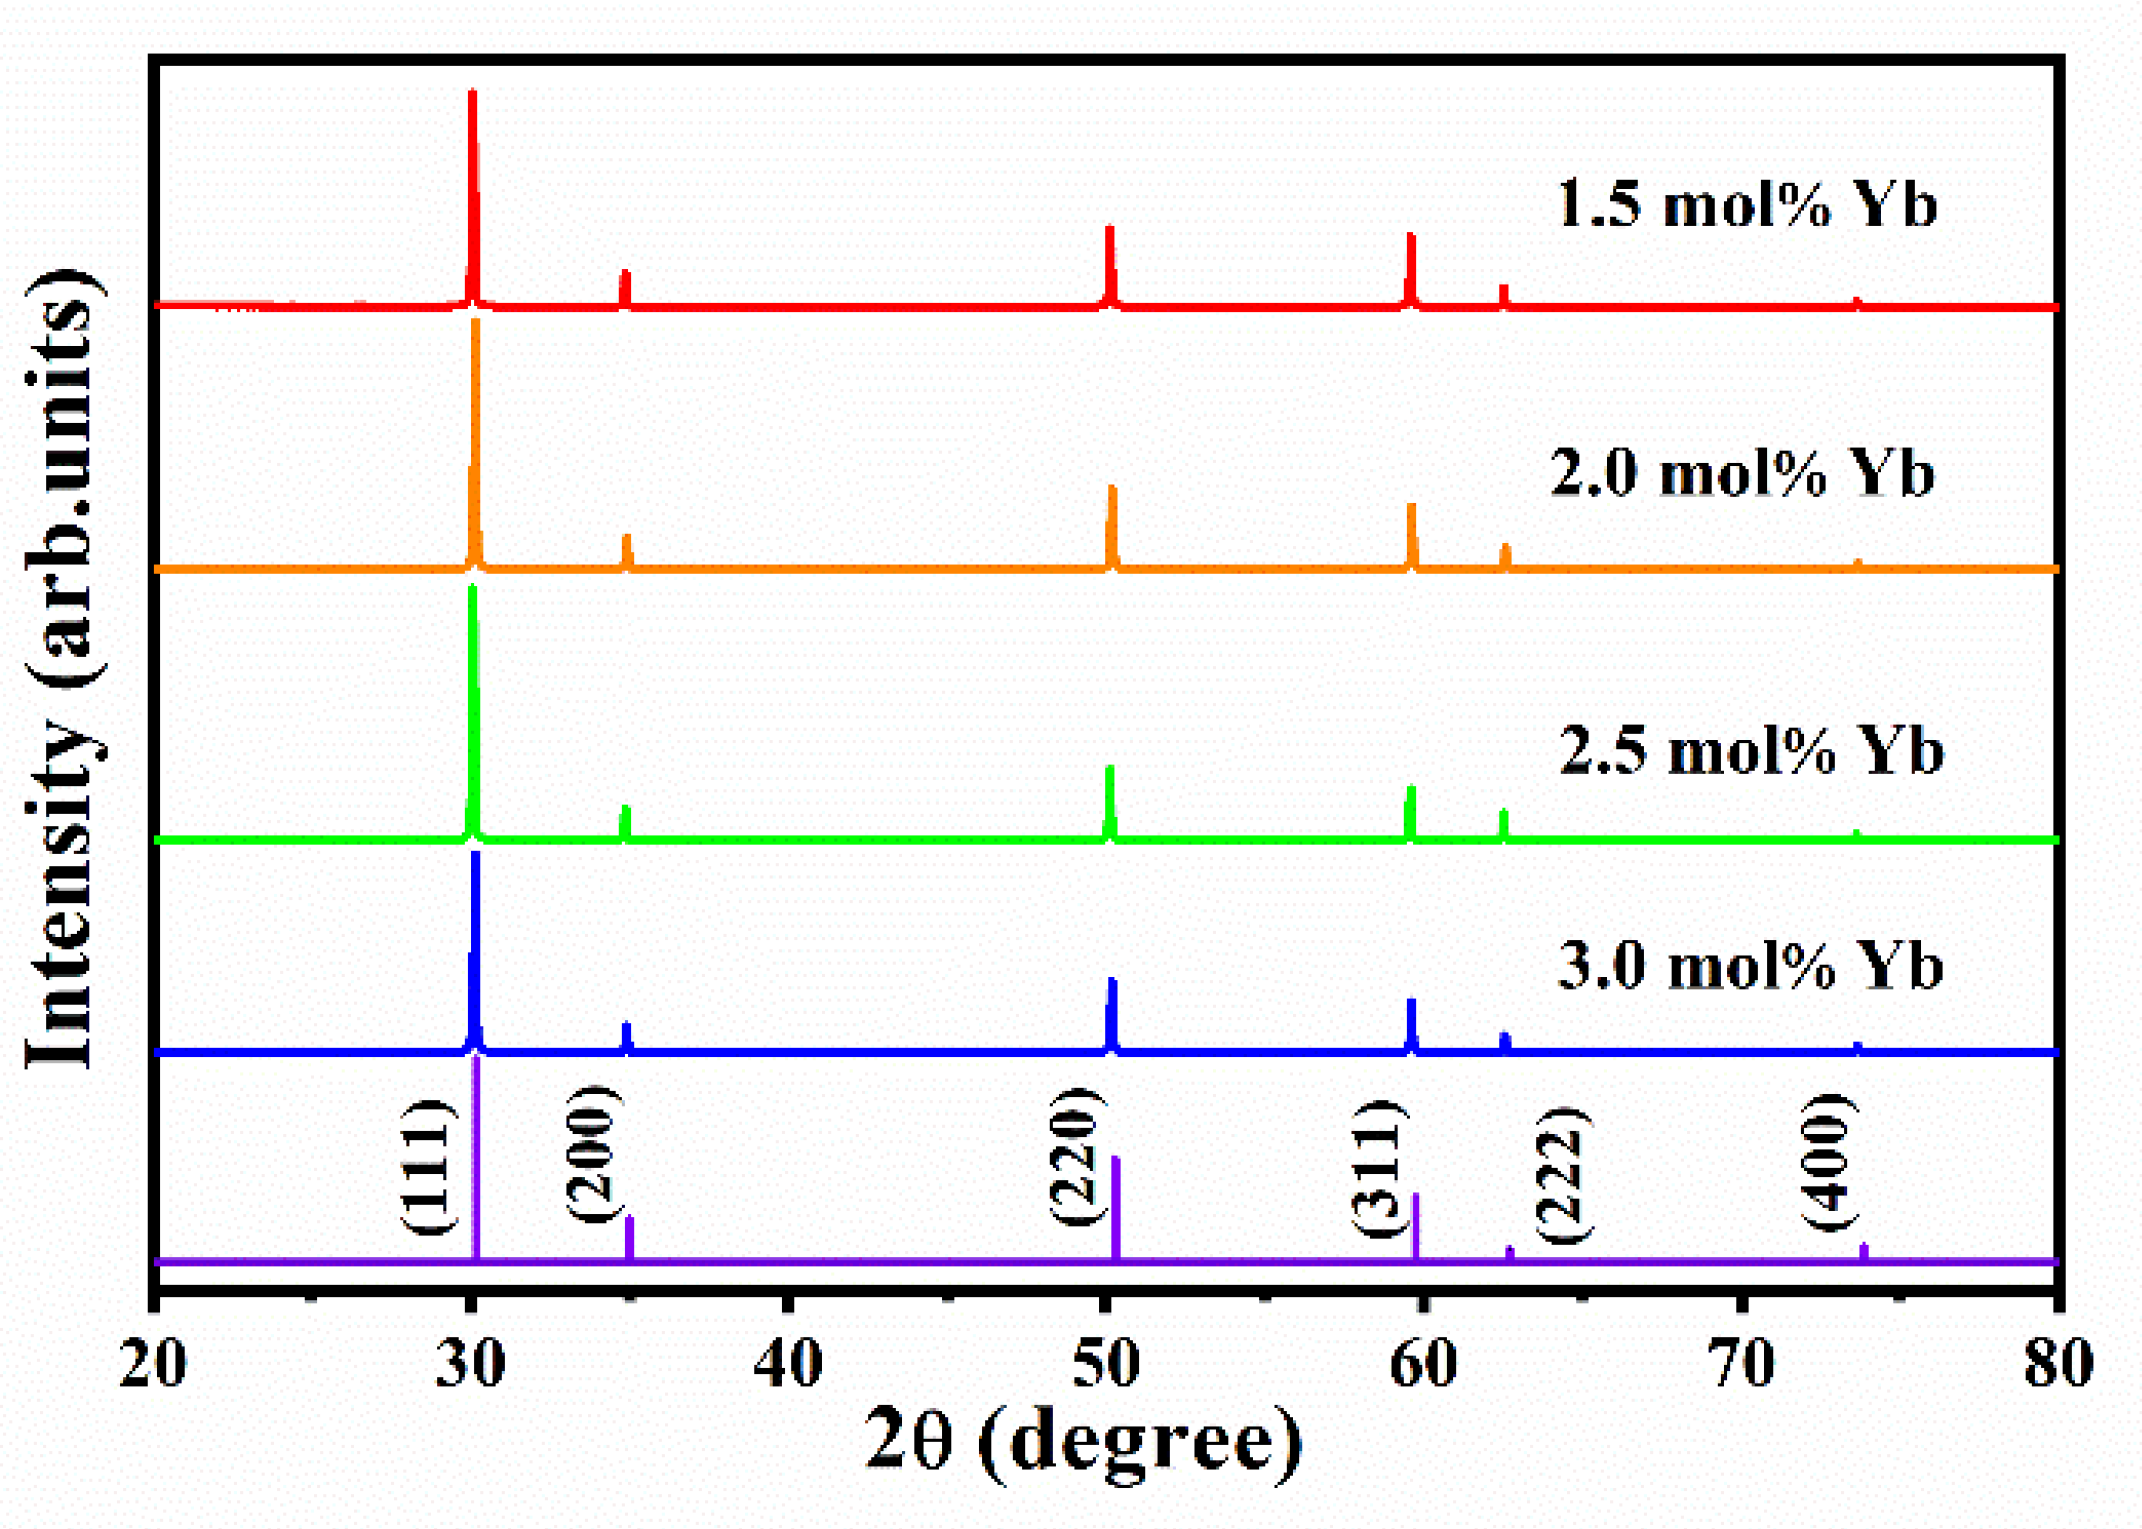
3.2. X-ray Diffraction (XRD)

XRD of the Yb/Pr: YSZ crystal powders in the range of 2080° are shown in Figure 3. There are six diffraction peaks at 30.13°, 34.91°, 50.17°, 59.63°, 62.56°, and 73.66°, and these are consistent with the (111), (200), (220), (311), (222), and (400) diffractions of the cubic zirconia standard card c-ZrO2 (JPDS 04-006-5589), respectively. No diffraction peak signals associated with other ZrO2 phases (monoclinic and tetragonal) were detected, nor were there any peaks that might be associated with other oxide phases. Thus, the addition of Pr3+ and Yb3+ had no effect on the YSZ structure, and the rare earth ions successfully entered the ZrO2 lattice.
The lattice constant, a, calculated from the crystal plane spacing d and its exponents, h, l, and k, using Jade software, are shown in Table 2 for each sample. This first increased with increasing Yb2O3 concentration, but then reached a maximum, and then decreased with further increases in Yb2O3. It is tempting to try to understand this trend in terms of the charges on the various cations and their ionic radii. In pure cubic phase zirconia, the Zr4+ ion has an 8-coordination structure, but addition of trivalent oxides, such as Y2O3, introduces oxygen vacancies and decreases the average Zr4+ coordination number [28]. As a result, the high temperature cubic structure is stabilized at room temperature when ZrO2 contains ≥8 mol% Y2O3. Addition of Pr3+ and Yb3+ to 8YSZ results in the generation of additional oxygen vacancies in the ZrO2 structure, but their effect is complicated by the fact that Pr3+ is larger than Y3+, whereas Yb3+ is smaller (for the same coordination number); furthermore, all of these trivalent ions are larger than Zr4+. In the present experiment, the Pr3+ content was held constant, and the Yb3+ content varied relative to Y3+ and Zr4+ (which had a constant ratio). At low Yb3+ contents, the lattice constant increased with increasing Yb3+, which is consistent with it randomly replacing Y3+ and Zr4+ in the YSZ structure. At the same time, the number of oxygen vacancies will also increase, and a decrease in the average coordination number of either the Y3+ and/or one or both of the rare earth ions would be expected to occur. When the concentration of Yb2O3 was increased to >2.5 mol%, the lattice constant began to decrease with increasing Yb3+, suggesting that the creation of oxygen vacancies had a major effect on the YSZ structure. However, because of the complexity of the interactions in multiply doped zirconia systems, elucidating the factors that determine the structure will be the subject of a future more detailed investigation.

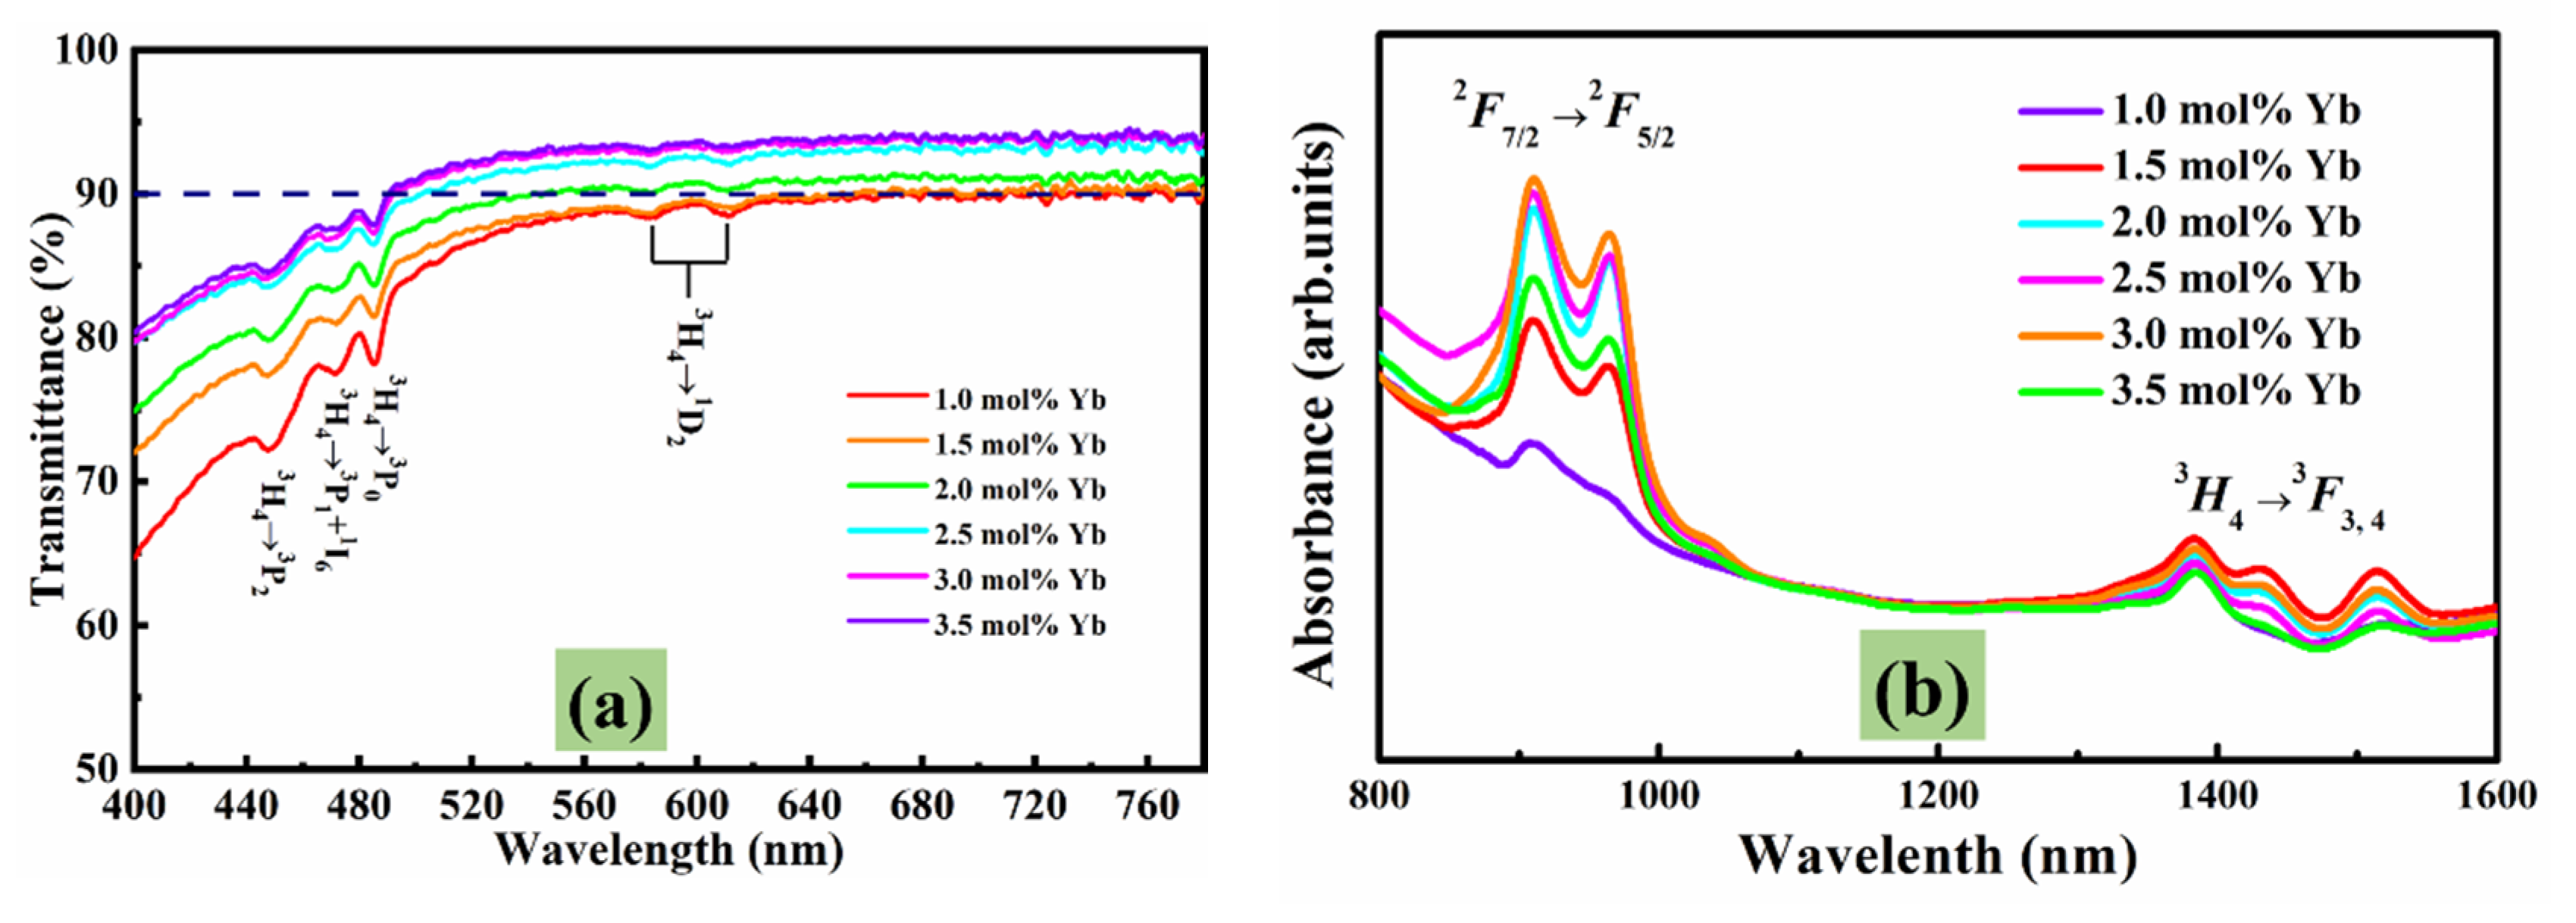
3.3. Transmission Spectra and Absorption Spectra

The transmission spectra of crystal discs prepared with different Yb2O3 concentrations are shown in Figure 4a for the range 400780 nm. These show good transparency in the visible region, with transmittance ≥88% for all samples in the 550780 nm range. However, transmittance was lower at 400550 nm and Pr3+ absorptions were observed at 448, 472, and 485 nm. These correspond to Pr3+ transitions from the 3H4 ground state to the 3P2, 3P1(1I6), and 3P0 excited states. The 3H41D2 transition near 600 nm is split into a double by the crystal field. The absorption spectra of the samples in the range of 800 to 1600 nm are shown in Figure 4b. The Yb3+ absorption in the range of 9001000 nm corresponds to the 2F7/22F5/2 transition, whilst the peak at 1400 nm corresponds to the 3H43F3,4 transition of Pr3+ [20,29].

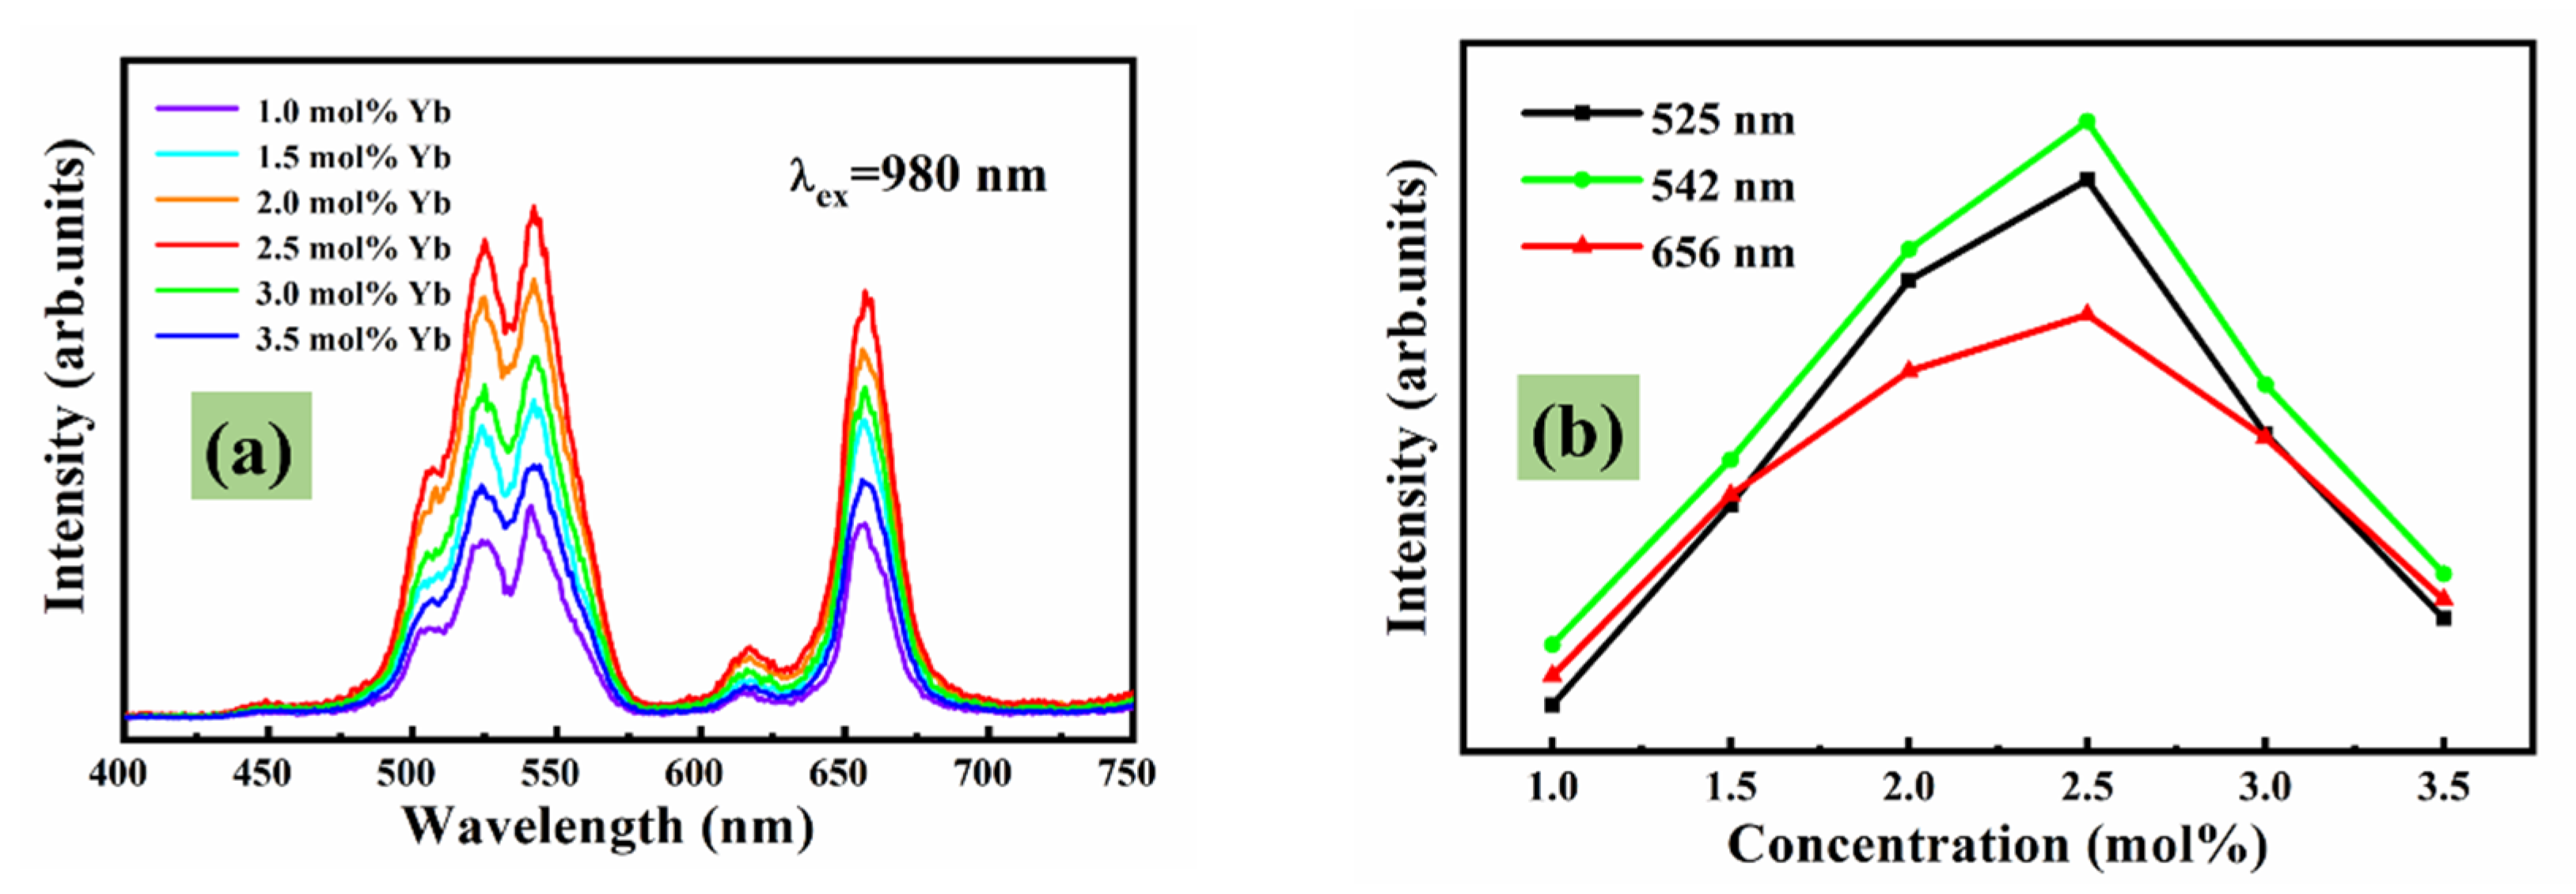
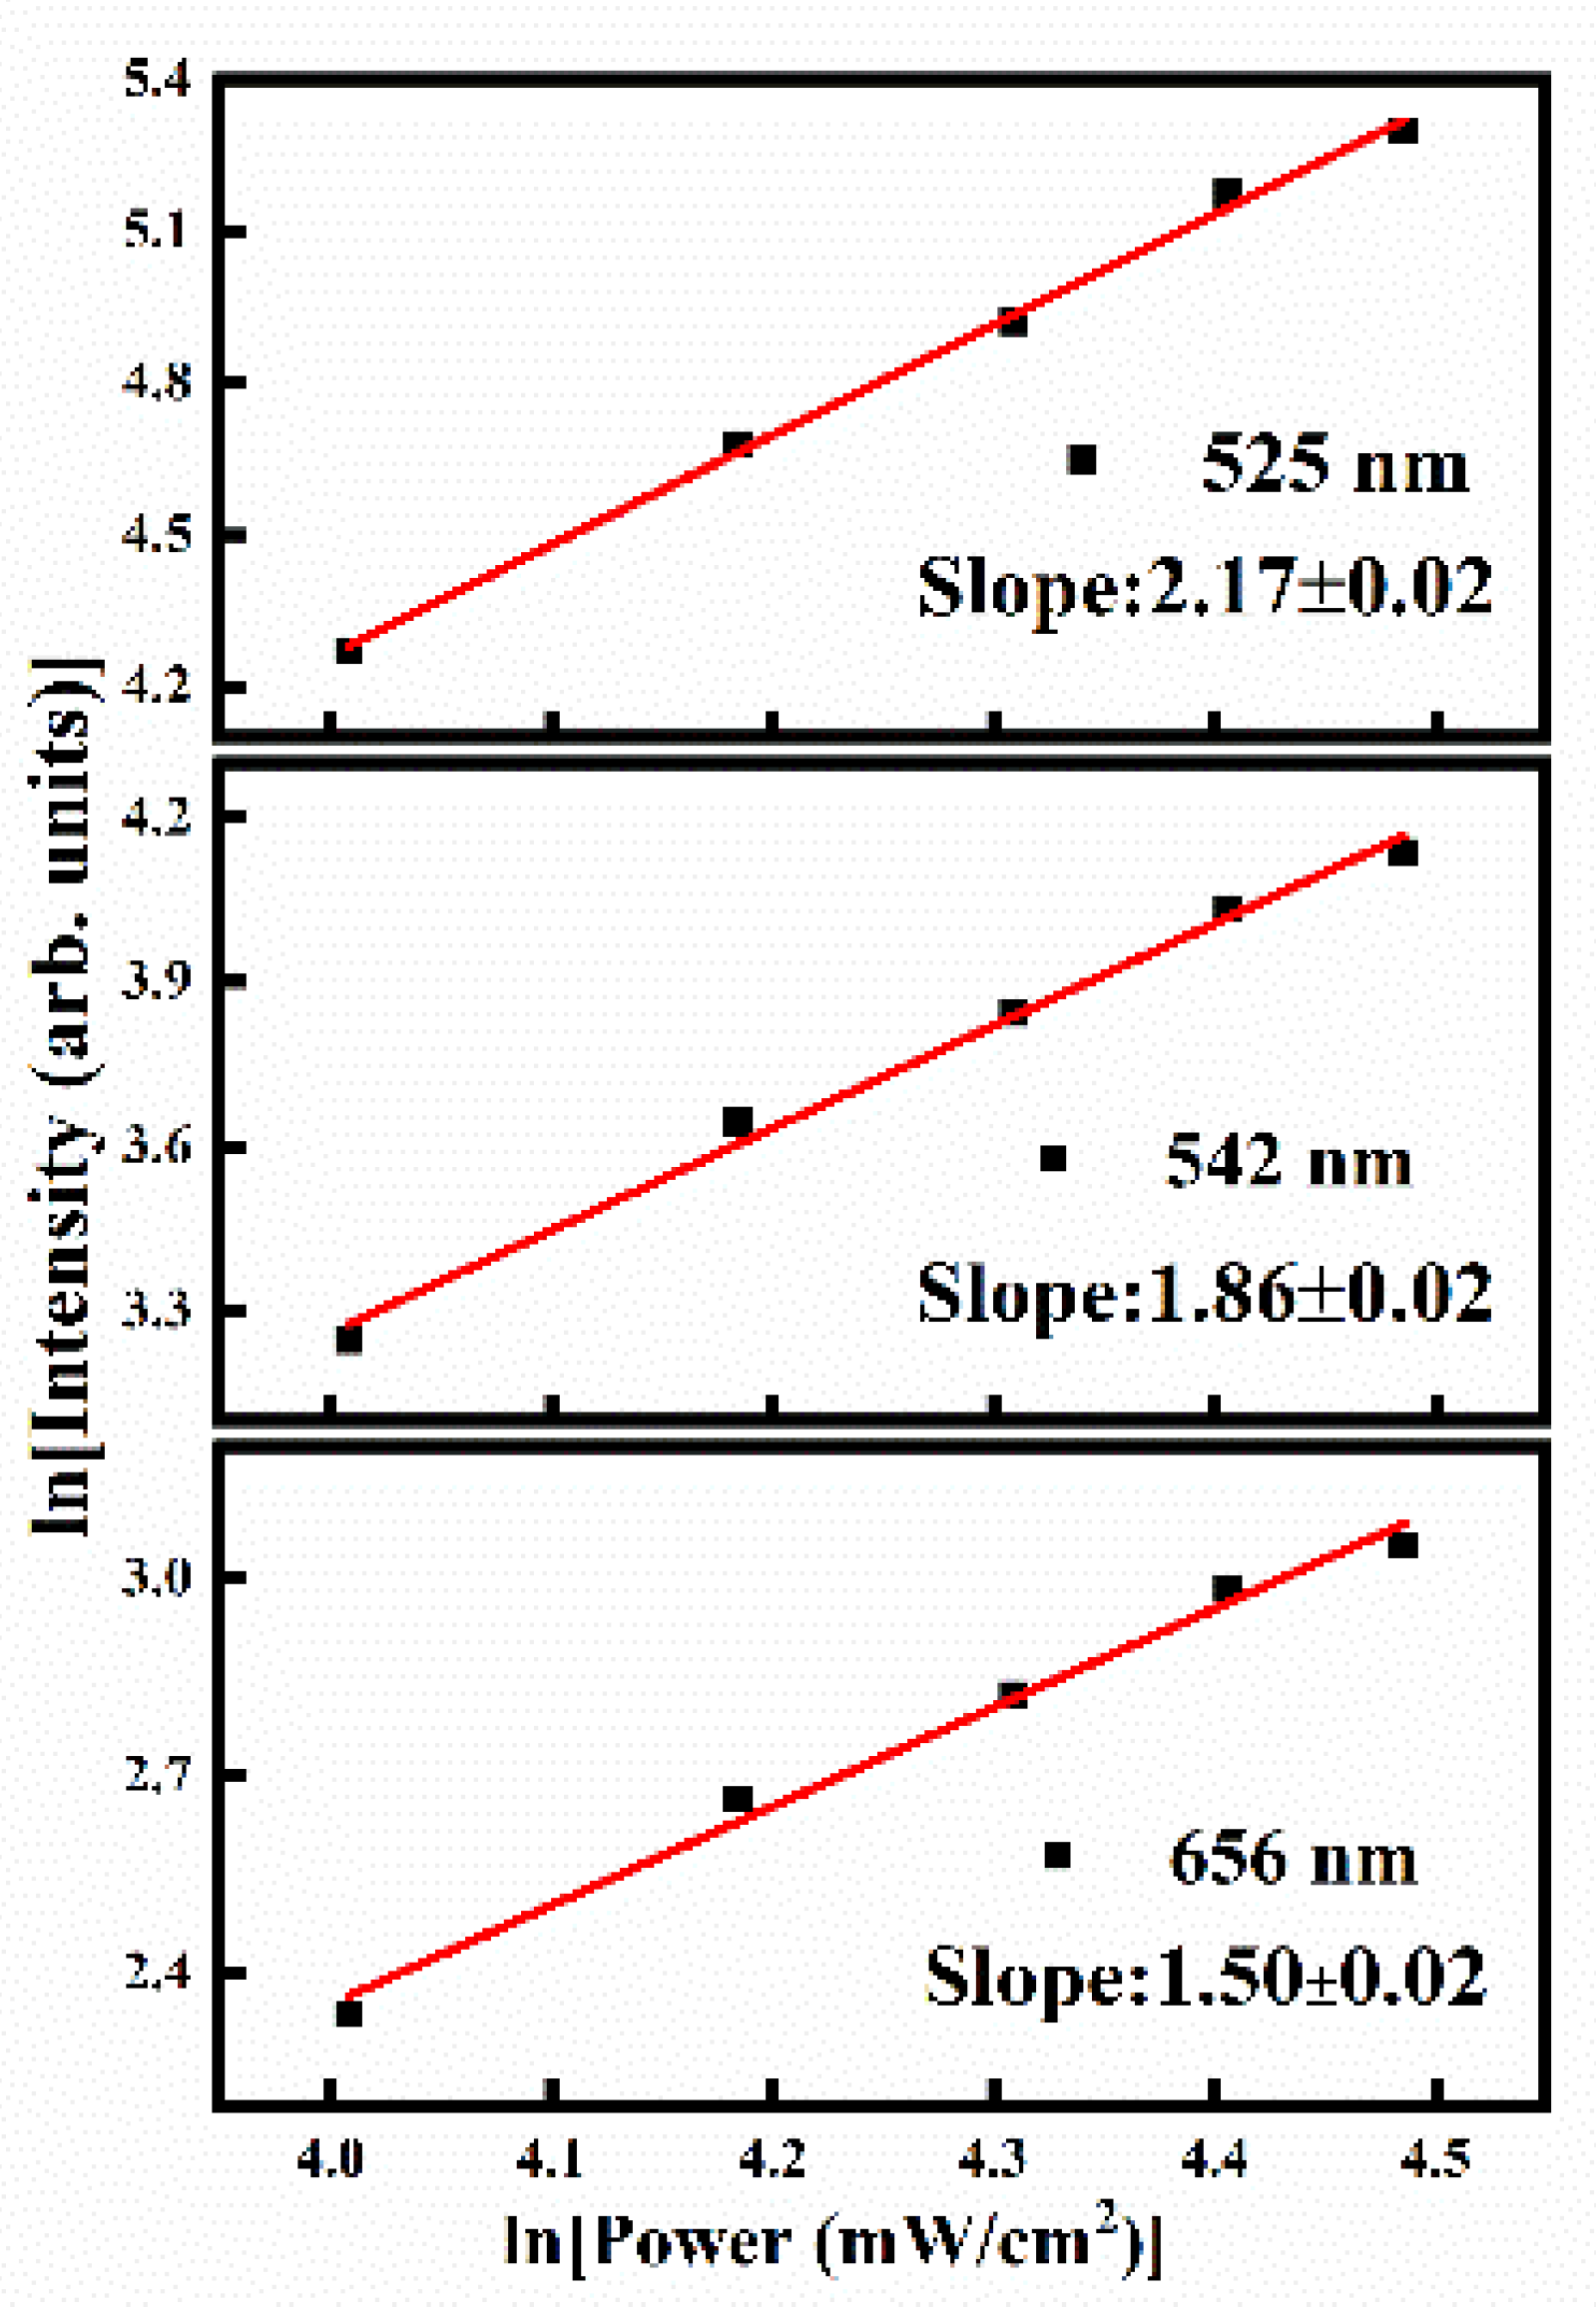
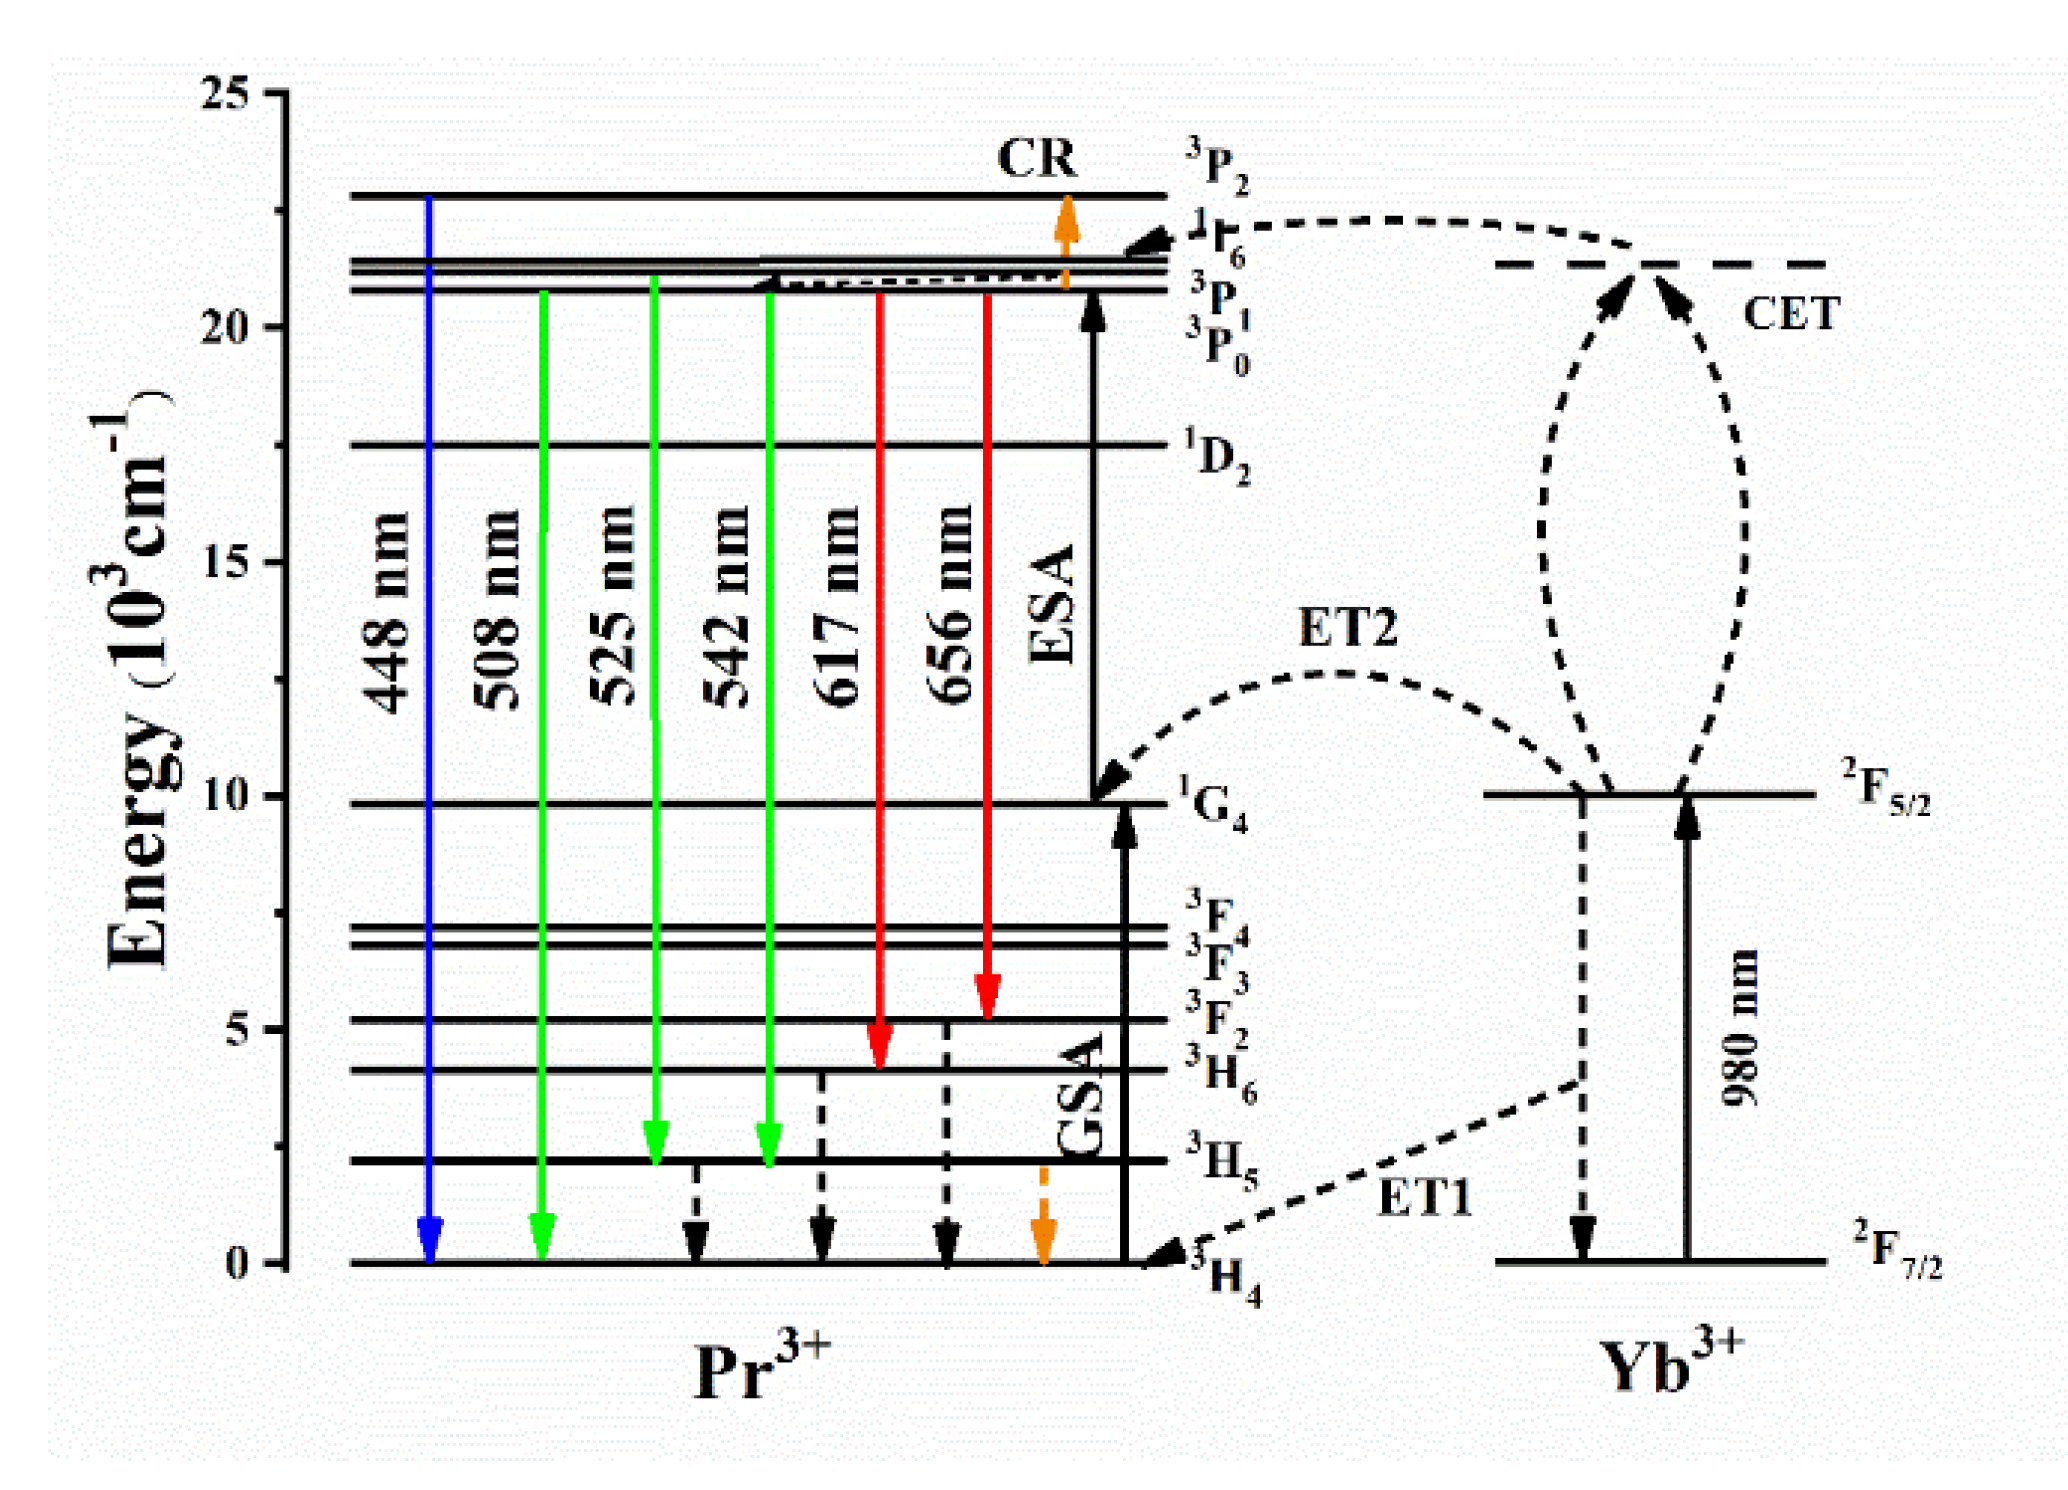
3.4. Luminescence Properties

Upconversion photoluminescence spectra of Yb/Pr: YSZ single crystal discs measured at room temperature using a 980 nm infrared laser as the excitation source are shown in Figure 5a for the range of 400750 nm. This figure shows the production of green emissions at 508, 525, and 542 nm; red emissions at 617 and 656 nm; and a very weak blue emission at 448 nm. Thus, the presence of Yb2O3 allowed absorption of infrared light at 980 nm, which then interacted with Pr3+ to produce upconversion luminescence in the visible light region. These upconversion photoluminescence spectra are similar in shape, and changes in the Yb2O3 concentration only affected the intensities, and not the peak positions.
The upconversion emission intensities of the crystal samples in the visible light region initially increased with an increasing Yb2O3 concentration but reached a maximum with the sample prepared with 2.5 mol%, then decreased with a higher Yb2O3 concentrations, as shown in Figure 5b. The variation in intensities of the peaks at 525 nm and 542 nm are essentially identical, whereas the red light emission at 656 nm was slightly less sensitive to the Yb2O3 concentration. With all samples, the 542 nm peak was the most intense, whereas the red light emission at 656 nm was weaker than the green light emission at 525 nm when the Yb2O3 concentration was between 1.5 and 3.0 mol%, but stronger for Yb2O3 concentrations outside of this range. Thus, the intensity of green light emission is more sensitive to the Yb2O3 sensitizer concentration than that of red light, and varying the sensitizer concentration provides a subtle mechanism for varying the color quality of the emitted light.
The conversion of low-energy into higher energy radiation involves the exchange of two or more low-energy photons into one higher-energy photon. The number of photons involved in the upconversion process can be determined from the relationship between the emission intensity, I, and the excitation power, P. I ∝ Pn, where n is the number of photons absorbed for the generation of each emitted photon.
Variation in the log of the luminescence intensity with the log of the pump power are shown in Figure 6 for the 525, 542, and 656 nm peaks in the 2.0 mol% Yb/Pr: YSZ crystal. These transitions produced lines with slopes of 2.17 ± 0.02, 1.86 ± 0.02, and 1.50 ± 0.02, respectively. Thus, the green and red emissions at 542 and 656 nm are two-photon processes, whilst the red emission at 525 nm may have a small contribution from a three-photon process.
The fluorescence decay lifetime is the time taken for the fluorescence intensity to decrease to 1/e of its maximum value after removing the pump source. The fluorescence decay curve is shown in Figure 7 for the Pr3+ transition at 542 nm (corresponding to 3P03H5) in a 2.0 mol% Yb/Pr: YSZ single crystal disc after excitation with a 980 nm laser. For single exponential decay curves, the decay time τ can be calculated by the following formula [30,31]:
I = I 0 exp ( t τ )
where τ is respectively the decay time, I is the luminescence intensity at time t, and I0 is the initial luminescence intensity after removing the pump source. The curve obtained can be fitted by a single exponential function, and the decay time obtained is 207 μs. This result was obtained with a 980 nm laser, which is both cheap and readily available, and further demonstrates that Yb/Pr: YSZ crystals have prospects for wide application in the visible light region.

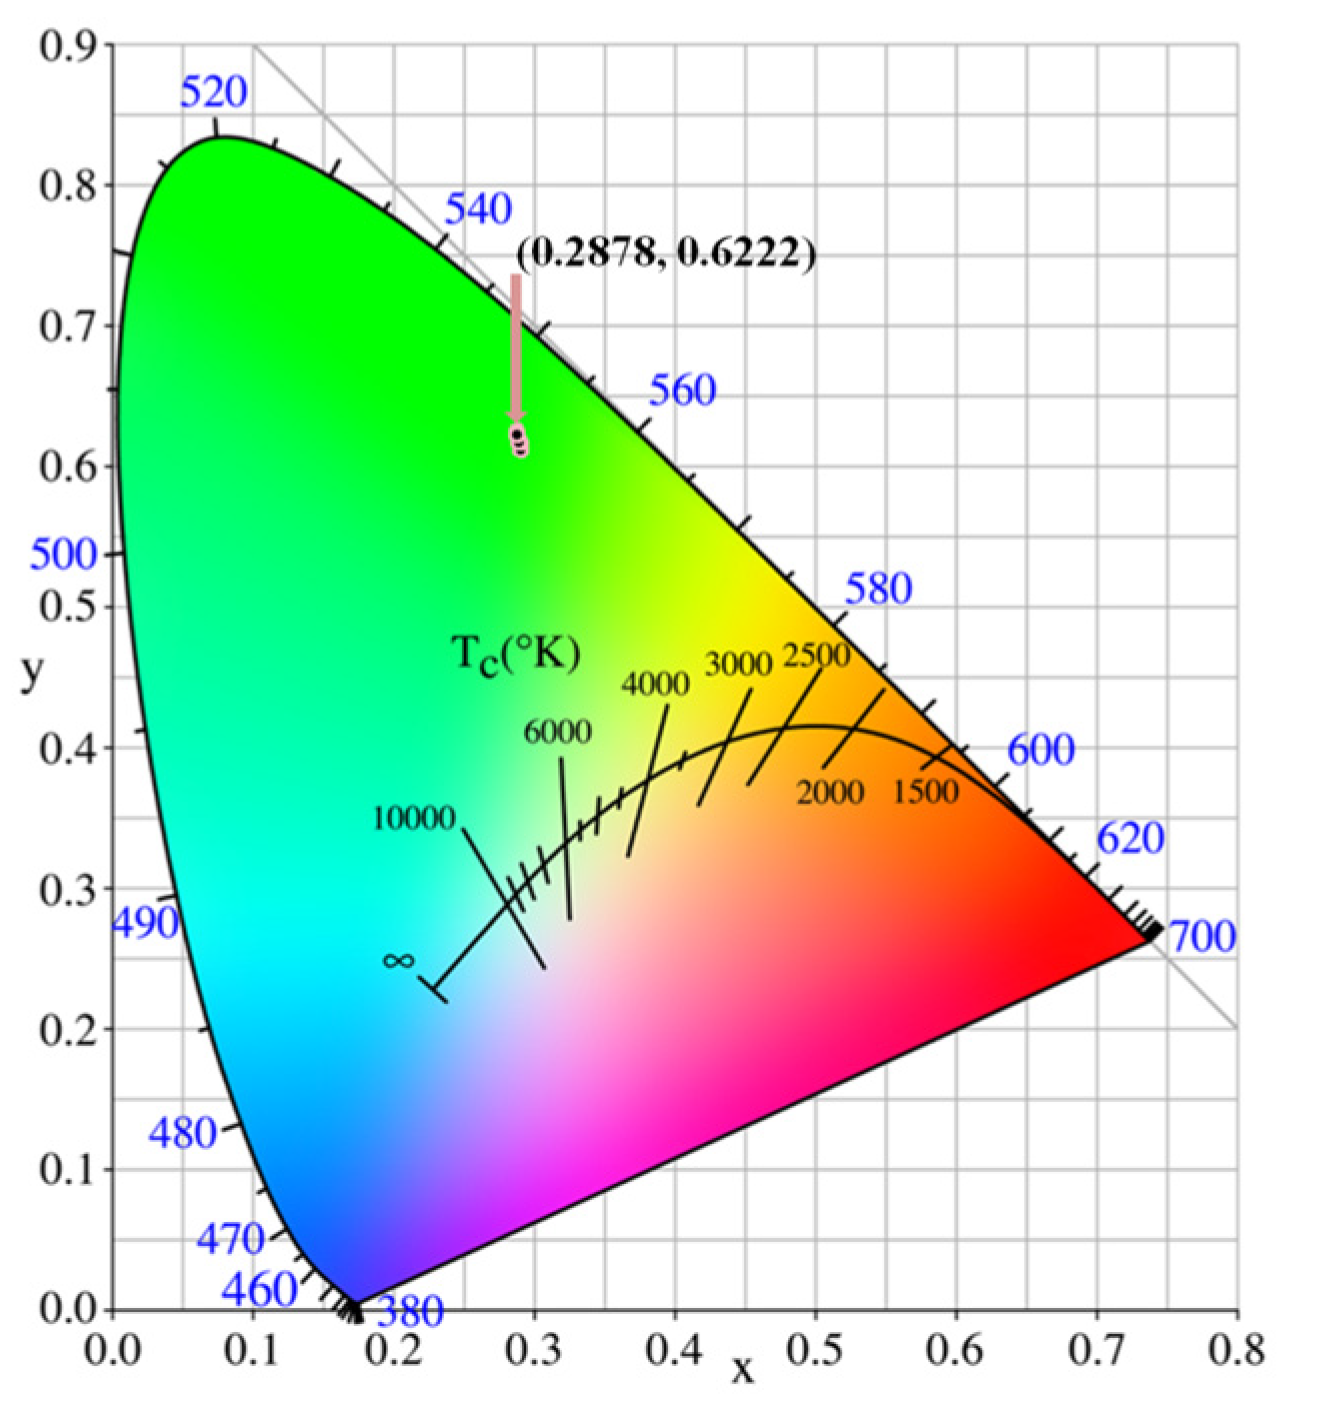
3.5. Chromaticity Coordinates

The chromaticity map defined by the International Council on Illumination (CIE) consists of a two-dimensional coordinate scheme in which the abscissa, x, which represents the red component, and the ordinate, y, representing the green component, are calculated for the visible light region of a luminosity spectrum by Go-CIE software.
All the color coordinates for the Yb/Pr: YSZ crystal samples were located in the green zone. Their values for different Yb2O3 concentrations are summarized in Table 3, and the CIE color coordinate diagram for the 2.5 mol% Yb/Pr: YSZ single crystal sample with values (0.2878, 0.6222) is shown in Figure 8.
The color purity can be calculated by Equation (2):
color   purity = ( x s x i ) 2 + ( y s y i ) 2 ( x d x i ) 2 + ( y d y i ) 2 × 100 %
where (xs, ys), (xi, yi), and (xd, yd) represent the color coordinates of the emission spectrum of the sample, the equal-energy white point, and the main wavelength of the light source, respectively.
Using these coordinates, the color purity of the 2.5 mol% Yb2O3 sample was calculated as 69.9%. The strong long wavelength red and short wavelength green components of the upconversion emission in the Yb/Pr: YSZ crystal samples are different from those observed with Pr-doped YSZ single crystal samples, where the spectral color coordinates are located in the red and orange region under blue light excitation [18]. Thus the addition of Yb3+ to Pr-doped YSZ single crystals alters the populations of the Pr3+ excited states, and enhances the green light emission.

4. General Discussion

The transitions between energy levels in the Yb/Pr: YSZ single crystal samples are summarized diagrammatically in Figure 9. The sensitizer, Yb3+, has a large absorption cross section at 980 nm, and its 2F7/2 ground state is excited by a pumped photon to the 2F5/2 excited state. Since the 2F5/2 (Yb3+) and 1G4 (Pr3+) levels are close to resonance, excited Yb3+ undergoes an energy transfer process (ET1) to a neighboring Pr3+, and enables excitation from the 3H4 ground state to the 1G4 excited state [21]. This metastable 1G4 state absorbs a photon from a nearby excited Yb3+ via the ET2 mechanism to generate Pr3+ in the excited 3P0 state. The upconversion phenomenon observed in these measurements occurs specifically as a result of interactions between the energy states of Pr3+ and Yb3+. In general, it is difficult to generate the Pr3+ 3P1 and higher energy states through energy transfer processes by a 980 nm pump. For example, in a study of Yb3+ and Pr3+ co-doped strontium aluminate nano-phosphor, Yadav et al. observed emission from the 3P23H4 transition at 445 nm upon excitation with a 532 nm laser, but no such transition was observed with a 980 nm laser [32]. Furthermore, although Zhu et al. reported observation of an emission peak near 440 nm in the upconversion emission spectrum from NaGd(WO4)2:Yb3+/Pr3+ microcrystals on excitation with a 980 nm laser, no further details were given [21]. In our present experiments, the upconversion luminescence mechanism for the blue emission at 448 nm, which results from excitation at 980 nm, is complex. Population of the 3P0 excited state of Pr3+ occurs via ET processes from Yb3+, but the complexity of the Pr3+ energy states results in cross relaxation (CR) between several pairs of energy levels during the luminescence process. For example, the 3P03P2 transition results in increased population of the 3P2 state [20,21], and the 3P23H4 transition produces the blue emission at 448 nm, which is very weak because of the low cross relaxation.
As mentioned above, it is difficult to generate the Pr3+ 3P1 and higher energy states through energy transfer using a 980 nm pump. Therefore, in addition to the broad absorption at around 980 nm (9301030 nm), there may be cooperative energy transfer (CET) in which Yb3+ undergoes synergistic upconversion absorption of two 980 nm photons to form a virtual state, which can then directly transfer energy to the Pr3+ 1I6 excited state. Furthermore, the 3P0 and 3P1 energy levels may result from Stark splitting caused by crystal field interactions. The green emissions at 525 nm and 542 nm are then subsequently generated as a result of transitions to the 3H5 energy level. Bimodal emission of green light at 525 nm and 542 nm can also be obtained as a result of non-radiative transition from the 3P2 excited state to the 3P1(1I6) and 3P0 energy levels, followed by transitions to 3H5. Although bimodal green light emission has also been reported by Ding et al. for Pr3+–Yb3+ co-doped gallo-germanate glasses and glass ceramics [33], in the present study, CET upconversion and ET upconversion appear to be more important. The observed emissions are thus primarily derived from the Pr3+ ion, with that at 508 nm corresponding to 3P03H4; those at 525 and 542 nm to 3P1(1I6) → 3H5 and 3P03H5, respectively; that at 617 nm to 3P03H6; and that at 656 nm to 3P03F2.

5. Conclusions

The series of Yb/Pr: YSZ single crystals grown by the optical floating zone method had no cracks, pores, or impurities, and good optical transparency. All of these crystals were confirmed to have the cubic ZrO2 structure by their Raman spectra, which showed a single peak at 619 cm1, and no peaks other than those from c-ZrO2 were detected in the XRD measurements.
Under excitation with a 980 nm laser, all of the Yb/Pr: YSZ single crystal samples showed upconversion emissions in the visible region with the observation of peaks at 448, 508, 617, and 656 nm from the Pr3+ transitions 3P23H4, 3P03H4, 3P03H6, and 3P03F2, respectively. The emission intensity was at a maximum for both the upconversion green and red light when the Yb2O3 doping concentration was 2.5 mol%, although the green light emission was more sensitive to the Yb2O3 concentration than the red light. Bimodal emission of green light may involve non-radiative transitions from the excited state 3P2 levels to the 3P1(1I6) and 3P0 states, but this has only a small probability, and cooperative energy transfer upconversion and excited state absorption are more important mechanisms in these crystal samples. Furthermore, the weak blue emission at 448 nm indicates the presence of cross relaxation mechanisms in the studied samples. High-energy transition emission with a long fluorescence lifetime is obtained by low-energy 980 nm laser excitation, which creates a broad application potential for such crystals grown by the optical floating zone method.
Overall, this work confirms the excellent properties of YSZ single crystals as matrix materials for the observation of luminescence from rare earth ions, and demonstrates that Yb/Pr co-doped YSZ single crystals have considerable potential for application as solid-state laser devices.

Author Contributions

Conceptualization, D.W., W.W. and S.X.; methodology, D.W. and W.D.; software, D.W. and X.T.; validation, W.D., B.A.G. and S.X.; formal analysis, W.W., D.W. and B.A.G.; investigation, S.X.; resources, W.D.; data curation, D.W. and W.W.; writing—original draft preparation, D.W.; writing—review and editing, W.W. and B.A.G.; visualization, X.T.; supervision, W.D.; project administration, D.W. and W.D.; All authors have read and agreed to the published version of the manuscript.

Funding

This research was funded by the National Natural Science Foundations of China under Grant 11975004 and 12175047; and the Key Research and Development Plan Project of Guangxi, China, under Grant Guike AB18281007.

Data Availability Statement

The data presented in this study are available on reasonable request from the corresponding author.

Acknowledgments

The authors gratefully thank Dingkang Xiong and Yuyang Huang for useful discussions on the subject matter of this paper.

Conflicts of Interest

The authors declare no conflict of interest.

References

  1. Zhang, H.; Fu, X.; Niu, S.; Xin, Q. Blue emission of ZrO2: Tm nanocrystals with different crystal structure under UV excitation. J. Non-Cryst. Solids 2008, 354, 1559–1563. [Google Scholar] [CrossRef]
  2. Romero, V.H.; De la Rosa, E.; López-Luke, T.; Salas, P.; Angeles-Chavez, C. Brilliant blue, green and orange-red emission band on Tm3+-, Tb3+- and Eu3+-doped ZrO2 nanocrystals. J. Phys. D 2010, 43, 465105. [Google Scholar] [CrossRef]
  3. Barabás, R.; Fort, C.I.; Turdean, G.L.; Bizo, L. Influence of HAP on the Morpho-Structural Properties and Corrosion Resistance of ZrO2-Based Composites for Biomedical Applications. Crystals 2021, 11, 202. [Google Scholar] [CrossRef]
  4. Irshad, M.; Siraj, K.; Raza, R.; Rafique, M.; Usman, M.; Ain, Q.u.; Ghaffar, A. Evaluation of densification effects on the properties of 8 mol % yttria stabilized zirconia electrolyte synthesized by cost effective coprecipitation route. Ceram. Int. 2021, 47, 2857–2863. [Google Scholar] [CrossRef]
  5. Borik, M.A.; Bublik, V.T.; Kulebyakin, A.V.; Lomonova, E.E.; Milovich, F.O.; Myzina, V.A.; Osiko, V.V.; Seryakov, S.V.; Tabachkova, N.Y. Change in the phase composition, structure and mechanical properties of directed melt crystallised partially stabilised zirconia crystals depending on the concentration of Y2O3. J. Eur. Ceram. Soc. 2015, 35, 1889–1894. [Google Scholar] [CrossRef]
  6. Feinberg, A.; Perry, C.H. Structural disorder and phase transitions in ZrO2-Y2O3 system. J. Phy. Chem. Solids 1981, 42, 513–518. [Google Scholar] [CrossRef]
  7. Ishigame, M.; Yoshida, E. Study of the defect-induced Raman spectra in cubic zirconia. Solid State Ionics 1987, 23, 211–218. [Google Scholar] [CrossRef]
  8. Zhou, Y.; Wang, H.; Xu, B.; Cao, L. Concentration-dependent up-converted luminescence of Ho3+-Yb3+ co-doped yttrium-stabilized zirconia phosphors. J. Lumin. 2015, 161, 288–292. [Google Scholar] [CrossRef]
  9. Costa, G.C.C.; Zhu, D.; Kulis, M.J.; Acosta, W.A.; Ghoshal, A. Reactivity between rare-earth oxides based thermal barrier coatings and a silicate melt. J. Am. Ceram. Soc. 2018, 101, 3674–3693. [Google Scholar] [CrossRef]
  10. Hwang, K.J.; Shin, M.; Lee, M.H.; Lee, H.; Oh, M.Y.; Shin, T.H. Investigation on the phase stability of yttria-stabilized zirconia electrolytes for high-temperature electrochemical application. Ceram. Int. 2019, 45, 9462–9467. [Google Scholar] [CrossRef]
  11. Chen, Y.; Xiao, J.Z. Synthesis of composite La1.67Sr0.33NiO4-YSZ for a potentiometric NOx sensor by microwave-assisted complex-gel auto-combustion. Ceram. Int. 2013, 39, 9599–9603. [Google Scholar] [CrossRef]
  12. Yang, L.W.; Han, H.L.; Zhang, Y.Y.; Zhong, J.X. White Emission by Frequency Up-Conversion in Yb3+-Ho3+-Tm3+ Triply Doped Hexagonal NaYF4 Nanorods. J. Phys. Chem. C 2009, 113, 18995–18999. [Google Scholar] [CrossRef]
  13. Hong, E.; Liu, L.; Bai, L.; Xia, C.; Gao, L.; Zhang, L.; Wang, B. Control synthesis, subtle surface modification of rare-earth-doped upconversion nanoparticles and their applications in cancer diagnosis and treatment. Mater. Sci. Eng. C. 2019, 105, 110097. [Google Scholar] [CrossRef]
  14. Auzel, F. Upconversion and Anti-Stokes Processes with f and d Ions in Solids. Chem. Rev. 2004, 104, 139–173. [Google Scholar] [CrossRef] [PubMed]
  15. Ovsyankin, V.V.; Feofilov, P.P. Cooperative Processes in Luminescent Systems. In Luminescence of Crystals, Molecules, and Solutions; Williams, F., Baron, B., Martens, M., Varma, S.P., Eds.; Plenum Press: New York, NY, USA, 1973; pp. 64–77. [Google Scholar]
  16. Serrano, D.; Braud, A.; Doualan, J.L.; Camy, P.; Moncorge, R. Pr3+ cluster management in CaF2 by codoping with Lu3+ or Yb3+ for visible lasers and quantum down-converters. J. Opt. Soc. Am. B 2012, 29, 1854–1862. [Google Scholar] [CrossRef]
  17. Mishra, K.; Dwivedi, Y.; Rai, A.; Rai, S.B. Spectral characteristics of intense red luminescence in Pr:Y2O3 nanophosphor on UV excitation. Appl. Phys. B 2012, 109, 663–669. [Google Scholar] [CrossRef]
  18. Wang, D.N.; Xu, S.L.; Wang, X.Y.; Li, S.Y.; Hong, X.; Goodman, B.A.A.; Deng, W. Crystal growth, structure and optical properties of Pr3+-doped yttria-stabilized zirconia single crystals. Chin. Phys. B 2021, 30, 078103. [Google Scholar] [CrossRef]
  19. Sung Lim, C.; Aleksandrovsky, A.; Atuchin, V.; Molokeev, M.; Oreshonkov, A. Microwave-Employed Sol-Gel Synthesis of Scheelite-Type Microcrystalline AgGd(MoO4)2:Yb3+/Ho3+ Upconversion Yellow Phosphors and Their Spectroscopic Properties. Crystals 2020, 10, 1000. [Google Scholar] [CrossRef]
  20. Seshadri, M.; Bell, M.J.V.; Anjos, V.; Messaddeq, Y. Spectroscopic investigations on Yb3+ doped and Pr3+/Yb3+ codoped tellurite glasses for photonic applications. J. Rare Earth. 2021, 39, 33–42. [Google Scholar] [CrossRef]
  21. Zhu, Q.; Miao, J.; Wen, Y.; Rao, W. Hydrothermal preparation and white up-conversion luminescence of NaGd(WO4)2:Yb3+/Pr3+ microcrystals. J. Mater. Sci. Mater. Electron. 2016, 28, 3048–3051. [Google Scholar] [CrossRef]
  22. Zheng, C.B.; Xia, Y.Q.; Qin, F.; Yu, Y.; Miao, J.P.; Zhang, Z.G.; Cao, W.W. Femtosecond pulsed laser induced synthesis of ultrafine Y2O3: Pr, Yb nanoparticles with improved upconversion efficiency. Chem. Phys. Lett. 2010, 496, 316–320. [Google Scholar] [CrossRef]
  23. Hölsä, J.; Laamanen, T.; Laihinen, T.; Lastusaari, M.; Pihlgren, L.; Rodrigues, L.C.V. White up-conversion luminescence of NaYF4:Yb3+,Pr3+,Er3+. Opt. Mater. 2014, 36, 1627–1630. [Google Scholar] [CrossRef]
  24. Negita, K.; Takao, H. Condensations of phonons at the tetragonal to monoclinic phase-transition in ZrO2. J. Phys. Chem. Solids 1989, 50, 325–331. [Google Scholar] [CrossRef]
  25. Soares, M.R.N.; Nico, C.; Rodrigues, J.; Peres, M.; Soares, M.J.; Fernandes, A.J.S.; Costa, F.M.; Monteiro, T. Red and infrared luminescence from tetragonal YSZ:Pr3+ single crystal fibres grown by LFZ. Opt. Mater. 2011, 34, 27–29. [Google Scholar] [CrossRef]
  26. Zhang, C.; Liu, T.; Wang, H.J.; Wang, F.; Pan, X.Y. Synthesis of acetyl salicylic acid over WO3/ZrO2 solid superacid catalyst. Chem. Eng. J. 2011, 174, 236–241. [Google Scholar] [CrossRef]
  27. Popov, V.V.; Menushenkov, A.P.; Yastrebtsev, A.A.; Tsarenko, N.A.; Arzhatkina, L.A.; Shchetinin, I.V.; Zheleznyi, M.V.; Ponkratov, K.V. Regularities of formation of complex oxides with the fluorite structure in the ZrO2-Y2O3 system. Russ. J. Inorg. Chem. 2017, 62, 1147–1154. [Google Scholar] [CrossRef]
  28. Li, P.; Chen, I.W.; Penner-Hahn, J.E. Effect of Dopants on Zirconia Stabilization-An X-ray Absorption Study: I, Trivalent Dopants. J. Am. Ceram. Soc. 1994, 77, 118–128. [Google Scholar] [CrossRef] [Green Version]
  29. Borrero-González, L.J.; Galleani, G.; Manzani, D.; Nunes, L.A.O.; Ribeiro, S.J.L. Visible to infrared energy conversion in Pr3+-Yb3+ co-doped fluoroindate glasses. Opt. Mater. 2013, 35, 2085–2089. [Google Scholar] [CrossRef]
  30. Fawad, U.; Kim, H.J.; Gul, I.; Khan, M.; Tahir, S.; Jamal, T.; Muhammad, W. Proton, UV, and X-ray Induced Luminescence in Tb3+ Doped LuGd2Ga2Al3O12 Phosphors. Crystals 2020, 10, 844. [Google Scholar] [CrossRef]
  31. Maurya, A.; Dwivedi, A.; Bahadur, A.; Rai, S.B. Enhanced upconversion and downshifting emissions from Tm3+, Yb3+ co-doped CaZrO3 phosphor in the presence of alkali ions (Li+, Na+ and K+). J. Alloy. Compd. 2019, 786, 457–467. [Google Scholar] [CrossRef]
  32. Yadav, R.S.; Rai, S.B. Frequency upconversion and downshifting emissions in solution combustion derived Yb3+, Pr3+ co-doped strontium aluminate nano-phosphor: A multi-modal phosphor. J. Lumin. 2017, 190, 171–178. [Google Scholar] [CrossRef]
  33. Ding, D.; Gao, J.; Zhang, S.; Duo, L. The photoluminescence properties of Pr3+-Yb3+ co-doped gallo-germanate glasses and glass ceramics as energy converter. J. Lumin. 2020, 226, 117512. [Google Scholar] [CrossRef]
Figure 1. (a) Diagram illustrating the crystal nucleation process on ceramic rods in the optical floating zone method. (b) Photographs of examples of the Yb/Pr: YSZ single crystal rods.
Crystals 11 01328 g001
Figure 2. Raman spectra from discs of Yb/Pr: YSZ single crystal samples prepared with different concentrations of Yb2O3.
Crystals 11 01328 g002
Figure 3. XRD patterns for powders from the Yb/Pr: YSZ crystal samples with different Yb2O3 concentrations.
Crystals 11 01328 g003
Figure 4. (a) Transmission spectra in the range 400780 nm, and (b) absorption spectra in the range 8001600 nm for single crystal discs of Yb/Pr: YSZ prepared with different concentrations of Yb2O3.
Crystals 11 01328 g004
Figure 5. (a) Photoluminescence spectra of Yb/Pr: YSZ crystal discs prepared with different concentrations of Yb2O3. (b) Variation in luminescence intensity for different bands in Yb/Pr: YSZ crystal discs with Yb2O3 concentration.
Crystals 11 01328 g005
Figure 6. Upconversion power curves for the 525, 542, and 656 nm transitions in the 2.0 mol% Yb/Pr: YSZ crystal.
Crystals 11 01328 g006
Figure 7. Fluorescence decay curve for the 3P03H5 transition for Pr3+ in the YSZ single crystal prepared with 2.0 mol% Yb2O3 and 0.15 mol% Pr6O11.
Crystals 11 01328 g007
Figure 8. Color coordinate diagram of Yb/Pr: YSZ single crystals.
Crystals 11 01328 g008
Figure 9. Schematic diagram of Yb–Pr energy conversion in YSZ single crystal under 980 nm; ET = energy transfer upconversion; CR = cross relaxation; GSA = ground state absorption; ESA = excited state absorption; CET = cooperative energy transfer.
Crystals 11 01328 g009
Table 1. Chemical composition of the Yb/Pr: YSZ single crystals.
Sample NumberComposition (mol%)
8YSZPr6O11Yb2O3
198.85%0.151.00
298.35%0.151.50
397.85%0.152.00
497.35%0.152.50
596.85%0.153.00
696.35%0.153.50
Table 2. Lattice parameters for the Yb/Pr: YSZ crystals.
Yb2O3 (mol%)Lattice Parameters
a = b = c (Å)Volume (Å3)
1.005.140135.76
1.505.140135.81
2.005.141135.85
2.505.144136.11
3.005.140135.76
3.505.135135.39
Table 3. Color coordinates calculated for the various Yb/Pr: YSZ crystal samples.
Yb2O3 (mol%)CIE xCIE y
1.00.29010.6118
1.50.28930.6171
2.00.28840.6253
2.50.28780.6222
3.00.29070.6173
3.50.28960.6178
Publisher’s Note: MDPI stays neutral with regard to jurisdictional claims in published maps and institutional affiliations.

