
Corrosion Behavior of Cr19Fe22Co21Ni25Mo13 Alloy in 1M Nitric Acid and 1M Hydrochloric Acid Solutions

Institute of Nanomaterials, Chinese Culture University, Taipei 111, Taiwan
*
Author to whom correspondence should be addressed.
Crystals 2021, 11(11), 1289; https://doi.org/10.3390/cryst11111289
Submission received: 1 October 2021
/
Revised: 18 October 2021
/
Accepted: 23 October 2021
/
Published: 25 October 2021
(This article belongs to the Special Issue High-Entropy Materials)
Abstract
:The present work studied the microstructures of Cr19Fe22Co21Ni25Mo13 alloy, and tested the polarization properties in deaerated 1M nitric acid and 1M hydrochloric solutions at different temperatures. The alloy was processed by an argon atmosphere arc-melting. Results indicated that the microstructure of Cr19Fe22Co21Ni25Mo13 alloy was a dendritic one. The dendrites of Cr19Fe22Co21Ni25Mo13 alloy were an FCC structure, and the interdendrites of Cr19Fe22Co21Ni25Mo13 alloy were a eutectic structure with two phases of FCC and simple cubic (SC). The Cr19Fe22Co21Ni25Mo13 alloy had better corrosion resistance compared with commercial 304 stainless steel in both deaerated 1M HNO3 and 1M HCl solutions. The corrosion types of Cr19Fe22Co21Ni25Mo13 alloy in both of 1M HNO3 and 1M HCl solutions were uniform corrosion.
1. Introduction
Iron, chromium, nickel, and cobalt are the main elements of stainless steels; many corrosion-resistant alloys are developed based on these elements. The CoCrFeNiSn had a good passivation in chloride solution because the surface had stable oxide films [1]. The study of corrosion behaviors of AlxCrFeCoNi high-entropy alloys showed that the corrosion resistance increased by decreasing aluminum content and increasing chromium content in 3.5% NaCl solution [2]. The corrosion study of (CoCrFeNi)100−xMox alloys indicated that the addition of molybdenum could increase the corrosion resistance in 3.5% NaCl solution, and these alloys would form the passivation films to improve corrosion resistance in 0.5M H2SO4 solution [3]. Al0.5CoCrCuFeNi high-entropy alloy was coated on the surface of AZ91D magnesium alloy by laser cladding to improve the corrosion resistance, and results showed the corrosion potential increased, and the corrosion current density decreased [4]. The non-equiatomic CrFeCoNiMo high-entropy alloy was irradiated by electron beam to modify the surface, and the electrochemical results indicated that the alloy had a positive potential and lower current density in 3.5 wt.% NaCl solution [5]. Only 0.1 mol addition of Zr into AlCoCrFeNiZrx alloys could greatly improve the corrosion resistance of the alloys in 0.5 M H2SO4 solution [6]. The Al0.1CoCrFeNi high-entropy alloy had higher polarization resistance and lower corrosion rate compared with nickel-based Alloy 718 in a molten Na2SO4-NaCl eutectic mixture at 750 ± 5 °C [7]. The CoCrFeNi (WC) coatings WC was 10–30 wt.%, and all enhanced corrosion resistance in 3.5% NaCl solution. Particularly, the added 10 wt.% WC clearly enhanced the comprehensive corrosion resistance and easy passivation of the alloy [8]. Our previous studies showed that the CrFeCoNi(Nb,Mo) alloys [9] and CrFeCoNiNbx alloys [10] all had better corrosion resistance than commercial 304 stainless steel. These alloys indicated that the CrFeCoNi-based alloys had a potential to develop alloys with good corrosion resistance. The alloys described above are all high-entropy alloys. The researchers can develop new alloys based on the high-entropy alloy concept and smartly choose the suitable elements to develop the alloys for the applications [11,12].
The CrFeCoNiMo high-entropy alloy [9] had a dual-phased dendritic structure; one was FCC phase with a lattice constant of 3.577 Å, and the other was a simple cubic (SC) phase with a lattice constant of 8.398 Å. Addition of molybdenum into CrFeCoNi alloy would reduce the corrosion resistance of the alloy but significantly increase the hardness of CrFeCoNi alloy. The present work selected the compositions of the FCC phase in CrFeCoNiMo alloy to be a new alloy, Cr19Fe22Co21Ni25Mo13, and studied the microstructure and polarization behaviors of this alloy in deaerated 1M nitric acid and 1M hydrochloric acid solutions.
2. Materials and Methods
The nominal chemical compositions of experimental alloy, Cr19Fe22Co21Ni25Mo13, was 16.0% of Cr, 19.9% of Fe, 20.1% of Co, 23.8% of Ni, and 20.2% of Mo in weight percent. The alloy was made by an arc furnace in an argon atmosphere after accurately weighing. The total weight of the melt was about 100 g. Following this, the work of microstructure observing and polarization tests was done on the as-cast Cr19Fe22Co21Ni25Mo13 alloy. The microstructure of Cr19Fe22Co21Ni25Mo13 alloy was observed by a scanning electron microscope (SEM, JEOL JSM-6335, JEOL Ltd., Tokyo, Japan) operated at 10 kV after regular metallurgical processes; the chemical compositions of the phases were measured by energy dispersive spectrometer (EDS). The phases in the alloy were identified by an x-ray diffractometer (XRD, Rigaku ME510-FM2, Rigaku, Tokyo, Japan) with a scanning rate of 0.04 degree per second. The Vicker’s hardness of the alloy was tested by Matsuzawa Seiki MV1. The loading force for testing the overall hardness of the alloy was 19.61 N (2000 gf), and the loading force for testing dendrites and interdendrities was 0.245 N (25 gf). The potentiodynamic polarization curves of Cr19Fe22Co21Ni25Mo13 alloy were tested by an electrochemical device (Autolab PGSTAT302N, Metrohm Autolab B.V., Utrecht, The Netherlands), with three electrodes at different temperatures of 30, 40, 50, and 60 °C, respectively. One electrode was the specimens, which was mounted in epoxy resin with an exposed area of 0.196 cm2 (0.5 cm in diameter). The second electrode was a platinum wire used as a counter. The other electrode was a saturated silver chloride electrode (Ag/AgCl, SSE) used as a reference one, and this reference electrode had a potential was 0.197 V higher than the standard hydrogen electrode (SHE) at 25 °C [13]. The polarization test was started after setup for 900 s, and the scanning rate was 1 mV per second. Nitrogen bubble was used to degas the oxygen in the solutions through the process. Two test solutions were 1M nitric acid and 1M hydrochloric acid solutions, which were prepared from reagent-grade acids and deionized water.
3. Results and Discussion
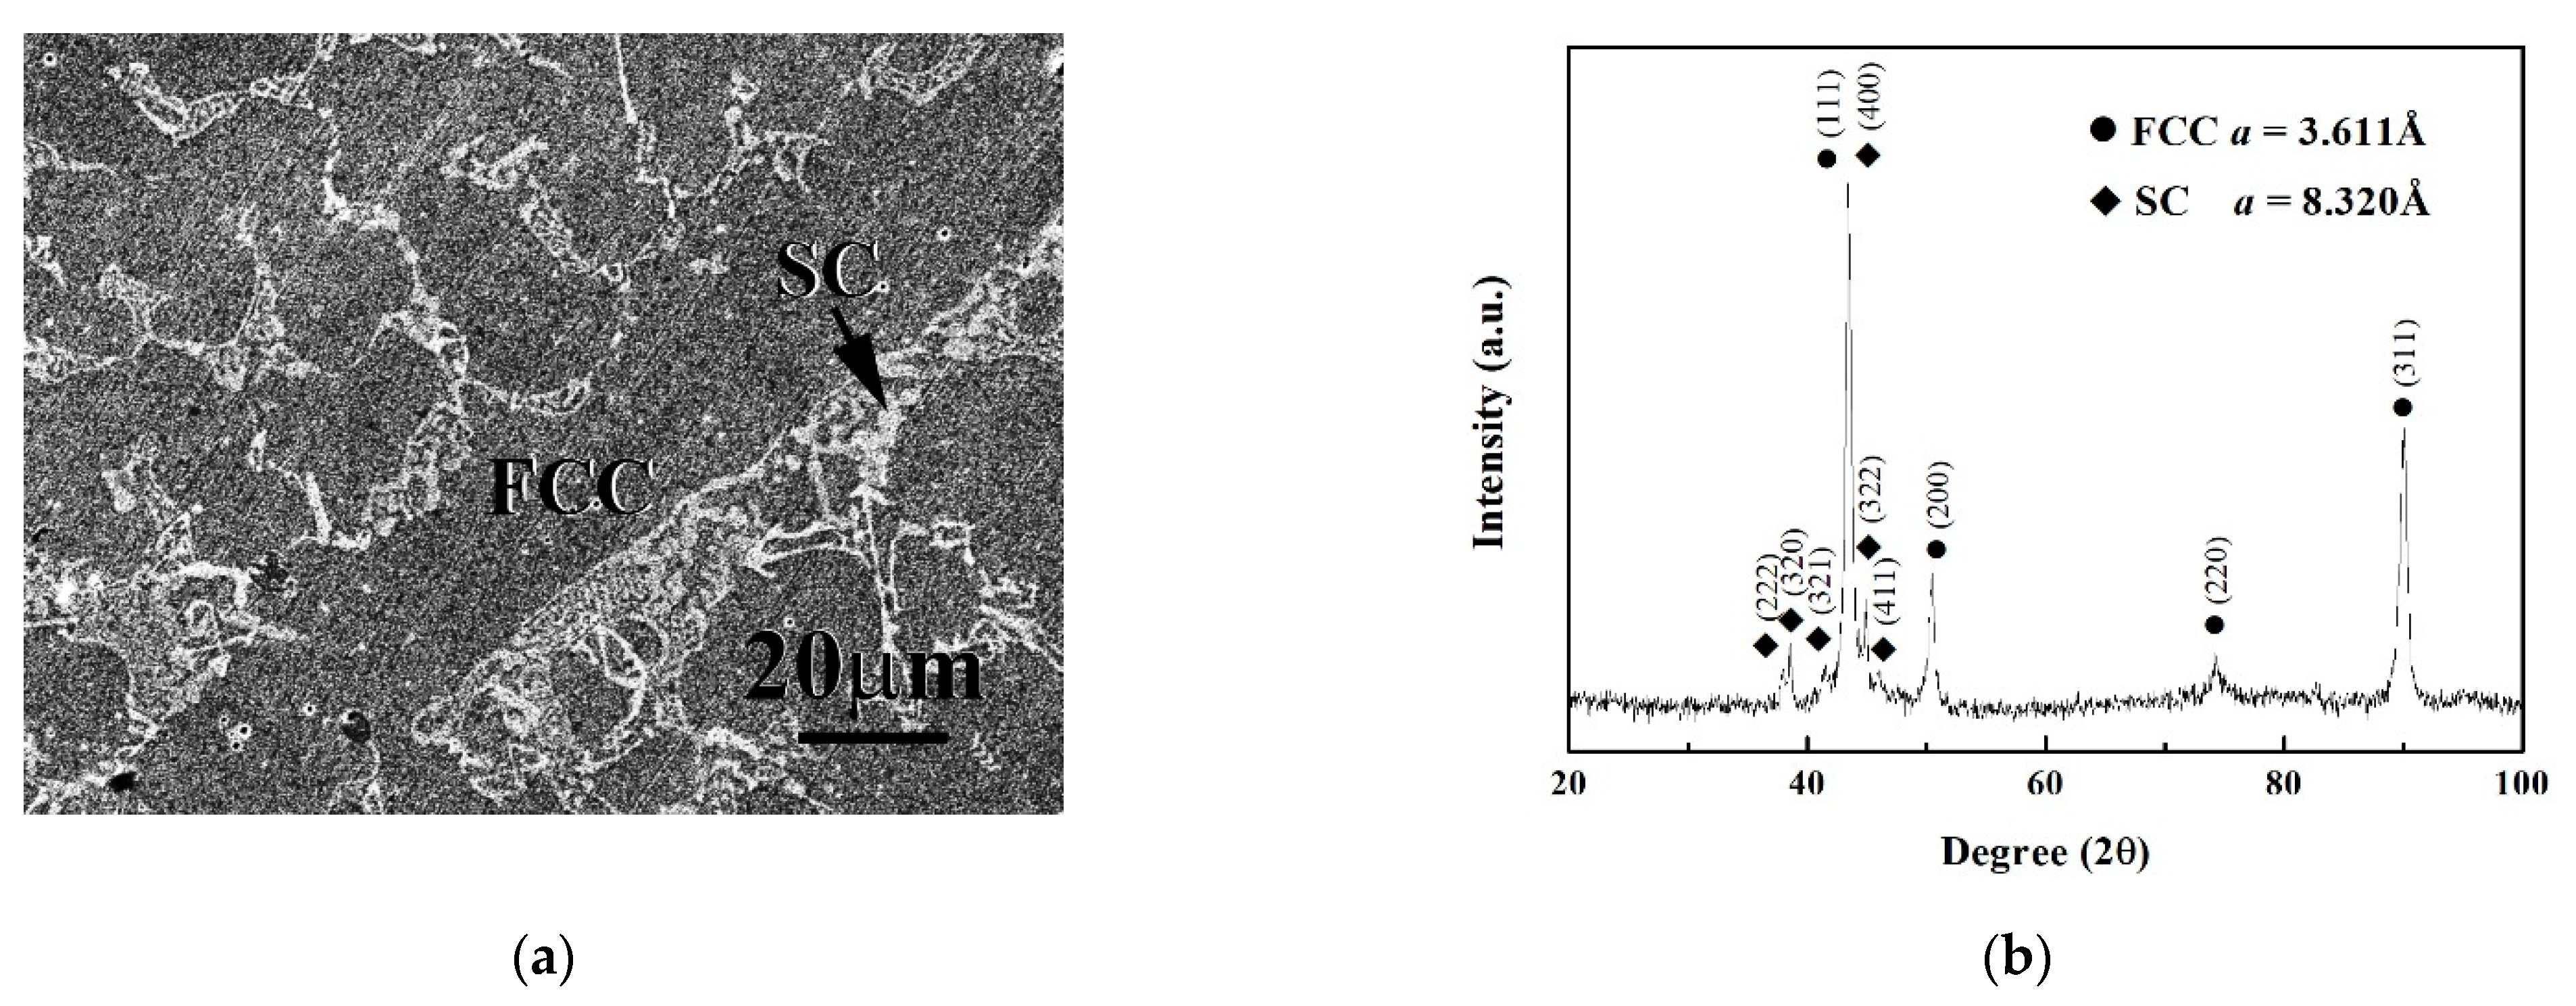
The SEM micrograph and XRD pattern of as-cast Cr19Fe22Co21Ni25Mo13 alloy are shown in Figure 1a,b, respectively. Figure 1a is the micrograph that shows a typical dendritic microstructure. The dendrites had a face-centered cubic (FCC) phase, and the interdendritic regions were a eutectic structure with FCC and simple cubic (SC) phases. The micrograph displays that the volume fraction of FCC phase is more than that of SC phase. The chemical compositions of the overall, FCC, and SC phases are listed in Table 1. The overall compositions of Cr19Fe22Co21Ni25Mo13 alloy indicates that actual compositions of this alloy almost match the origin design. Additionally, the Fe, Co, and Ni content of FCC phase are more than those of SC phase; but the Cr and Mo content of FCC phase are less than those of SC phase. The SC phase is brighter than the FCC phase in the SEM micrograph because SC phase has more Mo content, which atomic number is higher than the other four elements. This is the backscattering effect of the electrons in SEM observing. Figure 1b is the XRD pattern of as-cast Cr19Fe22Co21Ni25Mo13 alloy, and it shows only two phases, FCC and SC, in this alloy. The lattice constants of FCC and SC phases are 3.611 and 8.320 Å, respectively. The structure of SC phase has been identified in our previous work [9]; the large lattice constant of SC phase indicates that the unit cell of SC phase has many atoms and a complex structure. The XRD pattern also proves that the FCC phase is more than SC phase by comparing the intensities of the peaks of FCC and SC phases. The hardness of dendrites was 281 ± 11 HV because of the FCC structure. The hardness of interdendrites was 414 ± 12 HV because of the eutectic structure of FCC and HCP phases. The overall hardness of the Cr19Fe22Co21Ni25Mo13 alloy was 290 ± 5 HV. The overall hardness of Cr19Fe22Co21Ni25Mo13 alloy was only slightly higher than that of FCC-dendrites because the FCC phase was the major phase in this alloy. Therefore, the overall hardness of the alloy was dominated by the FCC-dendrites.
The potentiodynamic polarization curves of Cr19Fe22Co21Ni25Mo13 alloy in deaerated 1M HNO3 and 1M HCl solutions under different temperatures are shown in Figure 2a,b, respectively. The corrosion potential (Ecorr) is the mixed potential, which means the rate of anodic dissolution of the electrode equals to the rate of cathodic reaction. The curve with potential negative than Ecorr indicates that the alloy is cathode (be protected), and the curve with potential positive than Ecorr indicates that the alloy is anode (be corroded). The slope of cathodic line of the alloy was Tafel slope (βc), which equals to ΔE/Δlogi, where E is potential, and i is current density. The corrosion current density (icorr) of each curve was calculated by the intersection of the free corrosion potential and the cathodic Tafel line. Both of the corrosion potential (Ecorr) and corrosion current density (icorr) of Cr19Fe22Co21Ni25Mo13 alloy in these two solutions increased with increasing test temperature. The important data of the curves are listed in Table 2. The potentiodynamic polarization curves of Cr19Fe22Co21Ni25Mo13 alloy in HNO3 solution did not have passivation potential, which meant that this alloy could easily enter the passivation region. The minimum current densities of Cr19Fe22Co21Ni25Mo13 alloy in passivation regions (ipass) were about 24 μA/cm2, but ipass increased with increasing testing temperatures after higher applied potential (>0.4 V vs. SSE) in HNO3 solution, shown in Figure 2a. The passivation regions of the alloy under these four testing temperatures all entered breakdown because of the oxygen evolution reaction [14]. The breakdown potential (Eb) were about 0.95 V vs. SSE. The Cr19Fe22Co21Ni25Mo13 alloy had similar tendency, which was tested in deaerated 1M HCl solution, as shown in Figure 2b. However, the corrosion potentials of Cr19Fe22Co21Ni25Mo13 alloy were more negative, and corrosion current densities of Cr19Fe22Co21Ni25Mo13 alloy were larger in deaerated 1M HCl solution compared with the data tested in deaerated 1M HNO3 solution. In addition, smaller anodic peaks were observed in the potentiodynamic polarization curves of Cr19Fe22Co21Ni25Mo13 alloy in deaerated 1M HCl solution. The passivation potentials (Epp) and anodic critical current densities (icrit) of these curves are listed in Table 2. The current densities of Cr19Fe22Co21Ni25Mo13 alloy in passivation regions also increased with increasing testing temperatures in HCl solution after larger applied potential (>0.2 V vs. SSE), shown in Figure 2b. The passivation regions of the alloy under these four testing temperatures were all in breakdown because of the oxygen evolution reaction. The breakdown potentials (Eb) slightly decreased with increasing testing temperature.
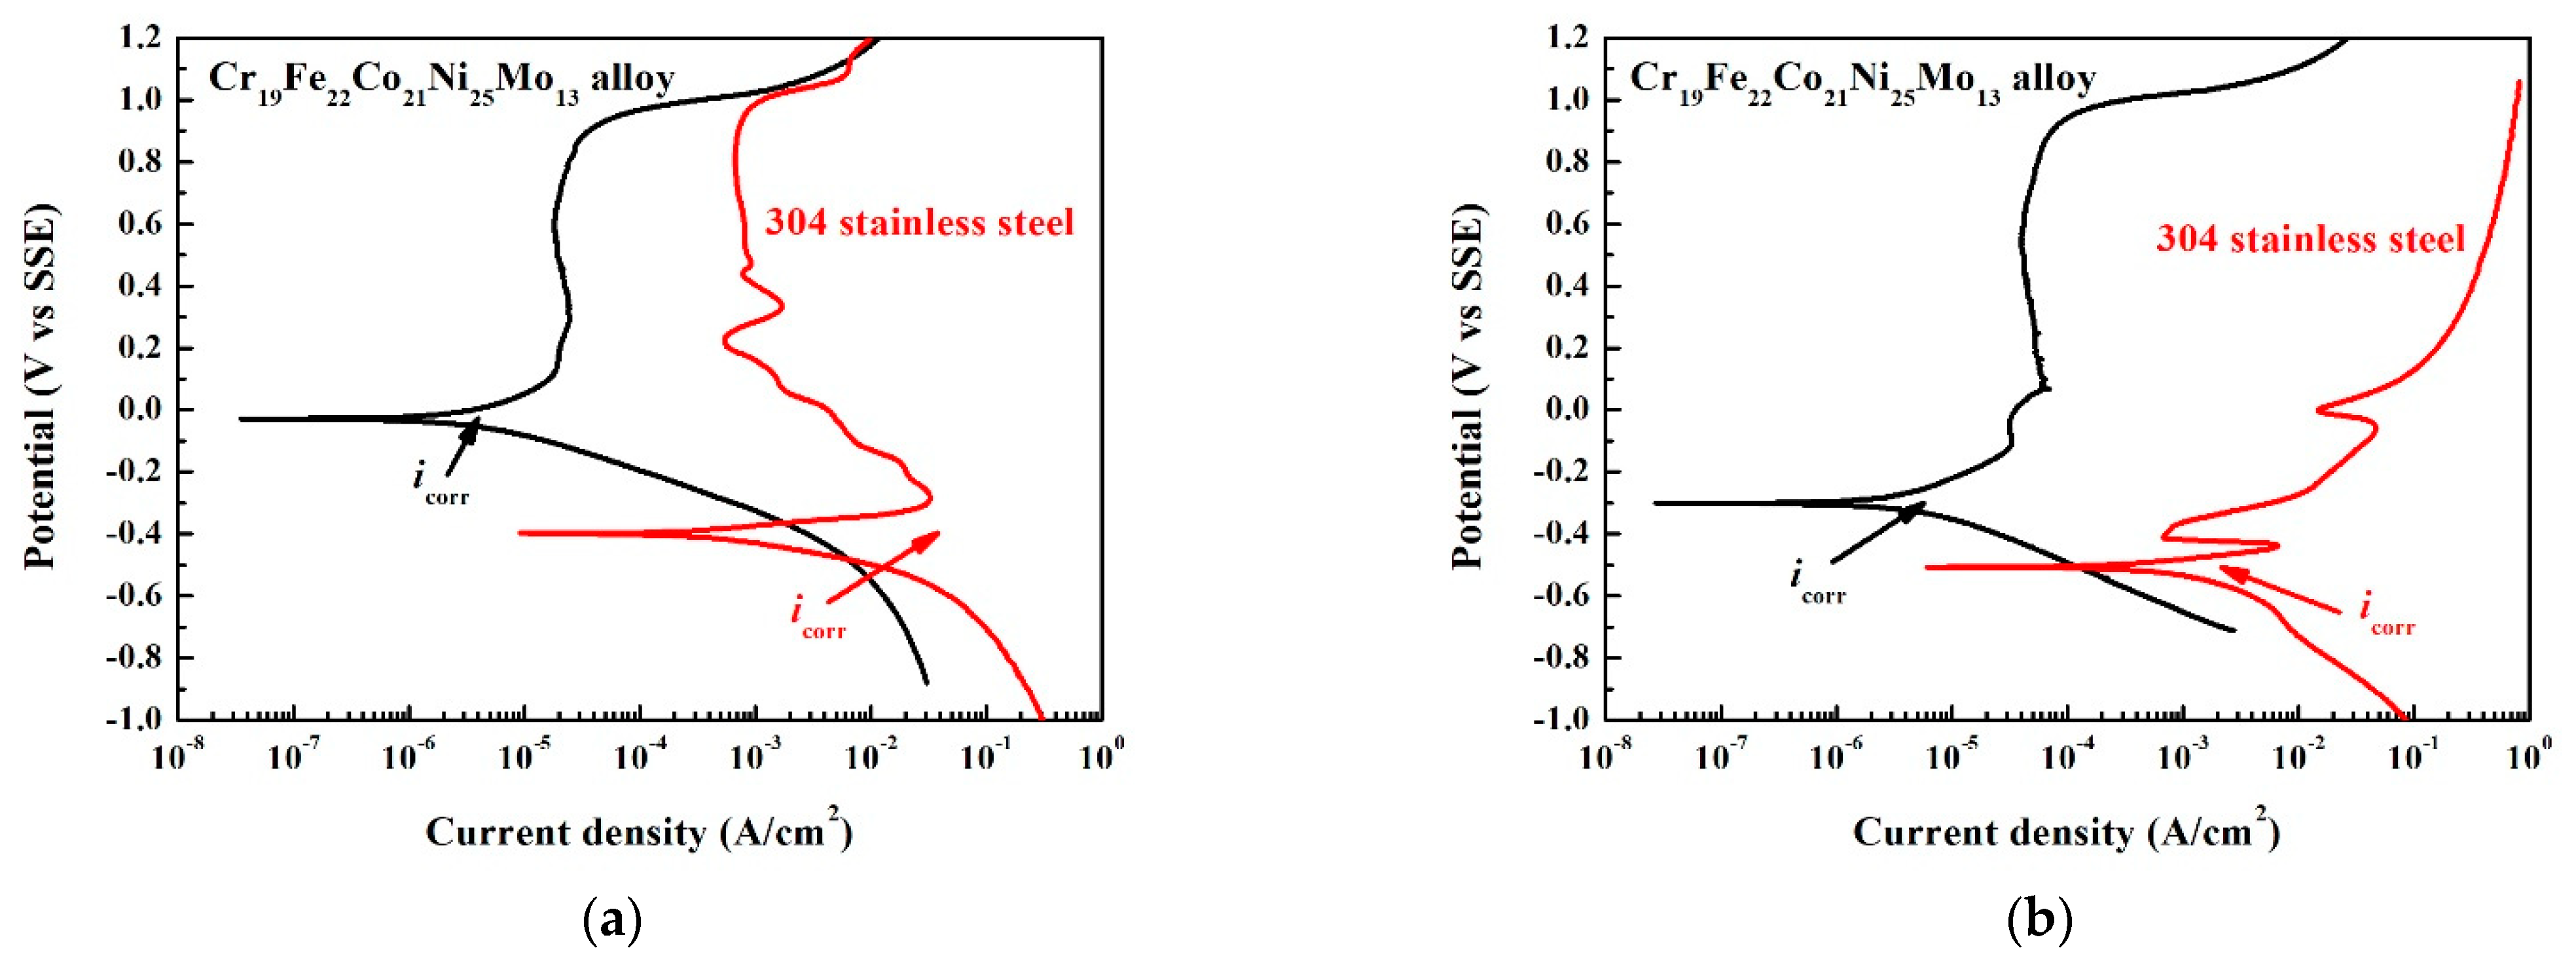
Figure 3a,b show the comparison of Cr19Fe22Co21Ni25Mo13 alloy and commercial 304 stainless steel tested in deaerated 1M HNO3 and HCl solutions at 30 °C, respectively. Both of the figures show that the corrosion potentials (Ecorr) of Cr19Fe22Co21Ni25Mo13 alloy were more positive than that of 304 stainless steel, and the corrosion current densities (icorr) of Cr19Fe22Co21Ni25Mo13 alloy were less than that of 304 stainless steel. The 304 stainless steel had larger anodic peaks compared with Cr19Fe22Co21Ni25Mo13 alloy in these two solutions. The current density of passivation region of Cr19Fe22Co21Ni25Mo13 alloy were also less than that of 304 stainless steel. These indicated that the corrosion resistance of Cr19Fe22Co21Ni25Mo13 alloy was better than that of 304 stainless steel in these two solutions, especially in the deaerated 1M HCl solution. The corrosion potentials (Ecorr) and corrosion current densities (icorr) of Cr19Fe22Co21Ni25Mo13 alloy and 304 stainless steel are listed in Table 3. Molybdenum could improve the localized corrosion resistance [15,16], especially the attack from the chloride ions. The Cr19Fe22Co21Ni25Mo13 alloy thus had a good corrosion resistance in 1M HCl solution.
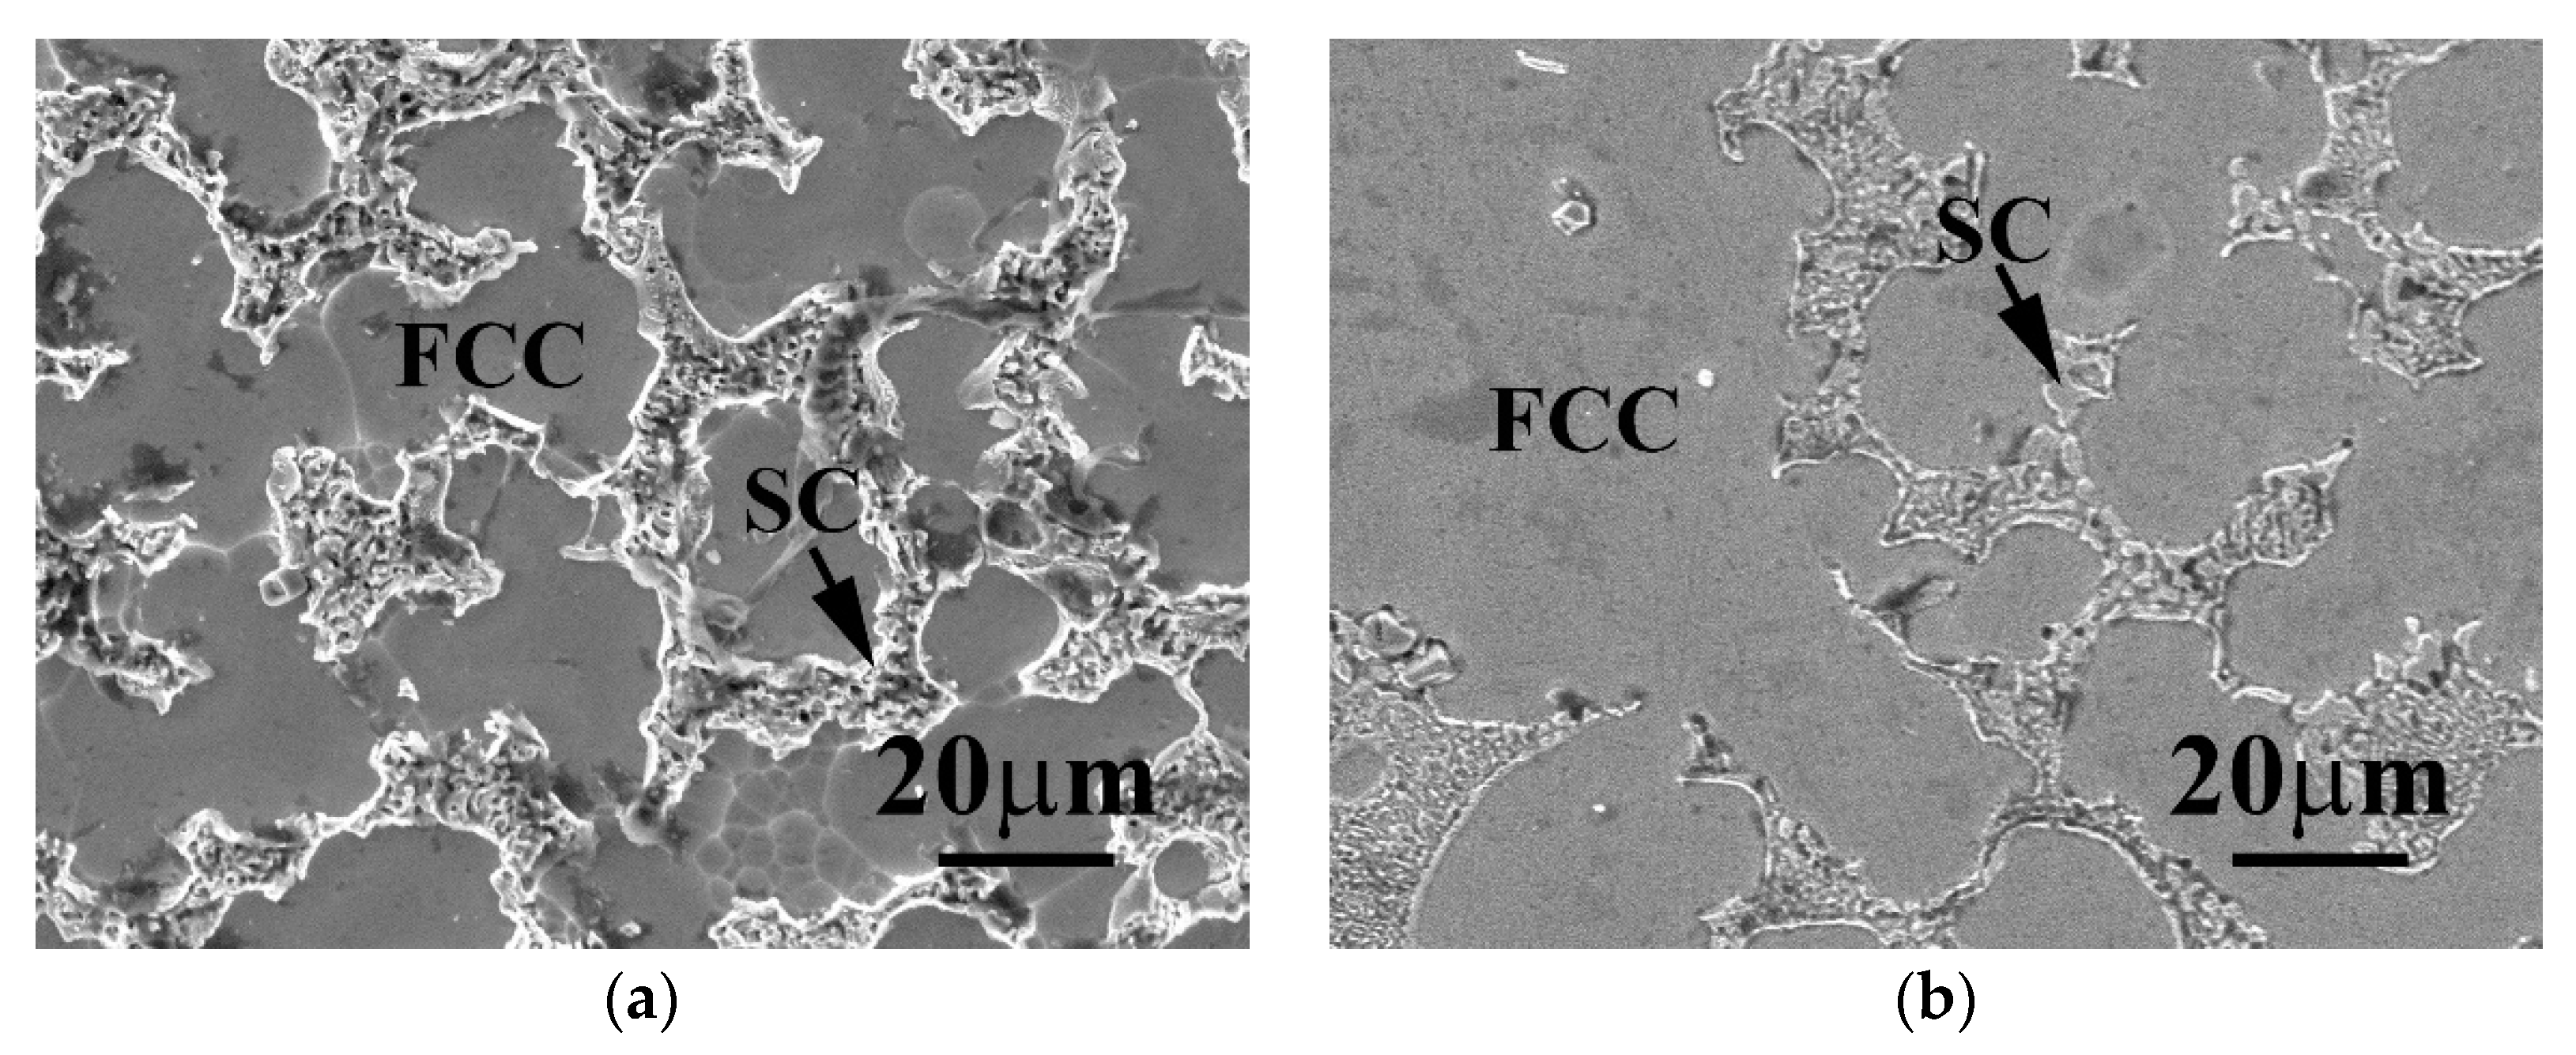
Figure 4a,b show the morphologies of Cr19Fe22Co21Ni25Mo13 alloy after polarization test in the deaerated 1M HNO3 and HCl solutions, respectively. The corrosion time of each specimen was 1500 s because anodic range was from open circuit potential (OCP) to OCP+1.5V, and the scanning rate was 1 mV/s. These two figures indicates that the corrosion type of Cr19Fe22Co21Ni25Mo13 alloy in these two solution were a uniform corrosion. The FCC phase of Cr19Fe22Co21Ni25Mo13 alloy was concave in these two figures, which meant that the FCC phase was more severely corroded than the SC phase in Cr19Fe22Co21Ni25Mo13 alloy. The standard electrode potentials (E° vs. SSE) of Cr, Fe, Co, Ni, and Mo are −0.962, −0.662, −0.449, −0.472, and −0.422 V, respectively [17]. Molybdenum has the highest standard electrode potential among these elements. The SC phase had higher Mo content, listed in Table 1 and thus had more positive corrosion potential by comparing with the corrosion potential of FCC phase in Cr19Fe22Co21Ni25Mo13 alloy. Therefore, the FCC phase was severely corroded and formed a concave morphology.
4. Conclusions
The as-cast Cr19Fe22Co21Ni25Mo13 alloy had a dendritic structure. The dendrites were an FCC phase, and the interdendritic regions were a eutectic structure of FCC and SC phases. The SC phase had higher Cr and Mo content but lower Fe, Co and Ni content compared with the FCC phase. Both of the corrosion potential and corrosion current density of Cr19Fe22Co21Ni25Mo13 alloy increased with increasing testing temperature in deaerated 1M HNO3 and 1M HCl solutions. The passivation regions of Cr19Fe22Co21Ni25Mo13 alloy tested in these two solutions entered breakdown at applied potential of about 0.95 V vs SSE because of the oxygen evolution reaction. The potentiodynamic polarization curves of Cr19Fe22Co21Ni25Mo13 alloy in both of 1M HNO3 and 1M HCl solutions showed better corrosion resistance by comparing with commercial 304 stainless steel. The morphologies of Cr19Fe22Co21Ni25Mo13 alloy after polarization tested in 1M HNO3 and 1M HCl solutions showed a uniform corrosion type. The SC phase was slightly more corroded than the FCC phase because of the higher Mo content.
Author Contributions
Conceptualization, C.-H.T.; methodology, C.-H.T. and P.-M.C.; formal analysis, C.-H.T. and P.-M.C.; investigation, C.-H.T. and P.-M.C.; data curation, C.-H.T. and P.-M.C.; writing—original draft preparation, C.-H.T.; writing—review and editing, C.-H.T.; supervision, C.-H.T.; All authors have read and agreed to the published version of the manuscript.
Funding
This research received no external funding.
Institutional Review Board Statement
Not applicable.
Informed Consent Statement
Not applicable.
Data Availability Statement
Not applicable.
Acknowledgments
The authors are grateful to the Ministry of Science and Technology of Republic of China for its financial support under the project MOST 106-2221-E-034-008 and MOST 110-2221-E-034-007.
Conflicts of Interest
The funders had no role in the design of the study; in the collection, analyses, or interpretation of data; in the writing of the manuscript, or in the decision to publish the results.
References
- Muangtong, P.; Rodchanarowan, A.; Chaysuwan, D.; Chanlek, N.; Goodall, R. The corrosion behaviour of CoCrFeNi-x (x = Cu, Al, Sn) high entropy alloy systems in chloride solution. Corros. Sci. 2020, 172, 108740. [Google Scholar] [CrossRef]
- Geantă, V.; Voiculescu, I.; Cotrut, M.C.; Vrânceanu, M.D.; Vasile, I.M.; Rosca, J.C.M. Effect of Al on Corrosion Behavior in 3.5% NaCl Solution of AlxCoCrFeNi High Entropy Alloys. Int. J. Eng. Res. Afr. 2021, 53, 20–30. [Google Scholar] [CrossRef]
- Wang, W.; Wang, J.; Yi, H.; Qi, W.; Peng, Q. Effect of Molybdenum Additives on Corrosion Behavior of (CoCrFeNi)100−xMox High-Entropy Alloys. Entropy 2018, 20, 908. [Google Scholar] [CrossRef] [PubMed] [Green Version]
- Huang, K.; Chen, L.; Lin, X.; Huang, H.; Tang, S.; Du, F. Wear and Corrosion Resistance of Al0.5CoCrCuFeNi High-Entropy Alloy Coating Deposited on AZ91D Magnesium Alloy by Laser Cladding. Entropy 2018, 20, 915. [Google Scholar] [CrossRef] [PubMed] [Green Version]
- Lyu, P.; Chen, Y.; Liu, Z.; Cai, J.; Zhang, C.; Jin, Y.; Guan, Q.; Zhao, N. Surface modification of CrFeCoNiMo high entropy alloy induced by high-current pulsed electron beam. Appl. Surf. Sci. 2020, 504, 144453. [Google Scholar] [CrossRef]
- Yao, Y.; Jin, Y.; Gao, W.; Liang, X.; Chen, J.; Zhu, S. Corrosion Behavior of AlFeCrCoNiZrx High-Entropy Alloys in 0.5 M Sulfuric Acid Solution. Metals 2021, 11, 1471. [Google Scholar] [CrossRef]
- Jalbuena, A.A.; Ury, N.; Bae, J.; Faraj, C.; Hanan, K.; Kasnakjian, S.; Logier, J.K.; Mishra, R.S.; Wang, X.; Earthman, J.C. Corrosion of Al0.1CoCrFeNi High Entropy Alloy in a Molten Eutectic Salt. J. Electrochem. Soc. 2019, 166, C3488. [Google Scholar] [CrossRef]
- Xu, J.; Wang, S.; Shang, C.; Huang, S.; Wang, Y. Microstructure and Properties of CoCrFeNi(WC) High-Entropy Alloy Coatings Prepared Using Mechanical Alloying and Hot Pressing Sintering. Coating 2019, 9, 16. [Google Scholar] [CrossRef] [Green Version]
- Tsau, C.H.; Tsai, M.C. The effects of Mo and Nb on the microstructures and properties of CrFeCoNi(Nb,Mo) alloys. Entropy 2018, 20, 648. [Google Scholar] [CrossRef] [PubMed] [Green Version]
- Tsau, C.H.; Yeh, C.Y.; Tsai, M.C. The Effect of Nb-Content on the Microstructures and Corrosion Properties of CrFeCoNiNbx High-Entropy Alloys. Materials 2019, 12, 3716. [Google Scholar] [CrossRef] [PubMed] [Green Version]
- Murty, B.S.; Yeh, J.W.; Ranganathan, S.; Bhattacharjee, P.P. High-Entropy Alloys, 2nd ed.; Elsevier Co.: Amsterdam, The Netherlands, 2019; pp. 13–30. [Google Scholar]
- Yeh, J.W. Alloy Design Strategies and Future Trends in High-Entropy Alloys. JOM 2013, 65, 1759–1771. [Google Scholar] [CrossRef]
- Bard, A.J.; Faulkner, L.R. Electrochemical Methods: Fundamentals and Applications, 2nd ed.; John Wiley & Sons: New York, NY, USA, 2000; the table on inside back cover. [Google Scholar]
- Callister, W.D., Jr. Fundamentals of Materials Science and Engineering: An Integrated Approach, 2nd ed.; John Wiley & Sons, Inc.: New York, NY, USA, 2005; p. 674. [Google Scholar]
- Hashimoto, K.; Asami, K.; Teramoto, K. An X-ray photo-electron spectroscopic study on the role of molybdenum in increasing the corrosion resistance of ferritic stainless steels in HCl. Corros. Sci. 1979, 19, 3–14. [Google Scholar] [CrossRef]
- Godlewska, E.; Mitoraj-Królikowska, M.; Czerski, J.; Jawańska, M.; Gein, S.; Hecht, U. Corrosion of Al(Co)CrFeNi High-Entropy Alloys. Front. Mater. 2020, 7, 335. [Google Scholar] [CrossRef]
- Chawla, S.L. Materials Selection for Corrosion Control; ASM International: Materials Park, OH, USA, 1993; p. 18. [Google Scholar]
Figure 1.
(a) A micrograph and (b) XRD pattern of as-cast Cr19Fe22Co21Ni25Mo13 alloy.

Figure 2.
Potentiodynamic polarization curves of Cr19Fe22Co21Ni25Mo13 alloy tested in the deaerated solutions of: (a) 1M HNO3 solution and (b) 1M HCl solution under different temperatures.
Figure 2.
Potentiodynamic polarization curves of Cr19Fe22Co21Ni25Mo13 alloy tested in the deaerated solutions of: (a) 1M HNO3 solution and (b) 1M HCl solution under different temperatures.

Figure 3.
Polarization curves of Cr19Fe22Co21Ni25Mo13 alloy and 304 stainless steel tested in the deaerated solutions of: (a) 1M HNO3 solution and (b) 1M HCl solution at 30 °C.
Figure 3.
Polarization curves of Cr19Fe22Co21Ni25Mo13 alloy and 304 stainless steel tested in the deaerated solutions of: (a) 1M HNO3 solution and (b) 1M HCl solution at 30 °C.

Figure 4.
The micrographs of Cr19Fe22Co21Ni25Mo13 alloy after polarization tested in the deaerated solutions of: (a) 1M HNO3 solution and (b) 1M HCl solution at 30 °C. The corrosion time of each specimen was 1500 s.
Figure 4.
The micrographs of Cr19Fe22Co21Ni25Mo13 alloy after polarization tested in the deaerated solutions of: (a) 1M HNO3 solution and (b) 1M HCl solution at 30 °C. The corrosion time of each specimen was 1500 s.


Table 1.
Chemical compositions of as-cast Cr19Fe22Co21Ni25Mo13 alloy in atomic percent analyzed by SEM/EDS.
Table 1.
Chemical compositions of as-cast Cr19Fe22Co21Ni25Mo13 alloy in atomic percent analyzed by SEM/EDS.
| Phase | Cr | Fe | Co | Ni | Mo |
|---|---|---|---|---|---|
| Overall | 18.8 ± 0.6 | 22.0 ± 0.9 | 21.2 ± 2.5 | 24.8 ± 1.2 | 14.2 ± 0.6 |
| FCC | 18.2 ± 0.7 | 23.2 ± 1.0 | 20.8 ± 1.3 | 26.1 ± 0.8 | 11.7 ± 0.6 |
| SC | 20.6 ± 0.8 | 18.1 ± 1.2 | 17.8 ± 1.6 | 16.9 ± 1.9 | 26.6 ± 2.8 |
Table 2.
Corrosion potentials and corrosion current densities of Cr19Fe22Co21Ni25Mo13 alloy tested under different temperatures.
Table 2.
Corrosion potentials and corrosion current densities of Cr19Fe22Co21Ni25Mo13 alloy tested under different temperatures.
| Solution | Items | 30 °C | 40 °C | 50 °C | 60 °C |
|---|---|---|---|---|---|
| 1M | Ecorr (V vs SSE) | −0.029 | 0.031 | 0.064 | 0.113 |
| HNO3 | icorr (μA/cm2) | 4.00 | 4.30 | 5.10 | 7.30 |
| solution | ipass (μA/cm2) | 23.8 | 23.7 | 23.1 | 24.6 |
| Eb (V vs. SSE) | 0.951 | 0.951 | 0.951 | 0.949 | |
| 1M | Ecorr (V vs SSE) | −0.30 | −0.267 | −0.203 | −0.172 |
| HCl | icorr (μA/cm2) | 6.00 | 6.30 | 9.80 | 20.0 |
| solution | Epp (V vs. SSE) | −0.099 | −0.091 | −0.081 | 0.080 |
| Icrit (μA/cm2) | 33.0 | 47.3 | 38.2 | 50.6 | |
| ipass (μA/cm2) | 41.0 | 53.0 | 58.0 | 48.6 | |
| Eb (V vs. SSE) | 0.971 | 0.968 | 0.961 | 0.951 |
Table 3.
Corrosion potentials and corrosion current densities of Cr19Fe22Co21Ni25Mo13 alloy and 304 stainless steel tested at 30 °C.
Table 3.
Corrosion potentials and corrosion current densities of Cr19Fe22Co21Ni25Mo13 alloy and 304 stainless steel tested at 30 °C.
| Alloy | 1M HNO3 Solution | 1M HCl Solution | ||
|---|---|---|---|---|
| Ecorr (V vs SSE) | icorr (A/cm2) | Ecorr (V vs SSE) | icorr (A/cm2) | |
| Cr19Fe22Co21Ni25Mo13 | −0.029 | 4.0 × 10⁻⁶ | −0.300 | 6.0 × 10⁻⁶ |
| 304 stainless steel | −0.399 | 3.9 × 10⁻² | −0.507 | 2.0 × 10⁻³ |
Publisher’s Note: MDPI stays neutral with regard to jurisdictional claims in published maps and institutional affiliations. |
© 2021 by the authors. Licensee MDPI, Basel, Switzerland. This article is an open access article distributed under the terms and conditions of the Creative Commons Attribution (CC BY) license (https://creativecommons.org/licenses/by/4.0/).
Share and Cite
MDPI and ACS Style
Tsau, C.-H.; Chen, P.-M. Corrosion Behavior of Cr19Fe22Co21Ni25Mo13 Alloy in 1M Nitric Acid and 1M Hydrochloric Acid Solutions. Crystals 2021, 11, 1289. https://doi.org/10.3390/cryst11111289
AMA Style
Tsau C-H, Chen P-M. Corrosion Behavior of Cr19Fe22Co21Ni25Mo13 Alloy in 1M Nitric Acid and 1M Hydrochloric Acid Solutions. Crystals. 2021; 11(11):1289. https://doi.org/10.3390/cryst11111289
Chicago/Turabian StyleTsau, Chun-Huei, and Po-Min Chen. 2021. "Corrosion Behavior of Cr19Fe22Co21Ni25Mo13 Alloy in 1M Nitric Acid and 1M Hydrochloric Acid Solutions" Crystals 11, no. 11: 1289. https://doi.org/10.3390/cryst11111289
Note that from the first issue of 2016, this journal uses article numbers instead of page numbers. See further details here.