Abstract
The microstructure evolution of AA2060 Al alloy containing Li during two-stage homogenization treatment was investigated by optical microscopy (OM), scanning electron microscopy (SEM) equipped with energy dispersive X-ray spectroscopy (EDS), differential scanning calorimeter (DSC), transmission electron microscopy (TEM), mechanical properties and Vickers micro-hardness test methods. The results demonstrate that severe precipitation of θ(Al2Cu) and S(Al2CuMg) phase existed in the as-cast alloy, especially in the center position. Cu elements were concentrated at grain boundary and gradually decreased from the boundary to the interior. Numerous eutectic phases of θ(Al2Cu) and S (Al2CuMg) containing Zn and Ag elements were segregated at grain boundaries. The overheating temperature of the as-cast alloy is 497 °C. After two-stage homogenization treatment, the θ(Al2Cu) and S (Al2CuMg) in the surface, middle and center positions were completely dissolved into the matrix, thus achieved uniform homogenization effect. Moreover, water cooling could prevent the precipitation after homogenization, which provided good performance of the studied alloy. The optimum two-stage homogenization treatment of AA2060 alloy was 460 °C/4 h + 490 °C/2 4 h. The homogenization kinetic analysis was discussed as well.
1. Introduction
The third-generation of Li-containing aluminum alloys AA2060 was registered at the American Aluminum Association in 2011 and replaces the traditional 2X24 series alloys. It has a low density, high specific strength, low crack growth rate, high corrosion resistance, and better performance at low temperature. The material is mainly used in the manufacture for aircraft fuselage and lower wing skin, and it is an important candidate material for the lightweight manufacturing of aircraft in China [1,2]. As it is latest developed and registered by Alcoa USA, there are limited reports about AA2060 compared to other Al alloys containing Li. So far, researchers mainly focus on the evolution of the microstructure during its thermal deformation, hot workability, and weldability together with its mechanical properties [3,4,5,6]. These studies have accumulated a large amount of data for the basic research of this alloy; however, there are few reports on the homogenization treatment process of AA2060. Wang et al. [7] and Teng et al. [8] studied the two-stage homogenization treatment process of Li-containing Al alloys 2050 and 20X0, respectively. Optimal homogenization treatments were determined in their work, i.e., for alloy 2050, the cast ingot started to melt at 502 °C~510 °C, which changed to 490 °C~495 °C after one stage of homogenization, and the suitable two-stage homogenization was proposed as 470 °C/8 h + 505 °C/24 h; For alloy 20X0, the as-cast alloy began melting at 510 °C~515 °C, which decreased to 500 °C~505 °C after one stage of homogenization, and the process at 470 °C/8 h + 495 °C/24 h was recommended. The segregation of Cu element was a main issue during the homogenization mentioned above. Considering the high content of alloying elements in AA2060 alloy, it is important to investigate its evolution of eutectic phases. Zhang et al. [9] and Li et al. [10] investigated the homogenized structure of Al-Cu-Li alloys, including the secondary phase distribution, the relationship between temperature change and the microstructure, and the residual second phase particles, in addition to the homogenization treatment and homogenization kinetics curves. In most cases, a homogenization cycle is composed of three consecutive steps: heating, soaking and cooling [11]. The elimination of dendritic segregation and non-equilibrium eutectic phases of alloying elements by means of homogenization is to obtain a good microstructure and provide critical process guarantee for subsequent processing. Studies showed that [11,12,13] slow cooling has a tendency to produce coarse particles, giving poor surface quality during deformation process and poor tensile properties. So the impact of the cooling rate on the precipitation process during homogenization is important, while very few researchers have reported on the effect of cooling rates following the homogenization treatment on the microstructure and properties of AA2060.
Therefore, in the present work, homogenization treatment was introduced to alloy ingots followed by different cooling methods. The optimal homogenization treatment was investigated by studying the microstructure evolution of second phase particles and its influence on the mechanical properties. It was verified by the fitting curve of the chemical kinetic equation, and the effect of cooling rate on the precipitation process after homogenization was discussed, which provides reliable process parameters for the homogenization treatment in the practical industrial application of AA2060 alloy, and provides a reference for the i homogenization of similar alloys.
2. Materials and Methods
2.1. Materials
The experimental material was provided by Southwest Aluminum (Group) Co., Ltd. (Chongqing, China) The material used in this work was alloy AA2060 (Al-3.8Cu-0.3Mn-0.8Mg-0.4Zn-0.13Zr-0.7Li-0.4Ag with Fe, Si, Ti less than 0.1, in wt.%), which was direct chill cast to approximate dimensions of 300 × 1200 × 4000 mm3. The casting temperature was about 730~760 °C at a casting speed of 20–30 mm/min. The homogenization treatments were designed as: ① 410 °C/4 h + 490 °C/24 h; ② 435 °C/4 h + 490 °C/24 h; ③ 460 °C/4 h + 490 °C/24 h; ④ 485 °C/4 h + 490 °C/24 h; and ⑤ 505 °C/4 h + 490 °C/24 h.
2.2. Methods
The samples with dimensions of 20 × 15 × 10 mm3 were cut along the transverse direction in the surface, middle and the center position of the as-cast ingot (as shown in Figure 1), where the middle position was 75 mm above the center. The center position was 150 mm from surface along the thickness direction. Homogenization treatments were conducted using an air circulated furnace. Two stages of homogenization treatment were carried out within the furnace. The homogenized samples were cooling down to room temperature by three methods including water quenching, air cooled and furnace cooling, respectively. Samples of the AA2060 alloy were taken then for microstructure characterization and mechanical property tests.
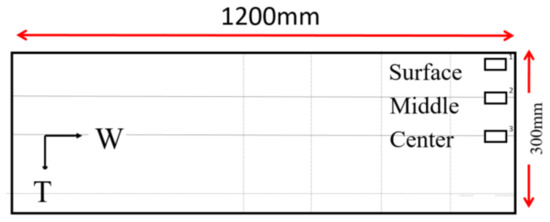
Figure 1.
Sample positions in the ingot, W: width direction T: thickness direction.
2.3. Microstructure Characterization
The microstructure characteristics of the as-cast and homogenized samples were analyzed by ZEISS Axiovert 40 MAT optical microscopy (OM, Carl Zeiss, Oberkochen, Germany), scanning electron microscopy (SEM, TESCAN MIRI 3, Brno, Czech Republic), and energy dispersive X-ray spectrometry (EDS, TESCAN, Brno, Czech Republic). The specimens for OM observation were ground and then electropolished in the polishing solution (90% C2H5OH + 10% HClO4) for 10 s, and afterward, electrolytic coated with coating solution (3.5% HBF4 + 96.5% H2O) for 25 s.
For SEM examination, the samples were mechanically polished and observed by using a TESCAN VEGA 3 LMH SEM microscope (TESCAN, Brno, Czech Republic). The homogenized microstructure of the specimens at different cooling rates were observed by transmission electron microscopy (TEM, Thermo Fisher Scientific Inc., Netherlands) using FEI Talos F200S operated at 200 kV. Differential scanning calorimetry (DSC) analyses were conducted using a SDT-Q600 (DSC, TA Inc., Portersville, PA, USA) with a heating rate at 10 °C/min. Mh-5l digital Vickers micro-hardness tester was used for hardness testing. The second phase content in the alloy was qualitatively analyzed by using a Japanese Physical X-ray diffractometer (XRD, Rigaku Inc., Akishima, Japan). The primary dendrite spacing in the dendrite structure of the alloy was identified according to the method of GB/T 14999.7-2010.The dimension of the tensile test samples were determined according to ASTM E8-M-04 standard.
3. Results and Discussion
3.1. Characterization of As-Cast Microstructure in Different Positions
According to the literature [14,15], the non-equilibrium solidification of the direct chill (DC) casting resulted in a formation of inhomogeneous chemical distribution and microstructure of the ingot, which is the so-called unbalanced state. Residual stress generated during casting existed in the internal part of the ingot. It was known that the inhomogeneity of the chemical composition and microstructure of the ingots can be eliminated by homogenization treatment. Soluble intermetallic particles can dissolve into the matrix during homogenization. Therefore, homogenization is an important process to ensure good performance of products. Figure 2 shows the microstructure of the alloy as-cast in different positions of the surface, middle, and center. It can be seen that the microstructure of AA2060 alloy is of typical as-cast eutectic structure exhibiting serious dendritic segregation (Figure 2a,c,e). The average grain size of as-cast alloy was about 316 μm. The existence of dendritic α-Al solid solution, interdendritic phases can be clearly observed at boundaries from three different positions of as-cast AA2060 alloy. There were a large number of non-equilibrium eutectic phases on the grain boundary as dendrite arms in the center. The number of dendrites became fewer at the surface compared to the center. As shown in Figure 2g, the fraction of interdendritic phases as-cast in a different position was varied, for example, the fraction of interdendritic phases was highest in the center position (about 6.49%), which indicated serious dendritic segregation.
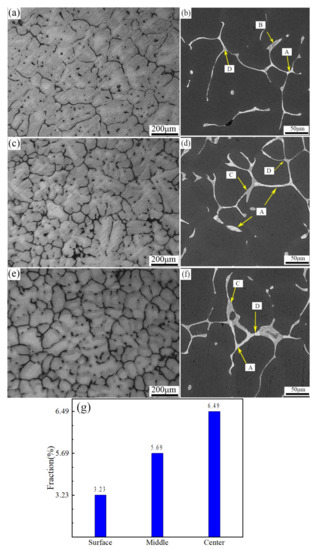
Figure 2.
OM and SEM backscattered electron images for the as-cast alloy in different positions (a,b) surface; (c,d) middle; (e,f) center; (g) the fraction of interdendritic phases in different positions.
Figure 2b,d,f is backscattered electron images of the as-cast microstructure in different positions. It can be clearly seen that the dendritic network structure is thinner in the surface than that in the middle and center positions. The results of EDS analysis of points A, B, C and D are listed in Table 1. It is indicated that the composition of grey intermetallic phase (point B, C, D) was S (Al2CuMg) which dissolves a small amount of Ag and Zn, and was enriched in grain boundaries, and the bright phase is θ(Al2Cu) (point A). Such distribution of phases were similar in other different regions of the as-cast microstructure.

Table 1.
Composition of the second phase in the as-cast microstructure at different position (at %).
Figure 3 is an SEM microstructure along with the distribution of the main elements Cu, Mg, Zn, Fe, Mn and Ag in the as-cast alloy, where the Li element was hard to be detect due to its light mass. Table 2 shows the results of EDS analysis. It can be seen that Cu concentration was larger in grain boundary than the grain interior, while the segregation of Zn, Fe, Mn and Ag was not obvious. Therefore, the homogenization was necessary to eliminate severe dendritic segregation of these elements. Generally, it can be described by using diffusion coefficient of element and the temperature as expressed below [15,16].
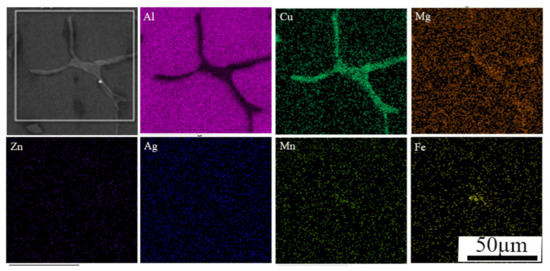
Figure 3.
SEM micrographs with element mapping of the coarse phases.
Table 2.
EDS analysis of the coarse particle.
Where d0 is the diffusion coefficient, q is the diffusion activation energy, r is the gas constant and T is the temperature. According to the expression of diffusion, higher temperature can help to eliminate the element segregation. But temperature too high can cause overheating and material failure. Therefore, the optimal parameters of homogenization should be explored.
3.2. Microstructure Evolution of Various Homogenized Heat Treatments at Center Position
3.2.1. DSC Analysis of As-Cast and First-Step Homogenized Alloy
DSC curves of as-cast AA2060 alloy are shown in Figure 4a. The melting temperature of the second phases during the homogenization treatment process can be identified through measurement. It can be clearly seen from the figure that two endothermic peaks were observed in the as-cast alloy, sited at 497.9 °C and 507.4 °C. The low eutectic phase will be dissolved firstly when the temperature for homogenization is 497.9 °C. Thus, the homogenization temperature must not exceed this temperature. The peak of overheating melting was nearly 507.4 °C. Moreover, the DSC curve after the first-step homogenization at 460 °C for 4 h is given in Figure 4b. As a matter of fact, the 501.7 °C peak after the first-step homogenization and the 497.9 °C peak in as-cast state were the same peak, but after homogenization, it became much smaller. The low eutectic phase will start to be dissolved when the temperature reaches 497.9 °C in as-cast condition while after homogenization (460 °C/4 h), it begins at nearly 501.7 °C. So the first-step homogenization moves the overheating temperature higher about 4 °C. Considering of the large ingot dimension in practical industrial production and the temperature control of the large-scaled furnace, the second-step of homogenization should be chosen to guarantee the stability of alloy properties. So the upper limit temperature of homogenization is selected as 490 °C.
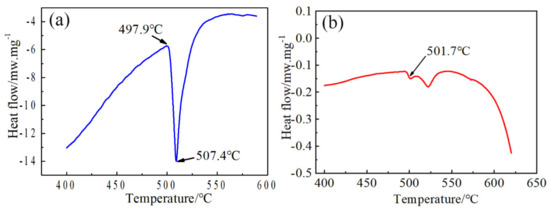
Figure 4.
(a) DSC curves of the as-cast and (b) first-step homogenization 460 °C/4 h.
3.2.2. Microstructure after Different Two-Stage Homogenization
In order to verify the rationality of the two-stage homogenization design, a sample from the same location (in this experiment, the center position) was selected for examinations. According to the literature [15], the alloy after two-stage homogenization treatment has a better performance than the single-stage homogenization. The reason is that a proper first-step homogenization can dissolve the particles with low melting points first to make sure the remaining undissolved eutectic phase can be further dissolved into the Al matrix at an increased temperature of the second-step homogenization without overheating of the alloy. Therefore, the two-stage homogenization of AA2060 aluminum alloy was explored for this purpose, aiming to obtain a superior homogenization to provide a suitable microstructure guarantee for the subsequent optimization of hot workability. The optical microstructures in the center position after different two-stage homogenization treatments are shown in Figure 5. It can be clearly seen that the grain boundaries in Figure 5c are the smallest, which became thinner and clearer during homogenization, where most of the residual phases dissolved and the dendritic network structure was reduced. The alloy was in a relatively stable state in the samples homogenized beyond 460 °C. The distribution of second phase along the grain boundary becomes discontinuous. In addition, some dendrites and second phases still existed. When the temperature was increased to 505 °C, Figure 5e shows that some small holes distributed at triple conjunctions were observed, indicating the specimen was seriously overheated. As shown in Figure 5f, the statistics on the fraction of interdendritic phases after different heat treatments shows that the fraction of interdendritic particles was lowest in the homogenized 460 °C/4 h + 490 °C/24 h (about 0.26%), which suggests that most of the residual phases at the grain boundary were dissolved into the matrix.
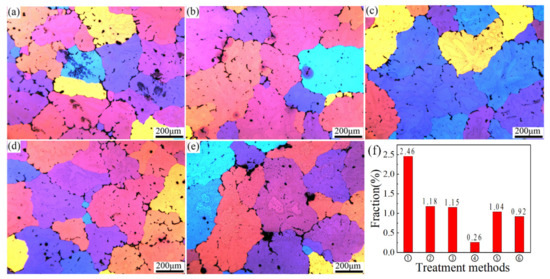
Figure 5.
Optical microstructure of samples after different two-stage homogenization in the center (a) 410 °C/4 h + 490 °C /24 h; (b) 435 °C/4 h + 490 °C/24 h; (c) 460 °C/4 h + 490 °C/24 h; (d) 485 °C/4 h + 490 °C/24 h; (e) 505 °C/4 h + 490 °C/24 h; (f) the fraction of interdendritic particles before and after homogenization.
In order to confirm the optimal homogenization, one way is to observe the second phase particles dissolved into the matrix during homogenization and their relationship to the evolution of microstructure. Vickers microhardness (a load of 1000 g for 15 s) was also measured on samples within 0.5 h after they were two-step homogenized and water quenched, as shown in Figure 6f. The hardness of the alloy after homogenization of 460 °C/4 h + 490 °C/24 h was the highest. This may have been caused by the eutectic phase re-dissolved into the aluminum matrix, which produced a stronger solid solution strengthening.
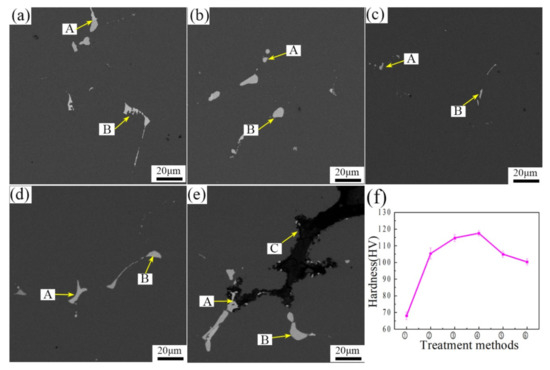
Figure 6.
Hardness results of samples after different two-stage homogenization in the center position. (a) 410 °C /4 h + 490 °C/24 h; (b) 435 °C/4 h + 490 °C/24 h; (c) 460 °C/4 h + 490 °C/24 h; (d) 485 °C /4 h + 490 °C/24 h; (e) 505 °C/4 h+490 °C/24 h; (f) hardness value.
Through EDS analysis presented in Figure 6, the chemical composition of the second phase in Table 3 was obtained. It can be seen from the Table that point A contains mainly Cu elements, point B contained mainly Cu and Fe elements, and point C contained mainly Mg and O elements. From the microstructure of the scanning electron microscope, it could be seen that the S(Al2CuMg) phase in the alloy that underwent the two-stage homogenization treatment was fully dissolved, but the θ(Al2Cu) phase contained in the structure could not completely dissolved, and the θ(Al2Cu) phase containing a small amount of Fe in the structure cannot be dissolved. The grain boundary in the structure Figure 6e was melted, so a high content of oxygen was presented in the phase composition, and obvious overheating occurs. This adversely influences the performance of the alloy, and the over-heating effect could not be rescued. After comprehensive microstructure and performance evaluation, therefore, the proper homogenization treatment is selected as 460 °C/4 h+490 °C/24 h.
Table 3.
Chemical Composition of Second Phases (at%).
3.2.3. X-ray Diffraction Analysis
The XRD patterns of samples as-cast and two-stage homogenization in the center location are shown in Figure 7. The main phases in as-cast consisted mostly of θ(Al2Cu), S(Al2CuMg) and α(Al). After two-stage homogenization at 460 °C for 4h followed by 490 °C for 24 h, θ(Al2Cu) and S(Al2CuMg) phase decreased. The sample after two-stage homogenization at 460 °C for 4h followed by 490 °C for 24 h showed no obvious diffraction peak in X-ray diffraction patterns except for α(Al). Therefore, the 460 °C for 4 h followed by 490 °C for 24 h was the optimal two-stage homogenization treatment.
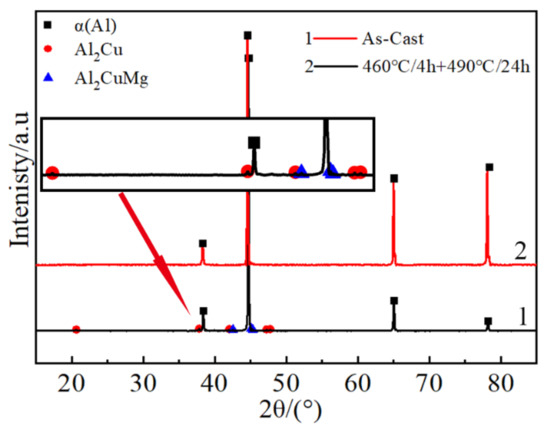
Figure 7.
XRD patterns of the as-cast and two-stage homogenization at center position.
3.3. Microstructure Evolution of Samples in Different Positions after Heat Treatment
3.3.1. Microstructure
Figure 8a,c,e shows the sample homogenized at two stages of 460 °C/4 h + 490 °C/24 h in different positions. The optical microstructure of the surface, middle and center can be compared with the as-cast microstructure at the same positions shown in Figure 2a,c,e. The residual phase distribution along the grain boundaries was discontinuous, and the grain boundaries became thinner and clearer in three locations. Comparably, the grain boundaries and dendrites in the as-cast microstructure were sparse and coarse, and there were a large number of low-melting eutectics in the grain boundaries.
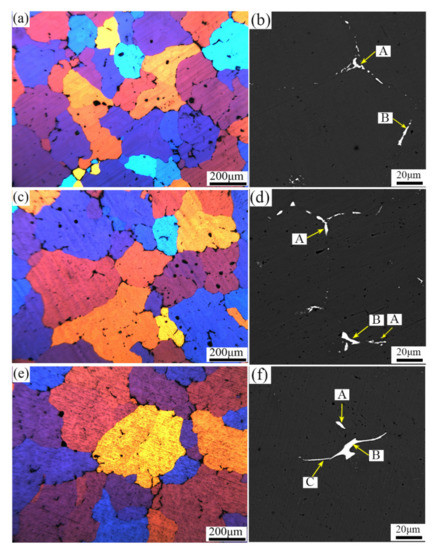
Figure 8.
BSE microstructure of samples after 460 °C/4 h + 490 °C/24 h homogenization in different positions (a,b) Surface, (c,d) Middle, (e,f) Center.
In the surface, middle and center positions, there were a large number of intermetallic phases at the grain boundaries in as-cast microstructure. Figure 8b,d, and f is backscattered electron images of samples in the surface, middle and center positions after the two-stage homogenization. The intermetallic phases gradually dissolved into the matrix, and the residual phases in the grain boundaries decreased significantly. Grain boundaries become discontinuous, and the interdendritic second phases at the surface became smaller and sparser compared to those in the middle and center positions. However, comparing the as-cast microstructure in the middle and center positions, the residual phase was almost dissolved into the matrix and the grain boundary was eliminated obviously, which indicated that the two-stage homogenization treatment of 460 °C/4 h + 490 °C/24 h was proper in all different positions.
The EDS analysis of A, B and C points (Table 4) revealed that the eutectic phases of Mg, Fe, and Mn were mainly segregated at the grain boundaries. The point A compounds were probably Al2Cu. The point C compounds were mainly Al-Cu-(Mg) phase. The point B compounds contain a small amount of Fe and Mn, which were Al-Cu-Fe-Mn phases. The analysis shows that the diffusion of the eutectic structure to the matrix was obvious during the two-stage homogenization. Compared with the as-cast microstructure, the diffusion effect was consistent in the surface, middle and center at the same temperature.
Table 4.
460 °C/4 h + 490 °C/24 h chemical composition of the second phase (at%).
3.3.2. Homogenization Uniform Effect Consistency
Figure 9 shows the EDS line scanning results for the sample after the optimal two-stage homogenization at 460 °C/4 h + 490 °C/24 h in different positions. Compared with the as-cast microstructure, the number of the coarser second phases was significantly reduced. Mg, Mn, and Fe elements diffused from the grain boundaries or dendrite boundaries into the matrix. The diffusion coefficients of Cu, Mg and Zn respectively at different temperature are shown in Table 5, where the diffusion velocity was Zn > Mg > Cu. In addition, the residual phases mainly contained Cu elements. The evolution of the eutectic phase structure during homogenization was confirmed (Figure 9b,d,f), and it can be inferred that the relationship between the diffusion rate of elements at the same temperature was Zn (Ag )> Mg (Fe, Mn) > Cu. The optimal homogenization was to ensure the diffusion of Cu element.
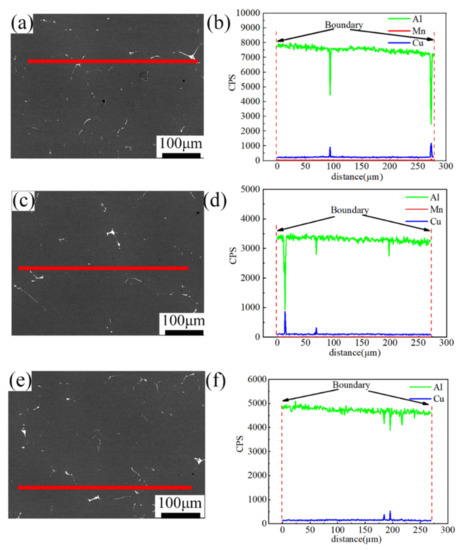
Figure 9.
Line scanning of samples in different positions after homogenization at 460 °C/4 h + 490 °C/24 h. (a,b) Surface, (c,d) middle, (e,f) center.
Table 5.
Cu, Mg and Zn atomic diffusion coefficient (m2/s).
3.4. Effect of Different Cooling Methods on Microstructural Properties
After two-stage homogenization, the samples were water cooled (WC), air cooled (AC) and furnace cooled (FC), which obtained different cooling rates of about 210 °C/s, 1.5 °C/s and 0.008 °C/s through 490 °C, respectively. Such tests were carried out according to time-temperature data recorded by a thermocouple, so as to observe the cooling methods in approximate industrial conditions. The evolution of the precipitation in the differently cooled methods was investigated for comparison. TEM image of the specimens cooled by water, air and in the furnace are shown in Figure 10a–c, where orientation possesses an approximate misorientation of <110>Al. Al20Cu2Mn3 and Al3Zr phase existed in the water and air cooled samples. Meanwhile, Al20Cu2Mn3 and Al3Zr phase existed in the air cooled one (Figure 10a,b). These phases were dispersoids, and cooling rates did not have a significant influence on them. Studies shown that T1 phase precipitates as tiny platelets with high aspect ratio and its size remains in the nanometer level during heat treatment at low temperature [13,18]. In this work, the furnace cooling was very slow, which facilitates the T1 phase to precipitate and becomes coarsen intensively. Therefore, the T1 phase (Al2CuLi) particles were influenced by cooling rate significantly. With reducing cooling rate, the T1 phase (Al2CuLi), Al3Zr, Al20Cu2Mn3 and θ(Al2Cu) particles precipitated more in the grains, as shown Figure 10c.
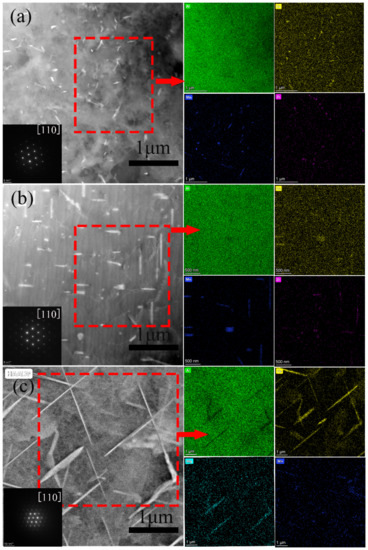
Figure 10.
TEM images of 460°C/4 h + 490 °C/24 h after homogenization specimens at the different cooling methods, (a) water-cooled, (b) air-cooled, and (c) cooled with the furnace.
Figure 11a–c shows that the SEM backscattered images of the samples after two-stage homogenization at different cooling rates. The residual interdendritic second phases in the grain boundaries decrease significantly. With an increasing cooling rate, the majority of second phases dissolved into the matrix to form a supersaturated solid solution in the water cooled sample. The interdendritic second phases in the grain boundaries are discontinuous and become thinner, but a small amount of residual dendrites still existed.
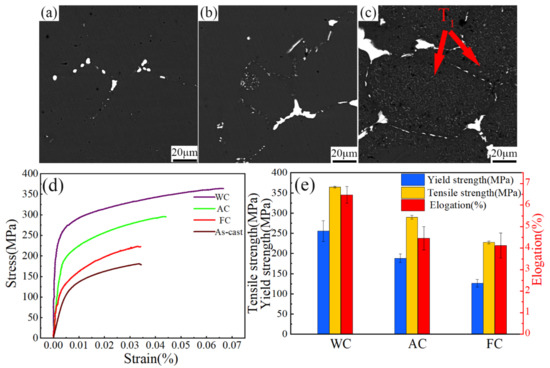
Figure 11.
(a–c) BSE images and (d–e) mechanical properties of the samples with different cooling rates.
In the air cooling process, the supersaturated solid solution was decomposed. A large amount of the Al20Cu2Mn3 phase was precipitated within the grains. In the furnace cooling method, a large amount of the Al2CuLi phase was precipitated. The slower the cooling rate, the more the second phase precipitates. The faster the cooling rate, the less the Al2CuLi phase precipitated. The cooling rate affected the phase precipitation, which was the same in other similar alloys [19,20].
Figure 11d,e presents the engineering stress-strain curves, yield strength, ultimate tensile strength and elongation of samples after optimal two-stage homogenization followed by different cooling methods. The tensile properties of the samples were tested within 36 h after homogenization. It can be seen that the water cooled samples had the best tensile properties, where the yield strength and tensile strength were 255 MPa and 364 MPa, respectively, and the elongation was 6.5%. The reason is that the super-saturated solid solution was retained by water cooling, so solid solution strengthening was maintained. With decreasing cooling rate, as expected, the furnace cooled samples exhibit the lowest tensile properties, where the yield strength and tensile strength were 126 MPa and 227 MPa, respectively, and the elongation rate was 4.1%. This degradation of mechanical properties can be attributed to the coarse T1 phase (Al2CuLi) and θ(Al2Cu). In addition, as shown Figure 11d, the tensile properties of as-cast were lower than furnace cooled sample, because there is serious segregation along grain boundaries, which may break away from the matrix and form micro-cracks under the tensile tests.
3.5. Homogenization Kinetic Curve Analysis
The distribution of the main alloying elements Cu, Mg, Zn and Mn across the interdendritic region varied periodically. The diffusion coefficient of Cu element was much lower than other elements of Mg, Zn, and Mn during homogenization [21]. Based on the previous study [22,23], the initial concentration of the elements along the inner dendritic region could be described by Fourier series components in a cosine function:
where is the concentration at point x, M is the average concentration of alloying elements after homogenization, and L is the inter dendritic spacing. is the initial amplitude of the composition segregation, and ΔM0 is the difference between the maximum and minimum element concentration in the grain boundary and the grain. This can be expressed as:
According to Fick’s second law and boundary conditions, each fundamental wave component that has deduced the distribution state independently decays at a certain rate with heating time. The fundamental wave attenuation function can be expressed by:
Considering the relationship between diffusion coefficient and temperature, according to the Equations (1) and (4), N(t) can be rewritten as
Generally, when the chemical composition segregation amplitude is reduced to 1%, the element distribution is homogeneous as express by
Then
The above Equation (7) can be rewritten below by taking natural logarithms,
Equation (8) is the homogenization kinetic equation. Here T, t and L are the homogenization temperature, holding time and interdendritic spacing. According to the analysis results of Section 3.1 and some previous studies [24,25,26], the homogenization process is mainly affected by the diffusion of Cu element. According to optical microstructure analysis of Figure 12a, the primary dendrite spacing of the sample homogenized at 460 °C for 4 h was 67 μm. Taking the coefficient d0 (Cu) = 0.084 cm2/s, q (Cu) = 136.8 kJ/mol and r = 8.31 J/(mol K) into Equation (8), the homogenization kinetic curve of the experimental alloy for the interdendritic structure with 67 μm spacing was obtained, as shown in Figure 12b. It can be seen that at the temperature of 490 °C, the corresponding homogenization holding time was about 24 h, which has a good agreement with the experimental results. Based on the analysis above, it is recommended that a suitable two-step homogenization treatment can be chosen as 460 °C for 4 h followed by 490 °C for 24 h.
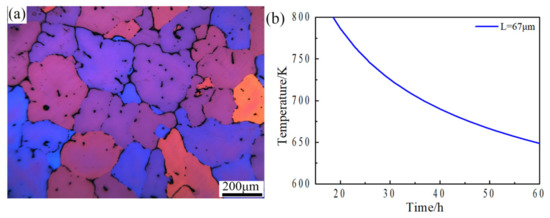
Figure 12.
(a) Optical microstructure of sample homogenized at 460 °C for 4 h, (b) Curve of homogenization kinetic.
4. Conclusions
- (1)
- Several dendrites existed in the as-cast microstructure in different positions. Cu and Mg elements were mainly concentrated at the dendrite boundary. The secondary phase in the as-cast microstructure was mainly θ(Al2Cu) and S(Al2CuMg).
- (2)
- Based on the two-stage homogenization for the sample in the center position, the optimal treatment can be chosen as 460 °C/4 h + 490 °C/24 h.
- (3)
- The two-stage homogenization with different cooling rates was applied with water cooling, air cooling and furnace cooling. Second phase changes significantly with the cooling rates. The distribution of the main alloying elements Cu, Mg, Zn and Mn across the interdendritic region varied periodically.
Author Contributions
C.L. and L.C. conceived and designed the experiments; C.L. performed the experiments and collected the data; C.L. analyzed the data and drafted the paper; F.G., and L.C. revised the paper; L.L. and G.H. offered the funding. All authors have read and agreed to the published version of the manuscript.
Funding
The authors acknowledged the financial support by the National Natural Science Foundation of China (51421001); the Open Fund of National Key Laboratory of Science and Technology on High-strength Structure Materials, Central South University; and the Fundamental Research Funds for the Central Universities (2020CDJDCL001).
Data Availability Statement
The data that supports the findings of the study is available from the corresponding author, G.H. and L.C., upon reasonable request.
Conflicts of Interest
The authors declare no conflict of interest.
References
- Karabin, L.M.; Bray, G.H.; Rioja, R.J.; Venema, G. Al-Li-Cu-Mg-(Ag) Products for Lower Wing Skin Applications. In ICAA13 Pittsburgh; Weiland, H., Rollett, A.D., Cassada, W.A., Eds.; Springer: Cham, Switzerland, 2012; pp. 529–534. [Google Scholar] [CrossRef]
- Wanhill, R.J.H.; Bray, G.H. Chapter 2—Aerostructural Design and Its Application to Aluminum–Lithium Alloys. In Aluminum-Lithium Alloys; Butterworth-Heinemann: Oxford, UK, 2014; Volume 44, pp. 27–58. [Google Scholar] [CrossRef]
- Sun, J.F.; Zheng, Z.Q.; Lin, Y.; He, D.Q.; Li, H.P.; Wu, Q.P. Microstructures and mechanical properties of 2060 alloy FSW joint. Chin. J. Nonferrous Met. 2014, 24, 364–370. Available online: https://www.researchgate.net/publication/287427518_Microstructures_and_mechanical_properties_of_2060_alloy_FSW_joint (accessed on 31 December 2020).
- Ou, L.; Zheng, Z.Q.; Nie, Y.F.; Jian, H.G. Hot deformation behavior of 2060 alloy. J. Alloy. Compd. 2015, 648, 681–689. [Google Scholar] [CrossRef]
- Zhu, X.X. Aging Precipitation Behavior and Strengthening Mechanism of New Al-Li Alloy; Harbin Institute of Technology: Harbin, China, 2016. [Google Scholar] [CrossRef]
- Cao, L.F.; Liao, B.; Wu, X.D.; Li, C.Y.; Huang, G.J.; Cheng, N.P. Hot Deformation Behavior and Microstructure Characterization of an Al-Cu-Li-Mg-Ag alloy. Crystals 2020, 10, 416. [Google Scholar] [CrossRef]
- Wang, J.; Zhang, M. Double-step Homogenization Process of 2050 Al-Li Alloy Ingot. Am. Fabr. 2015, 4, 4–9. [Google Scholar] [CrossRef]
- Teng, M.H.; Zhang, M. Research on Two-stage Homogenization Process for 20X0 Al-Li Alloy Ingot. Am. Fabr. 2016, 2, 27–31. [Google Scholar] [CrossRef]
- Zhang, L.; Zheng, Z.Q.; Li, J.F.; Liu, Q.; Sang, F.J. Central South University. Two-stage homogenization process of 2055 Al-Li alloy. Rare. Metal. Mater. Eng. 2016, 11, 3015–3022. [Google Scholar]
- Li, H.Y.; Su, X.J.; Yin, H.; Huang, D.S. Adsorption behavior and adsorption mechanism of Cu(II) ions on amino-functionalized magnetic nanoparticles. Trans. Nonferrous Met. Soc. China 2013, 23, 2543–2550. [Google Scholar] [CrossRef]
- Yucel, B. Effect of cooling rate on precipitation during homogenization cooling in an excess silicon AlMgSi alloy. Mater. Charact. 2012, 73, 37–42. [Google Scholar] [CrossRef]
- Xu, C.; Zheng, M.Y.; Wu, K.; Wang, E.D.; Fan, G.H.; Xu, S.W.; Kamado, S.; Liu, X.D.; Wang, G.J. Effect of cooling rate on the microstructure evolution and mechanical properties of homogenized Mg–Gd–Y–Zn–Zr alloy. Mater. Sci. Eng. A 2013, 559, 364–370. [Google Scholar] [CrossRef]
- Wang, X.Y.; Jiang, J.T.; Li, G.A.; Wang, X.M.; Sun, J.; Zhen, L. Effects of coarse Al2CuLi phase on the hot deformation behavior of Al–Li alloy. J. Alloys Compd. 2020, 815, 152469. [Google Scholar] [CrossRef]
- Xia, S.L.; Zhao, X.Q.; Shi, M.J.; Chen, J.H.; Wang, S.B.; Wu, C.L. Homogeneous heat treatment of 2519 aluminum alloys. J. Electron. Microsc. 2012, 31, 469–475. [Google Scholar]
- Zhang, F.; Shen, J.; Yan, X.D.; Sun, J.L.; Sun, X.L.; Yang, Y. Homogenization heat treatment of 2099 Al–Li alloy. Rare Met. 2014, 33, 28–36. [Google Scholar] [CrossRef]
- Li, H.Y.; Su, X.J.; Yin, H.; Huang, D.-S. Microstructural evolution during homogenization of Al-Cu-Li-Mn-Zr-Tialloy. Trans. Nonferrous Met. Soc. China 2013, 23, 2543–2550. [Google Scholar] [CrossRef]
- Li, Y.S.; Shen, J.; Yan, X.D.; Li, X.W.; Zhang, F.; Sun, B.Q. Homogenization Treatment Parameter Optimization and Microstructural Evolution of Al-Cu-Li Alloy. Rare Met. Mater. Eng. 2017, 46, 28–34. [Google Scholar] [CrossRef]
- Wang, X.M.; Li, G.A.; Jiang, J.T.; Shao, W.Z.; Zhen, L. Influence of Mg content on ageing precipitation behavior of Al-Cu-Li-x alloys. Mater. Sci. Eng. A 2019, 742, 138–149. [Google Scholar] [CrossRef]
- Qing, D.; Lina, J.; Kai, T.; Holmedal, B. Modelling and experimental validation of microstructure evolution during the cooling stage of homogenization heat treatment of Al–Mg–Si alloys. Materials 2018, 4, 70–80. [Google Scholar] [CrossRef]
- Birol, Y. Optimization of homogenization for a low alloyed AlMgSi alloy. Mater. Charact. 2012, 73, 37–42. [Google Scholar] [CrossRef]
- Jia, M.; Zheng, Z.; Gong, Z. Microstructure evolution of the 1469 Al–Cu–Li–Sc alloy during homogenization. J. Alloys Compds. 2014, 614, 131–139. [Google Scholar] [CrossRef]
- Liu, Q.; Zhu, R.H.; Li, J.F.; Chen, Y.; Zhang, X.H.; Zhang, L.; Zheng, Z.Q. Microstructural evolution of Mg, Ag and Zn micro-alloyed Al–Cu–Li alloy during homogenization. Trans. Nonferrous Met. Soc. China 2016, 26, 607–619. [Google Scholar] [CrossRef]
- Kai, W.; Baiqing, X.; Yongan, Z.; Guojun, W.; Xiwu, L.; Zhihui, L.; Shuhui, H.; Hongwei, L. Microstructure evolution of a highzinc containing Al-Zn-Mg-Cu alloy during homoge-ionization. Rare Metal Mate. Eng. 2017, 46, 928. [Google Scholar]
- Li, H.Y.; Yu, W.; Wang, X.; Du, R.; You, W. Investigation on Microstructural Evolution and Properties of an Al-Cu-Li Alloy with Mg and Zn Microalloying during Homogenization. Metals 2018, 8, 1010. [Google Scholar] [CrossRef]
- Tang, X.Y.; Yi, R.W.; Shou, W.B.; Wang, P.; Wang, B.; Yi, D.Q. Homogeneous heat treatment of 2055 aluminum-Li alloy. Light Alloy Process. Technol. 2016, 44, 15–21. [Google Scholar] [CrossRef]
- Li, C.L.; Pan, Q.L.; Liu, X.Y.; He, Y.B.; Li, W.B. Homogeneous heat treatment of 2124 aluminum alloys. Chin. J. Nonferrous Met. 2010, 20, 209–216. Available online: https://www.researchgate.net/publication/286613922_Homogenizing_heat_treatment_of_2124_aluminum_alloy (accessed on 31 December 2020).
Publisher’s Note: MDPI stays neutral with regard to jurisdictional claims in published maps and institutional affiliations. |
© 2020 by the authors. Licensee MDPI, Basel, Switzerland. This article is an open access article distributed under the terms and conditions of the Creative Commons Attribution (CC BY) license (http://creativecommons.org/licenses/by/4.0/).