Review

Pump-Probe Time-Resolved Serial Femtosecond Crystallography at X-Ray Free Electron Lasers

by
Suraj Pandey
*,†,
Ishwor Poudyal
*,† and
Tek Narsingh Malla
*,†
Physics Department, University of Wisconsin-Milwaukee, Milwaukee, WI 53211, USA
*
Authors to whom correspondence should be addressed.
All authors contributed equally.
Crystals 2020, 10(7), 628; https://doi.org/10.3390/cryst10070628
Submission received: 17 June 2020 / Revised: 16 July 2020 / Accepted: 20 July 2020 / Published: 21 July 2020
(This article belongs to the Special Issue Time Resolved Crystallography)

Abstract

:
With time-resolved crystallography (TRX), it is possible to follow the reaction dynamics in biological macromolecules by investigating the structure of transient states along the reaction coordinate. X-ray free electron lasers (XFELs) have enabled TRX experiments on previously uncharted femtosecond timescales. Here, we review the recent developments, opportunities, and challenges of pump-probe TRX at XFELs.

1. Introduction

The chemical reactions that enable life are catalyzed by proteins. Proteins change their structures while they perform these functions. This change can be observed “in real time” using time-resolved X-ray crystallography (TRX) [1,2]. A recent review on “kinetic crystallography” [3] enumerates several strategies to trap proteins in action. These approaches can be arranged into two main categories. Physical or chemical trapping [4,5] methods (such as trapping by freezing or chemical modifications) work by artificially prolonging the lifetime of reaction intermediates so that their structures can be determined with conventional crystallography. The methods in the second category attempt to match the X-ray exposure time to the “genuine” lifetime of the intermediates whose structures are then determined during the freely proceeding reaction in real-time. TRX experiments with a time resolution up to 100 ps can be performed with synchrotron X-ray sources while X-ray free electron lasers (XFELs) are available to probe shorter time scales. With TRX, the molecular structures of the reaction intermediates and the reaction dynamics can be extracted simultaneously [6,7,8].
Several methods have been used to trigger reactions for imaging dynamics in TRX. They include excitation by intense laser pulses [9], diffusive mixing [10,11], light activation of caged substrates [12], temperature jumps and perturbation by electric fields [13]. Two methods stand out for widespread application since they can be relatively easily applied: diffusive mixing and light activation. In diffusive mixing, the reaction is initiated by mixing the substrate into enzyme crystals [14,15]. The mixture is exposed to X-rays after a certain time delay. By varying the time delay, the reaction can be followed on various time scales [15]. The time points of the reaction are determined by varying the flow rate and/or the distance traveled by the mixture. This is called “mix-and-inject” crystallography (MISC) [14,15,16]. The application of MISC was reviewed recently [17,18]. Here, we focus on light activated processes. For naturally photosensitive proteins, a reaction can be initiated by a brief laser flash called a “pump” pulse at t = 0. After an adjustable time-delay ( Δ t ), the crystals are illuminated by an X-ray pulse, known as the “probe” pulse, which generates a diffraction pattern. This is called a pump-probe experiment (Figure 1). After changing the pump-probe time delay, the process is repeated. Electron density maps calculated at various time delays show the evolution of the structure during the light-induced reaction.

2. Time-Resolved Crystallography at Synchrotron Sources

Synchrotron radiation (SR) facilities have been the mainstays of structural biology for a long time. The advancement in X-ray intensity, data collection and analysis methods have enabled routine pump-probe experiments [1,19,20]. Time scales up to 100 ps have been probed [21,22,23,24], but this method is currently limited by the pulse duration. Both monochromatic [25] and polychromatic Laue methods [26,27] have been used for time-resolved studies. With the Laue method, a broader energy range of incident X-rays is used. Laue data is collected with 2–3° angular increments, and therefore < 100 frames per data set are sufficient, even for low symmetry space groups [28]. The stroboscopic technique has been used with monochromatic X-rays [25]. Thousands of pump-probe cycles are repeated and accumulated on a single detector frame until a sufficient level of counting statistics has been reached.
With regard to the synchrotron, there have been efforts to increase the time resolution from ~100 ps to the ~10 ps by using the time-slicing method [29,30]. A short laser pump pulse is positioned at selected points in the wider X-ray probe pulse. A part of the X-ray pulse probes the initial reaction prior to the pump pulse, while the remaining part of the same X-ray pulse probes the excited state. This method results in reduced scattered intensities as only a portion of the X-ray pulse is used. XFELs are needed to provides much faster timescales as discussed in the next section.

3. Free-Electron Lasers

The advent of XFELs has initiated a new era in TRX. The first XFEL, the Linac Coherent Light Source (LCLS) at the Stanford Linear Accelerator Center (SLAC), California, was commissioned in 2009. Thereafter, five XFELs have come into operation (as of 2020) and two more are still under construction. XFELs produce spatially and temporally, highly coherent X-ray pulses with a duration of tens of femtoseconds and 1012–1013 hard X-ray photons per pulse. XFEL beams can be focused to a spot size of only a few micrometers (μm). As a result, μm-sized crystals can be used. XFEL pulses are so intense that the crystals are destroyed after a single exposure. Since damage requires some time to evolve and diffraction is instantaneous, femtosecond X-ray pulses from an XFEL produce essentially damage-free diffraction patterns. This establishes the well-known “diffraction-before-destruction” principle [31,32]. As the crystals are damaged, XFEL experiments demand a serial way to introduce fresh samples into the X-ray interaction region. This has led to the development of serial femtosecond crystallography SFX (Figure 1).
Radiation damage is primarily due to ionization induced by direct photo-absorption [33]. The ionized atom in an excited state decay mainly via the Auger relaxation process or by the emission of an X-ray fluorescence photon. The secondary damage is induced by the reactions of free radicals generated by electron-impact ionization. The secondary damage involves breaking of the disulfide bonds, decarboxylation of the acid group of amino acids, and other general effects such as an increase in the temperature factor, the increase in cell parameters, loss of high-resolution data, etc. [34]. When using pulses shorter than the Auger lifetime of atoms, the radiation damage can be reduced by outrunning the development of secondary electron-impact cascades [35,36]. The average dose of 400 MGy (1 J/kg = 1 Gy) is estimated to ionize every atom in an average protein crystal [37]. At this dose, the scattering signal is predominantly from neutral (undamaged) atoms. The doses have also been calculated for lysozyme crystals with the XFEL beam at LCLS [38]. In this study, data were collected at 9.4 keV (1.32 Å) using 5 fs pulses with 53 mJ pulse energy, and 40 fs pulses with 600 mJ pulse energy at the sample. The doses were reported to be ~2.9 MGy per crystal for the 5 fs pulse and ~33 MGy per crystal for the 40 fs pulse. Nevertheless, on a timescale of tens of femtoseconds, photoionization of atoms cannot be avoided. Site-specific damage effects have been studied around iron metal clusters in ferredoxin using XFEL data with a pulse duration of 80 fs, which is slightly longer than that typically used in serial femtosecond crystallography (SFX) experiments [39]. This work supports the simulations [40] and also suggests that pulse durations of 20 fs or less may be needed to minimize some types of site-specific damage. However, lighter elements such as carbon, nitrogen, and oxygen, which are the main components of most proteins are less susceptible to radiation damage.

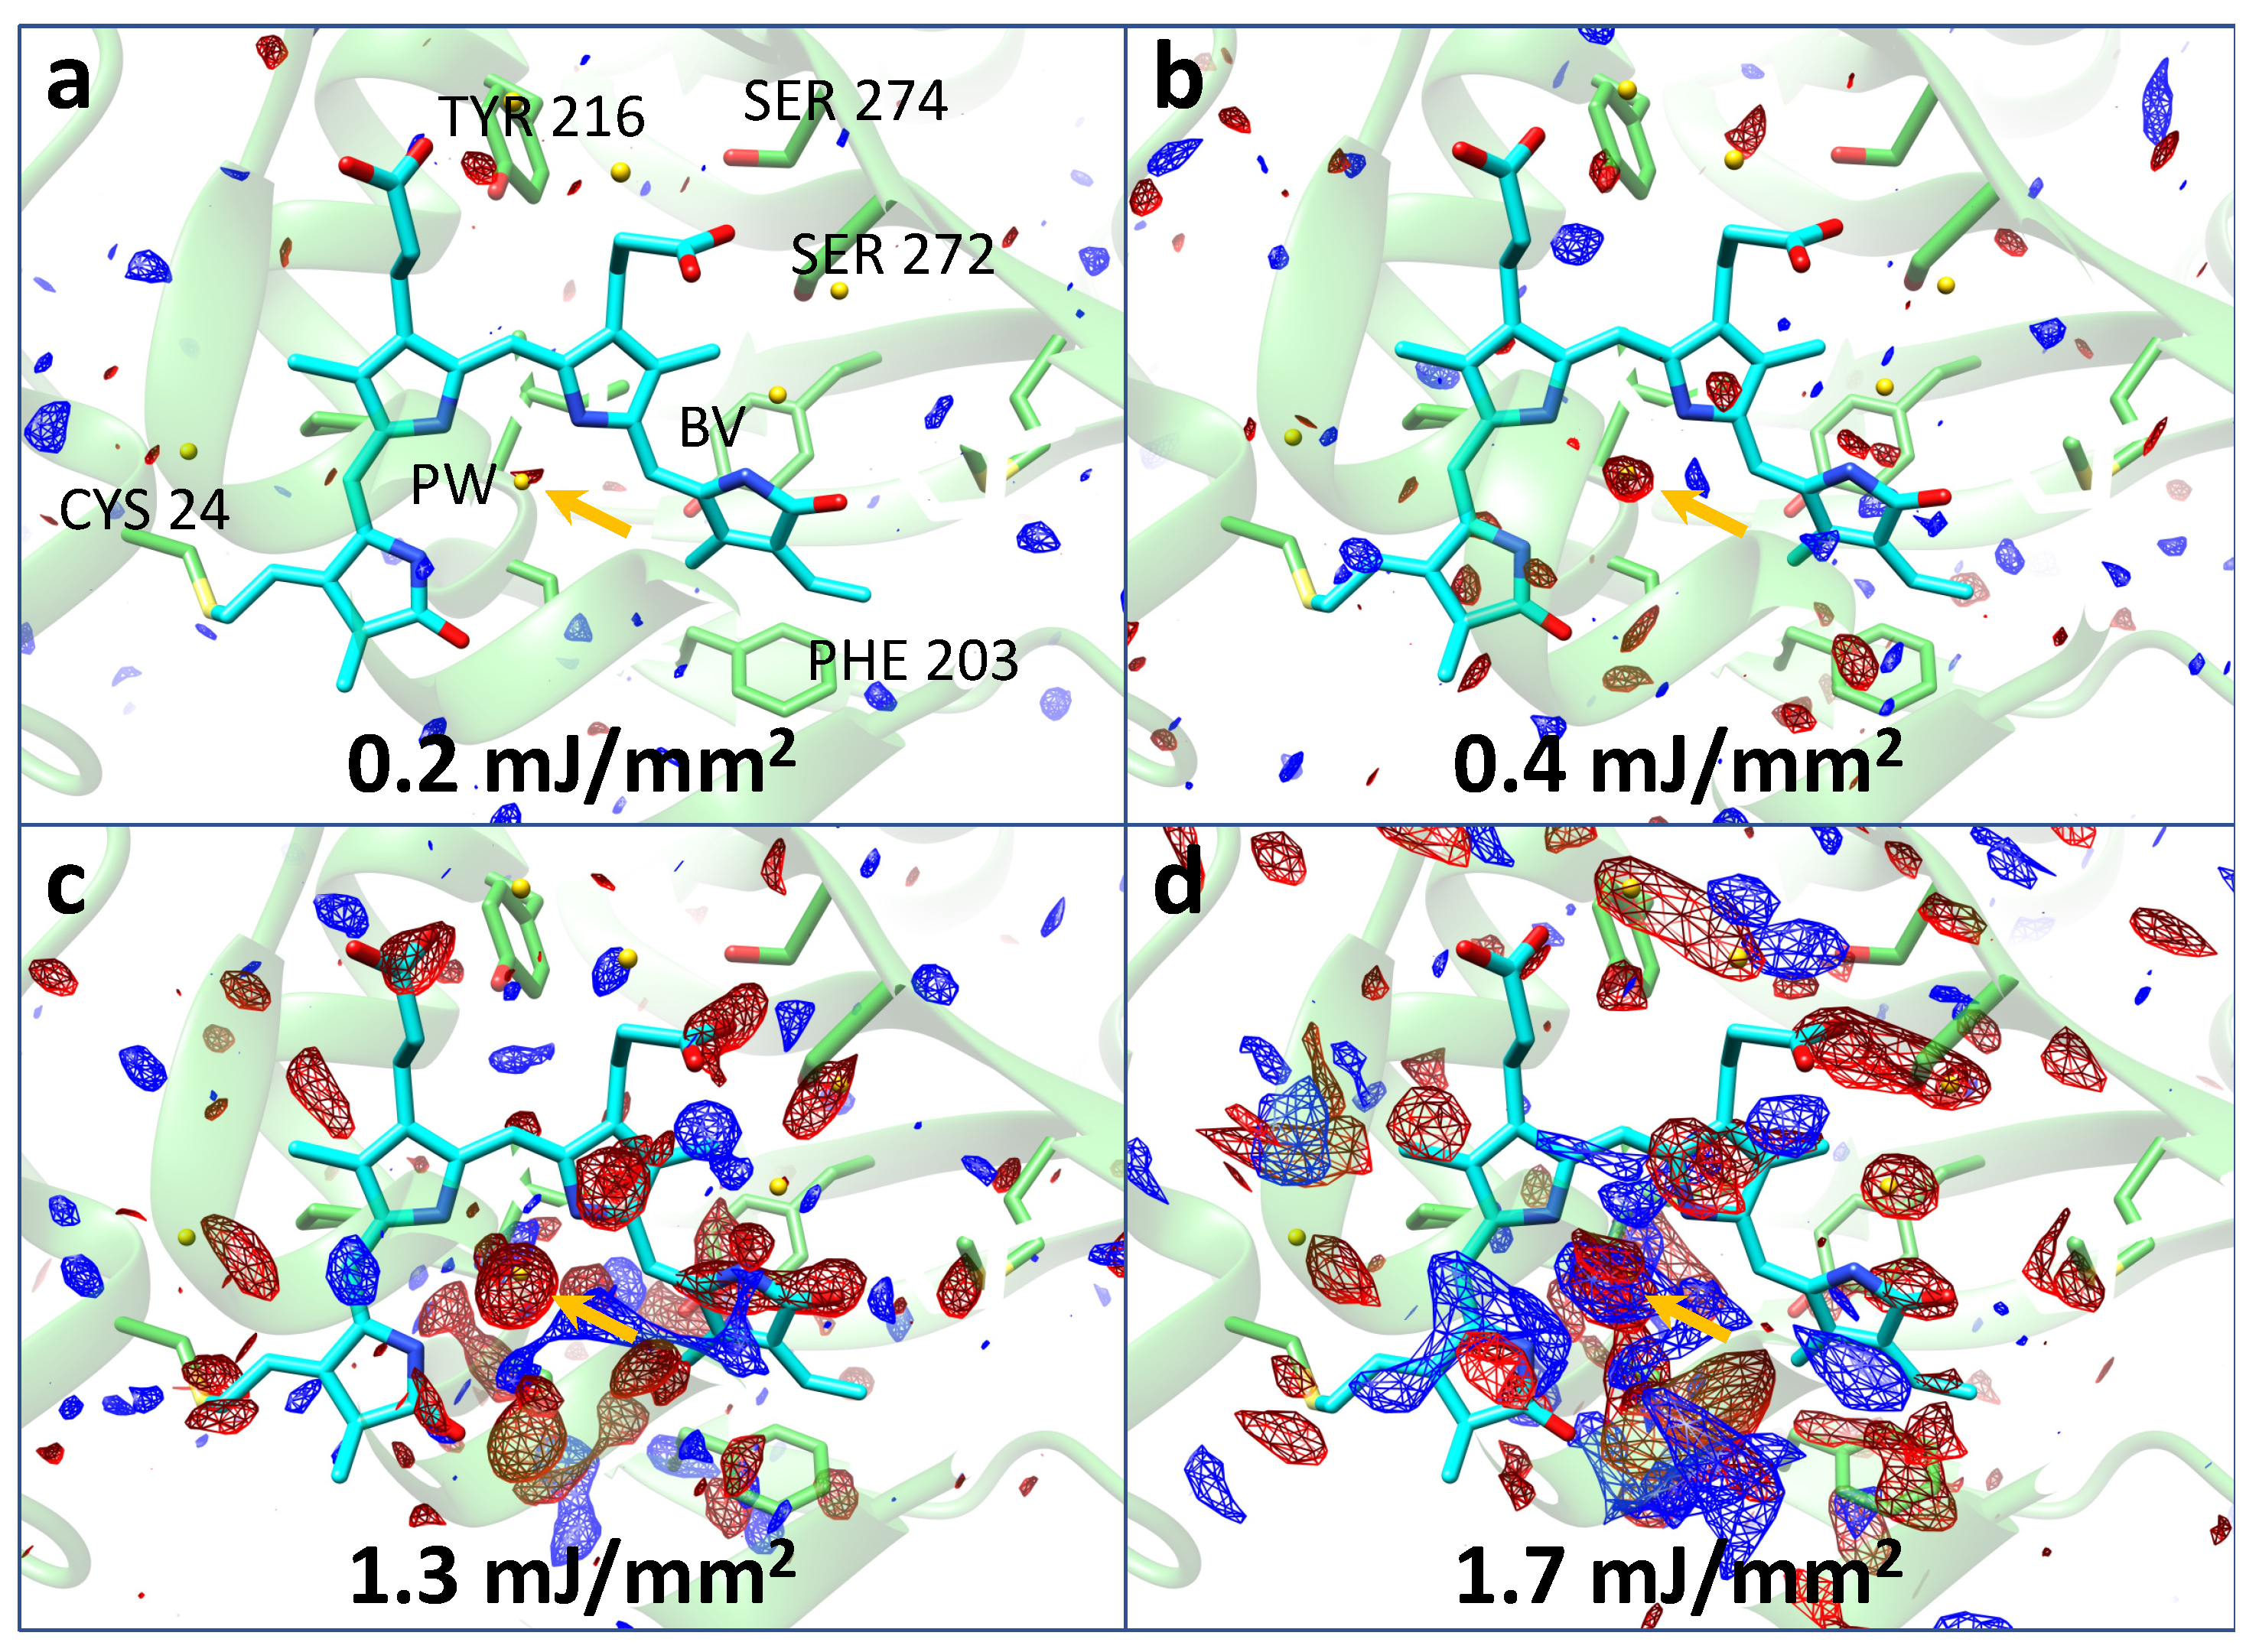
3.1. Injector Systems

The properties of XFEL X-ray pulses have introduced difficult experimental challenges to sample mounting and delivery. The microcrystals have to reach the interaction region fully hydrated in a stabilizing solution (usually called the mother liquor) to maintain their integrity. In addition, the samples need to be replenished fast enough to match the high pulse repetition rate of the XFEL and to transport the crystals damaged by previous X-ray pulses out of the interaction region.
The gas dynamic virtual nozzle (GDVN) was designed specifically to address these issues [33]. It consists of two concentric capillaries. High pressure gas (usually Helium) is passed through the larger capillary, which flows laminarly and coaxially with the microcrystalline liquid slurry extruded from the inner capillary. The coaxial gas stream focuses the liquid jet to a diameter much smaller than the aperture of the inner capillary. The resulting jet diameter is 1–5 μm and depends upon the capillary size and flow rates. Such a small size ensures that the scattering background from the carrier liquid is very low. For pump-probe experiments, jet speeds and laser spot sizes need to be optimized so that the laser-excited volumes move appropriately between the laser pump pulses and the X-ray probe pulses.
Large sample consumption is one of the limitations of the GDVN. The continuous stream at high flow rate leads to a loss of precious samples between the X-ray pulses. To address this problem, high viscosity media such as lipids or mineral oil-based grease media are used [34,35,36]. A particular lipidic phase, the lipidic cubic phase (LCP) has previously been used to grow membrane protein crystals such as G-protein coupled receptors (GPCR) [37]. As the LCP has the consistency of toothpaste, new injectors (often called toothpaste-injectors) were developed to support media like this. Due to the very low flow rates (typically 1–300 nL/min [36]), microcrystal consumption is dramatically reduced. Moreover, this injector works in both vacuum and at ambient pressure. Various other alternative techniques have been developed such as fixed target scanning [38], electrospinning [39], aerosol injectors [40], and double focusing injectors [41]. Due to the relative ease of sample delivery, and the very low scattering background, the GDVN has become the injector of choice for XFEL studies on biological macromolecules. This technology is constantly evolving as scientists are exploring new designs with printing techniques [42,43,44], and drop-on-demand systems [45] for uninterrupted collection of data with minimum background.

3.2. Detectors

To capture the diffraction patterns from the microcrystals, integrating detectors with readout frequencies that match the frequencies of the X-ray pulses generated at the XFEL facilities are required. The Cornell-SLAC Pixel Array Detector (CSPAD) [46], was developed for the LCLS. It can record diffraction images at 120 Hz. This readout rate is sufficient to cope with the X-ray pulse rate at the LCLS. For larger increases in pulse rates, new detectors with increased readout rates are required. The European XFEL (EuXFEL), for example, can deliver X-ray pulses at MHz repetition rates. A new detector called the Adaptive Gain Integrating Pixel Detector (AGIPD) [47] was developed to cope with these large pulse rates. The maximum achievable readout rate of the AGIPD is 3520 Hz [47], which increases the data collection rate by nearly 30 times that of CSPAD.
Similarly, the detectors must cope with a large dynamic range as they need to record a single photon as well as intense Bragg spots at the same time. If the reflection intensities exceed the dynamic range, the detector will either saturate or not be able to collect low-intensity patterns. To address this issue, the detector pixel gain can be controlled. The CSPAD pixels, for example, can be programmed to be either in the high or in the low-gain mode. In the low-gain mode, each pixel can collect about 2700 photons at 8 keV [48] before it saturates. The AGIPD includes a dynamic gain switching amplifier in each pixel. This results in an automatic switch to three distinct gain levels (high/medium/low), depending on the incoming signal. A single photon can be recorded in the high-gain mode. The low-gain mode allows the collection of more than 104 photons at 12 keV [47]. With these advancements in detector technologies, high-quality and accurate datasets can be collected.

4. Time-Resolved Serial Femtosecond Crystallography (TR-SFX)

The first TR-SFX experiment was conducted on the Photosystem I-ferredoxin complex at LCLS [49] with pump-probe delays of 5 µs and 10 µs. The sample crystals were flown in a liquid jet produced by a GDVN [33]. The crystals were excited with an optical pump laser (λ = 532 nm) and then interrogated by 2.0 keV XFEL pulses. The experiment did not result in difference electron density (DED) maps, which are required to determine a light activated structure. In 2014, the first difference electron density map with XFELs data was produced from a TR-SFX study on photoactive yellow protein (PYP) [50] (described below). This experiment showed that TR-SFX at XFELs is feasible. Since then, there have been several pioneering studies on various proteins such as myoglobin [51], bacteriorhodopsin [52,53], Photosystem II [54,55,56,57], phytochrome [58], etc. that show that it is possible to follow cyclic and non-cyclic reactions at the XFEL.

5. Designing Pump-Probe TR-SFX Experiments.

In a pump-probe TR-SFX experiment, photo-reactive microcrystals are excited by the laser and probed by X-ray pulses. A reaction must be initiated rapidly, uniformly, and nondestructively in the crystal [1]. It is very important to activate a large fraction of the molecules without damaging the crystal. The laser power at the sample position must be carefully adjusted. Low power laser pulse will prevent sufficient photo-initiation, whereas high power pulses deposit energy and may damage the crystal [59]. It is advisable to investigate the reaction beforehand by spectroscopy at various pump power densities to determine the appropriate photoexcitation regime. Recently, a pump power titration was performed with phytochrome crystals at the Spring-8 Angstrom Compact free electron laser (SACLA), Japan [58]. The chromophore binding domain (CBD) construct of the Deinococcus radiodurans bacterial phytochrome (DrBphP) was used for this experiment. Microcrystals of the DrBphP CBD were mixed with nuclear grade grease [35] and injected in the air into the X-ray beam using a LCP injector. The reaction within the crystals was initiated using femtosecond laser pulses. Apart from collecting several datasets on the picosecond time regime that helped to visualize the light-initiated reaction of phytochromes for the first time, four more time-resolved datasets were collected using different laser energies. Fluences of 1.7 mJ/mm2, 1.3 mJ/mm2, 0.4 mJ/mm2 and 0.2 mJ/mm2 were used and DED maps were calculated for each laser energy. The signal becomes small at 0.2 mJ/mm2 as shown in Figure 2. However, prominent DED features are still present at similar positions in all fluences. This shows that the higher laser fluences do not alter the result of this experiment and rather, positively contribute to stronger DED maps that can be interpreted more easily.
To study fast reactions and short-lived intermediates, the duration of both the pump and probe pulses needs to be significantly faster than the lifetime of the respective intermediates. To achieve femtosecond time resolution, a reaction must be initiated by femtosecond pump pulses. However, X-ray pulses from XFELs show a substantial temporal jitter of a few hundred femtoseconds [60]. As a result, the time resolution depends on the duration of the laser pump pulse, the X-ray probe pulse, and the jitter. The jitter can be neglected for timepoints much slower than the jitter. For ultrafast time points, the time delay for each X-ray pulse must be determined by measuring the temporal difference between optical laser and X-ray pulses by using a timing tool [9]. As soon as the jitter can be measured, the jitter has a positive impact on the experiment as it automatically distributes the pump-probe time delays through the time range determined by the jitter. Datasets at various time delays can be collected from the same setting.
The relationship between sample flowrate, X-ray focus, X-ray pulse rate, and laser focal spot size determines whether a once-excited microcrystal has been transported out of the X-ray interaction region. The experiment must be designed in such a way that each pulse excites a fresh crystal. For instance, assuming an X-ray focus of 3 μm and a jet velocity of 30 mm/s as is often the case with the LCP injector, a once exposed jet volume should leave the X-ray interaction region by 100 μs not to be exposed again. The spot size of the optical laser pulse is much bigger than the X-ray focus. It takes much longer for a laser-excited sample volume to leave. Similarly, if the duration between X-ray pulses is shorter than 100 μs, the jet has to be significantly faster. An experiment has to be designed accordingly with a fast-enough jet and several X-ray pulses might have to be added in between the laser excitations to ensure that the sample has left.

6. Data Processing: From Diffraction Patterns to Structure Determination in TRX

A complete crystallographic dataset consists of integrated reflection intensities that cover reciprocal space as much as possible (>90%) up to a limiting resolution. During an SFX experiment, a single X-ray pulse produces a single diffraction pattern on the detector. Due to the quasi monochromatic nature of the XFEL radiation, very partial reflection intensities are collected from only a small part of reciprocal space. To reconstruct the integrated intensities that cover the entire reciprocal space, tens of thousands of diffraction patterns must be collected and analyzed properly. If an X-ray pulse hits a microcrystal, an image with Bragg reflection called a “hit” is produced. An SFX experiment produces millions of diffraction patterns comprising both hits and blanks (diffraction patterns without Bragg reflections). Separating hits from the pool of all detector images follows a well-established process and is achieved by software solutions such as CASS [61], Psocake [62,63], Cheetah [64] and others [65]. They also perform preprocessing steps such as background subtraction, electronic noise correction, bad and hot pixel masking, and flag Bragg spots in the diffraction pattern. All processed digital images are stored in files following the hierarchical data format, version 5 (HDF5). An HDF5 file also contains information about experimental parameters that are essential for further processing.

6.1. Indexing and Three-Dimensional Merging of Diffraction Patterns

As a diffraction pattern is obtained from a randomly orientated crystal, all patterns must be indexed independently. This requires specialized software. Among others [66], CrystFEL [67,68,69] is the most widely used. CrystFEL is a suite of programs specifically designed for indexing SFX images. CrystFEL comprises several programs. Indexamajig is used for indexing and integrating the diffraction pattern. For indexing, the orientation of each microcrystal relative to the lab-coordinate system must be determined. Several fast Fourier transform (FFT)-based indexing algorithms such as MOSFLM [70], DirAx [71], XDS [72], asdf [68], and XGandalf [73] are used for this. Intensity and Miller indices of each (partial) Bragg spot, the orientation of the crystal, and unit cell parameters along with several other experimental parameters are determined and stored. Intensities from each diffraction pattern are scaled and merged using the programs partialator or process_hkl. This produces a file that covers reflection intensities in 3D reciprocal space. Finally, compare_hkl and check_hkl are used to calculate the figures of merits of the data.
Some crystals may have indexing ambiguities [74]. These ambiguities need to be resolved before merging the data. The indexing ambiguity usually arises when the symmetry of Bravais lattice is higher than the symmetry of the space group. The crystals with unit cell parameters that have the same length may result in an indexing ambiguity. For example, PYP crystallizes in space group P63. Its two axes, a and b, have the same length but are not symmetry related. The crystal possesses a two-fold indexing ambiguity. Bragg spots are indexed as (hkl) or (khl) based on their position, even though their intensities are not identical and not related by symmetry. An indexing ambiguity may also arise if a unit cell has a diagonal of similar length to one of the cell axes. Therefore, to solve indexing ambiguities, an additional program called ambigator is available.

6.2. Difference Maps and Structure Determination

After a complete intensity dataset is obtained, further calculations can be performed by programs from the Collaborative Computational Project 4 (CCP4) [75]. Structure factor amplitudes are calculated from the intensities. Structure factor amplitudes from a time-resolved experiment are functions of time (t) and space (h, k, and l). At least two datasets are collected: (i) A reference dataset is collected without any reaction initiation and (ii) a time-dependent dataset is collected at time delay ‘∆t’ after the reaction initiation. From these, DED maps are calculated.
To calculate DED maps, the two datasets are scaled. Then, difference amplitudes (∆F) are determined by subtracting the observed structure factor amplitudes of the reference state (Fobs(ref)) from that of the activated state (Fobs(t)) i.e., ∆F = Fobs(t) − Fobs(ref). The DED maps are calculated by using the difference amplitudes (∆F) and phases calculated from the structure of the reference state. It is important to note that meaningful DED maps can only be determined between two isomorphous datasets. Isomorphous DED maps contain both negative and positive electron density features. These features are interpreted by atomic displacements. Negative DED features represent the positions of atoms before the reaction while positive features represent the location of atoms after the reaction. To be chemically meaningful, negative features should only be present on atoms of the reference structure. With DED maps, it is possible to trace small displacements of the order of 0.1 Å [9,50] and detect population transfers of the order of 5% and smaller [58,76].
In a realistic TRX experiment, the population transfer from the dark state to the activated states is usually small of the order of only 5–20% [77]. As a result, a structure cannot be directly refined against the structure factors collected after activation. Therefore, an additional map is created to determine the structure by extrapolating the population transfer to 100%. This map is called an extrapolated electron density (EED) map. Extrapolated structure factors F(ext) = Fcalc(ref) +N·∆F are calculated, where Fcalc(ref) are structure factors calculated from the reference structure, N is a multiplication factor related to the population transfer and ∆F are the observed difference structure amplitudes. To estimate the N, EED maps are determined for different values of N. A characteristic N is established from the EED map where the strong negative electron density feature just vanishes. After N is determined, a molecular model is fitted into the EED map. Once an initial model is obtained, phases of the ∆F can be estimated. The phases are combined with the observed ∆F and phased extrapolated structure factors are determined [5,26]. The final structure is refined in reciprocal space against the phased F(ext).
To check the reliability of the final model, a calculated DED map is determined from calculated difference structure factors. These structure factors are computed by subtracting the calculated structure factors of the reference state from the calculated structure factors of the obtained model (excited state) [15,58,78]. If both the calculated and observed DED maps display the same features, the model is plausible.
Time-dependent DED maps result from the variation in the populations of time-independent, static structures [79]. Each of these structures are associated with intermediate states along the reaction pathway. Generally, multiple intermediates contribute to any point in time. To determine the individual structures, deconvolution of the X-ray data into different constituents is needed. The two main deconvolution methods, as described in the literature, are singular value decomposition (SVD) [6] and cluster analysis [80]. A detailed description of these methods is beyond the scope of this review and we refer to the related literature [6,8,80,81].

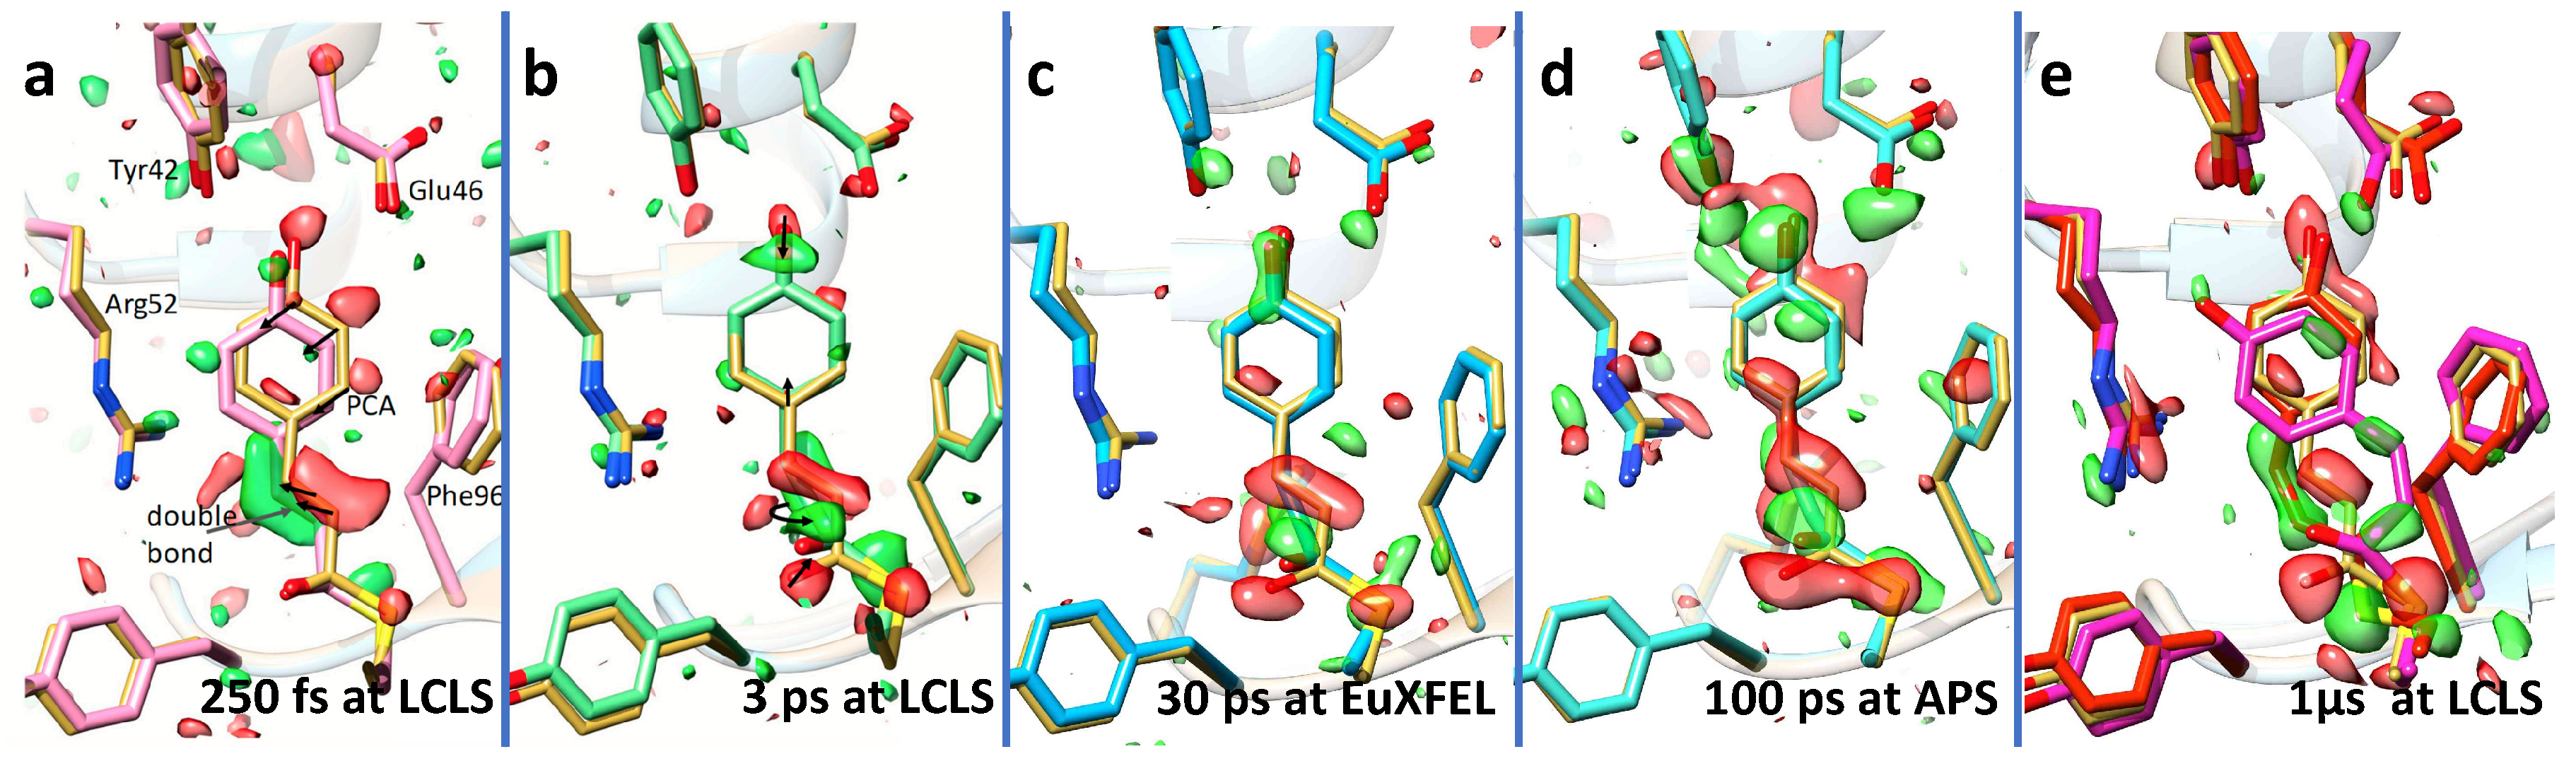
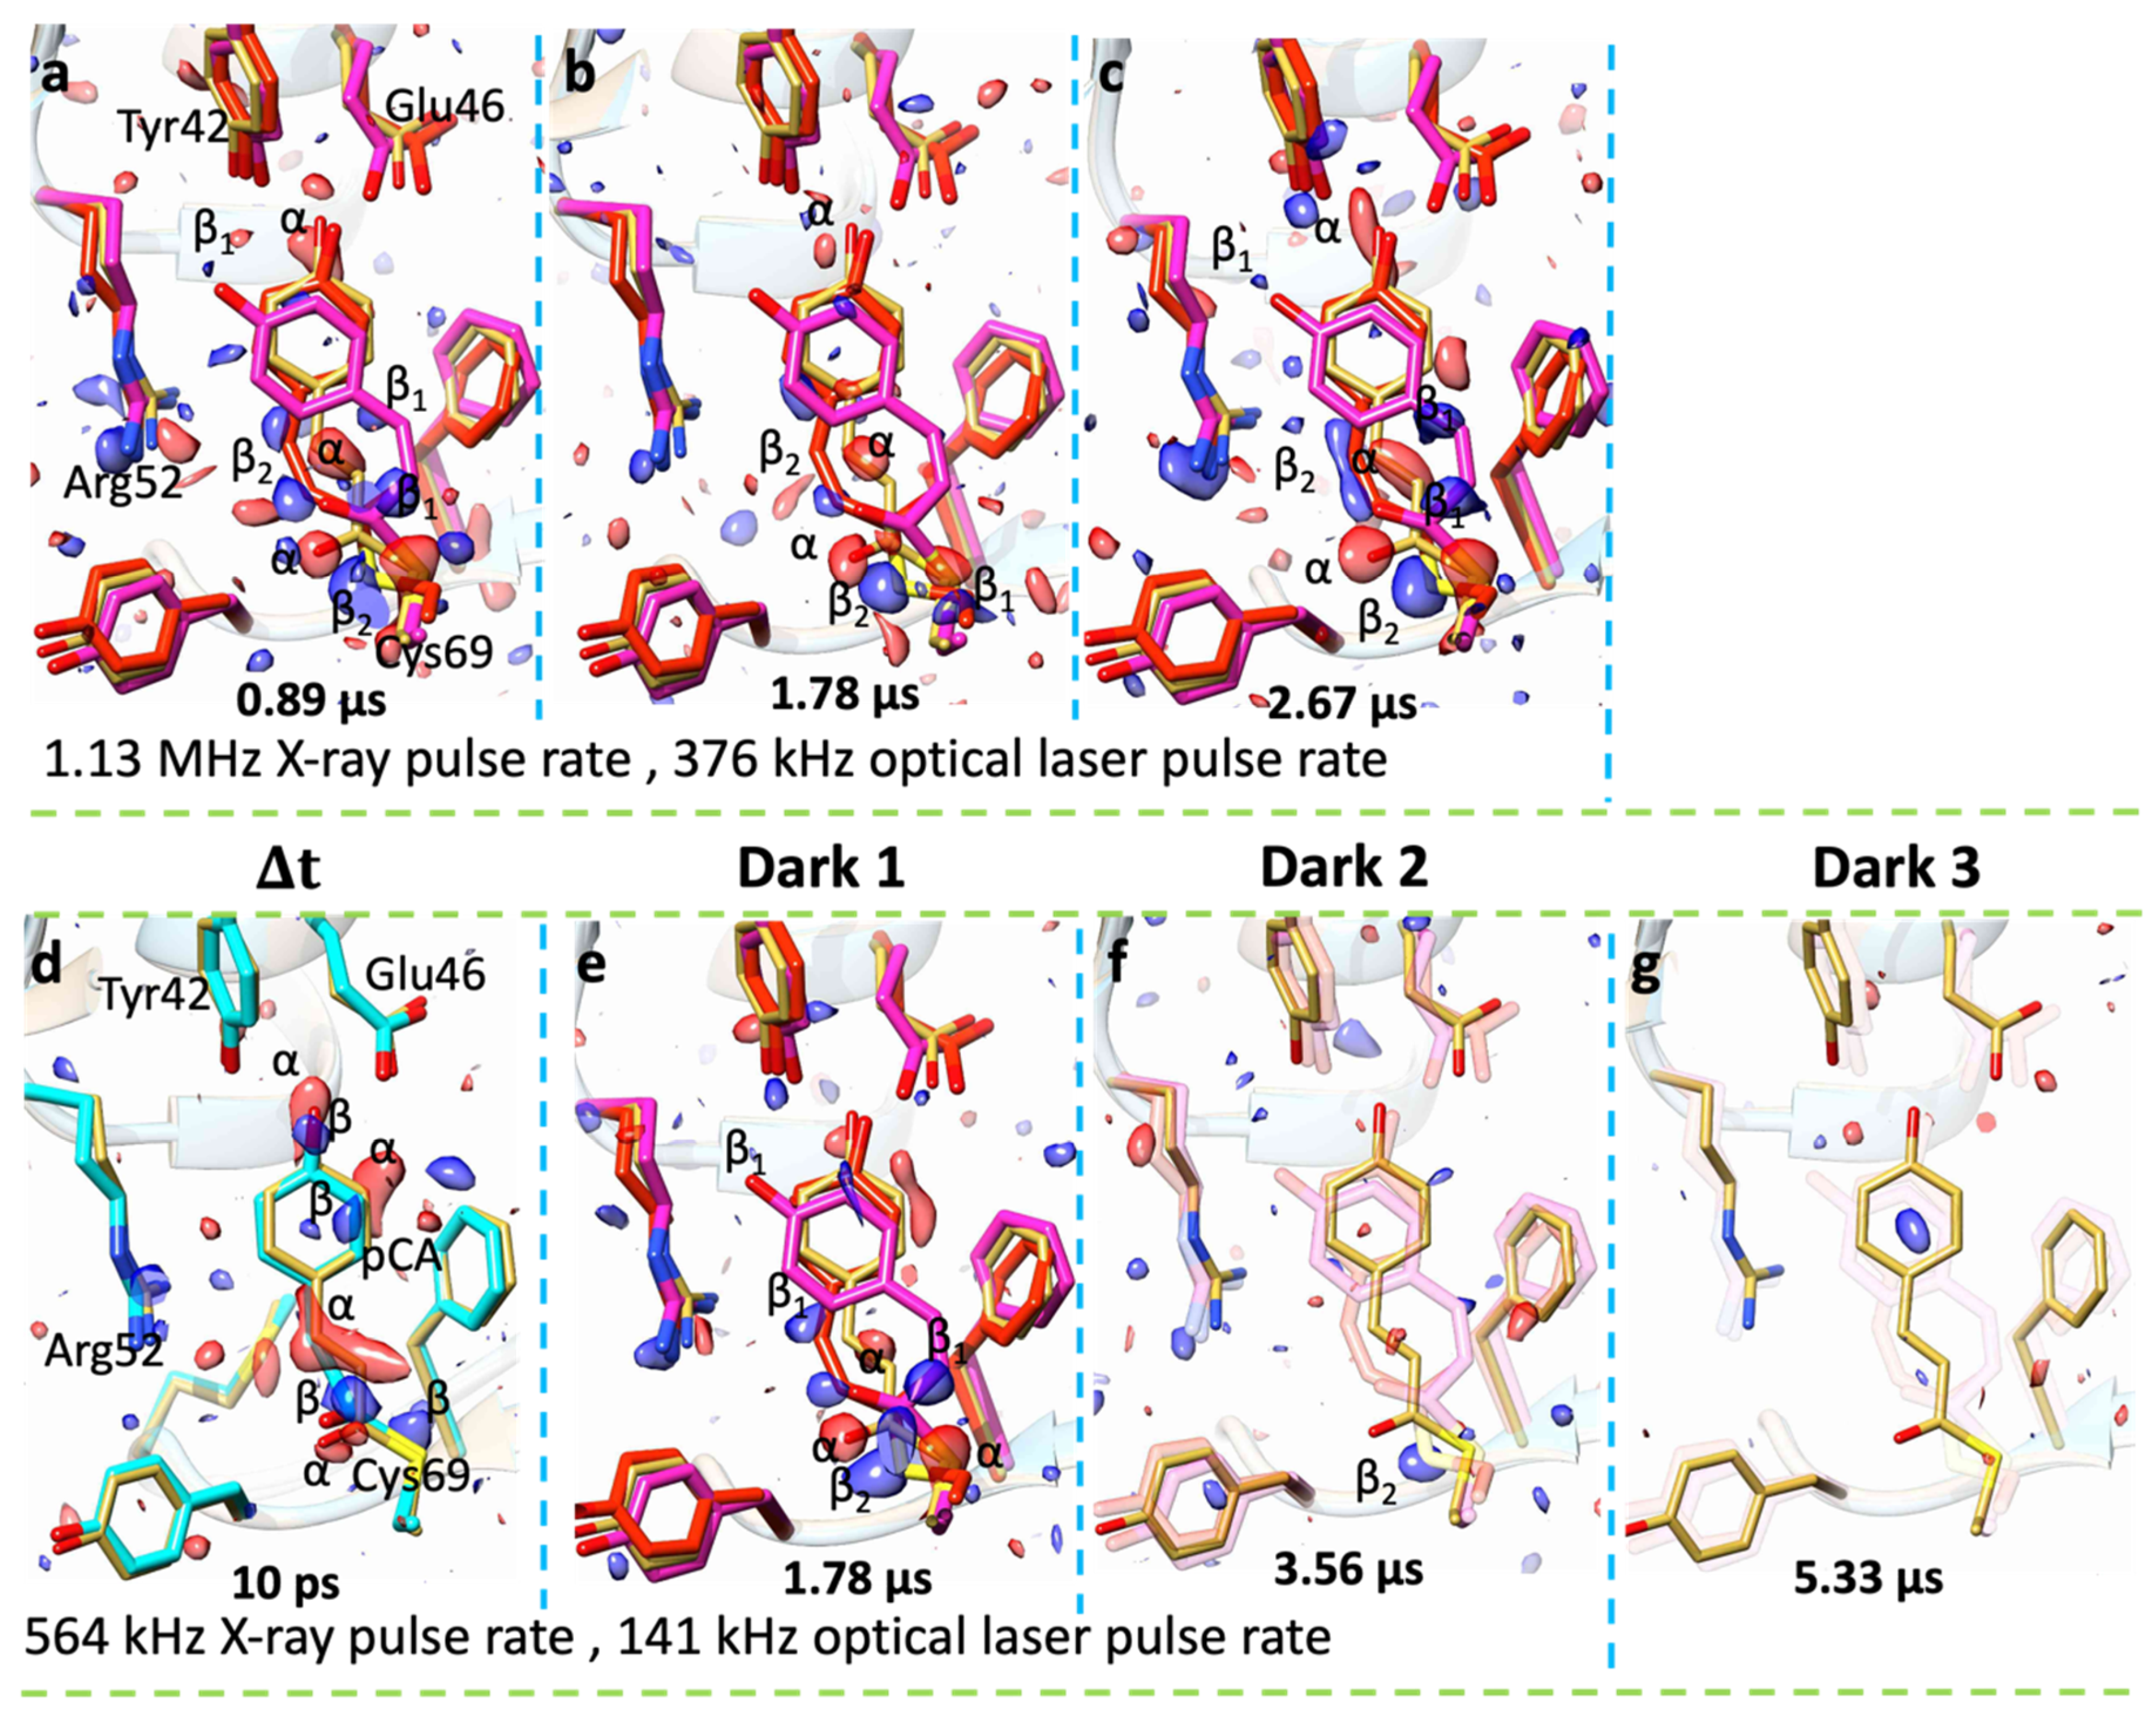
7. TR-SFX on Photoactive Yellow Protein

PYP is a blue-light photoreceptor that was first identified in a purple sulfur bacterium called Halorhodospira halophila [82] (formerly known as Ectothiorhodospira halophila). Blue light is sensed by a central chromophore called para-coumaric acid (pCA). PYP goes through a reversible photocycle where the chromophore first isomerizes from trans to cis and several intermediates are populated on different timescales [83,84]. The mechanism of isomerization is similar to several important photon-driven reactions such as reactions in rhodopsin in the mammalian eye [85,86], and other relevant photoreceptors like the phytochromes [58,87,88]. As a result, PYP is widely studied due to its potential biomedical significance and interesting physiochemical properties [50,83,84,89].
The first TR-SFX experiment on PYP was conducted with the Coherent X-ray Imaging (CXI) instrument at the LCLS in 2014 [50]. An optical nanosecond laser, synchronized with X-ray pulses from the XFEL was used to activate the microcrystals. Two different datasets with time delays of 10 ns and 1 µs were collected. Both time delays resulted in difference electron density maps with exceptionally strong signals (Figure 3e). Subsequently, another experiment on PYP was conducted with a similar experimental setup at LCLS in 2016 [9]. This time, the reaction was initiated using a femtosecond laser. This experiment achieved a time resolution of 140 fs to cover the fs time scale up to 3 ps (Figure 3a,b). A 1.6 Å resolution molecular movie shows the trans-cis isomerization of the central pCA chromophore. The isomerization occurs approximately 600 fs after photoexcitation. Isomerization proceeds through a so-called conical intersection, which is the joint between the electronically excited state potential energy surface (PES) and the electronic ground state PES. PYP is in the electronically excited state between 100 fs and 400 fs, whereas the electronic ground state is recovered beyond 700 fs. Relaxations on both ground and excited state PES are characterized by X-ray structures.
Recently, an additional TR-SFX experiment was conducted on PYP at the newly operational, high repetition rate XFEL, the EuXFEL [78]. The EuXFEL uses superconducting technology to generate unprecedentedly high X-ray pulse rates. X-ray pulses arrive in pulse-trains that contain up to 2700 pulses (final design specification). Pulses within the train repeat with a rate of up to 4.5 MHz. There are 10 trains per second. In the first SFX experiment at EuXFEL with MHz rates, there were only 15 pulses per train yet datasets were successfully collected on several proteins [90]. The number of available pulses increased steadily and 178 pulses/train were available for the PYP TR-SFX experiment.
The aim was to cover the previously unexplored picosecond time range of the photocycle and establish TR-SFX at MHz repetition rate XFEL. Similar to previous PYP TR-SFX experiments at the LCLS, a GDVN was used for sample delivery, and a femtosecond optical laser was used to start the reaction. At first, the experiment was run with an X-ray pulse rate of 1.13 MHz. The optical laser operated with a 376 kHz pulse rate. This resulted in a scheme where the pump-probe sequence and two intermittent X-ray pulses in the dark without laser excitation were repeated as depicted in Figure 1. The two intermitted X-ray pulses correspond to time delays of 1.78 μs and 2.67 μs, respectively. Factoring the optical laser spot size of 42 μm (FWHM) and the sample jet speed of 30 m/s, the excited volume of the sample crystals should leave the X- ray interaction region within 2 μs. The sample probed at 2.67 μs should be free of laser influence although some contamination was still observed (Figure 4a–c). This shows that the excited volume has not left the X-ray interaction region. These problems can be solved by either decreasing the laser spot size or increasing the jet speed. However, these parameters were already at their maximum practical values. Because of this, the X-ray and optical laser repetition rates were reduced to 564 kHz and 141 kHz, respectively, and an extra X-ray pulse was added between each optical laser pulses. With these parameters, only the first of four pulses contribute to the ultrafast time delays. A time delay of 10 ps was set. Consequently, the second, third, and fourth pulses have time delays of 1.78 μs, 3.56 μs, and 5.33 μs, respectively (Figure 4d–g). The DED maps determined with these time delays show that the signal features are present until 3.56 μs. A map produced at 5.33 μs is free of contamination. Finally, two more time points, 30 ps, and 80 ps were collected to complement the 3 ps time point collected at LCLS in 2016 [9] and 100 ps collected at the Argonne Photon Source (APS) in 2013 [24] (Figure 3c,d). DED maps at these time points show that the chromophore is in cis-configuration and relaxes slowly over a long period of time.

8. Biological Relevance of Pump-Probe TR-SFX

Several studies on light sensitive proteins have been performed using pump-probe TR-SFX. The proteins are generally studied either as model systems to test the feasibility of the pump-probe experiments at modern X-ray sources or to answer several biological questions. Pump-probe TR-SFX can increase the understanding of biological and chemical phenomena of very important proteins such as bacteriorhodopsin, cryptochromes, phytochromes, etc. These studies can open new avenues for research in biological molecules. Photosensitive proteins are key to activating and controlling events in optogenetics applications. Several proteins such as channelrhodopsin, bacteriorhodopsin, PYP have been used in optogenetic experiments [91,92]. Small photosensitive protein like PYP can be engineered to develop a fluorogenic probe [93] which provides a method to study the localization, movement, and interactions of proteins in live cells. The functions of bacteriorhodopsin that pump proton when powered by green sunlight can be exploited to generate energy using sunlight [94]. Phytochromes detect light and trigger intracellular signaling cascades, which regulate many light-depended phenomena such as shade avoidance and seed germination in plants [95,96]. When these processes are well understood, it is possible that applications will be found that are very distant from the original physiological role of these molecules. For example, the photo switching phenomena of phytochromes that allows them to switch between two distinct states can be used in the field of nanotechnology [97]. Similarly, there are several other photosensitive proteins with distinct functions that may contribute significantly to microelectronics and material science such as the ability of cryptochromes to sense the magnetic field [98] and the ability of photosystems to generate energy.

9. Outlook

High repetition rate XFELs may enable the collection of a large number of datasets that cover the entire reaction within one shift. With the help of methods like the SVD [6,8,77,99], the structures of intermediates can be determined from time-dependent electron density maps. Reaction pathways and rate coefficients connecting the reaction intermediates can be determined. However, time-resolved changes still need to be revealed for some photosensitive proteins (e.g., phytochromes, photosynthetic reaction center, etc.). For example, in phytochromes, large conformational changes of several tens of Å occur between light and dark-adapted states [88,100,101]. It has to be determined whether the crystalline lattices are compatible with these changes.
Crystallography is an ensemble method as it averages over a large number of molecules. There is a danger that the average structure hides important functional and allosteric molecular mechanisms [102]. The ability to observe one molecule at a time could provide a solution to this. The intense X-ray pulses generated by XFELs can image single biomolecules [103]. With high-repetition rate XFELs, it should be possible to collect a sufficient number of single-particle diffraction patterns to reconstruct the electron density at a moderate atomic resolution [104]. Time-resolved single-particle imaging avoids information loss by ensemble averaging. This might reveal large conformational changes that are not observable by other methods.
The advancement in beamline optics, detectors, and high throughput sample delivery methods have made room-temperature serial crystallography possible also at SR sources. Over the last few years, several serial millisecond crystallography (SMX) experiments have been conducted [105,106,107,108,109] with synchrotron beamlines equipped with high-viscosity (toothpaste) injectors [36]. More recently, a polychromatic (“pink”) beam has also been successfully used with microcrystals [110,111]. The abundance of synchrotron beamtime will facilitate time-resolved investigations on a large number of biological macromolecules in the near future [112,113].

Author Contributions

Conceptualization, S.P. and I.P.; writing—original draft preparation, S.P., I.P. and T.N.M.; writing—review and editing, S.P. and I.P. All authors have read and agreed to the published version of the manuscript.

Funding

This work was funded by BioXFEL STC, grant number NSF-1231306.

Acknowledgments

The authors thank Marius Schmidt for reading and commenting on earlier versions of this manuscript. The authors thank the BioXFEL STC for ongoingsupport.

Conflicts of Interest

The authors declare no conflict of interest.

References

  1. Moffat, K. Time-resolved biochemical crystallography: A mechanistic perspective. Chem. Rev. 2001, 101, 1569–1582. [Google Scholar] [CrossRef] [PubMed]
  2. Schmidt, M. Time-Resolved Crystallography at X-ray Free Electron Lasers and Synchrotron Light Sources. Synchrotron Radiat. News 2015, 28, 25–30. [Google Scholar] [CrossRef]
  3. Bourgeois, D.; Weik, M. Kinetic protein crystallography: A tool to watch proteins in action. Crystallogr. Rev. 2009, 15, 87–118. [Google Scholar] [CrossRef]
  4. Moffat, K.; Henderson, R. Freeze trapping of reaction intermediates. Curr. Opin. Struct. Boil. 1995, 5, 656–663. [Google Scholar] [CrossRef]
  5. Schmidt, M. Structure Based Kinetics by Time-Resolved X-ray Crystallography. In Ultrashort Laser Pulses in Biology and Medicine; Braun, M., Gilch, P.Z.W., Eds.; Springer: Berlin/Heidelberg, Germany, 2008; pp. 201–241. [Google Scholar] [CrossRef]
  6. Schmidt, M.; Rajagopal, S.; Ren, Z.; Moffat, K. Application of Singular Value Decomposition to the Analysis of Time-Resolved Macromolecular X-ray Data. Biophys. J. 2003, 84, 2112–2129. [Google Scholar] [CrossRef] [Green Version]
  7. Ihee, H.; Rajagopal, S.; Srajer, V.; Pahl, R.; Anderson, S.; Schmidt, M.; Schotte, F.; Anfinrud, P.A.; Wulff, M.; Moffat, K. Visualizing reaction pathways in photoactive yellow protein from nanoseconds to seconds. Proc. Natl. Acad. Sci. USA 2005, 102, 7145–7150. [Google Scholar] [CrossRef] [PubMed] [Green Version]
  8. Schmidt, M.; Pahl, R.; Srajer, V.; Anderson, S.; Ren, Z.; Ihee, H.; Rajagopal, S.; Moffat, K. Protein kinetics: Structures of intermediates and reaction mechanism from time-resolved x-ray data. Proc. Natl. Acad. Sci. USA 2004, 101, 4799–4804. [Google Scholar] [CrossRef] [Green Version]
  9. Pande, K.; Hutchison, C.D.M.; Groenhof, G.; Aquila, A.; Robinson, J.S.; Tenboer, J.; Basu, S.; Boutet, S.; DePonte, D.P.; Liang, M.; et al. Femtosecond structural dynamics drives the trans/cis isomerization in photoactive yellow protein. Science 2016, 352, 725–729. [Google Scholar] [CrossRef] [Green Version]
  10. Schmidt, M. Mix and Inject: Reaction Initiation by Diffusion for Time-Resolved Macromolecular Crystallography. Adv. Condens. Matter Phys. 2013, 2013, 1–10. [Google Scholar] [CrossRef] [Green Version]
  11. Calvey, G.D.; Katz, A.M.; Schaffer, C.; Pollack, L. Mixing injector enables time-resolved crystallography with high hit rate at X-ray free electron lasers. Struct. Dyn. 2016, 3, 054301. [Google Scholar] [CrossRef] [Green Version]
  12. Bourgeois, D.; Weik, M. Kinetic protein crystallography using caged compounds. Protein Sci. Encycl. 2008. [Google Scholar] [CrossRef]
  13. Hekstra, D.; White, K.I.; Socolich, M.A.; Henning, R.W.; Srajer, V.; Ranganathan, R. Electric-field-stimulated protein mechanics. Nature 2016, 540, 400–405. [Google Scholar] [CrossRef] [PubMed] [Green Version]
  14. Kupitz, C.; Olmos, J.L.; Holl, M.; Tremblay, L.; Pande, K.; Pandey, S.; Oberthür, M.; Hunter, M.; Liang, M.; Aquila, A.; et al. Structural enzymology using X-ray free electron lasers. Struct. Dyn. 2016, 4, 044003. [Google Scholar] [CrossRef]
  15. Olmos, J.L.; Pandey, S.; Martin-Garcia, J.M.; Calvey, G.; Katz, A.; Knoška, J.; Kupitz, C.; Hunter, M.S.; Liang, M.; Oberthuer, D.; et al. Enzyme intermediates captured “on the fly” by mix-and-inject serial crystallography. BMC Boil. 2018, 16, 59. [Google Scholar] [CrossRef] [Green Version]
  16. Stagno, J.R.; Liu, Y.; Bhandari, Y.R.; Conrad, C.E.; Panja, S.; Swain, M.; Fan, L.; Nelson, G.; Li, C.; Wendel, D.R.; et al. Structures of riboswitch RNA reaction states by mix-and-inject XFEL serial crystallography. Nature 2016, 541, 242–246. [Google Scholar] [CrossRef] [PubMed]
  17. Schmidt, M. Time-Resolved Macromolecular Crystallography at Pulsed X-ray Sources. Int. J. Mol. Sci. 2019, 20, 1401. [Google Scholar] [CrossRef] [Green Version]
  18. Schmidt, M. Reaction Initiation in Enzyme Crystals by Diffusion of Substrate. Crystals 2020, 10, 116. [Google Scholar] [CrossRef] [Green Version]
  19. Ren, Z.; Bourgeois, M.; Helliwell, J.R.; Moffat, K.; Stoddard, B.L.; Srajer, V. Laue crystallography: Coming of age. J. Synchrotron Radiat. 1999, 6, 891–917. [Google Scholar] [CrossRef]
  20. Srajer, V.; Crosson, S.; Schmidt, M.; Key, J.; Schotte, F.; Anderson, S.; Perman, B.; Ren, Z.; Teng, T.; Bourgeois, D.; et al. Extraction of accurate structure-factor amplitudes from Laue data: Wavelength normalization with wiggler and undulator X-ray sources. J. Synchrotron Radiat. 2000, 7, 236–244. [Google Scholar] [CrossRef] [Green Version]
  21. Genick, U.K.; Borgstahl, G.E.O.; Ng, K.; Ren, Z.; Pradervand, C.; Burke, P.M. Structure of a protein photocycle intermediate by millisecond time-resolved crystallography. Science 1997, 275, 1471–1475. [Google Scholar] [CrossRef]
  22. Srajer, V.; Teng, T.-Y.; Ursby, T.; Pradervand, C.; Ren, Z.; Adachi, S.-I.; Schildkamp, W.; Bourgeois, D.; Wulff, M.; Moffat, K. Photolysis of the Carbon Monoxide Complex of Myoglobin: Nanosecond Time-Resolved Crystallography. Science 1996, 274, 1726–1729. [Google Scholar] [CrossRef]
  23. Schotte, F.; Cho, H.S.; Kaila, V.R.I.; Kamikubo, H.; Dashdorj, N.; Henry, E.R.; Graber, T.J.; Henning, R.; Wulff, M.; Hummer, G.; et al. Watching a signaling protein function in real time via 100-ps time-resolved Laue crystallography. Proc. Natl. Acad. Sci. USA 2012, 109, 19256–19261. [Google Scholar] [CrossRef] [PubMed] [Green Version]
  24. Jung, Y.O.; Lee, J.H.; Kim, J.; Schmidt, M.; Moffat, K.; Šrajer, V.; Ihee, H. Volume-conserving trans–cis isomerization pathways in photoactive yellow protein visualized by picosecond X-ray crystallography. Nat. Chem. 2013, 5, 212–220. [Google Scholar] [CrossRef] [PubMed] [Green Version]
  25. Coppens, P.; Vorontsov, I.I.; Graber, T.; Gembicky, M.; Kovalevsky, A. The structure of short-lived excited states of molecular complexes by time-resolved X-ray diffraction. Acta Crystallogr. Sect. A Found. Crystallogr. 2005, 61, 162–172. [Google Scholar] [CrossRef] [PubMed] [Green Version]
  26. Tripathi, S.; Šrajer, V.; Purwar, N.; Henning, R.; Schmidt, M. pH Dependence of the Photoactive Yellow Protein Photocycle Investigated by Time-Resolved Crystallography. Biophys. J. 2012, 102, 325–332. [Google Scholar] [CrossRef] [PubMed] [Green Version]
  27. Šrajer, V.; Ren, Z.; Teng, T.-Y.; Schmidt, M.; Ursby, T.; Bourgeois, M.; Pradervand, C.; Schildkamp, W.; Wulff, M.; Moffat, K. Protein Conformational Relaxation and Ligand Migration in Myoglobin: A Nanosecond to Millisecond Molecular Movie from Time-Resolved Laue X-ray Diffraction. Biochemistry 2001, 40, 13802–13815. [Google Scholar] [CrossRef] [PubMed]
  28. Srajer, V.; Schmidt, M. Watching proteins function with time-resolved x-ray crystallography. J. Phys. D Appl. Phys. 2017, 50, 373001. [Google Scholar] [CrossRef]
  29. Haldrup, K.; Harlang, T.C.B.; Christensen, M.; Dohn, A.O.; Van Driel, T.B.; Kjær, K.S.; Harrit, N.; Vibenholt, J.; Guérin, L.; Wulff, M.; et al. Bond Shortening (1.4 Å) in the Singlet and Triplet Excited States of [Ir2(dimen)4]2+in Solution Determined by Time-Resolved X-ray Scattering. Inorg. Chem. 2011, 50, 9329–9336. [Google Scholar] [CrossRef] [PubMed]
  30. Oang, K.Y.; Kim, K.H.; Jo, J.; Kim, Y.; Kim, J.G.; Kim, J.; Jun, S.; Kim, J.; Ihee, H. Sub-100-ps structural dynamics of horse heart myoglobin probed by time-resolved X-ray solution scattering. Chem. Phys. 2014, 442, 137–142. [Google Scholar] [CrossRef] [PubMed] [Green Version]
  31. Neutze, R.; Wouts, R.; van der Spoel, D.; Weckert, E.; Haidu, J. Potential for biomolecular imaging with femtoscond X-ray pulses. Nature 2000, 406, 752–757. [Google Scholar] [CrossRef] [PubMed]
  32. Gaffney, K.J.; Chapman, H.N. Imaging Atomic Structure and Dynamics with Ultrafast X-ray Scattering. Science 2007, 316, 1444–1448. [Google Scholar] [CrossRef] [PubMed] [Green Version]
  33. DePonte, D.; Weierstall, U.; Schmidt, K.; Warner, J.; Starodub, D.; Spence, J.C.H.; Doak, R.B. Gas dynamic virtual nozzle for generation of microscopic droplet streams. J. Phys. D Appl. Phys. 2008, 41, 195505. [Google Scholar] [CrossRef] [Green Version]
  34. Nogly, P.; Panneels, V.; Nelson, G.; Gati, C.; Kimura, T.; Milne, C.; Milathianaki, D.; Kubo, M.; Wu, W.; Conrad, C.; et al. Lipidic cubic phase injector is a viable crystal delivery system for time-resolved serial crystallography. Acta Crystallogr. Sect. A Found. Adv. 2016, 72, s41–s42. [Google Scholar] [CrossRef]
  35. Sugahara, M.; Nakane, T.; Masuda, T.; Suzuki, M.; Inoue, S.; Song, C.; Tanaka, R.; Nakatsu, T.; Mizohata, E.; Yumoto, F.; et al. Hydroxyethyl cellulose matrix applied to serial crystallography. Sci. Rep. 2017, 7, 703. [Google Scholar] [CrossRef]
  36. Weierstall, U.; James, D.; Wang, C.; White, T.A.; Wang, D.; Liu, W.; Spence, J.C.H.; Doak, R.B.; Nelson, G.; Fromme, P.; et al. Lipidic cubic phase injector facilitates membrane protein serial femtosecond crystallography. Nat. Commun. 2014, 5, 3309. [Google Scholar] [CrossRef]
  37. Liu, W.; Wacker, D.; Gati, C.; Han, G.W.; James, D.; Wang, D.; Nelson, G.; Weierstall, U.; Katritch, V.; Barty, A.; et al. Serial Femtosecond Crystallography of G Protein-Coupled Receptors. Science 2013, 342, 1521–1524. [Google Scholar] [CrossRef] [PubMed] [Green Version]
  38. Hunter, M.S.; Segelke, B.; Messerschmidt, M.; Williams, G.J.; Zatsepin, N.A.; Barty, A.; Benner, W.H.; Carlson, D.B.; Coleman, M.; Graf, A.; et al. Fixed-target protein serial microcrystallography with an X-ray free electron laser. Sci. Rep. 2014, 4, srep06026. [Google Scholar] [CrossRef] [Green Version]
  39. Sierra, R.G.; Laksmono, H.; Kern, J.; Tran, R.; Hattne, J.; Alonso-Mori, R.; Lassalle-Kaiser, B.; Glöckner, C.; Hellmich, J.; Schafer, N.W.; et al. Nanoflow electrospinning serial femtosecond crystallography. Acta Crystallogr. Sect. D Boil. Crystallogr. 2012, 68, 1584–1587. [Google Scholar] [CrossRef]
  40. Liu, P.; Ziemann, P.J.; Kittelson, D.B.; McMurry, P.H. Generating Particle Beams of Controlled Dimensions and Divergence: I. Theory of Particle Motion in Aerodynamic Lenses and Nozzle Expansions. Aerosol Sci. Technol. 1995, 22, 293–313. [Google Scholar] [CrossRef] [Green Version]
  41. Oberthuer, D.; Knoška, J.; Wiedorn, M.O.; Beyerlein, K.R.; Bushnell, D.A.; Kovaleva, E.G.; Heymann, M.; Gumprecht, L.; Kirian, R.A.; Barty, A.; et al. Double-flow focused liquid injector for efficient serial femtosecond crystallography. Sci. Rep. 2017, 7, 44628. [Google Scholar] [CrossRef]
  42. Nelson, G.; Kirian, R.A.; Weierstall, U.; Zatsepin, N.; Faragó, T.; Baumbach, T.; Wilde, F.; Niesler, F.B.P.; Zimmer, B.; Ishigami, I.; et al. Three-dimensional-printed gas dynamic virtual nozzles for X-ray laser sample delivery. Opt. Express 2016, 24, 11515–11530. [Google Scholar] [CrossRef] [PubMed]
  43. Au, A.K.; Huynh, W.; Horowitz, L.F.; Folch, A. 3D-Printed Microfluidics. Angew. Chem. Int. Ed. 2016, 55, 3862–3881. [Google Scholar] [CrossRef] [PubMed]
  44. Echelmeier, A.; Kim, D.; Villarreal, J.C.; Coe, J.; Quintana, S.; Brehm, G.; Egatz-Gomez, A.; Nazari, R.; Sierra, R.G.; Koglin, J.E.; et al. 3D printed droplet generation devices for serial femtosecond crystallography enabled by surface coating. J. Appl. Crystallogr. 2019, 52, 997–1008. [Google Scholar] [CrossRef] [PubMed]
  45. Chen, A.U.; Basaran, O.A. A new method for significantly reducing drop radius without reducing nozzle radius in drop-on-demand drop production. Phys. Fluids 2002, 14. [Google Scholar] [CrossRef]
  46. Hart, P.; Boutet, S.; Carini, G.; Dubrovin, M.; Duda, B.; Fritz, D.; Haller, G.; Herbst, R.; Herrmann, S.; Kenney, C.; et al. The CSPAD megapixel x-ray camera at LCLS. In Proceedings of the Spie Optical Engineering + Applications, San Diego, CA, USA, 12–16 August 2012. [Google Scholar] [CrossRef]
  47. Allahgholi, A.; Becker, J.; Delfs, A.; DiNapoli, R.; Goettlicher, P.; Greiffenberg, D.; Henrich, B.; Hirsemann, H.; Kuhn, M.; Klanner, R.; et al. The Adaptive Gain Integrating Pixel Detector at the European XFEL. J. Synchrotron Radiat. 2019, 26, 74–82. [Google Scholar] [CrossRef] [PubMed] [Green Version]
  48. Blaj, G.; Caragiulo, P.; Carini, G.; Carron, S.; Dragone, A.; Freytag, D.; Haller, G.; Hart, P.; Hasi, J.; Herbst, R.; et al. X-ray detectors at the Linac Coherent Light Source. J. Synchrotron Radiat. 2015, 22, 577–583. [Google Scholar] [CrossRef]
  49. Aquila, A.; Hunter, M.S.; Doak, R.B.; Kirian, R.; Fromme, P.; White, T.A.; Andreasson, J.; Arnlund, D.; Bajt, S.; Barends, T.R.M.; et al. Time-resolved protein nanocrystallography using an X-ray free-electron laser. Opt. Express 2012, 20, 2706–2716. [Google Scholar] [CrossRef]
  50. Tenboer, J.; Basu, S.; Zatsepin, N.; Pande, K.; Milathianaki, D.; Frank, M.; Hunter, M.; Boutet, S.; Williams, G.J.; Koglin, J.E.; et al. Time-resolved serial crystallography captures high-resolution intermediates of photoactive yellow protein. Science 2014, 346, 1242–1246. [Google Scholar] [CrossRef] [Green Version]
  51. Barends, T.R.; Foucar, L.; Ardevol, A.; Nass, K.; Aquila, A.; Botha, S.; Doak, R.B.; Falahati, K.; Hartmann, E.; Hilpert, M.; et al. Direct observation of ultrafast collective motions in CO myoglobin upon ligand dissociation. Science 2015, 350, 445–450. [Google Scholar] [CrossRef] [PubMed]
  52. Nango, E.; Royant, A.; Kubo, M.; Nakane, T.; Wickstrand, C.; Kimura, T.; Tanaka, T.; Tono, K.; Song, C.; Tanaka, R.; et al. A three-dimensional movie of structural changes in bacteriorhodopsin. Science 2016, 354, 1552–1557. [Google Scholar] [CrossRef]
  53. Nogly, P.; Weinert, T.; James, D.; Carbajo, S.; Ozerov, D.; Furrer, A.; Gashi, D.; Borin, V.; Skopintsev, P.; Jaeger, K.; et al. Retinal isomerization in bacteriorhodopsin captured by a femtosecond X-ray laser. Science 2018, 361, eaat0094. [Google Scholar] [CrossRef] [PubMed] [Green Version]
  54. Kern, J.; Alonso-Mori, R.; Tran, R.; Hattne, J.; Gildea, R.; Echols, N.; Glöckner, C.; Hellmich, J.; Laksmono, H.; Sierra, R.G.; et al. Simultaneous Femtosecond X-ray Spectroscopy and Diffraction of Photosystem II at Room Temperature. Science 2013, 340, 491–495. [Google Scholar] [CrossRef] [Green Version]
  55. Kupitz, C.; Basu, S.; Grotjohann, I.; Fromme, R.; Zatsepin, N.A.; Rendek, K.N.; Hunter, M.S.; Shoeman, R.L.; White, T.A.; Wang, D.; et al. Serial time-resolved crystallography of photosystem II using a femtosecond X-ray laser. Nature 2014, 513, 261–265. [Google Scholar] [CrossRef]
  56. Young, I.D.; Ibrahim, M.; Chatterjee, R.; Gul, S.; Fuller, F.D.; Koroidov, S.; Brewster, A.S.; Tran, R.; Alonso-Mori, R.; Kröll, T.; et al. Structure of photosystem II and substrate binding at room temperature. Nature 2016, 540, 453–457. [Google Scholar] [CrossRef] [Green Version]
  57. Michihiro, S.; Fusamichi, A.; Michihiro, S.; Minoru, K.; Yoshiki, N.; Takanori, N. Light-induced structural changes and the site of O=O bond formation in PSII caught by XFEL. Nature 2017. [Google Scholar] [CrossRef]
  58. Claesson, E.; Wahlgren, W.Y.; Takala, H.; Pandey, S.; Castillon, L.; Kuznetsova, V.; Henry, L.; Panman, M.R.; Carrillo, M.; Kübel, J.; et al. The primary structural photoresponse of phytochrome proteins captured by a femtosecond X-ray laser. eLife 2020, 9. [Google Scholar] [CrossRef]
  59. Hutchison, C.D.M.; Kaucikas, M.; Tenboer, J.; Kupitz, C.; Moffat, K.; Schmidt, M.; Van Thor, J.J. Photocycle populations with femtosecond excitation of crystalline photoactive yellow protein. Chem. Phys. Lett. 2016, 654, 63–71. [Google Scholar] [CrossRef] [Green Version]
  60. Glownia, J.M.; Cryan, J.; Andreasson, J.; Belkacem, A.; Berrah, N.; Blaga, C.I.; Bostedt, C.; Bozek, J.; DiMauro, L.F.; Fang, L.; et al. Time-resolved pump-probe experiments at the LCLS. Opt. Express 2010, 18, 17620–17630. [Google Scholar] [CrossRef] [PubMed] [Green Version]
  61. Foucar, L.; Barty, A.; Coppola, N.; Hartmann, R.; Holl, P.; Hoppe, U.; Kassemeyer, S.; Kimmel, N.; Küpper, J.; Scholz, M.; et al. CASS—CFEL-ASG software suite. Comput. Phys. Commun. 2012, 183, 2207–2213. [Google Scholar] [CrossRef]
  62. Yoon, C.H. Psocake: GUI for Making Data Analysis a Piece of Cake. In Handbook on Big Data and Machine Learning in the Physical Sciences; World Scientific: Singapore, 2020; pp. 169–178. [Google Scholar]
  63. Shin, H.; Kim, S.; Yoon, C.H. Data Analysis using Psocake at PAL-XFEL. J. Korean Phys. Soc. 2018, 73, 16–20. [Google Scholar] [CrossRef]
  64. Barty, A.; Kirian, R.A.; Maia, F.R.; Hantke, M.; Yoon, C.H.; White, T.A.; Chapman, H.N. Cheetah: Software for high-throughput reduction and analysis of serial femtosecond X-ray diffraction data. J. Appl. Crystallogr. 2014, 47, 1118–1131. [Google Scholar] [CrossRef] [PubMed] [Green Version]
  65. Hadian-Jazi, M.; Messerschmidt, M.; Darmanin, C.; Giewekemeyer, K.; Mancuso, A.P.; Abbey, B. A peak-finding algorithm based on robust statistical analysis in serial crystallography. J. Appl. Crystallogr. 2017, 50, 1705–1715. [Google Scholar] [CrossRef]
  66. Hattne, J.; Echols, N.; Tran, R.; Kern, J.; Gildea, R.; Brewster, A.S.; Alonso-Mori, R.; Glöckner, C.; Hellmich, J.; Laksmono, H.; et al. Accurate macromolecular structures using minimal measurements from X-ray free-electron lasers. Nat. Methods 2014, 11, 545–548. [Google Scholar] [CrossRef] [PubMed]
  67. White, T.A.; Kirian, R.; Martin, A.; Aquila, A.; Nass, K.; Barty, A.; Chapman, H.N. CrystFEL: A software suite for snapshot serial crystallography. J. Appl. Crystallogr. 2012, 45, 335–341. [Google Scholar] [CrossRef] [Green Version]
  68. White, T.A.; Mariani, V.; Brehm, W.; Yefanov, O.; Barty, A.; Beyerlein, K.R.; Chervinskii, F.; Galli, L.; Gati, C.; Nakane, T.; et al. Recent developments in CrystFEL. J. Appl. Crystallogr. 2016, 49, 680–689. [Google Scholar] [CrossRef] [PubMed] [Green Version]
  69. White, T.A. Processing serial crystallography data with CrystFEL: A step-by-step guide. Acta Crystallogr. Sect. D Struct. Boil. 2019, 75, 219–233. [Google Scholar] [CrossRef] [Green Version]
  70. Leslie, A.G.W. The integration of macromolecular diffraction data. Acta Crystallogr. Sect. D Boil. Crystallogr. 2005, 62, 48–57. [Google Scholar] [CrossRef]
  71. Duisenberg, A.J.M. Indexing in single-crystal diffractometry with an obstinate list of reflections. J. Appl. Crystallogr. 1992, 25, 92–96. [Google Scholar] [CrossRef]
  72. Kabsch, W. Integration, scaling, space-group assignment and post-refinement. Acta Crystallogr. Sect. D Boil. Crystallogr. 2010, 66, 133–144. [Google Scholar] [CrossRef] [Green Version]
  73. Gevorkov, Y.; Yefanov, O.; Barty, A.; White, T.A.; Mariani, V.; Brehm, W.; Tolstikova, A.; Grigat, R.-R.; Chapman, H.N. XGANDALF—Extended gradient descent algorithm for lattice finding. Acta Crystallogr. Sect. A Found. Adv. 2019, 75, 694–704. [Google Scholar] [CrossRef] [Green Version]
  74. Brehm, W.; Diederichs, K. Breaking the indexing ambiguity in serial crystallography. Acta Crystallogr. Sect. D Boil. Crystallogr. 2013, 70, 101–109. [Google Scholar] [CrossRef] [PubMed] [Green Version]
  75. Winn, M.; Ballard, C.C.; Cowtan, K.D.; Dodson, E.J.; Emsley, P.; Evans, P.R.; Keegan, R.M.; Krissinel, E.B.; Leslie, A.G.W.; McCoy, A.; et al. Overview of theCCP4 suite and current developments. Acta Crystallogr. Sect. D Boil. Crystallogr. 2011, 67, 235–242. [Google Scholar] [CrossRef] [PubMed] [Green Version]
  76. Drenth, J.; Mesters, J. Principles of Protein X-ray Crystallography, 3rd ed.; Springer Science & Business Media: Berlin, Germany, 2007. [Google Scholar] [CrossRef]
  77. Schmidt, M.; Šrajer, V.; Henning, R.; Ihee, H.; Purwar, N.; Tenboer, J.; Tripathi, S. Protein energy landscapes determined by five-dimensional crystallography. Acta Crystallogr. Sect. D Boil. Crystallogr. 2013, 69, 2534–2542. [Google Scholar] [CrossRef] [PubMed]
  78. Pandey, S.; Bean, R.; Sato, T.; Poudyal, I.; Bielecki, J.; Villarreal, J.C.; Yefanov, O.; Mariani, V.; White, T.; Kupitz, C.; et al. Time-resolved serial femtosecond crystallography at the European XFEL. Nat. Methods 2019, 17, 73–78. [Google Scholar] [CrossRef]
  79. Moffat, K. Time-resolved crystallography and protein design: Signalling photoreceptors and optogenetics. Philos. Trans. R. Soc. B Boil. Sci. 2014, 369, 20130568. [Google Scholar] [CrossRef] [Green Version]
  80. Kostov, K.S.; Moffat, K. Cluster Analysis of Time-Dependent Crystallographic Data: Direct Identification of Time-Independent Structural Intermediates. Biophys. J. 2011, 100, 440–449. [Google Scholar] [CrossRef] [Green Version]
  81. Rajagopal, S.; Anderson, S.; Šrajer, V.; Schmidt, M.; Pahl, R.; Moffat, K. A Structural Pathway for Signaling in the E46Q Mutant of Photoactive Yellow Protein. Structure 2005, 13, 55–63. [Google Scholar] [CrossRef] [Green Version]
  82. Meyer, T. Isolation and characterization of soluble cytochromes, ferredoxins and other chromophoric proteins from the halophilic phototrophic bacterium Ectothiorhodospira halophila. Biochim. Biophys. Acta Bioenerg. 1985, 806, 175–183. [Google Scholar] [CrossRef]
  83. Purwar, N.; Tenboer, J.; Tripathi, S.; Schmidt, M. Spectroscopic Studies of Model Photo-Receptors: Validation of a Nanosecond Time-Resolved Micro-Spectrophotometer Design Using Photoactive Yellow Protein and α-Phycoerythrocyanin. Int. J. Mol. Sci. 2013, 14, 18881–18898. [Google Scholar] [CrossRef] [Green Version]
  84. Schmidt, M. A short history of structure based research on the photocycle of photoactive yellow protein. Struct. Dyn. 2017, 4, 032201. [Google Scholar] [CrossRef] [Green Version]
  85. Polli, D.; Altoe, P.; Weingart, O.; Spillane, K.M.; Manzoni, C.; Brida, D.; Tomasello, G.; Orlandi, G.; Kukura, P.; A Mathies, R.; et al. Conical intersection dynamics of the primary photoisomerization event in vision. Nature 2010, 467, 440–443. [Google Scholar] [CrossRef] [PubMed]
  86. Kono, M.; Goletz, P.W.; Crouch, R.K. 11-cis- and All-trans-Retinols Can Activate Rod Opsin: Rational Design of the Visual Cycle. Biochemistry 2008, 47, 7567–7571. [Google Scholar] [CrossRef] [PubMed] [Green Version]
  87. Edlund, P.; Takala, H.; Claesson, E.; Henry, L.; Dods, R.; Lehtivuori, H.; Panman, M.; Pande, K.; White, T.; Nakane, T.; et al. The room temperature crystal structure of a bacterial phytochrome determined by serial femtosecond crystallography. Sci. Rep. 2016, 6, 35279. [Google Scholar] [CrossRef] [PubMed] [Green Version]
  88. Sanchez, J.; Carrillo, M.; Pandey, S.; Noda, M.; Aldama, L.; Feliz, D.; Claesson, E.; Wahlgren, W.Y.; Tracy, G.; Duong, P.; et al. High-resolution crystal structures of a myxobacterial phytochrome at cryo and room temperatures. Struct. Dyn. 2019, 6, 054701. [Google Scholar] [CrossRef] [Green Version]
  89. Hellingwerf, K.; Hendriks, J.; Gensch, T. On the Configurational and Conformational Changes in Photoactive Yellow Protein that Leads to Signal Generation in Ectothiorhodospira halophila. J. Boil. Phys. 2002, 28, 395–412. [Google Scholar] [CrossRef]
  90. Wiedorn, M.O.; Oberthür, M.; Bean, R.; Schubert, R.; Werner, N.; Abbey, B.; Aepfelbacher, M.; Adriano, L.; Allahgholi, A.; Al-Qudami, N.; et al. Megahertz serial crystallography. Nat. Commun. 2018, 9, 4025. [Google Scholar] [CrossRef] [Green Version]
  91. Fenno, L.; Yizhar, O.; Deisseroth, K. The development and application of optogenetics. Annu. Rev. Neurosci. 2011, 34, 389–412. [Google Scholar] [CrossRef]
  92. Ali, A.M.; Reis, J.M.; Xia, Y.; Rashid, A.J.; Mercaldo, V.; Walters, B.J.; Brechun, K.E.; Borisenko, V.; Josselyn, S.A.; Karanicolas, J.; et al. Optogenetic Inhibitor of the Transcription Factor CREB. Chem. Boil. 2015, 22, 1531–1539. [Google Scholar] [CrossRef] [Green Version]
  93. Hori, Y.; Norinobu, T.; Sato, M.; Arita, K.; Shirakawa, M.; Kikuchi, K. Development of Fluorogenic Probes for Quick No-Wash Live-Cell Imaging of Intracellular Proteins. J. Am. Chem. Soc. 2013, 135, 12360–12365. [Google Scholar] [CrossRef]
  94. Haupts, U.; Tittor, J.; Oesterhelt, D. CLOSING IN ON BACTERIORHODOPSIN: Progress in Understanding the Molecule. Annu. Rev. Biophys. Biomol. Struct. 1999, 28, 367–399. [Google Scholar] [CrossRef] [Green Version]
  95. Bae, G.; Choi, G. Decoding of Light Signals by Plant Phytochromes and Their Interacting Proteins. Annu. Rev. Plant Boil. 2008, 59, 281–311. [Google Scholar] [CrossRef] [PubMed] [Green Version]
  96. Hughes, J. Phytochrome Cytoplasmic Signaling. Annu. Rev. Plant Boil. 2013, 64, 377–402. [Google Scholar] [CrossRef]
  97. Molecular Devices and Machines: Concepts and Perspectives for the Nanoworld. Nano Today 2008, 3, 47. [CrossRef]
  98. Gegear, R.J.; Casselman, A.; Waddell, S.; Reppert, S.M. Cryptochrome mediates light-dependent magnetosensitivity in Drosophila. Nature 2008, 454, 1014–1018. [Google Scholar] [CrossRef] [PubMed] [Green Version]
  99. Rajagopal, S.; Schmidt, M.; Anderson, S.; Ihee, H.; Moffat, K. Analysis of experimental time-resolved crystallographic data by singular value decomposition. Acta Crystallogr. Sect. D Boil. Crystallogr. 2004, 60, 860–871. [Google Scholar] [CrossRef]
  100. Burgie, E.S.; Zhang, J.; Vierstra, R.D. Crystal Structure of Deinococcus Phytochrome in the Photoactivated State Reveals a Cascade of Structural Rearrangements during Photoconversion. Structure 2016, 24, 448–457. [Google Scholar] [CrossRef] [PubMed] [Green Version]
  101. Woitowich, N.C.; Halavaty, A.S.; Waltz, P.; Kupitz, C.; Valera, J.; Tracy, G.; Gallagher, K.D.; Claesson, E.; Nakane, T.; Pandey, S.; et al. Structural basis for light control of cell development revealed by crystal structures of a myxobacterial phytochrome. IUCrJ 2018, 5, 619–634. [Google Scholar] [CrossRef] [Green Version]
  102. Kruschel, D.; Zagrovic, B. Conformational averaging in structural biology: Issues, challenges and computational solutions. Mol. BioSyst. 2009, 5, 1606–1616. [Google Scholar] [CrossRef]
  103. Hosseinizadeh, A.; Mashayekhi, G.; Copperman, J.; Schwander, P.; Dashti, A.; Sepehr, R.; Fung, R.; Schmidt, M.; Yoon, C.H.; Hogue, B.G.; et al. Conformational landscape of a virus by single-particle X-ray scattering. Nat. Methods 2017, 14, 877–881. [Google Scholar] [CrossRef]
  104. Poudyal, I.; Schmidt, M.; Schwander, P. Single-particle imaging by x-ray free-electron lasers—How many snapshots are needed? Struct. Dyn. 2020, 7, 024102. [Google Scholar] [CrossRef]
  105. Botha, S.; Nass, K.; Barends, T.R.M.; Kabsch, W.; Latz, B.; Dworkowski, F.; Foucar, L.; Panepucci, E.; Wang, M.; Shoeman, R.L.; et al. Room-temperature serial crystallography at synchrotron X-ray sources using slowly flowing free-standing high-viscosity microstreams. Acta Crystallogr. Sect. D Boil. Crystallogr. 2015, 71, 387–397. [Google Scholar] [CrossRef] [PubMed] [Green Version]
  106. Nogly, P.; James, D.; Wang, D.; White, T.A.; Zatsepin, N.; Shilova, A.; Nelson, G.; Liu, H.; Johansson, L.; Heymann, M.; et al. Lipidic cubic phase serial millisecond crystallography using synchrotron radiation. IUCrJ 2015, 2, 168–176. [Google Scholar] [CrossRef] [PubMed]
  107. Martin-Garcia, J.M.; Conrad, C.E.; Nelson, G.; Stander, N.; Zatsepin, N.; Zook, J.; Zhu, L.; Geiger, J.; Chun, E.; Kissick, D.; et al. Serial millisecond crystallography of membrane and soluble protein microcrystals using synchrotron radiation. IUCrJ 2017, 4, 439–454. [Google Scholar] [CrossRef]
  108. Weinert, T.; Olieric, N.; Cheng, R.; Brünle, S.; James, D.; Ozerov, D.; Gashi, D.; Vera, L.; Marsh, M.; Jaeger, K.; et al. Serial millisecond crystallography for routine room-temperature structure determination at synchrotrons. Nat. Commun. 2017, 8, 542. [Google Scholar] [CrossRef] [PubMed]
  109. Berntsen, P.; Jazi, M.H.; Kusel, M.; Martin, A.V.; Ericsson, T.; Call, M.E.; Trenker, R.; Roque, F.G.; Darmanin, C.; Abbey, B. The serial millisecond crystallography instrument at the Australian Synchrotron incorporating the “Lipidico” injector. Rev. Sci. Instrum. 2019, 90, 085110. [Google Scholar] [CrossRef] [PubMed]
  110. Meents, A.; Wiedorn, M.O.; Srajer, V.; Henning, R.; Sarrou, I.; Bergtholdt, J.; Barthelmess, M.; Reinke, P.Y.A.; Dierksmeyer, D.; Tolstikova, A.; et al. Pink-beam serial crystallography. Nat. Commun. 2017, 8, 1281. [Google Scholar] [CrossRef] [Green Version]
  111. Martin-Garcia, J.M.; Zhu, L.; Mendez, D.; Lee, M.-Y.; Chun, E.; Li, C.; Hu, H.; Subramanian, G.; Kissick, D.; Ogata, C.; et al. High-viscosity injector-based pink-beam serial crystallography of microcrystals at a synchrotron radiation source. IUCrJ 2019, 6, 412–425. [Google Scholar] [CrossRef] [Green Version]
  112. Schulz, E.C.; Mehrabi, P.; Müller-Werkmeister, H.M.; Tellkamp, F.; Jha, A.; Stuart, W.; Persch, E.; De Gasparo, R.; Diederich, F.; Pai, E.F.; et al. The hit-and-return system enables efficient time-resolved serial synchrotron crystallography. Nat. Methods 2018, 15, 901–904. [Google Scholar] [CrossRef] [Green Version]
  113. Mehrabi, P.; Schulz, E.C.; Agthe, M.; Horrell, S.; Bourenkov, G.; Von Stetten, D.; Leimkohl, J.-P.; Schikora, H.; Schneider, T.R.; Pearson, A.R.; et al. Liquid application method for time-resolved analyses by serial synchrotron crystallography. Nat. Methods 2019, 16, 979–982. [Google Scholar] [CrossRef]
Figure 1. Setup of a pump-probe time-resolved serial femtosecond crystallography (TR-SFX) experiment. Crystalline biomolecules are injected into the X-ray interaction region. The injected crystals are activated by optical laser pulses (red) and then probed by X-ray pulses (blue). Diffraction patterns with Bragg’s reflection (red small boxes) are collected by a detector. The blue box (top left corner) shows the pulse sequence of a pump-probe experiment as a function of time. In this scheme, an optical laser pulse (red bar) initiates the reaction within the crystal and after certain time delays, X-ray pulses (blue bars) probe the reaction. Two X-ray pulses (dark 1 and dark 2) are interleaved between each optical laser activation to allow the once excited crystals to leave the X-ray interaction volume.
Crystals 10 00628 g001
Figure 2. Changes in difference signal as a function of laser fluence. Difference electron density (DED) as observed in the DrBphP chromophore pocket. Blue: positive DED, red: negative DED on the +3 σ /−3 σ contour level. The biliverdin chromophore (BV) is shown in cyan. Important residues (green) near BV are marked. When the excitation fluence is decreased, the signal in DED maps decreases as well (panels ad). The signals are strongest for 1.7 mJ/mm2 (panel d) and are weak at 0.2 mJ/mm2 (panel a) (the golden arrow shows the signal level around the pyrrole water (PW)). Figures reproduced from [58].
Crystals 10 00628 g002
Figure 3. Changes in DED features in chromophore pocket of photoactive yellow protein (PYP) at different time delays after reaction initiation. Green shows positive DED and red shows negative DED contoured at +3 σ and −3 σ respectively. Important residues near p-coumaric acid (pCA) chromophore are marked. Yellow structure: dark (reference) structure. Structures for various time delays after laser excitation are shown with different colors. (a) Pink Structure: Δt = 250 fs as measured at the Linac Coherent Light Source (LCLS). The structure is in the trans configuration. Prominent structure changes are denoted by arrows. (b) Green structure: Δt = 3 ps as collected at the LCLS. The structure is in the cis configuration. Isomerization occurs about the double bond at the chromophore tail (curved arrow) (c) Cyan structure: Δt = 30 ps as collected at the European XFEL (EuXFEL). (d) Cyan structure: Δt = 100 ps as collected at the Argonne Photon Source (APS). The chromophore relaxes slowly after isomerization from 3 ps to 100 ps (e) Δt = 1 µs as collected at the LCLS. The features are interpreted by the mixture of two typical PYP intermediate. Magenta and red represent pR1 and pR2 intermediates respectively. Sources: Panels a–b: Pande et al. 2016 [9], Panel c: Pandey et al. 2019 [78], Panel d: Jung et al. 2013 [24], and Panel e: Tenboer et al. 2014 [50].
Crystals 10 00628 g003
Figure 4. TR-SFX experiment conducted at the EuXFEL. The DED in the chromophore pocket of PYP is shown at various time delays after laser excitation and displayed at contour levels of +3 σ /−3 σ . Important residues around the chromophore are marked. Important DED features are shown: β (positive) and α (negative). Panels (ac): Results with 1.13 MHz X-ray repetition rate and 364 kHz optical pulse rate with a pump-probe sequence and two intermittent X-ray pulses without laser activation in between. (a) Pump-probe delay of 0.89 µs, (b) 1.78 µs after the laser pulse, (c) 2.67 µs after the laser pulse. Panels (dg): Results with 564 kHz X-ray and 141 kHz optical laser pulse rates with a pump-probe sequence and three intermittent X-ray pulses without laser activation in between. (d) Time delay of 10 ps, (e) 1.78 µs after the laser pulse, (f) 3.56 µs after the laser pulse, (g) 5.33 µs after the laser pulse. The DED signal persists until 3.56 µs ( β 2, panel f) and completely vanishes at 5.33 µs (panel g).
Crystals 10 00628 g004

