Article

Synthesis Dependent Structural Magnetic and Electrical Properties of CR-Doped Lead-Free Multiferroic AlFeO3

1
Departement of Chemistry, College of Sciences for Girls-King Khalid University, Abha 62529, Saudi Arabia
2
Laboratoire des Matériaux et de l’Environnement pour le Développement Durable, LR18ES10. 9, Avenue Dr. Zoheir SAFI, 1006 Tunis, Tunisia
*
Author to whom correspondence should be addressed.
Crystals 2020, 10(6), 440; https://doi.org/10.3390/cryst10060440
Submission received: 5 May 2020 / Revised: 17 May 2020 / Accepted: 26 May 2020 / Published: 30 May 2020
(This article belongs to the Section Inorganic Crystalline Materials)

Abstract

:
Polycrystalline samples AlFe0.95Cr0.05O3 synthetized by a solid state (SR) and a co-precipitation (cop) method show an orthorhombic system in space group Pc21n. It was found that, the cation distribution and magnetic ordering vary toughly on the synthesis conditions. We deployed impedance spectroscopy in studying the dielectric behavior of AlFe0.95Cr0.05O3. The significant results of this work are: for both samples, permittivity and dielectric loss are very sensitive to the temperature and frequency variation. The existence of supplementary imperfections and conducting species in AFCr5-s ceramics led to important dielectric permittivity in AFCr5-s. Values of the activation energy determined at low temperature point toward oxygen vacancies motion in slight range, however at high temperature, such a motion turns to long-range one. The dielectric response in case of AFCr5-s was assigned throw complex impedance plots to the grain as well as grain boundary. Conversely, additional individual pores similarly participate to dielectric belongings of AFCr5-cop.

1. Introduction

In recent times, the ABO3 perovskite type oxide materials displaying ferroelectric and ferromagnetic ordering identified as multiferroics materials have extended noteworthy scientific and technological consideration [1,2,3,4]. In such materials, magnetic and electric properties are linked to each other, that promote them to be used in device applications such as sensors, data devices storage, [3,4,5,6]. In this setting, the exploration for single phase magnetoelectric materials that have suitable properties for everyday requests is a noteworthy task for material scientists and physicists. Additionally, lead (Pb) or other heavy metals are deployed in the most single-phase magnetoelectric resources [7,8]. Consequently, for ecological as well as communal healthiness aims, the scientists and companies manufacturing devices that deployment of materials having ferroelectric as well as magnetoelectric properties are progressively attracted in sinking or even, in extreme case, fully excluding the heavy metals from such devices in aim to produce lead-free resources [7].
AlFeO3 (AFO) is a perovskite lead-free material, that crystallize in orthorhombic or in rhombohedral system [9]. The orthorhombic phase (AFO) is built of a dual mixture of cubic and hexagonal closed packing of oxygen ions [9]. This arrangement leads to collinear ferromagnetic structure with magnetic ordering temperature (TN) between 210 and 250 K [10,11]. The asymmetric unit of AlFeO3 has 4 different cations sites that are denoted as Fe1, Fe2, Al1 and Al2. Fe1 and Fe2 are occupied principally by iron however those of Al1 and Al2 are occupied predominately by aluminum ions. These cations are octahedrally coordinated to oxygen except Al1, that have a tetrahedral oxygen environment [12]. Several researchers reported on the AFO synthesis conditions in ceramics and thin films samples as well as its multiferroic properties [13,14,15]. Both, the cation and magnetic ordering depend strongly on the preparation conditions. AFO have a weak magnetoelectric behavior at room temperature. AlFeO3 contains only trivalent metals in the structure like rare earth orthoferrites, making them attractive systems for investigations of isovalent substitutions. In particular, the replacement of Fe3+ by Cr3+ and its effect on structural, magnetic and other properties have been reported [16,17] for rare earth orthoferrites. For example, in the lanthanum orthoferrites, partial replacement of Fe by Cr leads to a reduction in the Neel temperature from 750 K in LaFeO3 to 280 K in LaCrO3. Moreover, Cr doping is one of the most adopted strategies to tailor the dielectric and piezoelectric properties of ferroelectrics for practical applications. It is well known that Cr is effective in decreasing the ageing effect and the dielectric loss; thus, the effect of doping of Cr3+ is that of stabilizing the piezoelectric and dielectric properties [16,17]. Cr-doping of GaFeO3 leads to an increase in the activation energy of conduction, primarily at the grains rendering the material more resistive and hence leading to reduced electrical leakage [18].
In this work we study the magnetic properties, In the present work, we synthesized AlFe0.95Cr0.05O3 by different preparation (solid state reaction and sol-gel) methods and utilize the techniques of X-ray, dielectric measurement, and dc magnetic measurement in order to throw light on the effect Cr substitution and low temperature annealing methods on the structural, magnetic and dielectric properties of Cr-doped AlFeO3.

2. Experimental Section

Polycrystalline AlFe0.95Cr0.05O3 (AFCr5-s) was prepared by the conventional high temperature solid-state route. High purity Al2O3, Cr2O3 (99.99%) and Fe2O3 (99.99%) were mixed in stoichiometric ratio. The mixture was thoroughly mixed and homogenized in agate mortar. The mixture was calcined at 700 °C for 12 h and 1100 °C for 12 h with in between grinding. The calcined powder was pressed into pellets that were sintered at 1300 °C for 12 h with heating and cooling rate of 250 °C/h. At this temperature, the sintering time was optimized to get maximum dense and proper phase AFCr5-s. The ceramic pellets prepared by solid state route will be designated as AFCr5-s in the manuscript onwards. For co-precipitation, stoichiometric amount of Al2O3, Cr(NO3)3 and Fe(NO3)3⋅9H2O were mixed under continuous stirring until, reaching a transparent solution. Al to Fe molar proportion was 1:0.95. The pH of the solution was adjusted to 9 by drop wise addition of NH4OH (1M) solution under vigorous stirring. Afterward the solution was toughly washed with methanol to eliminate the contaminations and precipitates were collected. The obtained precipitation was dehydrated at 120 °C for 4 h. in a second step, the obtained powder was heated at 900 °C for 2 h. the obtained sample will hire after designates as AFCr5-cop. The sample purity was examined by X-ray diffraction (XRD) using CuK radiation in the 2θ range from 15 to 70 at room temperature. The lattice constants parameters of the samples were refined by the FULLPROF program package. Surface morphology and particles size features of the samples was carried out using a JEOL microscope; JSM-6010LA (W-SEM). The dielectric properties in a wide temperature range (160–400) K and for the frequency of 1·107 Hz, were carried out on the Ag-electrode ceramic disks by using a Novocontrol Alpha-A broadband dielectric spectrometer. Temperature was controlled with a 0.1°C device by the Novocontrol Quatro Cryosystem in dry nitrogen atmosphere. The M-versus-H hysteresis curves were measured at 5 K in applied magnetic fields H ranging up to 5 T using a LakeShore VSM 7410 magnetometer.

3. Results and Discussion

3.1. Structural Characterization

The XRD patterns measured at room temperature of AlFe0.95Cr0.05O3(AFCr5-s and AFCr5-cop) are shown in Figure 1.
Both of the samples have an orthorhombic symmetry with space group (Pc21n) no other phases were detected. Compared to AFCr5-s, the XRD peaks of AFCr5-cop were enlarged. The shrinkage of particle size could be at the origin of the widening of the XRD lines.
The lattice parameters are listed in Table 1. The lattice constants a, b and c increase with decreasing annealing temperature. The reduction in particle size relaxes the lattice leading to a cell volume expansion; a similar behavior has been reported for other oxide systems such as GaFeO3 [19].
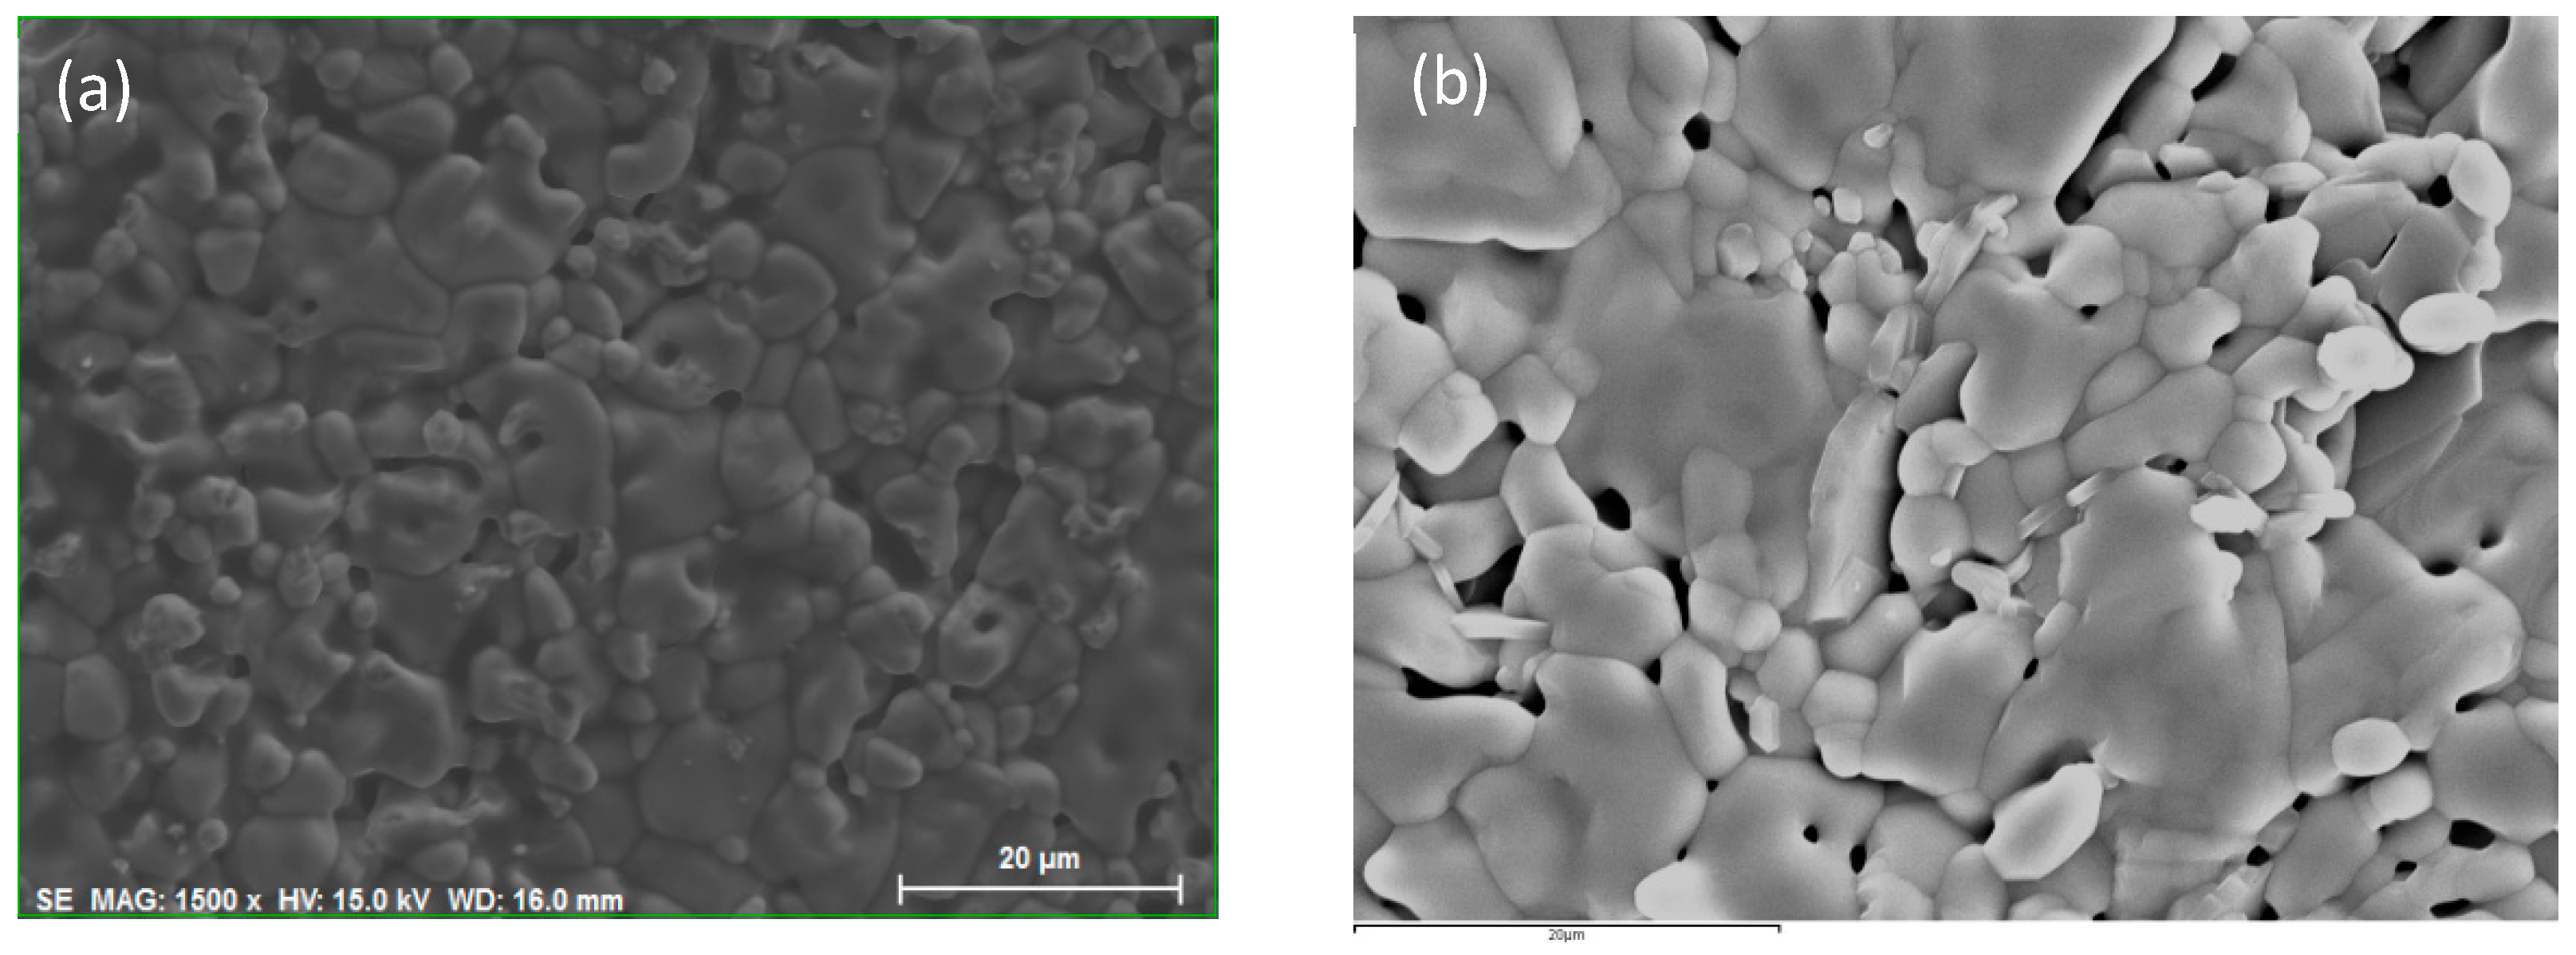
The effect of preparation condition on the microstructures was studied on as sintered samples (crosswise sector of pellets) using SEM is shown in Figure 2. It can be seen for AFCr5-s that the grain and grain boundaries are well established, however, in AFCr5-cop microstructure we can recognize, beside grain and grain boundaries amasses of intra-grain pores. The pore magnitude in AFCr5-cop is around 400 nm. These pores are typically intra-grain ones which are not associated to build pores nets. They ended up inside grains. The grain boundaries breadth is nearly of similar order, in both AFCr5-s and AFCr5-cop. The particle size is 0.8–1.2 μm for AFCr5-s and 0.3–0.6 μm for AFCr5-cop respectively. Pure AFO has non-uniform grains with varying sizes ranging between 1 and 3 μm which becomes smaller with Cr doping.

3.2. Magnetic Properties

Magnetic moment evolution of AFO, AFCr5-s and AFCr5-cop polycrystalline at 5K, by applying an external field (H) up to 50 kOe are depicted in Figure 3.
Altogether samples display hysteresis behavior in the M–H curve, revealing of ferrimagnetism. A close inspection of M-H curves reveals a small pinching that could be described by the occurrence of soft and hard magnetic phases in the samples. Such behavior could be related to the cation sites that have diverse magnetic anisotropic energies. In fact, Al2, Fe1, Fe2 have an octahedral oxygen environment and embrace strong anisotropy. Whereas Al1 has a tetrahedral coordination, with less anisotropic energy [20]. The high anisotropy of the material could be evidenced from the fact, that all samples do not demonstration any saturation up to 50 kOe. The Figure 3 shows hysteresis behavior indicating a weak ferromagnetism. The origin of such weak ferromagnetism in Cr-doped AFO samples could be a result of several reasons. The first possibility may be due to the uncompensated canted spins from the surface and also due to internal canted spin. The compounds of metal oxide and perovskite shows such a canted ferromagnetism such as, BiFeO3 and LaFeO3 [16,17]. The second reason is the super exchange interaction. According to Kanamori-Goodenough (KG) rules [21], the Fe-O-Fe and Cr-O-Cr super exchange interactions are antiferromagnetic, while Cr-O-Fe is predicted to be ferromagnetic. Until now no sign of strong ferromagnetism were observed in bulk samples of Cr substituted AFO, as observed in layered growth of LaCrO3-LaFeO3 [22]. Since, Cr substitutions preferentially favor the Cr-Cr coupling on substitution in the host metal ions and also the randomness of Cr ions in the host lattice site show a weak magnetism [22]. Such behavior of Cr-Cr coupling is observed in Cr-doped LaFeO3 [23].
The values of coercivity (Hc), remnant magnetization (Mr), and the saturation magnetization (Ms) of the materials achieved from the hysteresis curves are depicted in Table 2. The saturation magnetization (Ms) was determined by linear extrapolation of the inverse of the applied field (1/H) to zero. We can recognize that Ms and Mr growth with reducing annealing temperature whereas Hc drops. The coercivity declines due to lower crystallinity, whereas the deviations in magnetic properties such as Ms and Mr are generally linked to the effects of the cationic stoichiometry and their distribution on different sites. If the spin of the substituting ion Cr3+(3μB) aligns through that of Fe3+(5μB) ion at that time the total spin magnetic moment is expected to be reduced by 2μB per formula unit [24].
Commonly Hc is affected by grain magnitude as well as rotation of the domain wall. Conversely, several additional effects could amplify Hc such as surface effects (metal–oxide interchange anisotropy) as well as inside imperfections in the material arrangement that leads to magnetic domain movement restriction. Moreover it was proved that as the particle size increases, there is a decrease in the of Fe–O bond length and Fe–O–Fe bond angle [21]. This decrease in Fe–O distance and Fe–O–Fe bond angle, leads to change in single particle band width of oxygen and iron in AFCr5-s structure. The deviation of such band size induces magnetic exchange variation, and accordingly, the magnetic properties change.

3.3. Dielectric Measurements

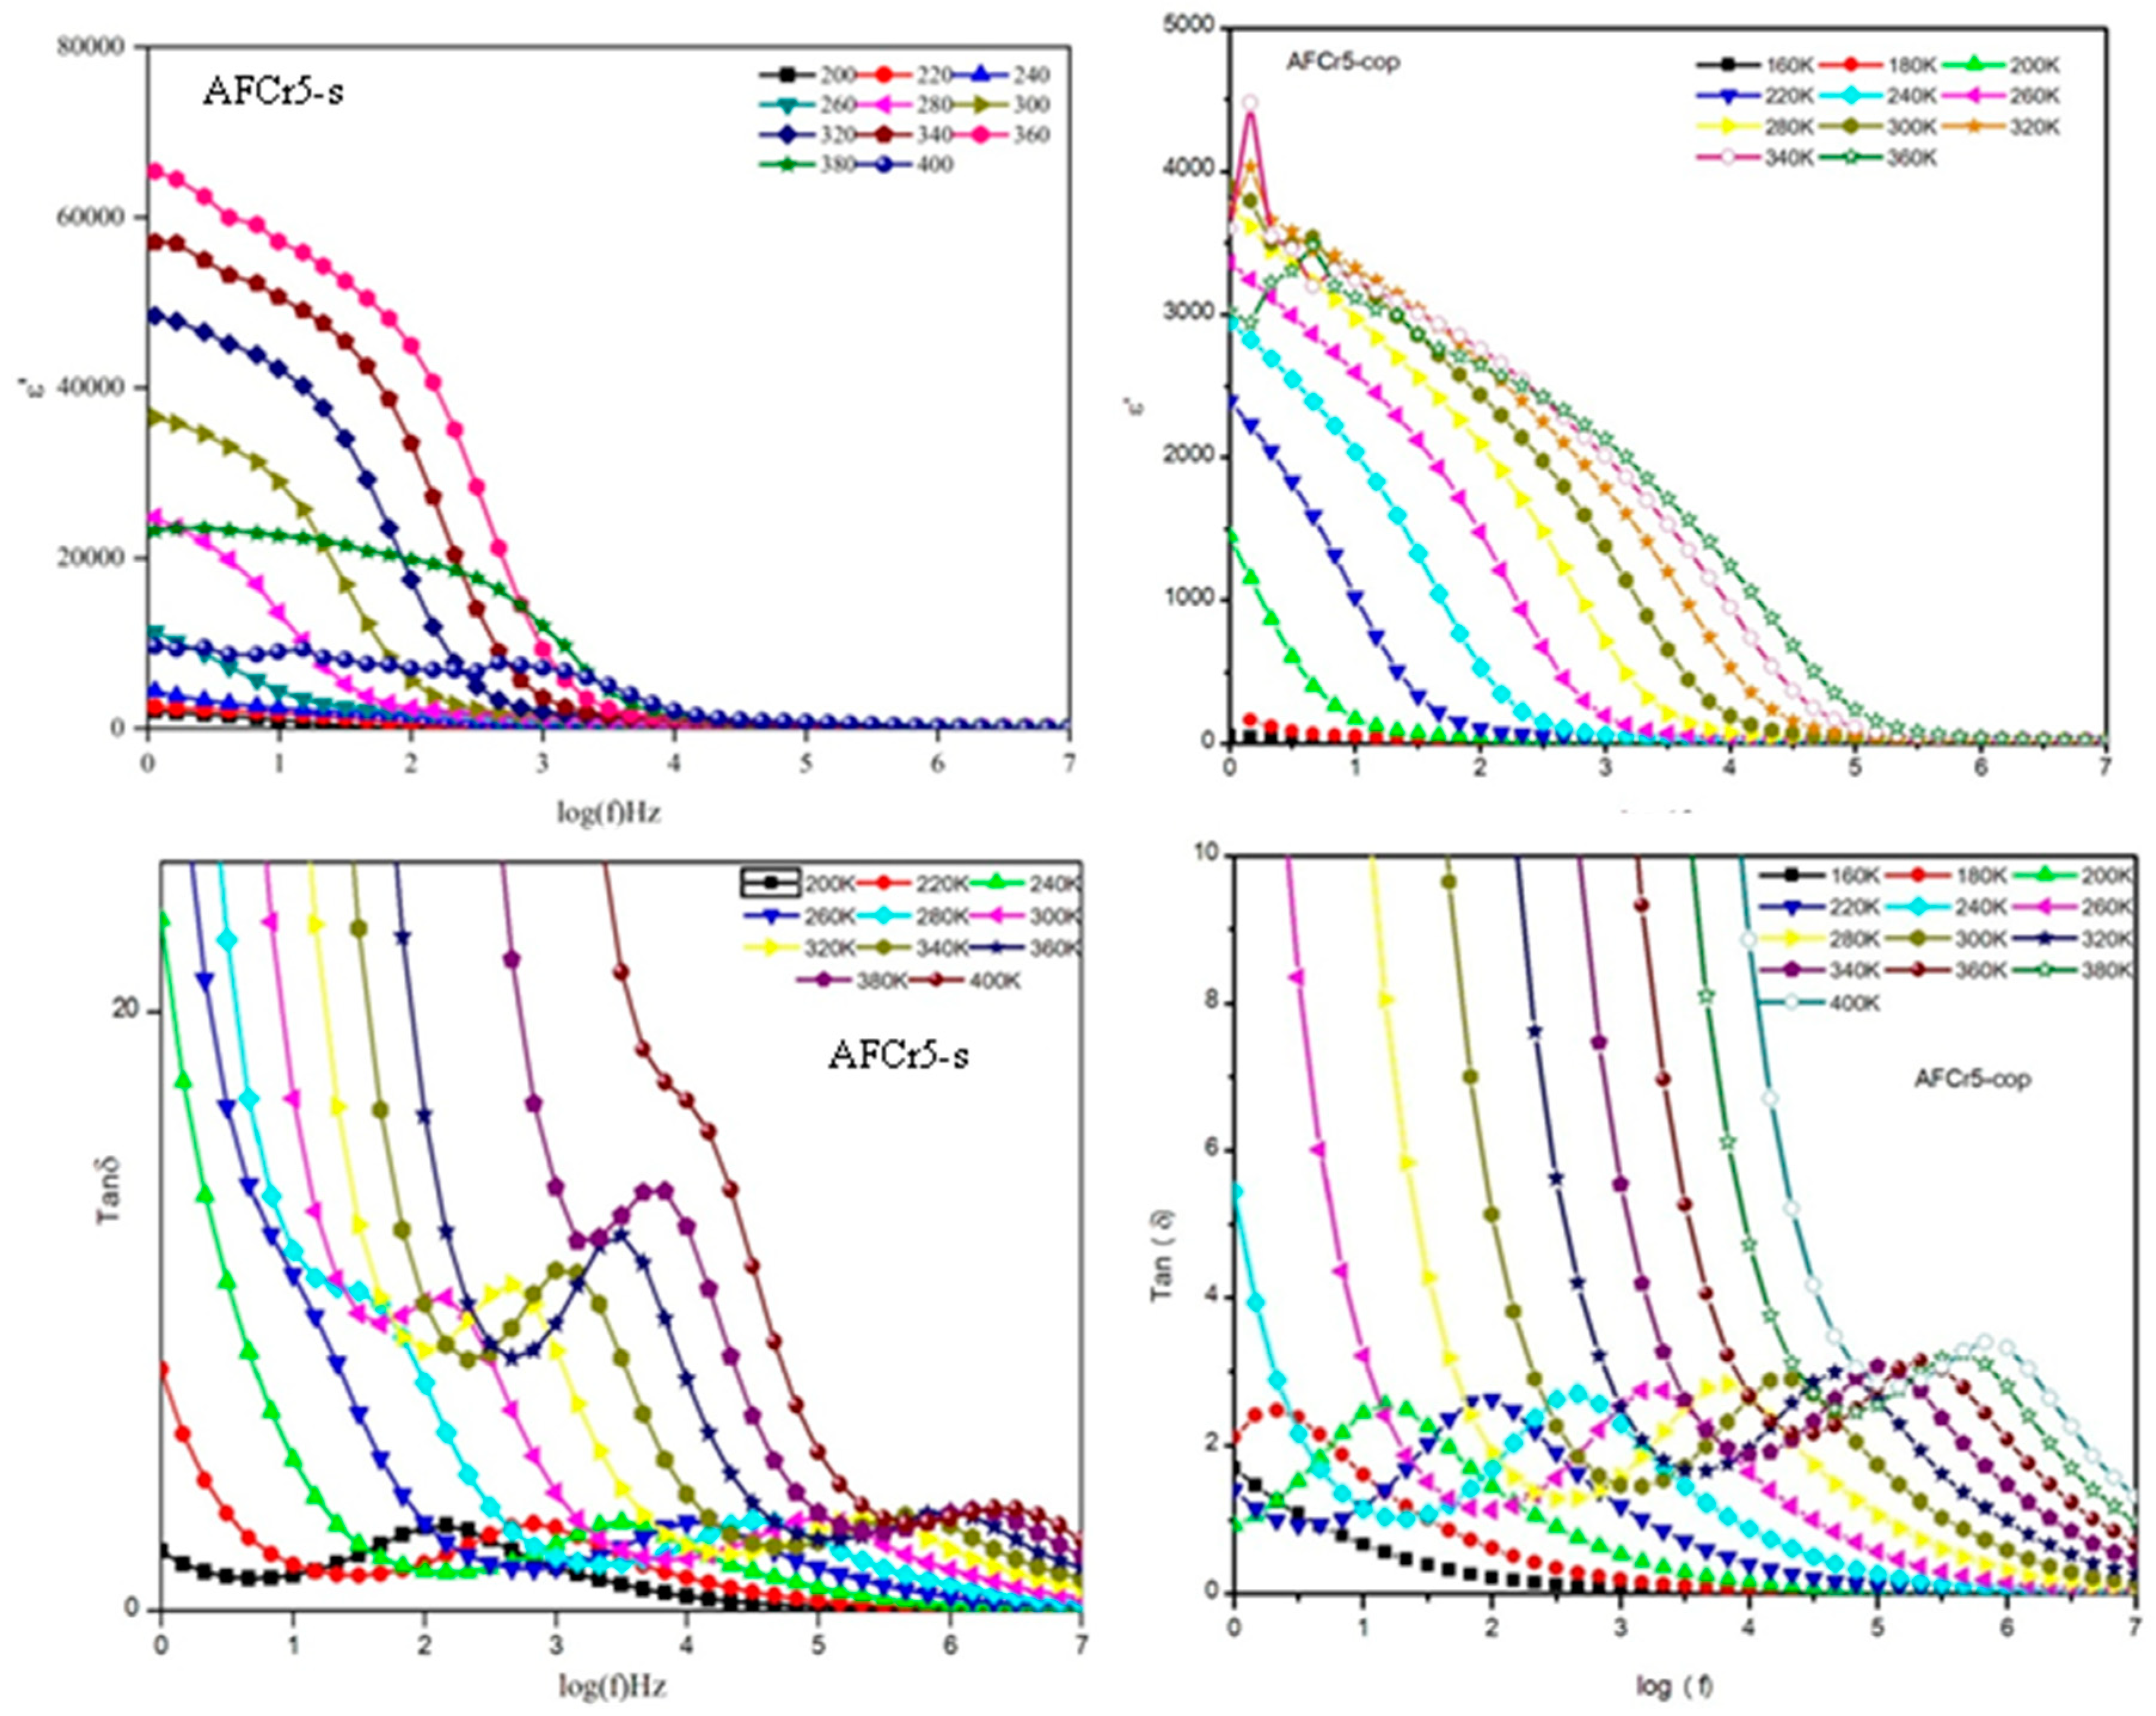
The ε′ variation with frequency at different temperature is depicted in Figure 4. We can note, that in both samples ε′ exhibits a large value at low frequency (lower than 100 Hz) and step like decrease with increasing frequency. For both samples, (ε/) increases with temperature in low frequency ranges up to 360 K before decreasing. An associated Debye like relaxation peak is observed in tan(δ) in the range of the observed step like frequency dispersion in ε′. The frequency-dependent behavior of the real and imaginary part of the dielectric constant is commonly observed in the case of materials exhibiting colossal dielectric behavior (ε′ = 41,000) due to extrinsic effects [25,26]. The shift with temperature and frequency supports a Maxwell–Wagner relaxation type, which arises due to the presence of region with different conductivities within the sample [25,26,27]. In the low frequency domain, the great values of ε′, suggest that the capacitance of grain boundary is greater than the bulk grain capacitance of the material. In fact, at the grain boundaries, the collected charge might provide a Maxwell–Wagner type relaxation behavior [25,26]. The prompt growth in the dielectric constant values (two orders) about 200 K stand up from numerous issues, such as inherent to the system beside extrinsic belongings. In inherent effect case, the sudden increase of (ε/) within a tiny temperature domain might appear in the vicinity of the beginning of ferroelectric arrangement where the dipoles are exposed to a twofold well energy barrier. In such circumstance, the (ε/) follows the Curie–Weiss comportment overhead the transition temperature. Such behavior was not observed in AFCr5-s samples. The result is owing to the grain boundary below 200 K however above 200 K a mutual consequence of the grain boundary and the space charge effect ascending owing to the semiconducting performance linked with the interaction effects.
In general, the dielectric constant and the dielectric polarization are proportional to the grain size [15], which was the case in this study. In fact, dielectric constant for AFCr5-s at a given temperature is much higher than the dielectric constant for AFCr5-cop. A ferroelectric hysteresis as a function of temperature was observed for the Al(Fe0.98Nb0.02)O3 ceramic, suggesting that both ferrimagnetic and ferroelectric states coexist in AlFeO3-based compositions below 160 K [28]. Also, a room temperature ferroelectric hysteresis loops was observed in GaFe1-xCrxO3 samples. With the incorporation of Cr content in GFO, shape of the loops becomes better with enhanced value of polarization and this is attributed to lowered leakage current with Cr doping in GFO [19]. The enhanced value of polarization may be due to increase in the orthorhombic distortion in GFO with the incorporation of Cr content resulting in lowering the electrical leakage in Cr-doped samples [21]. We believe that a similar situation could be observed in our samples.
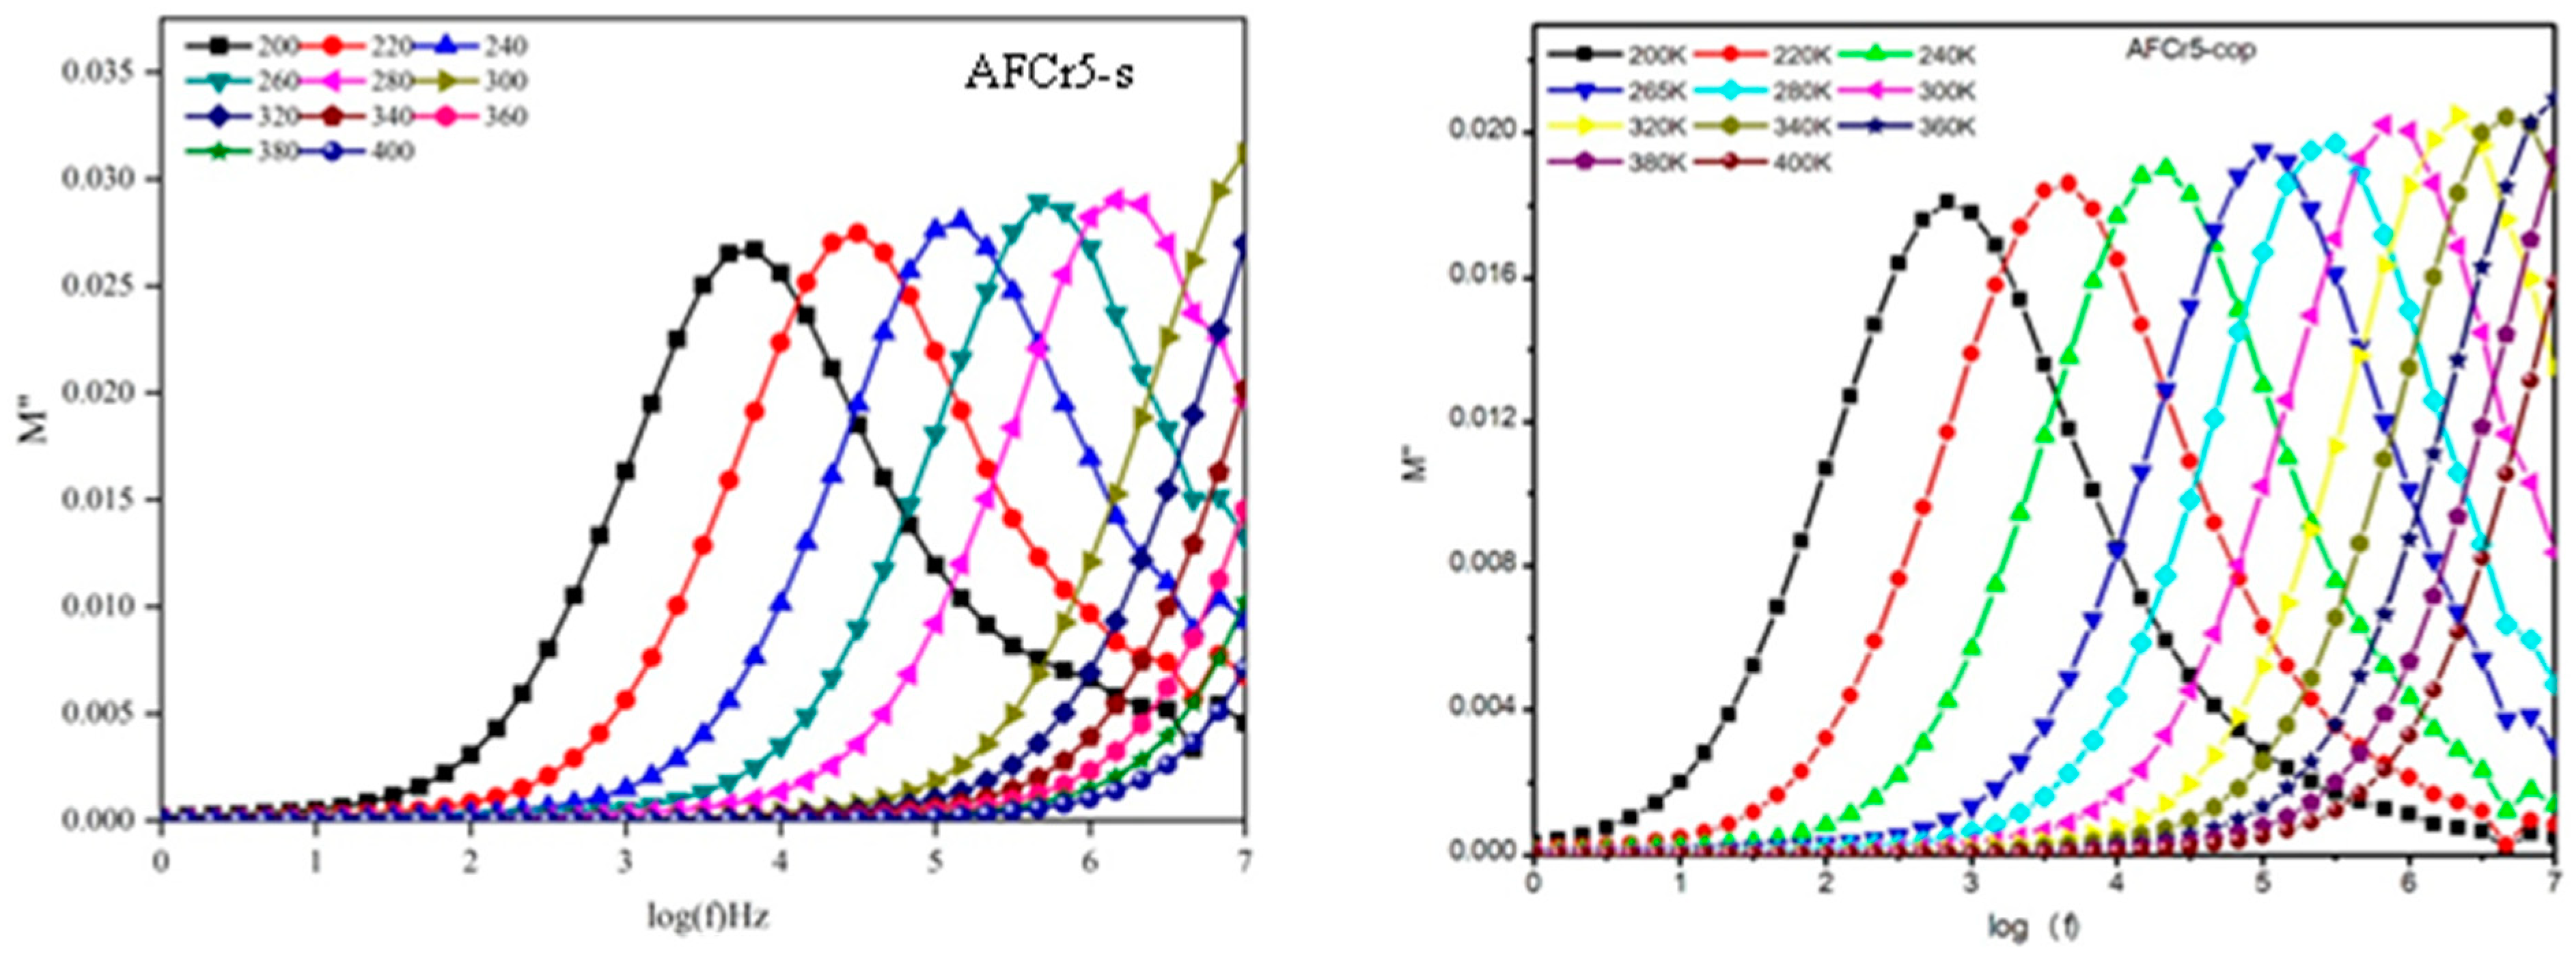
Figure 5 llustrates the evolution of M″, (imaginary part of electric modulus) against log (f) at diverse temperatures. We recognize an asymmetric peak that moves to the greater frequency region with growing temperature. It is noteworthy that at the same temperature the relaxation in AFCr5-s appear at higher frequency compared to AFCr5-cop. at low temperature (200–300 K), the observable anomalies are those that fit to grain relaxation which move out of the measurement range above 320 K) [28]. The changeover from long- to short-range movement through by increasing frequency is assumed by area wherever anomaly happens. Such a comportment of M” spectrum is evocative of temperature-dependent hopping kind mechanism for electrical conveyance (charge transport) in the structure. Moreover, the peaks enlargement is a distinctive of diverse mean time relaxation.
Figure 6 displays the frequency dependence of (Z″) measured at selected temperatures. This spectrum recommends the comportment of the greatest resistive part in the sample. A deep examination of the spectrum shows the existence of two relaxation mechanisms that have diverse relaxation times. The grain effect is recognizable on high frequency region [29], through a peak that moves to upper frequency with growing temperature which line with the dielectric loss behavior in the same frequency range. From the time when the loss tangent and the imaginary part of the impedance are interconnected respectively, the grain boundary effect comes out in the low-frequency part.
Figure 7 shows the room temperature frequency evolution of (Z″) and (M″) spectrum for AFCr5-s and AFCr5-cop systems. It can be realized that, for AFCr5-s, the impedance has three relaxations one sharp around 1000Hz, and two small, at lower and higher frequencies. However, in AFcr5-cop, shows a sharp relaxation in the low frequency range and a broadened one at higher frequency. It is noteworthy, that these relaxations appear at lower frequency than in AFCr5-s. The pure AlFeO3 sample does not display any relaxation at high frequencies. Moreover, the maximum values of impedance (Z″max) and modulus (M″max) do occur at different frequency with broadened modulus spectra which are a symptom of the varied spreading of relaxation times. Based on West et al. [30] analysis, the contribution of grain boundary appears at low frequency and have a high relaxation time as in the case of relaxation with great R and C. however relaxation that appear at high frequency with lower values of R and C are characteristic of the grain contribution. A closely look on the. Impedance imaginary part (Z″) reveals that peak maximum is broadened at low frequency side. however, a peak broadness appears in M″ spectra on the high frequency region. We can assume at the designated temperature, that a higher resistive part is dominating the impedance plots, however a lower capacitance is monitoring the modulus plot (M″) with high frequency disposition.
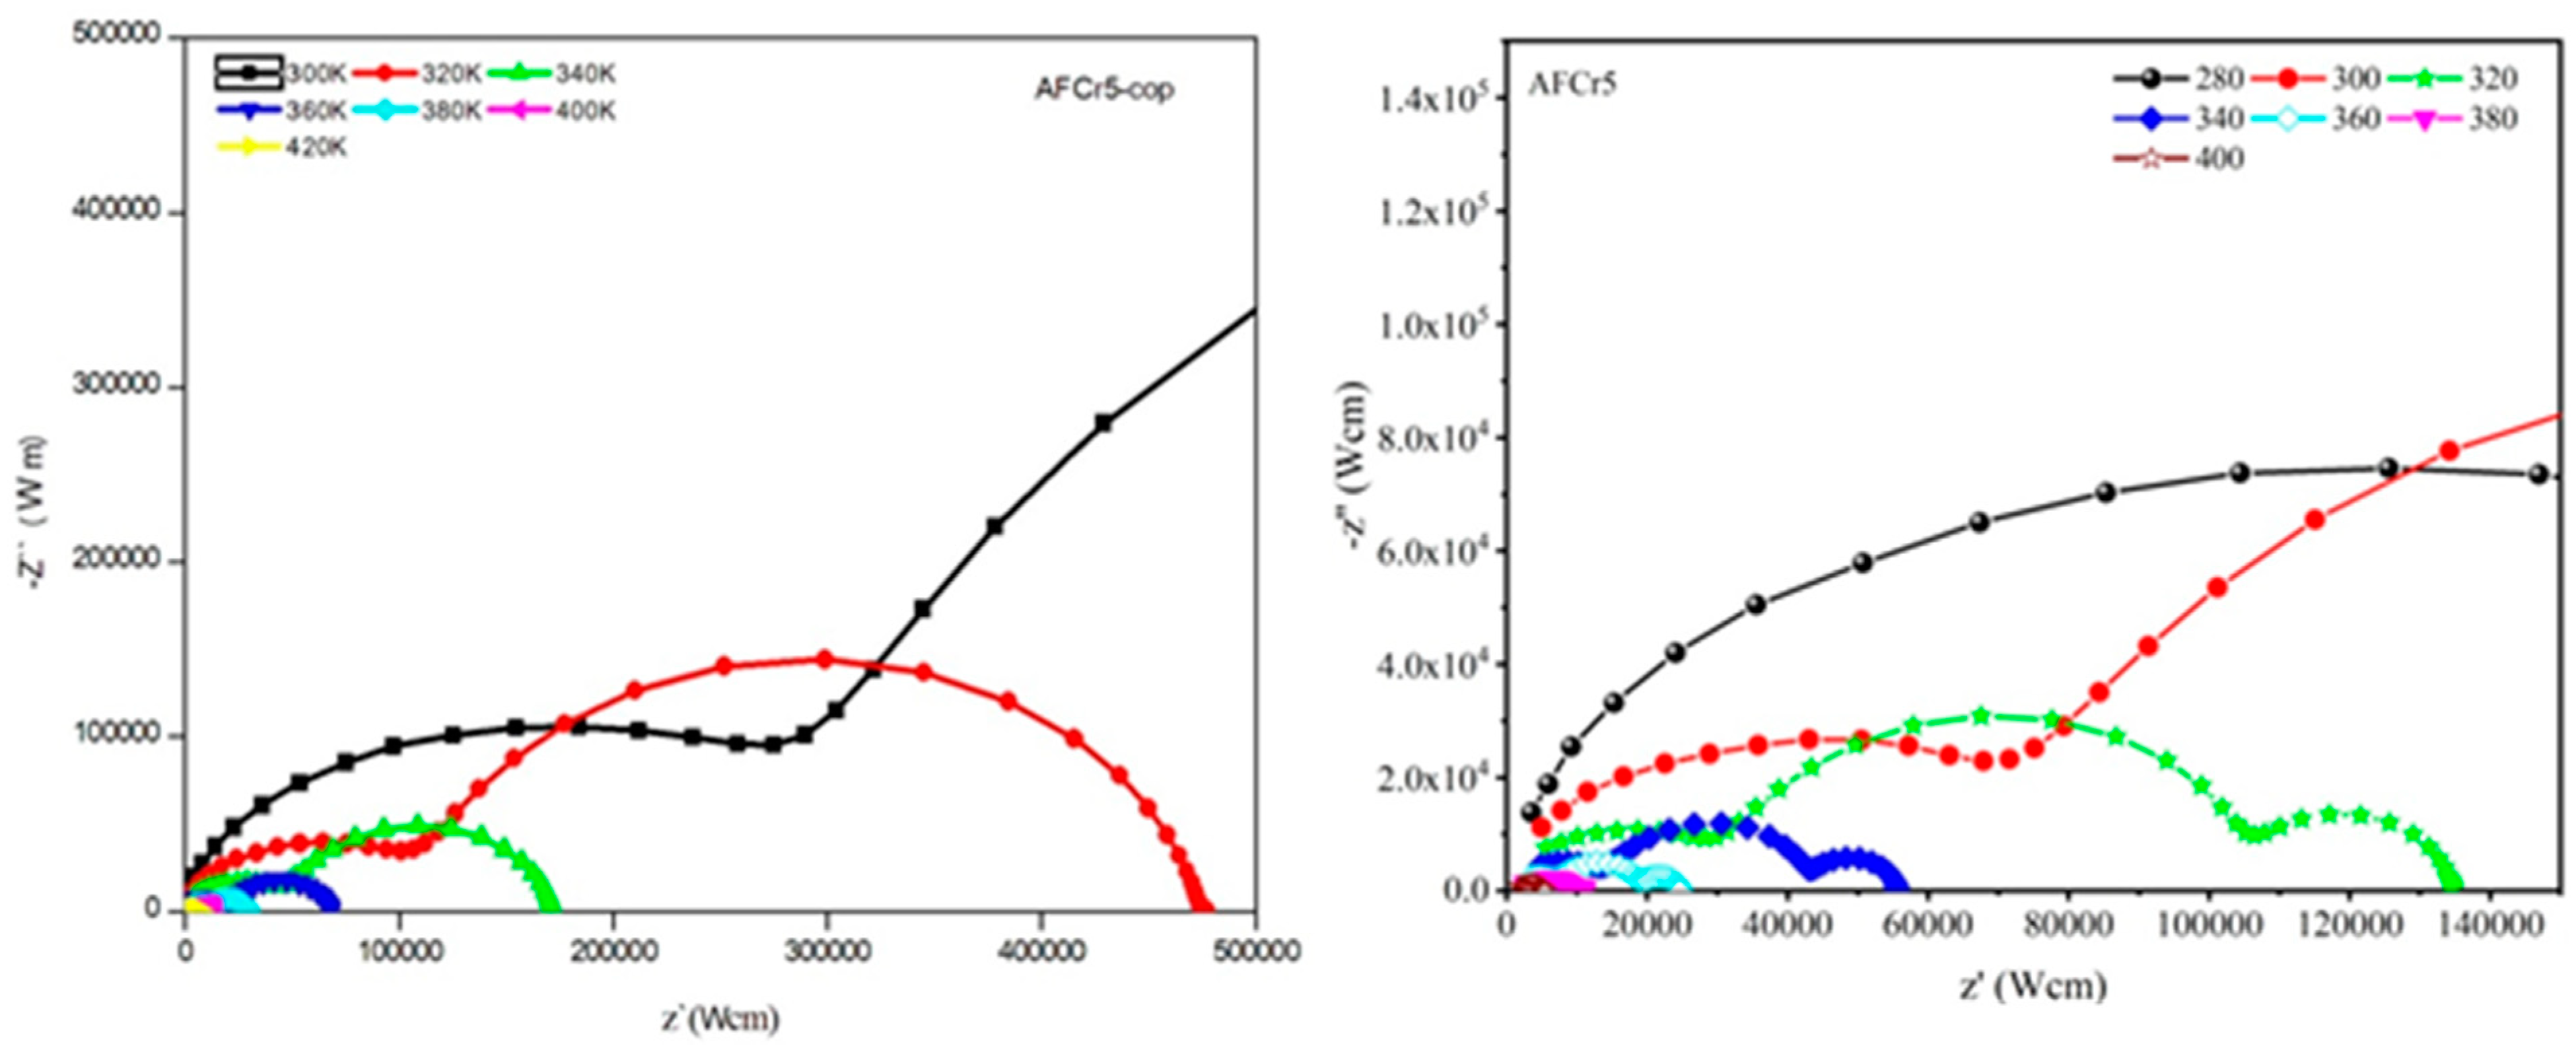
The Nyquist plots (Z′ vs. Z″) at selected temperatures are depicted in Figure 8. The complex impedance schemes are branded by the consecutive semicircular arcs reflecting contribution of grain, grain boundary and electrode. Every arc is characterized by a correspondent circuit component build of resistance and capacitance. The grain effect alone appears as single semicircle in Z’ versus Z” plot. The existence of second semicircle suggests the presence of grain boundary effects. When a third semicircle is present, it designates the electrode effects. These effects are observed in AFCr5-s spectra and not in AFCr5-cop. At a given temperature (320 K) the grain in AFCr5-s effect is two times higher than that observed in AFCr5-cop.
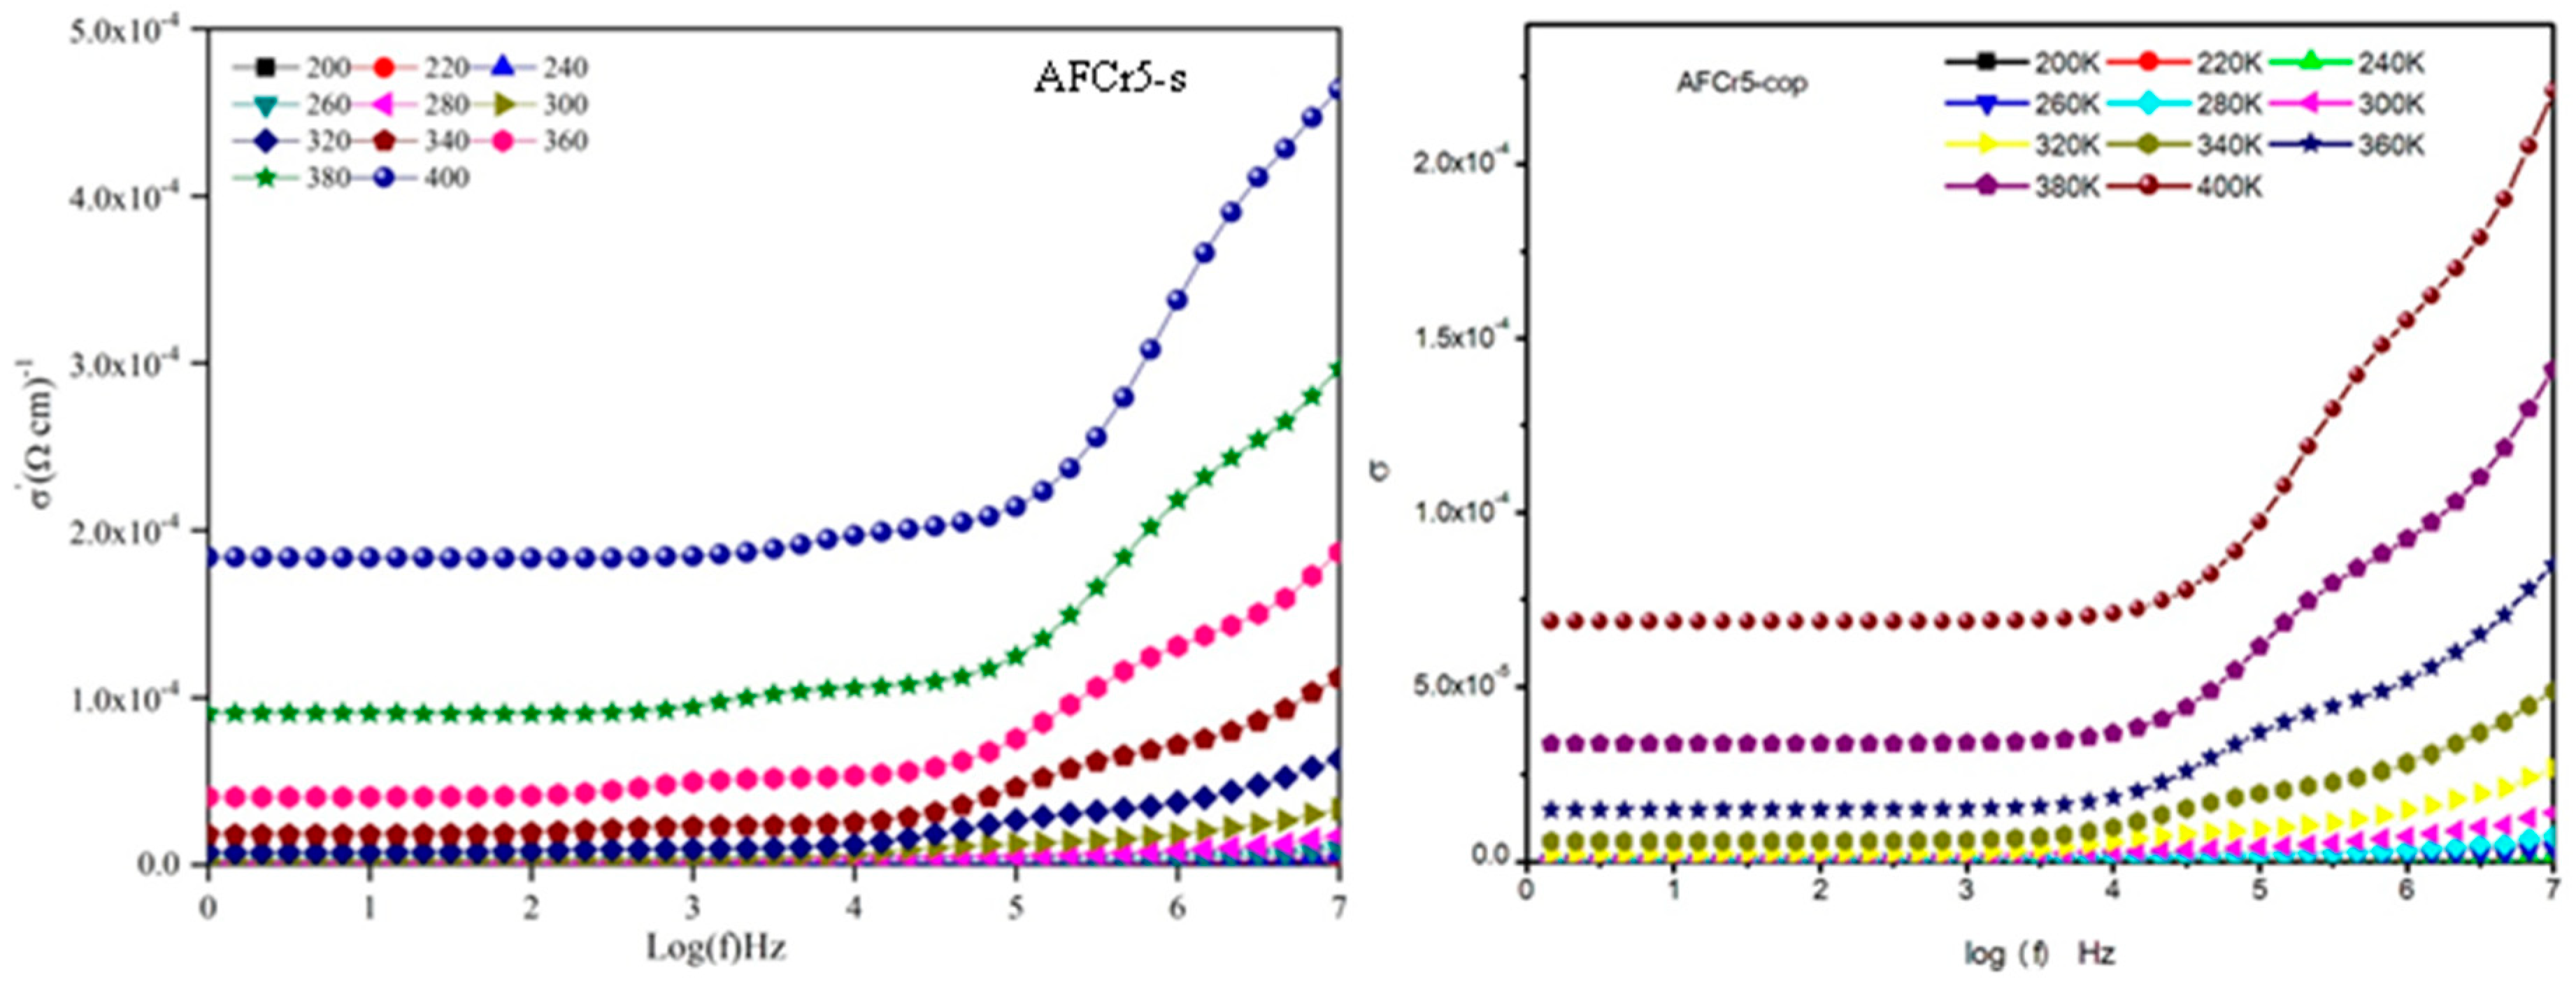
Evolution of σac(ω) with frequency and temperature is depicted in Figure 9. We can recognize the increase of the conductivity with temperature, characteristic of a semiconductor behavior of the prepared samples. Contrary to impedance spectra, the conductivity plots show different behavior in low temperature (⩽300 K) area and high temperature region (⩾300 K). In low temperature domain (up to 200 KHz) the conductivity is almost frequency independent. At higher frequency (~200 kHz–5 MHz) the conductivity turns to a strong frequency variant. This variation is more pronounced for AFCr5-s as compared to AFCr5-cop. The grain boundary effect could be at the origin of such differences.
In the high temperature domain the conductivity can be considered as built of three distinct sections: the first at small frequency area (≤10 kHz), in which the conductivity is frequency independent. The second region is regarded as a weak frequency-variant conductivity (10 kHz–1 MHz). The third region (ν >1 MHz) is a fast frequency-variant region.
We assume that the Maxwell–Wagner mechanism is present in the high-temperature, low-frequency conductivity which is principally owing to the effects of grain boundary. However, intermediary high-temperature and high frequency region can be described by bulk conductivity. The variation in the slope among the low-frequency domain (≤10 kHz) and intermediate-frequency region (from 10 KHz up to 1 MHz) suggests the presence of diverse conduction mechanisms.
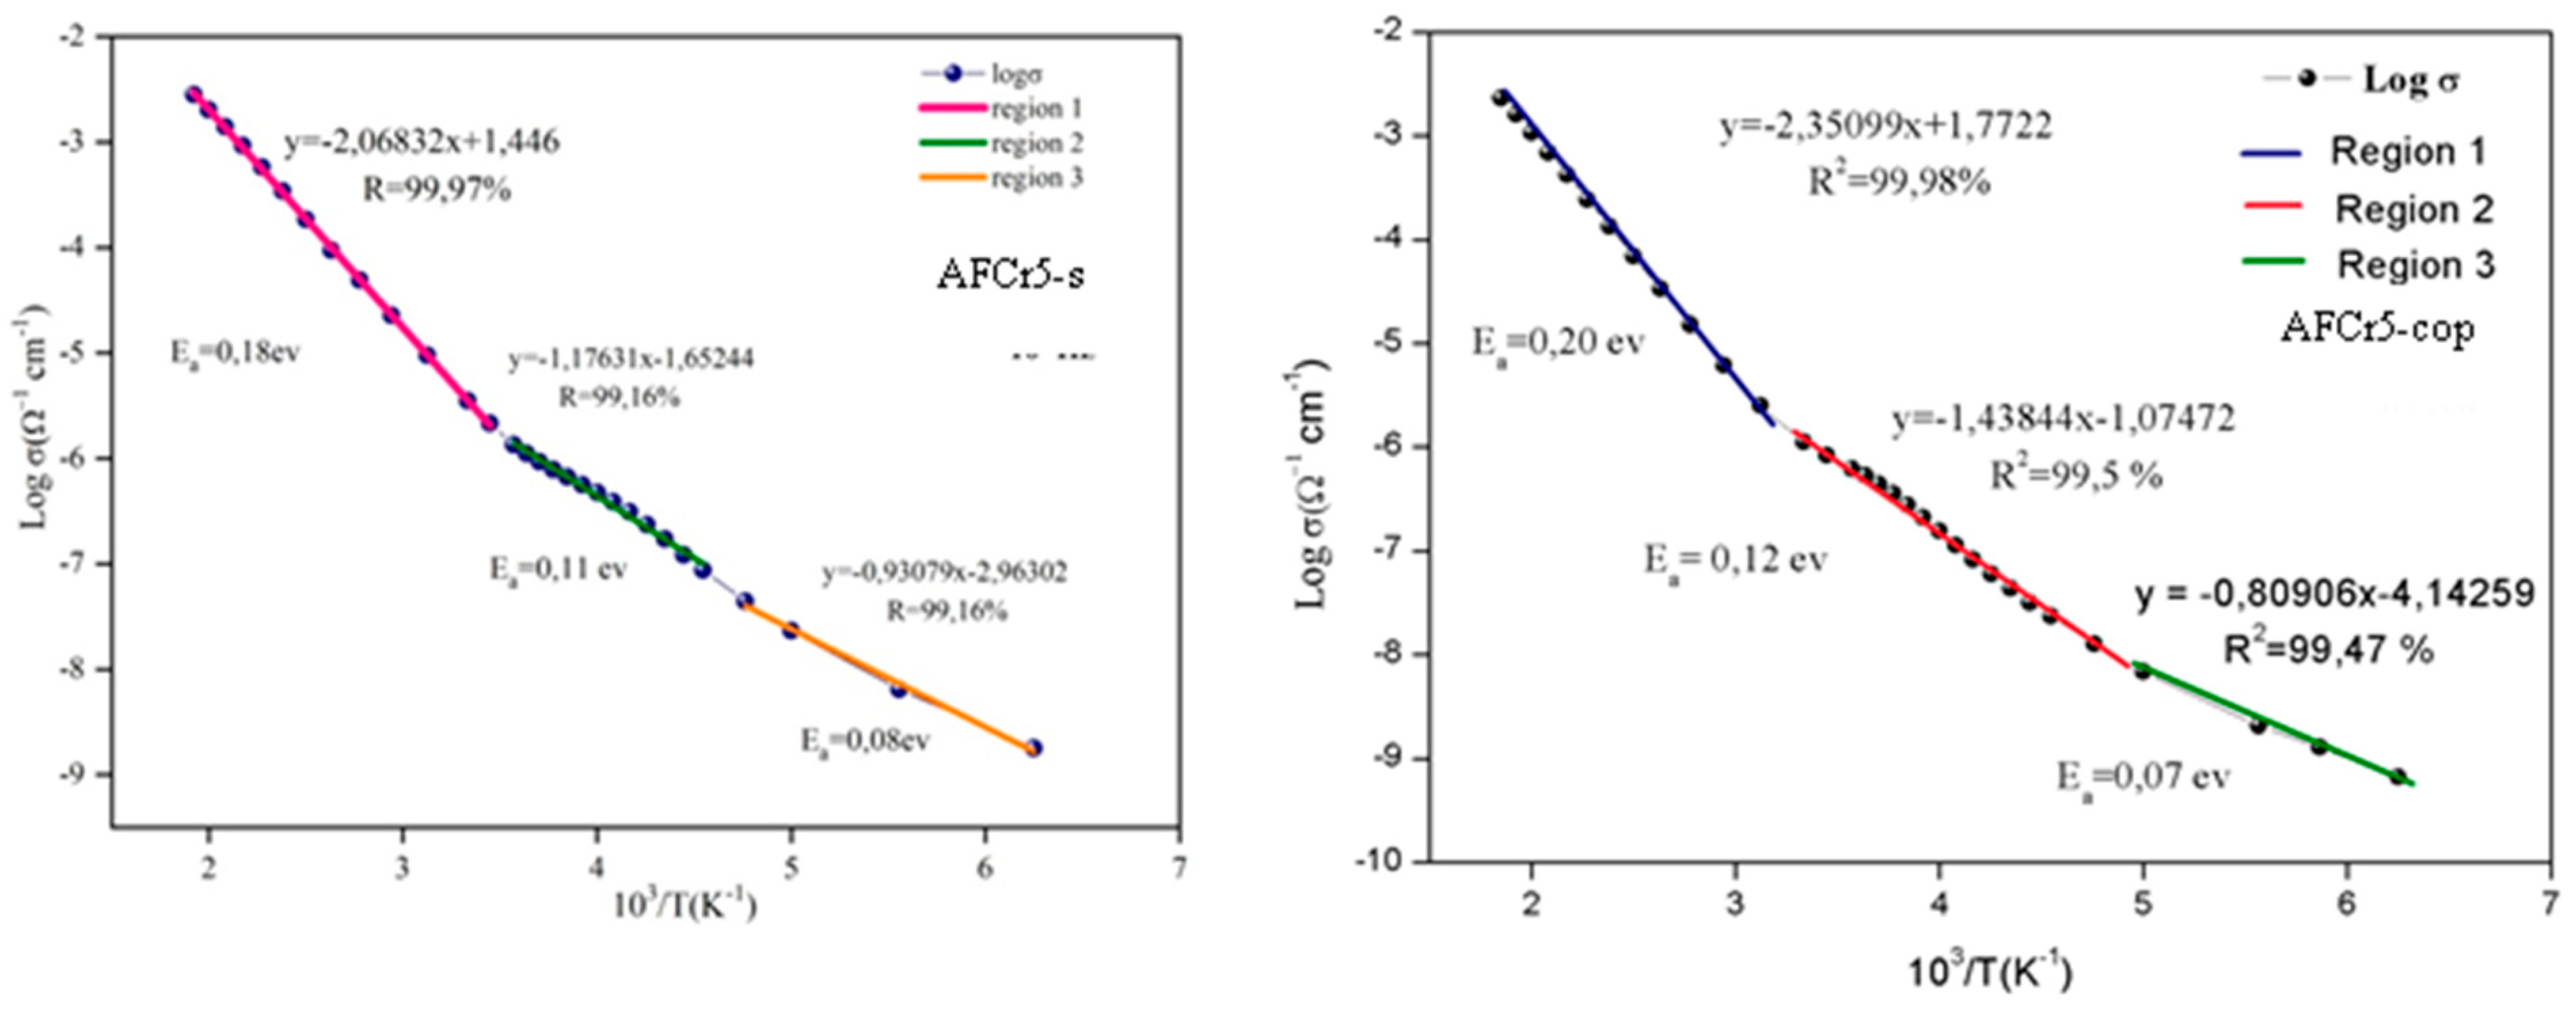
σac dependence with (103/T) at a designated frequency is given in Figure 10. The slope of the plot is found to show three temperature regions, 160–200 K, 200–290 K and 300–410 K correspondingly. In the low-temperature regions, the activation energies very comparable, however in low and middle temperature region the activation energy in AFCr5-cop are higher than those calculated for AFCr5-s. A hopping charge carrier’s mechanism could be associated to the obtained higher activation energy. For AFCr5-s, the energy activation calculated at small temperature was 80 meV. This assumes that at low temperature, the conduction could be related to a charge defect at boundaries, moreover, rules out the probability of macroscopic conduction [31,32,33]. At higher temperature, the sample conductivity upsurges quickly and the estimated energy activation is about 180 meV, that can be also assigned to oxygen vacancies motion at elevated temperature. This energy activation is very slight for the displacement of ions inside grain (inherent conduction).

4. Conclusions

Particle size dependent studies on structural, magnetic and dielectric properties of Cr-doped AlFeO3 have been investigated. The magnetic structure was found to be ferromagnetic. The Fe3+ ions distribution among different sites seems to be related to the preparation methods. The, saturation magnetization (Ms), remanent magnetization (Mr), are enhanced as the particle size decrease, however, coercivity (Hc) decreases. Temperature and frequency electrical impedance and modulus analysis reveal that permittivity in Cr-doped AFO is strongly dependent on microstructure and preparation condition of the samples. Two relaxation processes are detected: high-frequency grain conduction and the low-frequency grain boundary conduction. The grain boundary activation energy was estimated to be higher than that of grain, both grain and grain boundary conduction activation energies increase with decreasing particle size making AFCr5-cop samples better insulators.

Author Contributions

Conceptualization, S.A.A.A. and M.A.; methodology, M.A.; software, I.R.; validation, M.A., L.B.F. and S.A.A.A.; formal analysis, I.R.; investigation, I.R., S.A.A.A.; resources, M.A.; data curation, I.R., L.B.F.; writing—original draft preparation, S.A.A.A., I.R.; writing—review and editing, L.B.F., M.A.; visualization, L.B.F.; supervision, M.A.; project administration, M.A.; funding acquisition, M.A. All authors have read and agreed to the published version of the manuscript.

Funding

This research received no external funding.

Acknowledgments

The authors extend their appreciation to the Deanship of Scientific Research (DSR), King Khalid University, Abha, Saudi Arabia for funding this work through General Research Project, under grant no. G.R.P-141-40.

Conflicts of Interest

The authors declare no conflict of interest.

References

  1. Catalan, G.; Scott, J.F. Physics and applications of bismuth ferrite. Adv. Mater. 2009, 21, 2463–2485. [Google Scholar] [CrossRef]
  2. Hill, N.A. Why are there so few magnetic ferroelectrics? J. Phys. Chem. B 2000, 104, 6694–6709. [Google Scholar] [CrossRef]
  3. Ma, J.; Hu, J.; Li, Z.; Nan, C.W. Recent progress in multiferroic magnetoelectric composites: From bulk to thin films. Adv. Mater. 2011, 23, 1062–1087. [Google Scholar] [CrossRef] [PubMed]
  4. Shirolkar, M.M.; Hao, C.; Dong, X.; Guo, T.; Zhang, L.; Li, M.; Wang, H. Tunable multiferroic and bistable/complementary resistive switching properties of dilutely Li-doped BiFeO3 nanoparticles: An effect of aliovalent substitution. Nanoscale 2014, 6, 4735–4744. [Google Scholar] [CrossRef]
  5. Rao, C.N.; Sundaresan, A.; Saha, R. Multiferroic and magnetoelectric oxides: The emerging scenario. J. Phys. Chem. Lett. 2012, 3, 2237–2246. [Google Scholar] [CrossRef]
  6. Tokura, Y.; Seki, S. Multiferroics with spiral spin orders. Adv. Mater. 2010, 22, 1554–1565. [Google Scholar] [CrossRef]
  7. Edri, E.; Kirmayer, S.; Cahen, D.; Hodes, G. High open-circuit voltage solar cells based on organic–inorganic lead bromide perovskite. J. Phys. Chem. Lett. 2013, 4, 897–902. [Google Scholar] [CrossRef]
  8. Oishi, Y.; Tsukamoto, E.; Shimoda, M.; Takamuku, T.; Narita, T.; Era, M. A novel preparation method of lead-based layered perovskite Langmuir films with a negligible amount of PbBr2. New J. Chem. 2013, 37, 568. [Google Scholar] [CrossRef]
  9. Saha, R.; Shireen, A.; Shirodkar, S.N.; Singh, M.S.; Waghmare, U.V.; Waghmare, A.; Rao, C.N. Phase Transitions of AlFeO3 and GaFeO3 from the Chiral Orthorhombic (Pna 21) Structure to the Rhombohedral (R 3 ˉ c). Struct. Inorg. Chem. 2011, 50, 9527–9532. [Google Scholar]
  10. Saha, R.; Shireen, A.; Shirodkar, S.N.; Waghmare, U.V.; Sundaresan, A.; Rao, C.N.R. Multiferroic and magnetoelectric nature of GaFeO3, AlFeO3 and related oxides. Solid State Commun. 2012, 152, 1964–1968. [Google Scholar] [CrossRef] [Green Version]
  11. Shireen, A.; Saha, R.; Mandal, P.; Sundaresan, A.; Rao, C.N.R. Multiferroic and magnetodielectric properties of the Al1−xGaxFeO3 family of oxides. J. Mater. Chem. 2011, 21, 57–59. [Google Scholar] [CrossRef]
  12. Saha, R.; Sundaresan, A.; Rao, C.N.R. Novel features of multiferroic and magnetoelectric ferrites and chromites exhibiting magnetically driven ferroelectricity. Mater. Horiz. 2014, 1, 20–31. [Google Scholar] [CrossRef]
  13. Hamasaki, Y.; Shimizu, T.; Taniguchi, H.; Taniyama, T.; Yasui, S.; Itoh, M. Epitaxial growth of metastable multiferroic AlFeO3 film on SrTiO3 (111) substrate. Appl. Phys. 2014, 104, 082906. [Google Scholar] [CrossRef]
  14. Pirc, R.; Blinc, R. Nonlinear magnetoelectric effect in magnetically disordered relaxor ferroelectrics. Ferroelectrics 2010, 400, 387–394. [Google Scholar] [CrossRef]
  15. Pirc, R.; Blinc, R.; Scott, J.F. Mesoscopic model of a system possessing both relaxor ferroelectric and relaxor ferromagnetic properties. Phys. Rev. B 2009, 79, 214114. [Google Scholar] [CrossRef]
  16. Liao, L.; An, R.; Shi, S.; Xu, Y.; Luo, Y.; Liao, W. One New Species of the Genus Dryomys (Rodentia, Glirgae) from Xinjiang China, Dryomys Yarkandensis sp. nov. Magn 2020, 33, 795–808. [Google Scholar] [CrossRef]
  17. Kumar, A.; Mishra, V.; Warshi, M.K.; Sati, A.; Sagdeo, A.; Kumar, R.; Sagdeo, P.R. Strain induced disordered phonon modes in Cr doped PrFeO3. J. Phys. Condens. Matter 2019, 31, 275602. [Google Scholar] [CrossRef]
  18. Sharma, N.; Mall, A.K.; Gupta, R.; Garg, A.; Singh, A.K.; Kumar, S. Temperature dependent structural and electrical analysis of Cr-doped multiferroic GaFeO3 ceramics. Mater. Res. Express 2019, 6, 115704. [Google Scholar] [CrossRef]
  19. Mohamed, M.B.; Senyshyn, A.; Ehrenberg, H.; Fuess, H. Structural, magnetic, dielectric properties of multiferroic GaFeO3 prepared by solid state reaction and sol–gel methods. J. Alloys Compd. 2010, 492, L20–L27. [Google Scholar] [CrossRef]
  20. Sharma, K.; Reddy, V.R.; Kothari, D.; Gupta, A.; Banerjee, A.; Sathe, V.G. Low temperature Raman and high field 57Fe Mossbauer study of polycrystalline GaFeO3. Phys. Condens. Matter 2010, 22, 146005. [Google Scholar] [CrossRef]
  21. Goodenough, J.B. Theory of the Role of Covalence in the Perovskite-Type Manganites[La, M(II)]MnO3. Phys. Rev. 1955, 100, 564–573. [Google Scholar] [CrossRef] [Green Version]
  22. Bora, T.; Ravi, S. Study of magnetization reversal in LaCr1−xFexO3compounds. J. Appl. Phys. 2013, 114, 033906. [Google Scholar] [CrossRef]
  23. Selvadurai, A.P.B.; Pazhanivelu, V.; Jagadeeshwaran, C.; Murugaraj, R.; Muthuselvam, I.P.; Chou, F.C. Influence of Cr substitution on structural, magnetic and electrical conductivity spectra of LaFeO3. J. Alloys Compd. 2015, 646, 924–931. [Google Scholar] [CrossRef]
  24. Bakr, M.; Mohamed; Wang, H.; Fuess, H. Dielectric relaxation and magnetic properties of Cr doped GaFeO3. J. Phys. D Appl. Phys. 2010, 43, 43455409. [Google Scholar]
  25. Lunkenheimer, P.; Bobnar, V.; Pronin, A.V.; Ritus, A.I.; Volkov, A.A.; Loidl, A. Origin of apparent colossal dielectric constants. Phys. Rev. B 2002, 66, 052105. [Google Scholar] [CrossRef] [Green Version]
  26. Cohen, M.H.; Neaton, J.B.; He, L.; Vanderbilt, D.J. Extrinsic models for the dielectric response of CaCu3Ti4O12. Appl. Phys. 2003, 94, 3299. [Google Scholar] [CrossRef] [Green Version]
  27. Catalan, G. Magnetocapacitance without magnetoelectric coupling. Appl. Phys. Lett. 2006, 88, 102902. [Google Scholar] [CrossRef]
  28. Santos, G.M.; Silva, D.M.; Freitas, V.F.; Dias, G.S.; Coelho, A.A.; Pál, M.; Santos, I.; Cotica, L.; Guo, R.; Bhalla, A.S. Multiferroic Behavior of Lead-free AlFeO3 and Mn, Nb Doped Compositions. Ferroelectrics 2014, 460, 108–116. [Google Scholar] [CrossRef]
  29. Khan, A.A.; Satapathy, S.; AnjuAhlawat; Deshmukh, P.; Karnal, A.K. Magneto-dielectric coupling in SmFeO3: A study on anomalous dielectric, conductivity, impedance at spin reorientation temperature. Ceram. Int. 2018, 44, 12401–12413. [Google Scholar] [CrossRef]
  30. Penn, S.J.; Alford, N.M.; Templeton, A.; Wang, X.; Xu, M.; Reece, M.; Schrapel, K. Effect of porosity and grain size on the microwave dielectric properties of sintered alumina. J. Am. Ceram. Soc. 1997, 80, 1885. [Google Scholar] [CrossRef]
  31. Ortega, N.; Kumar, A.; Bhattacharya, P.; Majumder, S.B.; Katiyar, R.S. Impedance spectroscopy of multiferroic PbZrxTi1−xO3/CoFe2O4 layered thin films. Phys. Rev. B 2008, 77, 014111. [Google Scholar] [CrossRef]
  32. Pike, G.E. AC conductivity of scandium oxide and a new hopping model for conductivity. Phys. Rev. B 1972, 6, 1572. [Google Scholar] [CrossRef]
  33. Elliot, S.R. Frequency-dependent conductivity in ionic glasses: A possible model. Solid State Ion. 1988, 27, 131–149. [Google Scholar] [CrossRef]
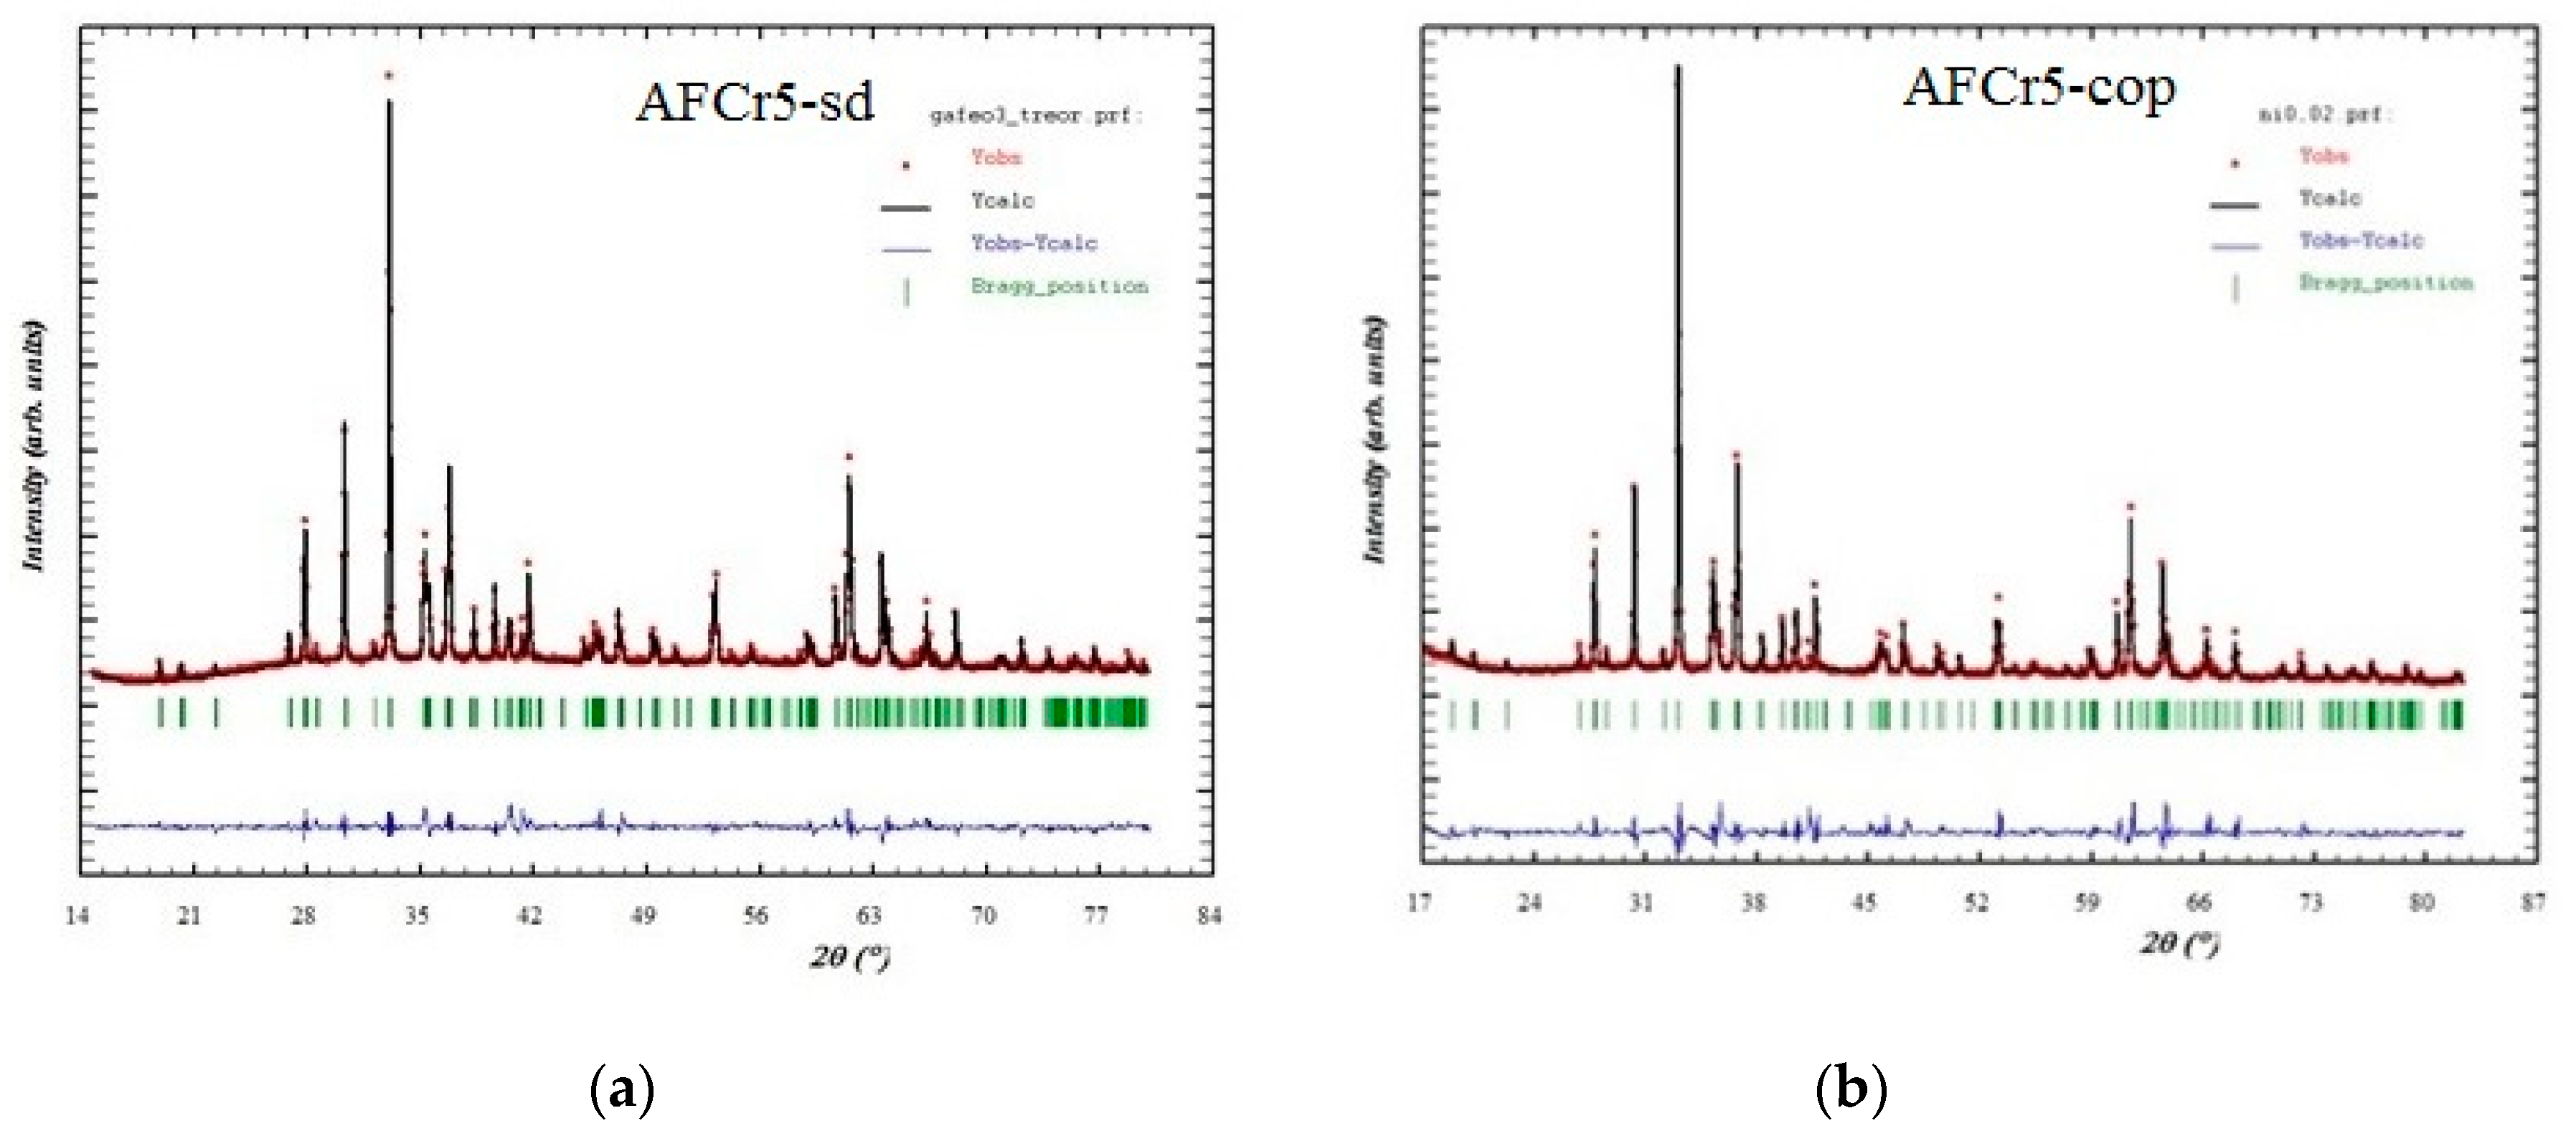
Figure 1. Rietveld refinement of samples X-ray diffraction (XRD) pattern (a) AFCr5-sd (b) AFCr5-cop.
Crystals 10 00440 g001
Figure 2. SEM images of AlFe0.95Cr0.05O3 (a) prepared by solid state reaction (b) prepared by coprecipitation.
Crystals 10 00440 g002
Figure 3. M-H hysteresis loops obtained at 5K for AFCr5-s et AFCr5-cop.
Crystals 10 00440 g003
Figure 4. Evolution of ε’ and loss tangent with frequency at different temperature in AFCr5-s and AFCr5-cop.
Crystals 10 00440 g004
Figure 5. Frequency evolution of M” at different temperature for AFCr5-s and AFCr5-cop.
Crystals 10 00440 g005
Figure 6. Frequency dependent imaginary part of impedance Z” plot of prepared samples.
Crystals 10 00440 g006
Figure 7. (a) variation of imaginary part of the impedance Z’’ and (b) imaginary part of the modulus (M”) for AFCr5-s and AFCr5-cop.
Crystals 10 00440 g007
Figure 8. Nyquist plots evolution with temperature for AFCr5-s and AFCr5-cop.
Crystals 10 00440 g008
Figure 9. Frequency evolution of the conductivity at different temperature for AFCr5-s and AFCr5-cop.
Crystals 10 00440 g009
Figure 10. Variation of log ac conductivity with inverse of the absolute temperature for selected frequency for AFCr5-s and AFCr5-cop.
Crystals 10 00440 g010
Table 1. Unit cell parameters for AFCr5-s and AFCr5-cop.
abcV
AFCr5-s8.7427(7)9.3875(5)5.0803(7)416.96(2)
AFCr5-cop8.7577(3)9.4104(6)5.0853(5)419.10(5)
Table 2. Estimated Ms, Hc and Mr for AFCr5-s and AFCr5-cop.
Ms(emu/Fe)Hc(Oe)Mr(emu/Fe)
AFCr5-s0.7764350.34
AFCr5-cop0.8940350.49