Review

From Equilibrium Liquid Crystal Formation and Kinetic Arrest to Photonic Bandgap Films Using Suspensions of Cellulose Nanocrystals

by
Christina Schütz
1,†,
Johanna R. Bruckner
2,†,
Camila Honorato-Rios
1,
Zornitza Tosheva
1,
Manos Anyfantakis
1,* and
Jan P. F. Lagerwall
1,*
1
Department of Physics & Materials Science, University of Luxembourg, 162a, Avenue de la faiencerie, Grand Duchy of Luxembourg, 1511 Luxembourg, Luxembourg
2
Institute for Physical Chemistry, University of Stuttgart, Pfaffenwaldring 55, 70569 Stuttgart, Germany
*
Authors to whom correspondence should be addressed.
These authors contributed equally to this work.
Crystals 2020, 10(3), 199; https://doi.org/10.3390/cryst10030199
Submission received: 20 February 2020 / Revised: 9 March 2020 / Accepted: 10 March 2020 / Published: 13 March 2020
(This article belongs to the Special Issue New Trends in Lyotropic Liquid Crystals)

Abstract

:
The lyotropic cholesteric liquid crystal phase developed by suspensions of cellulose nanocrystals (CNCs) has come increasingly into focus from numerous directions over the last few years. In part, this is because CNC suspensions are sustainably produced aqueous suspensions of a fully bio-derived nanomaterial with attractive properties. Equally important is the interesting and useful behavior exhibited by solid CNC films, created by drying a cholesteric-forming suspension. However, the pathway along which these films are realized, starting from a CNC suspension that may have low enough concentration to be fully isotropic, is more complex than often appreciated, leading to reproducibility problems and confusion. Addressing a broad audience of physicists, chemists, materials scientists and engineers, this Review focuses primarily on the physics and physical chemistry of CNC suspensions and the process of drying them. The ambition is to explain rather than to repeat, hence we spend more time than usual on the meanings and relevance of the key colloid and liquid crystal science concepts that must be mastered in order to understand the behavior of CNC suspensions, and we present some interesting analyses, arguments and data for the first time. We go through the development of cholesteric nuclei (tactoids) from the isotropic phase and their potential impact on the final dry films; the spontaneous CNC fractionation that takes place in the phase coexistence window; the kinetic arrest that sets in when the CNC mass fraction reaches ∼10 wt.%, preserving the cholesteric helical order until the film has dried; the ’coffee-ring effect’ active prior to kinetic arrest, often ruining the uniformity in the produced films; and the compression of the helix during the final water evaporation, giving rise to visible structural color in the films.

Graphical Abstract

1. Introduction

While cellulose-based liquid crystals are not novel [1], there is without doubt a strong current trend of growing interest in cellulose nanocrystals (CNCs) and the cholesteric liquid crystal phases formed by suspensions of these particles. The interest can be traced back, first, to the general current focus in society on identifying useful renewable functional materials, preferably from natural resources. CNCs—nanorods of cellulose derived from plants or other biological sources—can easily be dispersed in water, forming a cholesteric liquid crystal phase already at quite a low mass fraction [2], that spontaneously organizes the rods in a helical arrangement. This can be retained during evaporation of the water until a solid cellulose film arises that displays vivid structural colors when observed under ambient white light. This important observation [3] was warmly welcomed, because the potential of an abundantly available bioresource for the development of materials with optical functionality (photonic bandgap) was recognized, suggesting a plethora of applications, from biobased iridescent pigments that might be suitable for food and cosmetic applications [4,5] to templates for inorganic materials with complex internal structure [6], covert encryption [7], sensors of humidity [8,9] or pressure [10] and much more. Beyond the beauty of these films and their potential use in various photonic devices, the helically arranged CNCs are also considered as a basis for high-performance composite materials that show excellent mechanical properties coupled with low weight [11], mimicking the helically modulated structures of nature’s top performers, as in crustacean shells or exoskeletons of beetles [12,13] (where the structure is formed by chitin, the ’relative’ of cellulose in the animal kingdom). While the intensive research in the field has led to significant progress, it has also shown that the control of the physical properties of dry CNC films or of the suspensions from which they are made is far from trivial [11,14].
This brings us to the second reason for the interest, namely that liquid crystalline CNC suspensions give rise to a number of intriguing questions regarding the physics and chemistry of particle-based lyotropic cholesterics. What governs the helical self-organization and the transfer of chirality from the molecular to the mesoscopic scale? How does the phase separation into coexisting isotropic liquid and orientationally ordered liquid crystal take place in a strongly disperse rod suspension? What kind of transition takes us from an equilibrium colloidal liquid crystal phase to a kinetically arrested state, and is that state a gel or a glass? Thus, CNC suspensions are also a wonderful playground for soft matter researchers from a fundamental science point of view. As CNCs can now be acquired commercially in large volumes with high degree of reproducibility at reasonable price [15], they constitute an ideal choice for broad-scale systematic research in colloidal liquid crystals.
The first reports of CNC extraction, by sulfuric acid hydrolysis from cotton and wood, were published by Nickerson and Habrle in 1947 [16] and Rånby and Ribi in 1950 [17]. A decade later, Marchessault et al. [18] reported on the birefringent properties of aqueous CNC suspensions, connecting them for the first time to liquid crystal formation. However, it was only in 1992 that Gray and co-workers concluded that the equilibrium liquid crystal phase is of cholesteric type and that the CNCs organize in a helically modulated fashion as a result [2]. Six years later his group demonstrated that films dried from CNC suspensions can show striking iridescent colors [3]. With these (and other) seminal works, Gray set a milestone in the investigation and development of CNCs as a novel and sustainable nanomaterial. His group has constantly remained at the forefront of CNC research and the development of our understanding of these intriguing liquid crystals, and is still so today. By inspiring many others to join in, Gray has turned CNCs into one of the most interesting modern liquid crystal formers known, with great potential for the future.
This review breaks down the key scientific questions and challenges in current CNC research thematically, discussing the relevant issues, whether motivated by scientific curiosity or applied goals, connecting them to the many related other fields of colloid and liquid crystal research. The article is organized as follows: We first give readers not acquainted with CNCs a brief introduction to the material and how it is made in Section 2. In Section 3, we provide a refresher of the key concepts of electrostatically stabilized colloids that are needed to understand the phase behavior and non-equilibrium phenomena of CNC suspensions. Readers well acquainted with this topic may prefer to skip this section entirely or in part. In this context we should also point out that we adhere to the IUPAC recommendations for colloid terminology in this paper, referring to the colloidal suspension, not the particle (as is sometimes done), as the colloid. In the same vein, we use disperse and non-disperse rather than the IUPAC-deprecated terms polydisperse (redundant/tautological) and monodisperse (self-contradictory).
After the general colloid basics, we are then ready to go through the required basic concepts of colloidal liquid crystal research, starting in Section 4.1 with the fundamental question of what we actually mean with the chirality-influenced nematic order that is at the heart of the cholesteric phase, as well as which types of structures we can expect. We review the classic Onsager argument and its implications in Section 4.3, explaining the spontaneous appearance of long-range orientational order, and thus the formation of a (chiral) nematic liquid crystal phase, if we have well-dispersed nanorods beyond a threshold concentration that depends on rod aspect ratio. In the next subsection we look at the interesting dynamics when the isotropic and liquid crystalline phases are in coexistence, with the appearance of so-called tactoids of cholesteric phase in an isotropic surrounding, allowing us to fractionate a disperse CNC sample according to length, with very significant outcome.
In Section 5, we look at the non-equilibrium behavior that takes over once the CNC mass fraction passes a second threshold that is also comparatively low, typically 11–12 wt.%, and how this actually helps to preserve, within a kinetically arrested state, the order emerging from the cholesteric liquid crystalline self organization [19]. We discuss which parameters influence the onset of kinetic arrest, with particular focus on the role of ions in solution, as well as the characteristics of the CNCs themselves. The impact of the solvent characteristics, considering non-aqueous solvents as well as solvents with different added solutes, is discussed in Section 6.
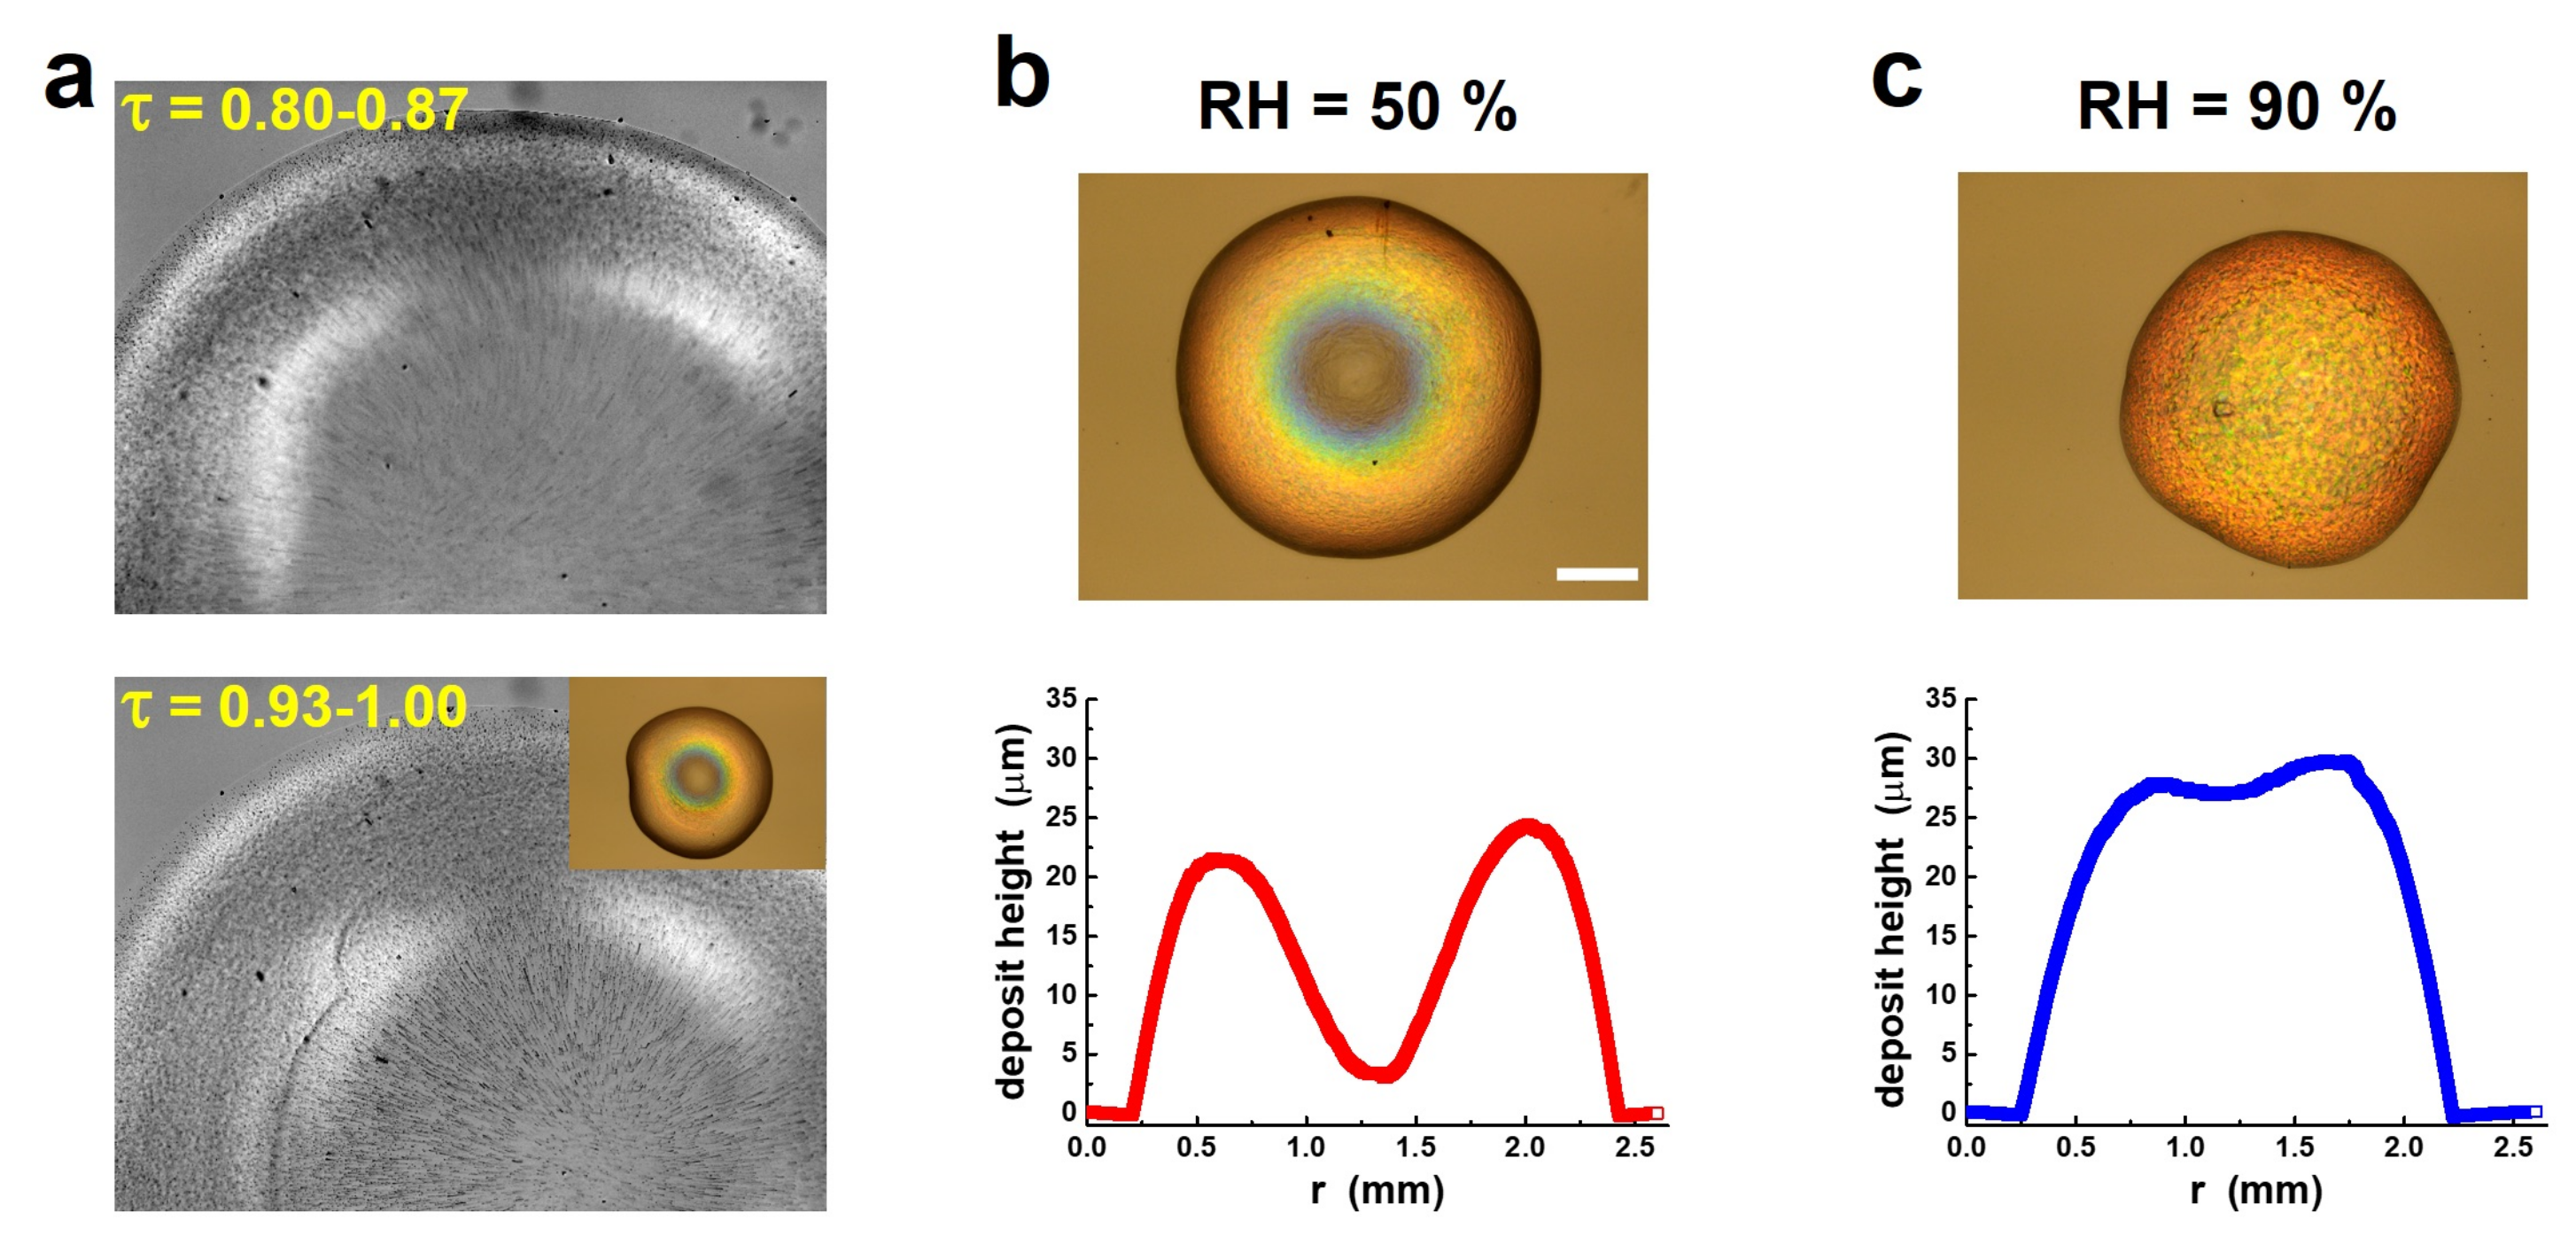
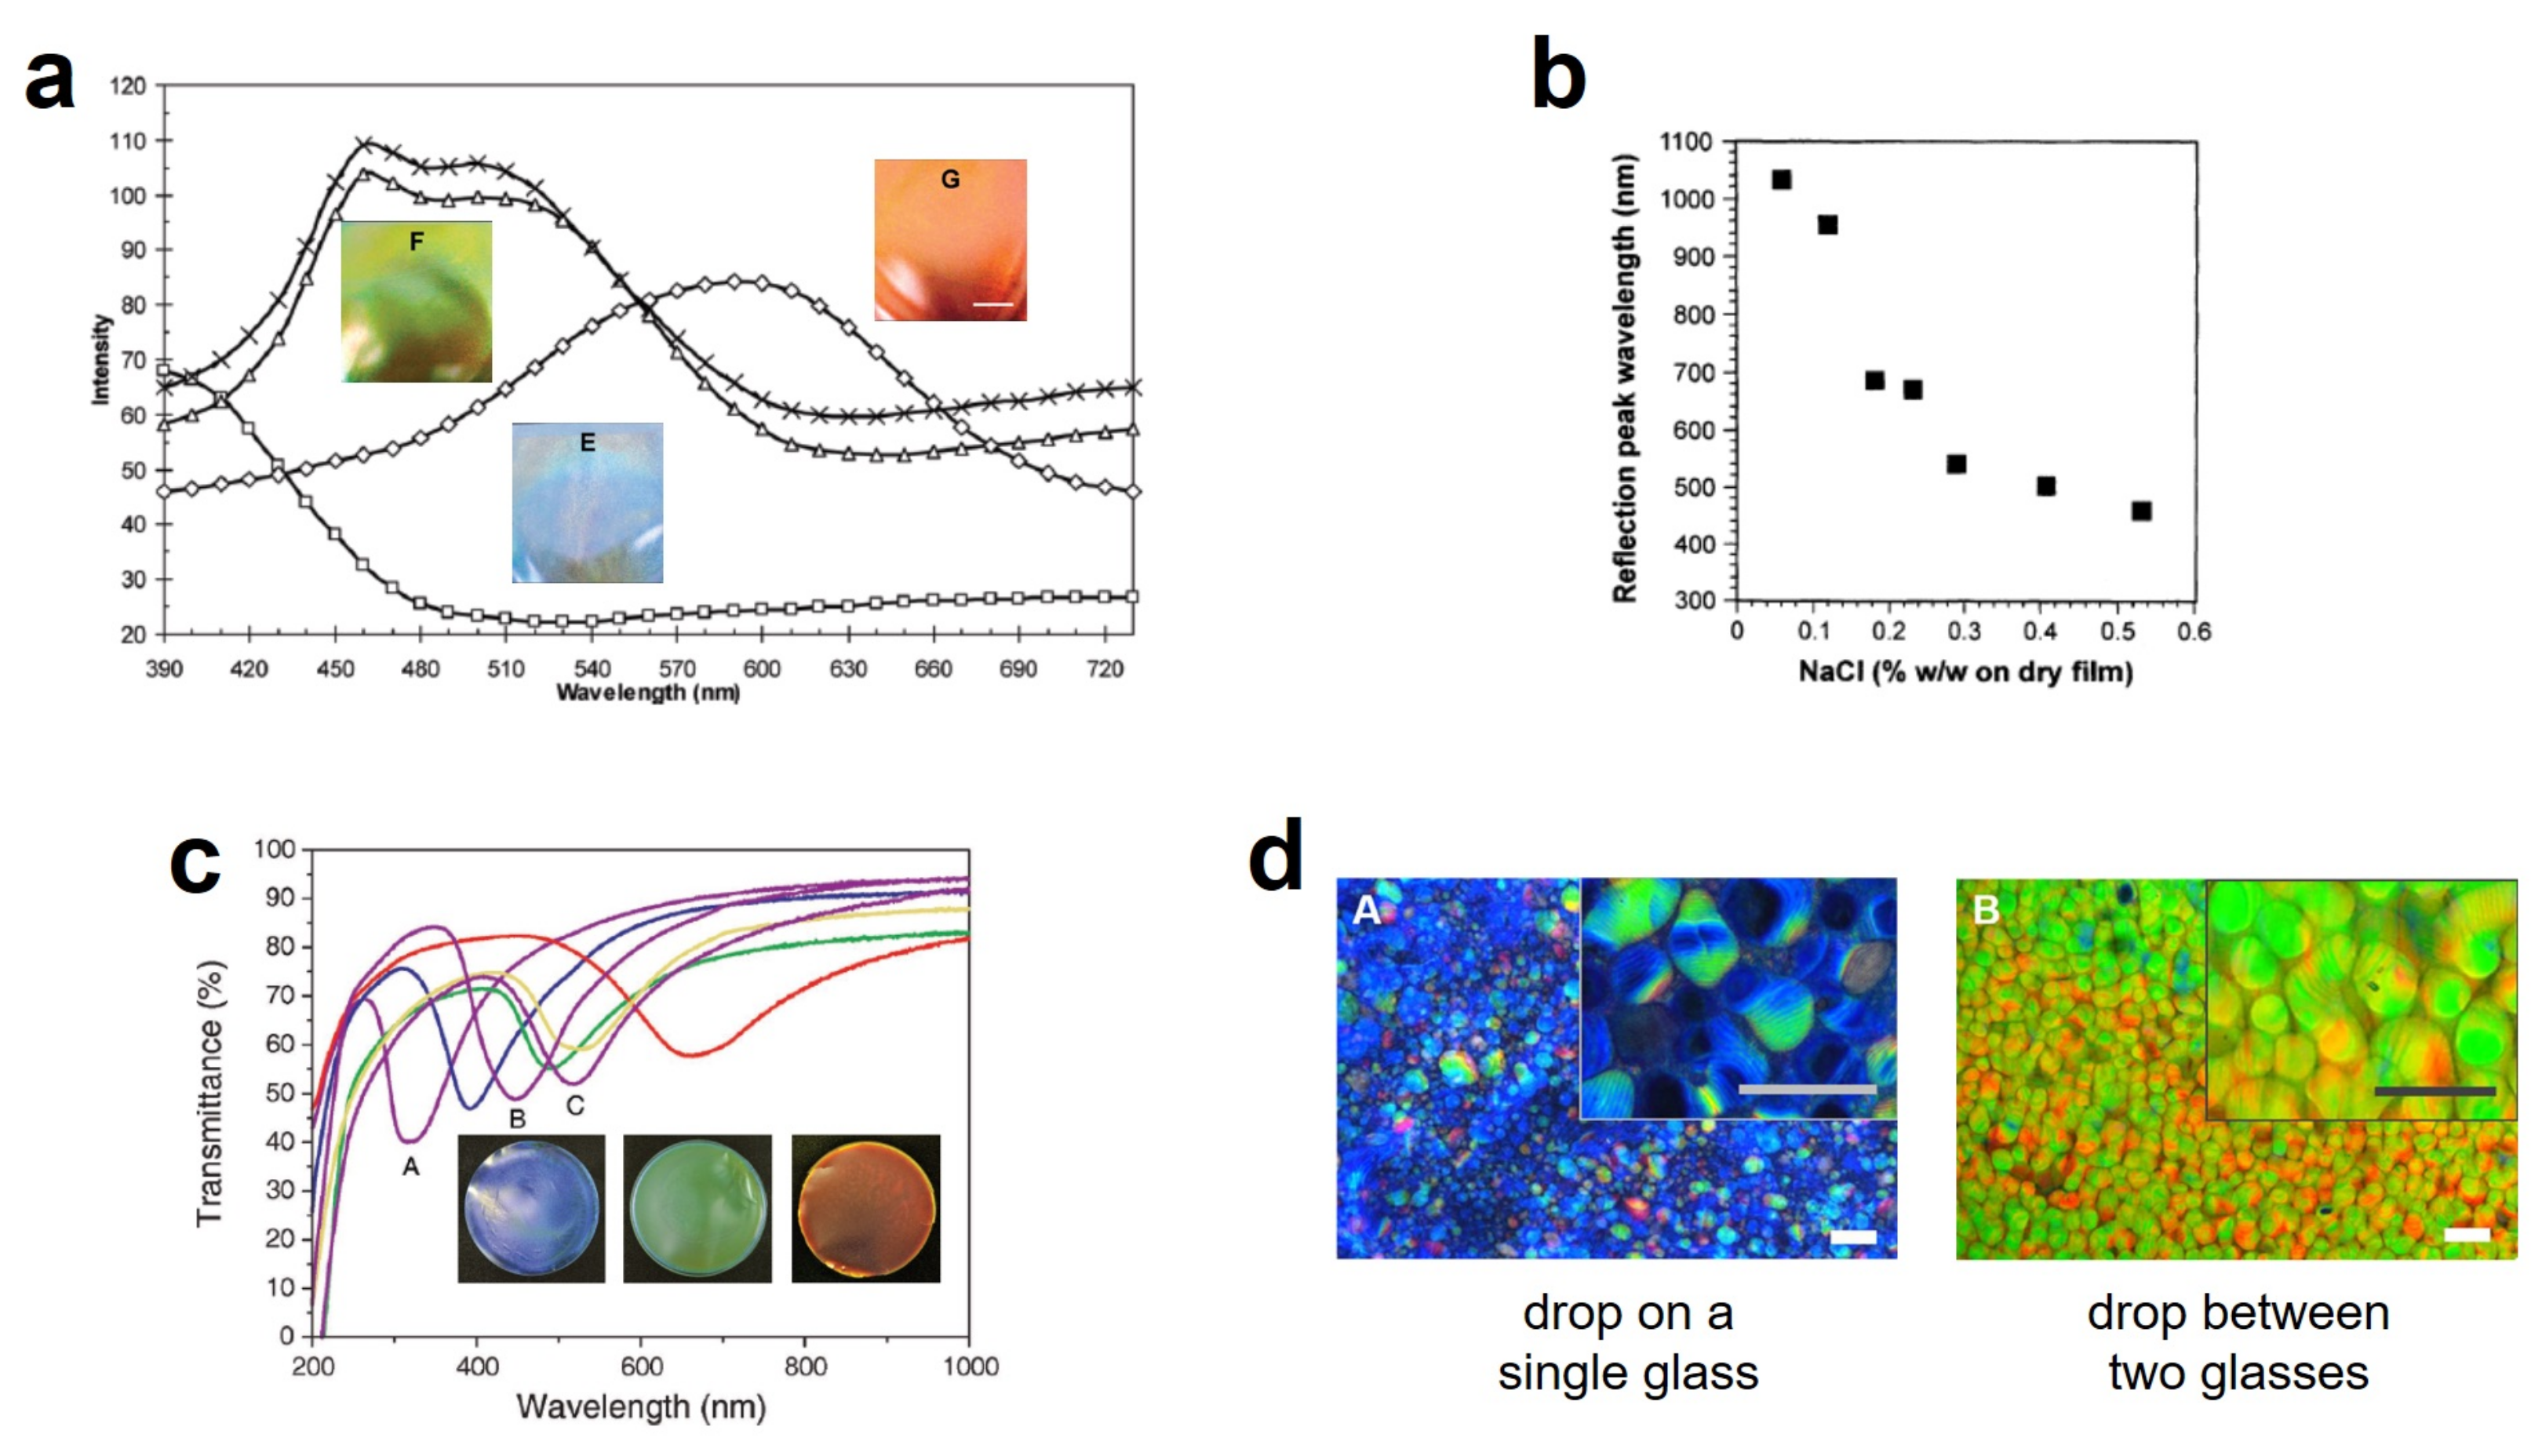
We approach the applied research that aims at using CNCs in photonic bandgap films with visible selective reflection, produced by drying sessile droplets of CNC suspension on a solid substrate, in Section 7. Because structural color is at the heart of this section, we briefly review in Section 7.1 the reason why structural color may arise in cholesteric liquid crystals, and which conditions must be fulfilled for us to see it. In Section 7.2, we discuss the non-equilibrium part of the droplet drying process, during which the helical pitch is reduced by the mechanical compression of the whole film arising from water evaporation, with the consequent appearance of visible color. Here, we also discuss the strong significance of tactoids, should they remain (as is often the case) once kinetic arrest sets in. We introduce the important phenomenon dubbed coffee-ring effect in Section 7.3, allowing us to explain why CNC films typically end up rather non-uniform in thickness as well as in color. The section finishes with a discussion of means to tune the appearance of the films, including some overlooked parameters that we believe to be important.
While the main focus of our review is on CNC, we will, when instructive, compare the behavior with other nanorod colloids forming (chiral or non-chiral) nematic phases, such as carbon nanotubes, amyloid fibrils, viruses or collagen. Our ambition is not to provide an exhaustive review of all research published in the field, thus many fine papers may be left out, but rather give a comprehensive overview of our current understanding of how CNC suspensions behave, with selected illustrative examples from the literature. In today’s fast-paced world with high expectations on researchers to publish rapidly and frequently—probably beyond the level which is healthy, for science as well as for people—we rarely have the opportunity to reflect on the meaning of a certain equation or a certain parameter entering our work. While writing this review, we experienced considerable joy in doing such reflections, and it is our intention with this review to share this joy with the reader. Therefore, rather than merely repeating the standard statements describing a helical director modulation in cholesterics, nematic elasticity, or tactoids nucleating from the isotropic precursor, we allow ourselves to dwell a bit longer than usual on these and other issues that are central to the review topic.

2. What Are Cellulose Nanocrystals and How Are They Made?

Cellulose, one of the world’s most abundant biopolymers, is a polysaccharide responsible for the hierarchical structure in all green plants [20]. Since the dawn of mankind, wood and plant fibers (containing mainly cellulose) served as energy sources, as building materials and as clothing. Furthermore, cellulose played a very important role in the intellectual development of humanity in the form of paper. The oldest known archeological fragments of a direct precursor to modern paper were found in China and date back to the 2nd century BC. Cellulose remained an important raw material also in the early days of industrialization; aside from the fact that the cotton at the heart of the booming textile industry is basically pure cellulose, the polysaccharide was also refined into derived polymers with very different uses. Cellophane became a commodity transparent plastic film and Eastman Kodak utilized partially nitrated cellulose together with camphor as a plasticizer to produce the first flexible photographic films. We find the same combination still today, in dissolved form, in ordinary nail polish.
The recently developed ability to isolate the nanosized constituents of cellulose on relatively large scale has opened up new possibilities for the fabrication of novel cellulose-based high performance materials [11,20,21,22,23]. The attractive properties of this nanocellulose (NC), such as a high surface area and conveniently reactive hydroxyl groups at the surface, low density, low thermal expansion coefficient as well as excellent mechanical performance, offer an extensive toolbox for novel bioderived materials design. This development, together with the increasing need to replace fossil fuels not only as a source of energy but also as the raw material for the vast majority of organic materials synthesis, has resulted in revitalized research in cellulose chemistry and engineering. Interestingly, the resulting new opportunities for advanced materials development give also the physics of NC critical importance, a fact that we and co-authors highlighted in an earlier review of CNCs [11], now about six years old. In this updated review we maintain the focus on the comparatively short and rigid CNCs, comprising only crystalline cellulose, while we point out that the general term nanocellulose includes also the longer and more flexible cellulose nanofibers (CNFs), which also contain amorphous sections. While they are also fascinating materials, CNFs tend to form gels prior to developing long-range order, hence they are less interesting for liquid crystal science.
Cellulose consists of repeating cellobiose units of two anhydroglucose rings connected via a β -1,4-glycosidic bond that form a linear polysaccharide. The multiple hydroxyl groups on each monomer result in omnipresent hydrogen bonds between the cellulose chains, explaining the high stability and mechanical strength of crystalline cellulose [23] (and thus of CNCs). In the native crystal form, called cellulose I, the chains are oriented parallel to each other. Cellulose I encompasses two polymorphs [24], cellulose I α with a triclinic and I β with a monoclinic structure. Different plants contain both polymorphs in ratios that are specific to the plant species [25]. Cellulose I α is dominant in most algae [26] and bacteria [27], while I β is dominant in higher plant cell wall structures and in tunicate [28]. The basic building block in plants and bacteria typically consists of 20–40 cellulose polymer chains structured into highly ordered crystalline and disordered regions, which form a cellulose nanofiber.
CNCs are the smallest extractable nanoparticles from a raw cellulose source. They are nanorods with a diameter in the order of 5 nm and length from about 100 nm to 1 μ m, consisting of pure cellulose in a highly crystalline state. A typical production process is depicted in Figure 1. Regardless of the preparation method, CNCs are disperse in width and, in particular, in length (30% to 50% dispersity is typical). The morphology of the cross section of a CNC is not very well defined and the small size renders it challenging to establish with certainty, but there seems to be significant variations within one and the same sample, in fact even within one and the same rod [29,30]. For practical reasons the shape is often approximated by that of a cylindrical rod but this is certainly a simplification. Further morphological variety is introduced by using different sources [31,32] and the distribution in size also varies considerably depending on the source, yielding CNCs with quite different colloidal properties. The numerous hydroxyl groups are of pivotal importance not only for the strength, but also for the surface chemistry of CNCs, in particular for attaching charged groups (see below).
Methods to isolate NC (CNCs as well as CNFs) from plants and bacteria range from bottom-up methods where bacteria are used to produce glucose cellulose nanofibrils, to top-down methods including chemical/physical and enzymatic methodologies for the isolation of NC from green plants and algae [33]. The isolation is dependent of the source of cellulose but always involves purification as well as homogenization. For instance, if wood is the source, the two other main constituents, lignin and hemicellulose, must be removed. The homogenization and separation can be done by simple mechanical treatment, a pretreatment such as chemical modification [34] or enzymatic hydrolysis reducing the required energy [35]. These processes yield microfibrillated cellulose, which is then further processed with inorganic acids in order to obtain CNCs. Purified cotton can also serve as starting material for the production of CNCs. For both routes, see Figure 1.
The choice of acid for this hydrolysis is very important as it defines which surface groups are attached, thereby dictating the colloidal stability of the resulting CNCs. The most common choice is to use sulfuric acid, yielding anionic (negatively charged) CNCs in aqueous suspension, with sulfate half ester groups (−SO 3 ) attached to the surface, via the cellulose hydroxyl groups, and H + counter ions. The surface charge of CNCs makes their dispersion in water easy, giving us an electrostatically stabilized colloid. Because some −SO 3 groups, even in water, remain associated with their H + counter ions, the raw CNCs from sulfuric acid treatment are often subjected to an ion exchange process, in which H + is replaced by another counter ion, typically Na + . For these CNCs we can generally assume that all counter ions are in solution, regardless of the pH of the suspension, making them significantly easier to handle and to analyze. Commercially available CNCs are often sold with Na + counter ions.

3. A Brief Reminder of the Factors Governing Electrostatic Stabilization of Colloids: the Debye Screening Length and the Ionic Strength

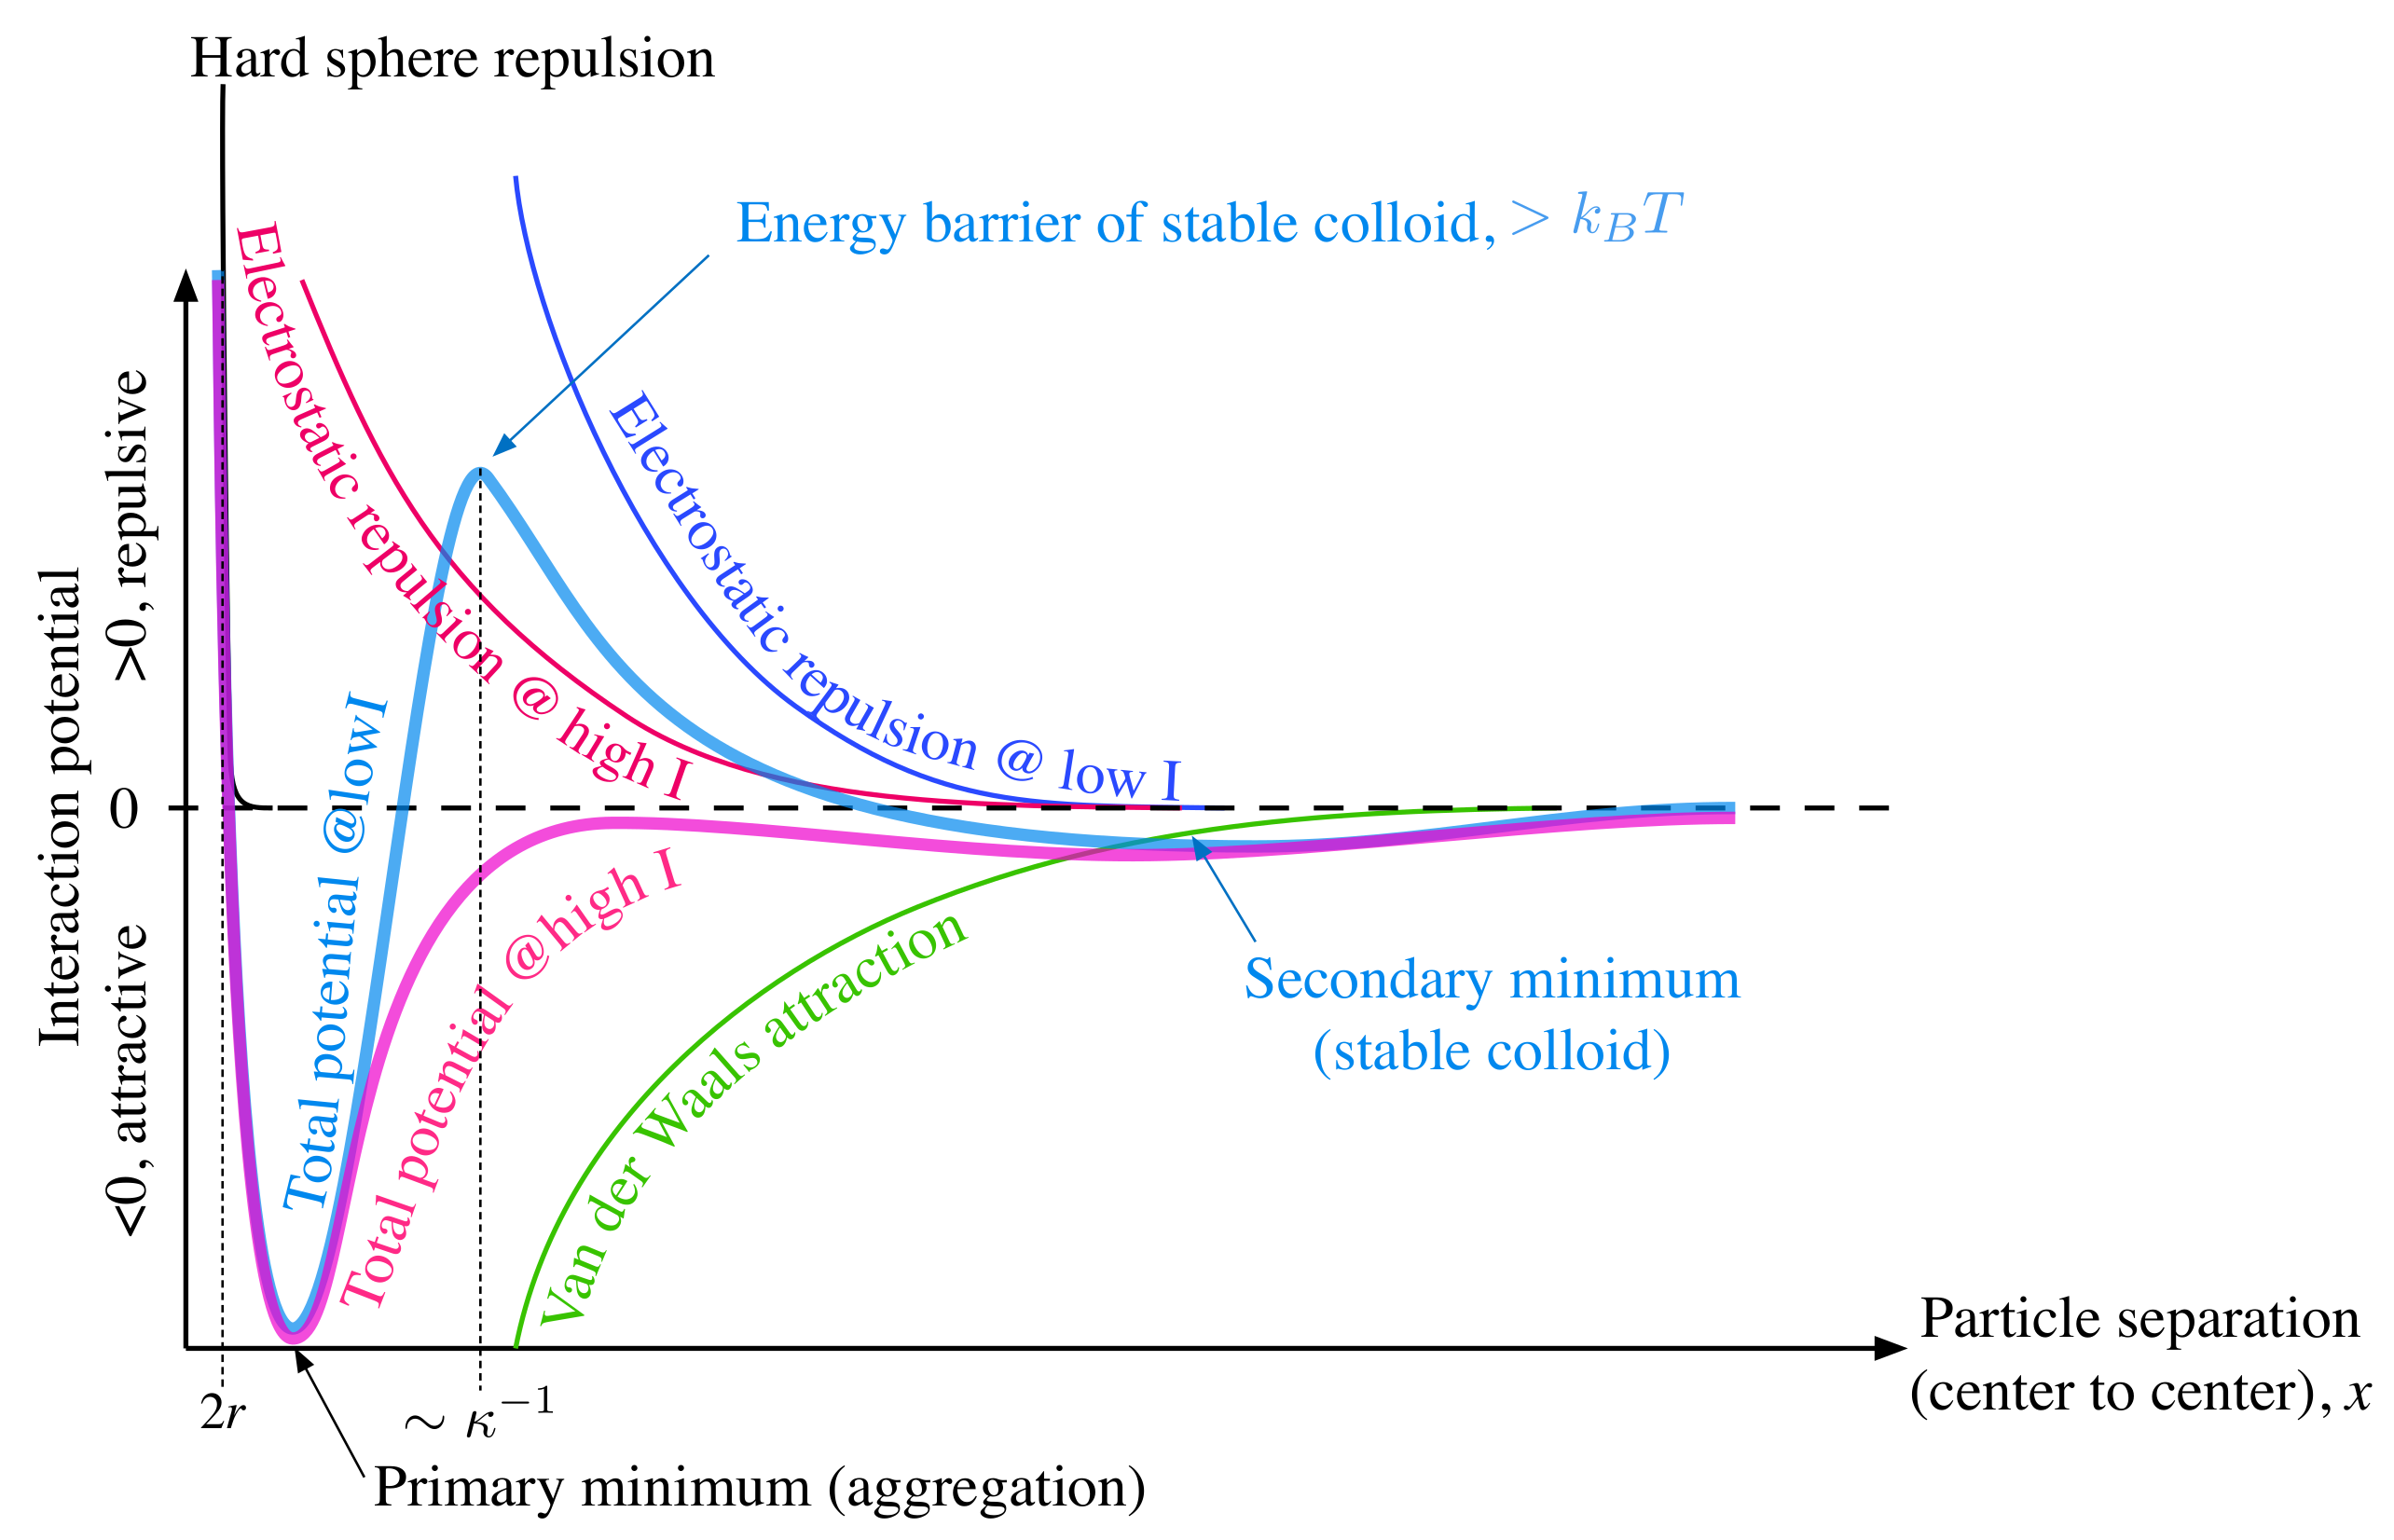
The classic theory for describing electrostatic stabilization (and destabilization) of colloids is due to Derjaguin and Landau, and, independently, to Vervei and Overbeek. It is therefore today referred to as the DLVO theory. The theory analyzes the interaction energy between suspended particles (Figure 2), taking, first, the Pauli exclusion principle into account, which places an absolute limit to how close the particles can approach. Their electron orbitals cannot occupy the same space, hence an infinite potential barrier appears if the distance between the particle centers would go below x = 2 r , where r is the characteristic radius of the particle. This repulsive barrier is often referred to as hard-sphere repulsion or Born repulsion, after Max Born who was the first to draw this conclusion from the Pauli principle. Next, when x is just barely greater than 2 r , the behavior is instead dominated by the very strong attraction provided by the van der Waals interactions. Their energies scale as 1 / x 6 , hence the attraction gets extremely strong at such close encounters. In fact, if x is allowed to reach the low values when van der Waals attraction dominates, the particles are at their global energy minimum separation and they aggregate irreversibly, rendering the colloid unstable. They can be separated again if enough energy is supplied (for instance mechanical energy in the form of ultrasound), but they will never separate spontaneously.
To keep the colloid stable, such close encounters must thus be prevented, and this is why each particle carries a certain electrostatic surface charge. As the charge has the same sign for every particle, it provides a repulsive potential more potent than Born repulsion, because it acts at a significantly larger distance. However, as can be seen in Figure 2, it can only dominate over the van der Waals attraction if the particle distance is greater than a minimum value, hence an electrostatically stabilized colloid requires that particles are separated by at least this distance to begin with. To this end, we often treat CNC suspensions gently with ultrasound, in order to break up aggregates. The colloid will then become kinetically stabilized, provided that the electrostatic repulsion provides an energy barrier that is substantially greater than the thermal energy k B T , where k B is the Boltzmann constant and T is the absolute temperature.
Often a shallower secondary energy minimum is found at somewhat larger separation. However, as its depth is usually much lower than k B T , there are considerable fluctuations towards larger distances and the average particle separation is defined more by the particle volume fraction than by the location of this minimum. Only if it is made significantly deeper than k B T by introducing additional attractive forces, for instance through depletion attraction [36,37,38,39,40] or if the particles can develop hydrogen bond networks with each other, will particles tend to stay in this minimum. This then gives rise to loose particle aggregation called flocculation. Flocculation is reversible, in the sense that the aggregates (’flocs’) dissolve spontaneously if the secondary minimum is made shallower again, such that thermal motion can move the particles out of the secondary minimum. Depletion attraction has been explored relatively rarely in the context of CNC suspensions, the only example known to us employing ionic depletants [38,39,40]. As a result, in this case the addition of depletant also affected the electrostatic forces in the system (see below), thus making it more difficult to draw clear-cut conclusions about the effect of depletion attraction alone. The contribution of hydrogen bonding is also not much explored, but it could become significant in certain situations, since cellulose is a very strong hydrogen bonder due to its great density of hydroxyl groups. When CNCs are dispersed in water, the extremely rich hydrogen bonding capacity of water may reduce the impact, but in non-aqueous solvents with less hydrogen bonding capacity, the hydrogen bonding of the cellulose may play a more prominent role, as will be discussed further in Section 6.
The height of the energy barrier depends not only on the particle surface charge, but also on the relative dielectric permittivity ϵ r of the solvent, being polarized by the surface charge, and the amount of ions in solution, as ions have the effect of screening the charge, thus reducing the electrostatic repulsion. The more ions in solution, the lower the potential barrier, and eventually it will be on the order of k B T , allowing particles to approach so close that van der Waals attraction dominates. This triggers particle aggregation into the primary energy minimum and loss of colloidal stability. The situation is illustrated in Figure 2 with the blue curve for low ion concentration and a stable colloid, versus the pink curve for high ion concentration and loss of colloidal stability. The ions do not need to be introduced as additives, but they are, first of all, the counter ions of the charged groups on the particles, for CNCs thus H + (directly after acid hydrolysis) or Na + (after ion exchange).
The counter ions are, of course, attracted to the oppositely charged particle surface, as described by an electrostatic potential ψ , with a maximum value ψ 0 at the particle surface. Some counter ions are fairly strongly localized the particle in what is called a Stern layer. Entropy however favors dissolution of the counter ions and the result, beyond the very thin Stern layer, is an exponential decrease in counter ion concentration with increasing distance from the surface. Because the counter ions screen the surface charge, ψ decreases with distance from the surface, and we define the distance κ 1 where the potential has reduced to ψ = ψ 0 / e as the Debye screening length or the electrostatic screening length. Quantitatively, κ 1 is typically on the order of 1–10 nm [41]. It is written as an inverse, since κ appears as the Debye parameter, multiplied by x, in the exponent of ψ , ψ ( x ) = ψ 0 e κ x . The primary energy minimum is typically at a distance below κ 1 from the particle surface, whereas the energy barrier peaks at a distance around κ 1 [41]. The location of the secondary minimum (if it exists) depends significantly on the parameters, but it is often on the order of 10 κ 1 .
We define the combination of the charged particle surface and the locally increased concentration of counter ions near the particle, up to κ 1 from the surface, as the diffuse electric double layer. The term was originally borrowed from the concept of a charged capacitor, with the attribute ’diffuse’ emphasizing the gradual decrease in counter ion concentration as we leave the charged surface. As the Debye length κ 1 is the approximate location of the electrostatic repulsion peak in Figure 2, it is often used as an estimate of the range of electrostatic repulsion. One thus sometimes says that repulsion becomes significant if the particles approach each other sufficiently that the electric double layers start overlapping.
Let us now quantify these findings somewhat. First, within the so-called Poisson–Boltzmann approximation, the Debye length can be written as [41]:
κ 1 = ϵ 0 ϵ r k B T 2 q 2 I
where we introduced ϵ 0 for the vacuum permittivity, q for the elementary charge, and I for the ionic strength of the solution. The ionic strength, a measure of the free ion content of the solution and the character of these ions, is of key importance for us, since it determines the Debye length and thereby the range of electrostatic repulsion. In many classic derivations of the Poisson–Boltzmann approximation, one finds that the definition applies to ’infinite’ distances from any charged surface. In colloids, because we have plenty of charged surfaces dispersed throughout the volume, the practical meaning is that I is defined for points far outside any electric double layer [42], where the distance to all surrounding (identical) charged surfaces is equal such that the ions here experience no effective potential [41]. In the most general case, the ionic strength is defined as:
I = 1 2 i c i z i 2 .
where the index i enumerates all ion species in solution, co- as well as counter ions, and c i and z i are the concentration and valence of each ion, respectively. Many textbooks illustrate the use of ionic strength for rather trivial situations, such as a simple solution of NaCl in water. In this case, any point in the solution is equivalent to any other, and there is no distinction between co- and counter ions, as the Na + and Cl are equally dissolved in the water. The situation with colloids is more intricate, and here it is important to remember that I should only count free ions, uninfluenced by any charged surfaces. For the case of pure CNC suspensions, without other added salts, this means that native co-ions should not be counted at all, since they are all covalently bound to the CNC surface in the form of -SO 3 groups. In a first approximation, we can thus take all counter ions as contributing to the ionic strength, obtaining an effective I c = 1 2 c c z c 2 where we set c c and z c the concentration and valence, respectively, of the counter ions. As we typically have monovalent counter ions (unless a deliberate attempt to destabilize the CNC suspension has been made) like Na + or H + , we can set z c = 1 and get I c = 1 2 c c .
Today, in the general field of colloid and interface science, it is quite common to find an alternative definition of the Debye length, valid under the assumption of only monovalent free ions with a concentration n i :
κ 1 = 1 2 π λ B n i .
Here, λ B is the distance between two unit point charges at which the electrostatic interaction energy is equal to the thermal energy, dubbed the Bjerrum length:
λ B = q 2 4 π ϵ 0 ϵ r k B T .
If we wish to better compare the two expressions for the screening length, we can insert (4) into (3), obtaining:
κ 1 = ϵ 0 ϵ r k B T q 2 n i
In other words, if n i = 2 I , the two expressions are identical. Note that n i is the concentration of free ions, i.e., it does not count the co-ions bound to colloidal particles, thus we cannot use Equation (2) with all ions in the system, but we must rather use I c = 1 2 c c . We then see that n i = 2 I c = c c , i.e., the concentration of counter ions. Within the approximation that all counter ions can be considered free and that there are no free co-ions (the latter aspect no longer holds if we add simple salts like NaCl), the two expressions are thus identical.
For commercial CNC suspensions, we know the average number of −SO 3 groups per unit mass of CNC, as this information is provided by the manufacturer. Through the requirement of electroneutrality we can thus calculate the total concentration of counter ions c c , which is equal to the total concentration of −SO 3 groups, often referred to as the sulfur content, c S . However, the value n i ( = 2 I c ) should only take the counter ions far outside the electric double layer into account, and this is more difficult to estimate. Because counter ions are adsorbed stronger to the particles the closer they are, trapping a certain fraction strongly in the Stern layer and some less strongly further out in the hydration shell (the shell of water and ions, of a thickness on the order of κ 1 , that moves with the particle as it translates in the solvent), n i (and 2 I c ) will be a bit lower than c S . Nevertheless, setting n i = 2 I c c S is a good first approximation for a CNC suspension without any other electrolytes added, but one should be aware that it overestimates the counter ion content because it neglects the excess counter ions residing near the particles.
Readers interested in learning about these issues in more details, which are far from trivial, are referred to classic treatises on colloids such as that by Israelachvili [41].

4. Liquid Crystal Formation in CNC Suspensions and Other Colloidal Nanorod Suspensions

4.1. Long-Range Orientational, Short-Range Positional Order: The (Chiral) Nematic Phase

Before going into the details of CNC-based liquid crystals, let us first introduce and explain the key liquid crystal concepts needed. The term ’cholesteric’ comes from the historical fact that the first chiral nematic liquid crystal (indeed the first liquid crystal recognized as such) was seen in a cholesterol derivative [43]. The defining feature of the nematic as well as of the cholesteric phase is long-range orientational order—the rods tend to orient along a common direction—but no long-range positional order; the density or, in case of a colloid, particle volume fraction is constant throughout the system. The preferred orientation of the rods is described by the director, n. It is a signless ( n = n ) pseudovector of unit length that does not change significantly over length scales that are at least 2–3 orders of magnitude greater than the characteristic size of the rods. The long-range orientational order renders many physical properties anisotropic, the director defining the symmetry axis. The most notable effect is probably that the liquid crystal phase is birefringent, i.e., it exhibits two extreme refractive indices, n for light that is linearly polarized perpendicular to n and n | | if the polarization is along n. Optically, the director n is thus equivalent to the optic axis of the nematic. For liquid crystals formed by rods, like CNCs, we usually have positive birefringence, Δ n = n | | n > 0 .
The orientational order in a nematic phase is not perfect [44]. We quantify the orientational order with the order parameter S, where S = 0 describes an isotropic state with no long-range orientational order and S = 1 would be a hypothetical perfectly ordered state, where every rod points exactly along n. While we are not aware of any direct experimental determinations of S in CNC suspensions, values for cholesterics typically range from S 0.4–0.9, depending on the type of liquid crystal. Colloidal liquid crystals, to which liquid crystalline CNC suspensions belong, generally have rather high orientational order, S 0.8–0.9. Even such a high value corresponds to non-negligible orientational deviations from n of individual rods, typically on the order of 10–20 [45]. De France et al. [46] measured the order parameter for cholesteric CNC suspensions with respect to the helix axis m (to be defined in a moment), finding almost perfect alignment of the rods perpendicular to m once the helix had been sufficiently aligned in a magnetic field. Unfortunately, this is not the usual order parameter with respect to the director that we are interested in here, but the very strongly perpendicular correlation with respect to m suggests that also S, the orientational order with respect to n, should be very high.
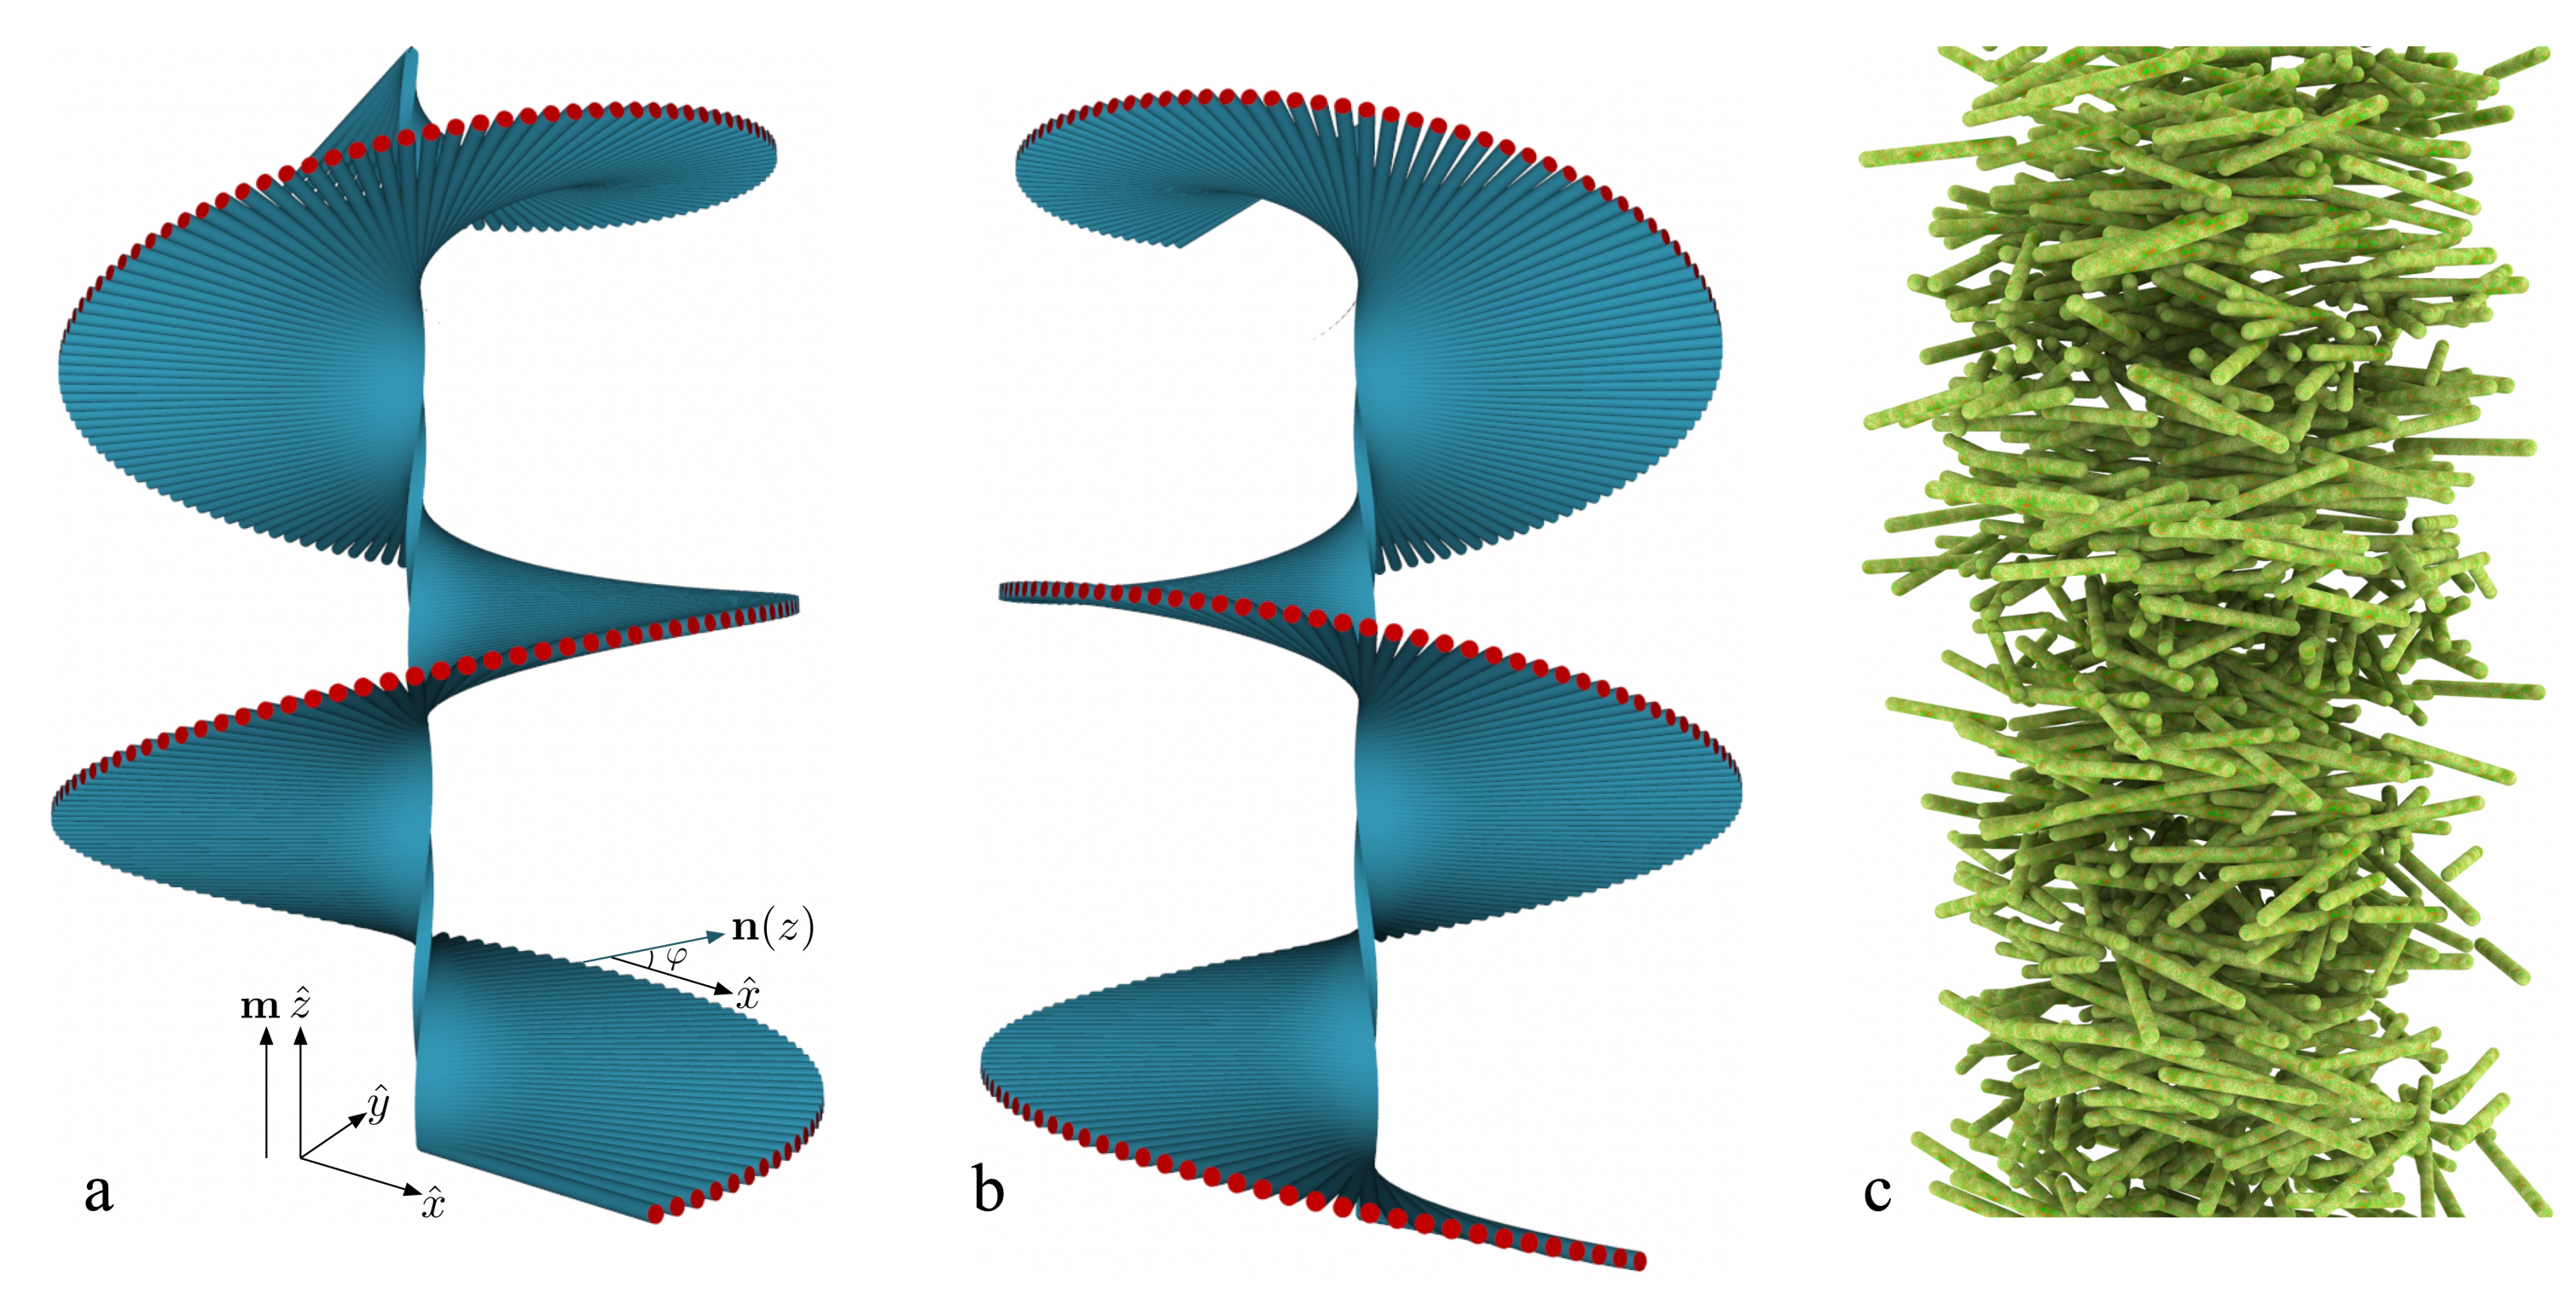
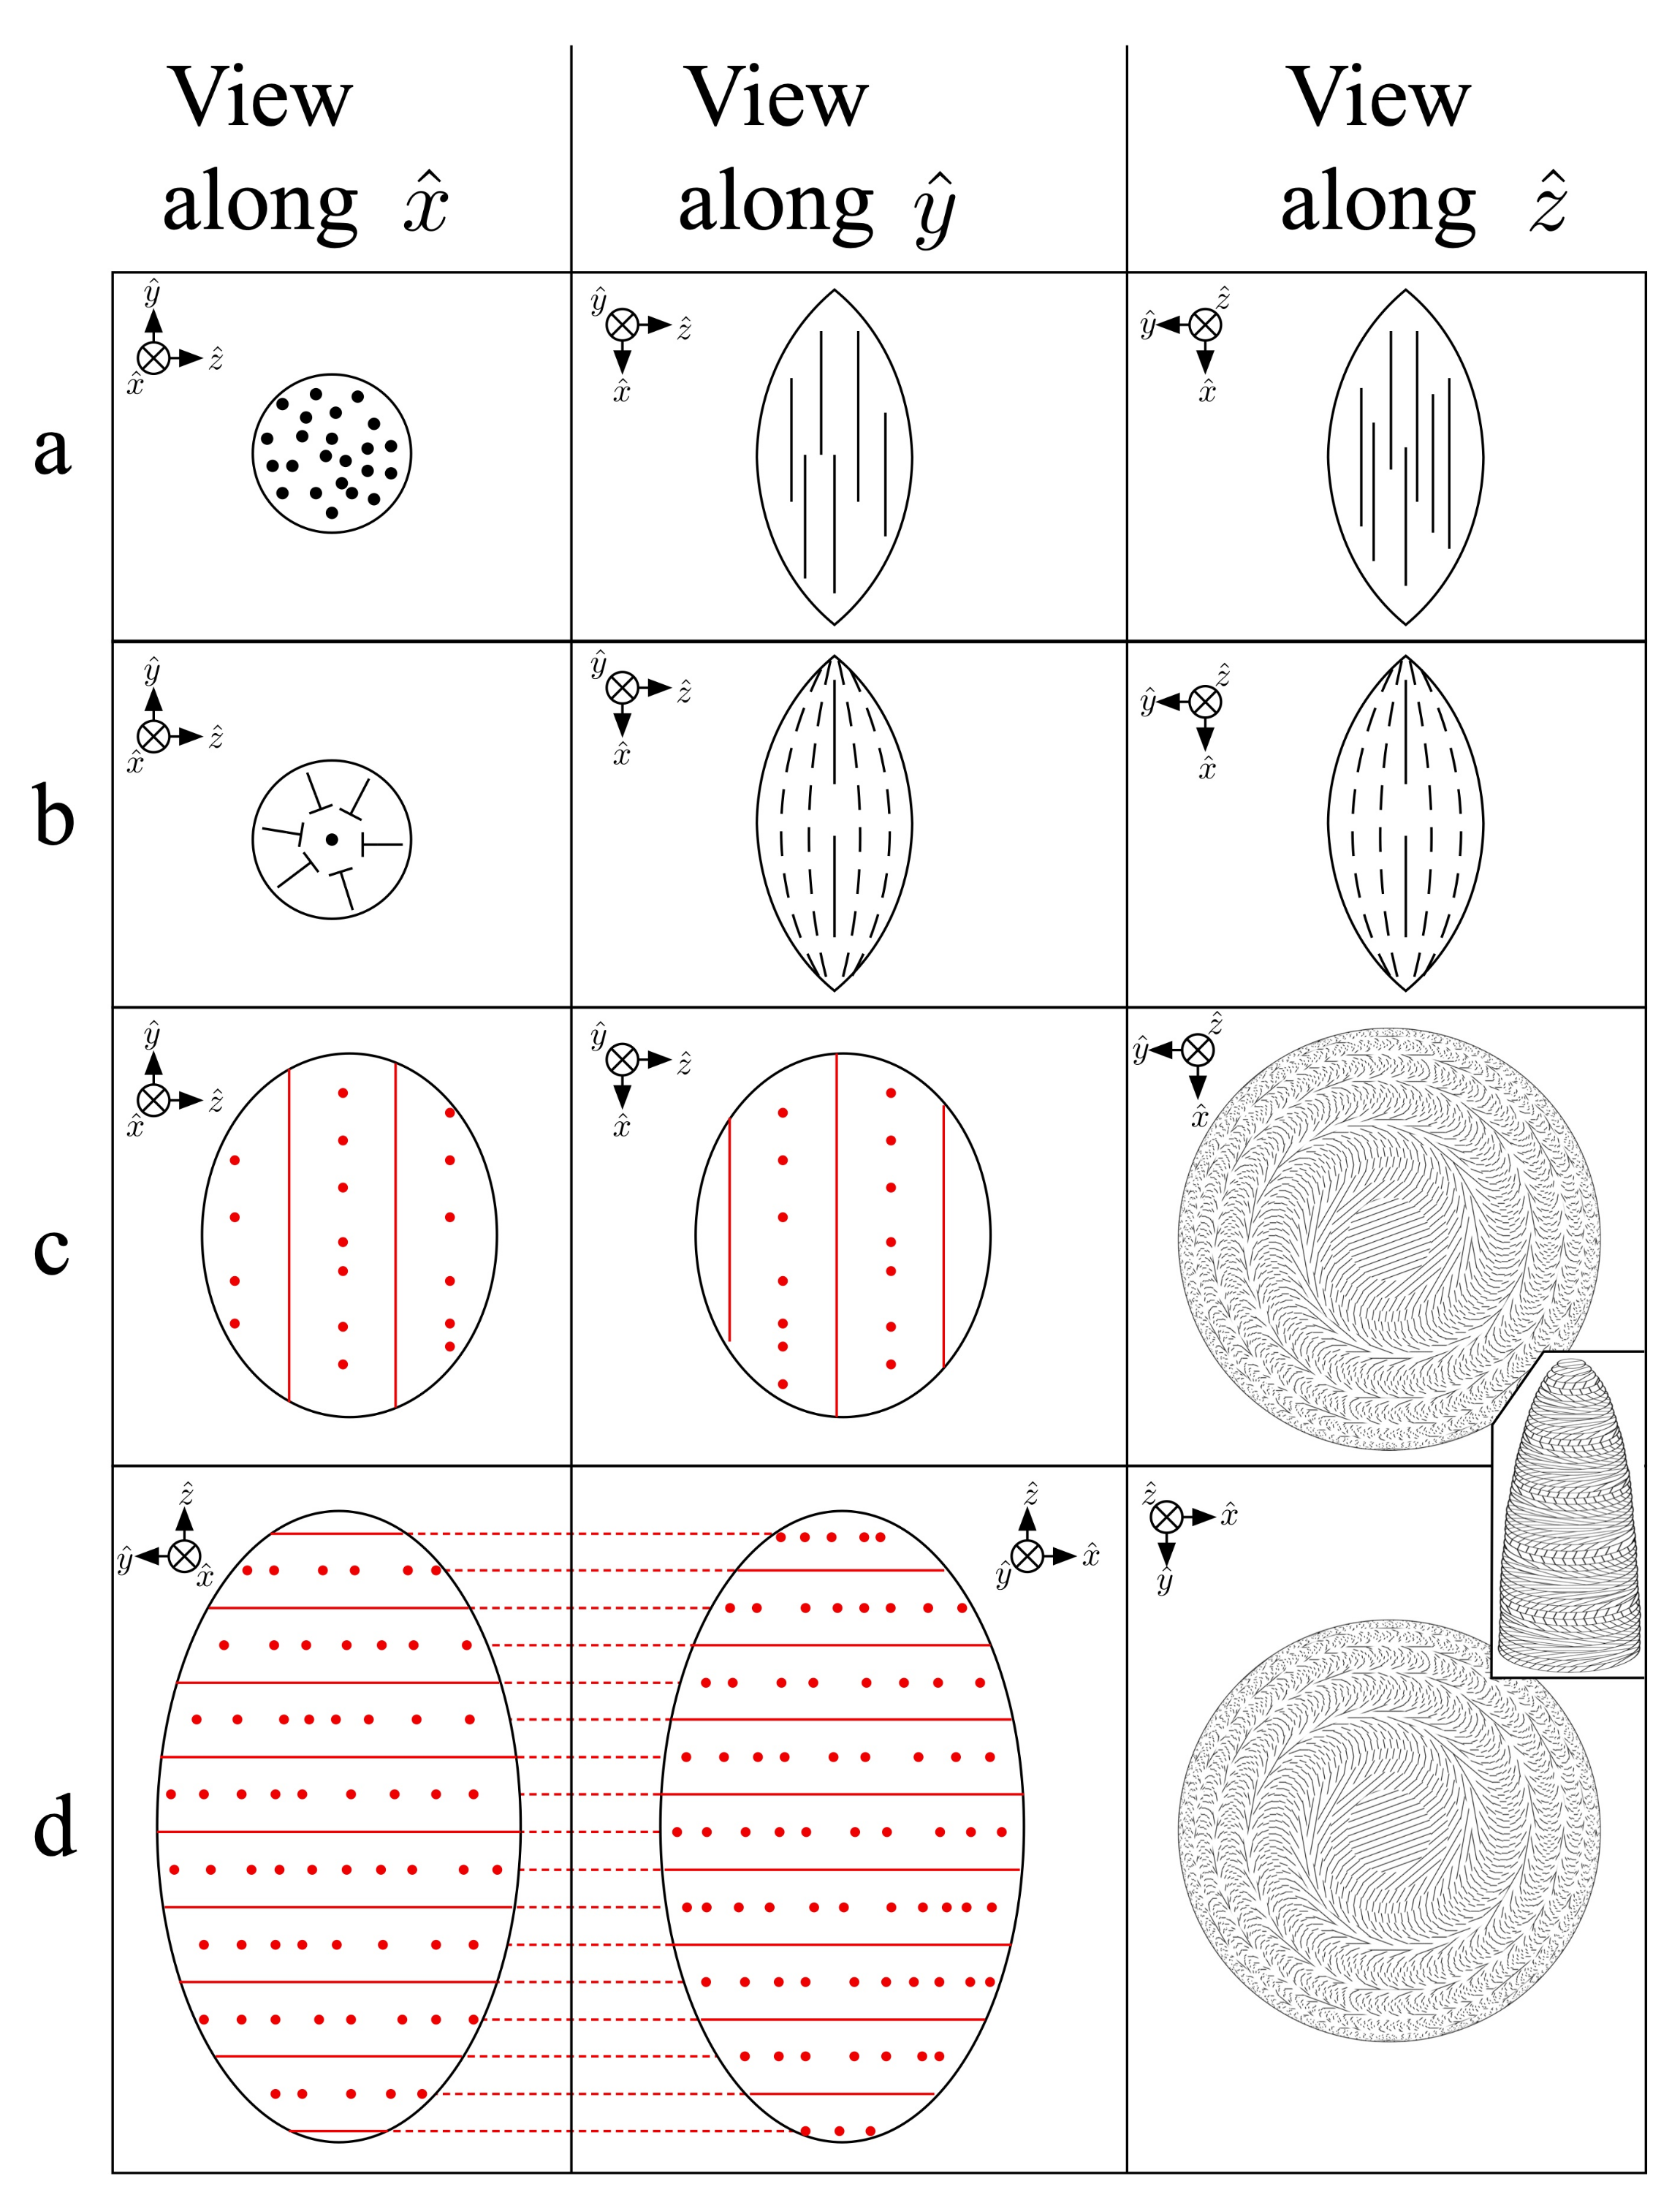
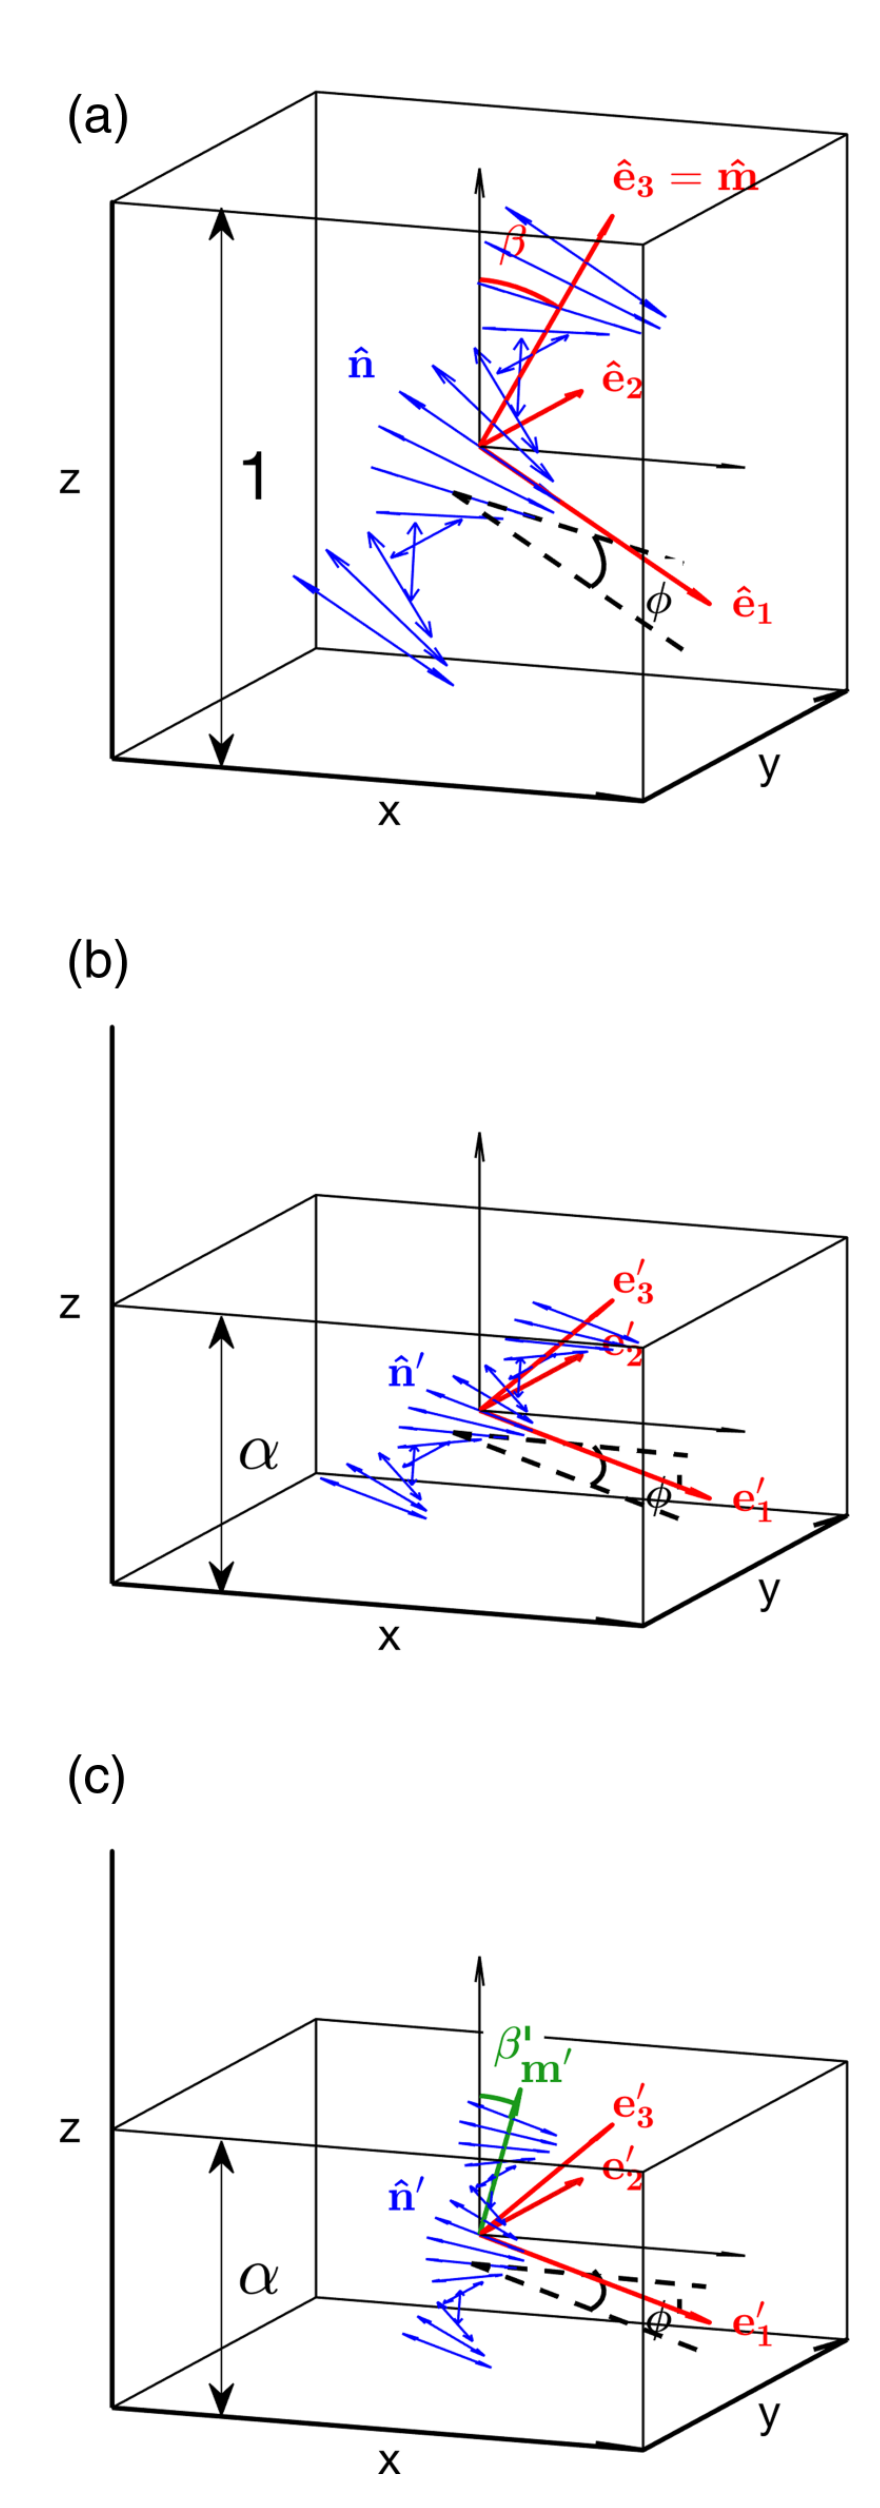
The appearance of long-range orientational order at a transition from an isotropic liquid to a nematic phase breaks the continuous rotational symmetry that prevails in the isotropic phase. In contrast, the continuous translational symmetry remains unbroken in the non-chiral nematic phase: the positions of the rods are as random as in an isotropic liquid. When we introduce chirality in cholesterics, we break another very interesting symmetry, namely mirror symmetry. The example giving name to the concept is our hands (’hand’ in ancient Greek is χ ϵ ι ´ ρ ): a left hand is distinctly different from its mirror image, which is the right hand. Chiral molecules that are mirror images of each other are said to be enantiomers. Applied to nematic ordering, as when the molecules or objects making up the chiral nematic phase exhibit chiral interactions between each other (normally the case if their chemical structure is chiral and one enantiomer is present at higher concentration than the other), this has a strong impact. While the positional ordering is unaffected, density and particle concentration remaining constant throughout the phase, the orientational order, and rotational as well as translational symmetries, are affected in subtle ways. These are not trivial to appreciate in full, and they make the cholesteric phase so deeply fascinating. Because cellulose is chiral (more specifically, it is unichiral, i.e., only one enantiomer exists naturally), CNCs are chiral, and the nematic phase formed in CNC suspensions is cholesteric. The typical consequence of chirality added to nematic ordering, readily seen in bulk samples of CNC suspensions, is that the director rotates in space around an axis m (mentioned just above) that is perpendicular to n, as we move along m. This is illustrated in Figure 3. For simplicity, we will in this section define a Cartesian coordinate system with z ^ = m , locating the director in the x y -plane. We point out, however, that we will need to define a different, external, Cartesian coordinate system for describing the macroscopic sample geometry when discussing film drying in Section 7.2, where m may point in arbitrary directions.
The rotation angle per unit distance along m is constant, i.e., d φ d z has a fixed value, where we define φ as the angle between the director at any point and the x ^ axis, see Figure 3a. The steady director rotation creates a periodic structure, since a 2 π rotation around z ^ of n gives us back the original director orientation. We call the period,
p = 2 π / d φ d z ,
the pitch of the structure (the absolute value of the twist is necessary, since the distance p cannot be negative, but the twist can be right- or left-handed, with opposite signs of d φ d z ). If we draw the director for several consecutive points along z ^ (thus along m), always setting its starting point at x = y = 0 for every z-value, we see that the tip of the director traces out a helix, see Figure 3a–b where the tip is highlighted in red. Indeed, we say that the director field in a cholesteric phase is helically modulated, a terminology we will come back to in a moment. For CNC suspensions, the helix is always left-handed, as confirmed empirically (the single handedness is due to the unichirality of the cellulose within the CNCs). Note that—just like the director—the helix axis is sign invariant, i.e., m=−m. A left-handed helix stays left-handed no matter along which direction you look at it.
With the helix axis m along z ^ , the pitch designated p, and the origin defined such that n = x ^ at z = 0 (equivalent to φ ( z = 0 ) = 0 ), we can parametrize the left-handed helical director field of a cholesteric CNC suspension using:
n = ( cos 2 π z p , sin 2 π z p , 0 )
This parametrization (more commonly done for a right-handed helix, in which case all terms appear with positive sign), and the corresponding analysis of the cholesteric structure and the consequent optical properties (see Section 7.1), was first presented by Carl Wilhelm Oseen in 1928 [47]. The significance in the difference between Equation (7) and the standard equation for a left-handed helix (with r the space coordinate, t the independent variable, a the radius and 2 π b = p ):
r = ( a cos t , a sin t , b t )
is rarely noticed: the z-component is not zero in Equation (8) in contrast to Equation (7). The fact that n z = 0 for the cholesteric director field is actually quite important. It means that n is everywhere perfectly perpendicular to the helix axis, n m . This renders the common analogy of a screw or spiral for illustrating cholesterics (we have frequently used this analogy ourselves) potentially misleading. In contrast to the steel wire in a spiral spring or the winding of a screw, which are both inclined with respect to the symmetry axis and thus truly follow a helix as described by Equation (8), the cholesteric director has no component along the helix; n z = 0 . It is really just the tip of the director in a construction as in Figure 3a,b that traces out an actual helix. If you travel along n in a helically modulated cholesteric phase you will never move up or down the helix. You must travel perpendicular to n to do so, just like you must move perpendicular to the steps of a spiral staircase in order to climb it.
In this respect, the arrangement of steps in a spiral staircase or of the base pairs in the DNA double helix, may be a better analogy to the cholesteric helix. However, also this analogy must be adopted with care in order to avoid misunderstandings. A quite common misconception is that a cholesteric phase would be discretely layered, in the sense that the molecules or rods would be localized to layers, with a well-defined thickness and inter-layer distance. Such a discrete structure with positional order along the helix axis is present in a spiral staircase and between the base pairs in the DNA double helix, but it is not the case for cholesteric liquid crystals. The critical issue is to remember that the steps in the staircase analogy correspond to the director, not to rods or molecules. Furthemore, as the director has no extension in space, and the director field is continuous, the "staircase step" would be infinitely thin and there would be infinitely many "steps" in the staircase.
Rather than layers, it is better to compare the spiral staircase steps to planes, perpendicular to m. A plane is by its mathematical definition two-dimensional, i.e., it has no thickness, just like the planes of constant n that are perpendicular to m in a cholesteric phase. Each plane is an imaginary 2D slice of the director field. There is an infinite number of planes of this type and we are free to draw them wherever we wish along m, without any need for a periodicity. The periodicity is to be found only in the distance between two successive planes that have identical n. This bring us to one of the most subtle aspects of cholesteric order: while the phase lacks order in the rod positions, just like in the nematic phase, the continuous translational symmetry is broken, in contrast to the situation in the nematic phase. A symmetry operation must bring all aspects of the phase back to the starting point, including orientational aspects, but a translation along m by a distance that is not equal to N p , where N is an integer, yields a change in orientation of n. It is therefore not a symmetry operation.
However, if we combine the translation Δ z along m with a rotation Δ z d φ d z , this is a symmetry operation. Thus, the continuous translational symmetry of a non-chiral nematic phase is replaced by a continuous symmetry in coupled translation and rotation in the cholesteric phase. This has the remarkable consequence that the periodicity of a cholesteric phase, being defined simply by the twisting strength, d φ d z , is present at any sample size, even below p. The optical consequences of this have even been demonstrated experimentally, with selective reflection being seen (albeit weakly) from cholesteric samples thinner than a single pitch length [48]. This renders cholesterics quite different from discontinuous periodic structures, like truly layered arrangements, which must have an extension of at least twice the period for the periodicity to be detectable. The idea of finite-sized layers in a cholesteric thus bereaves the phase of one of its most remarkable characteristics, while also leading our thoughts astray.
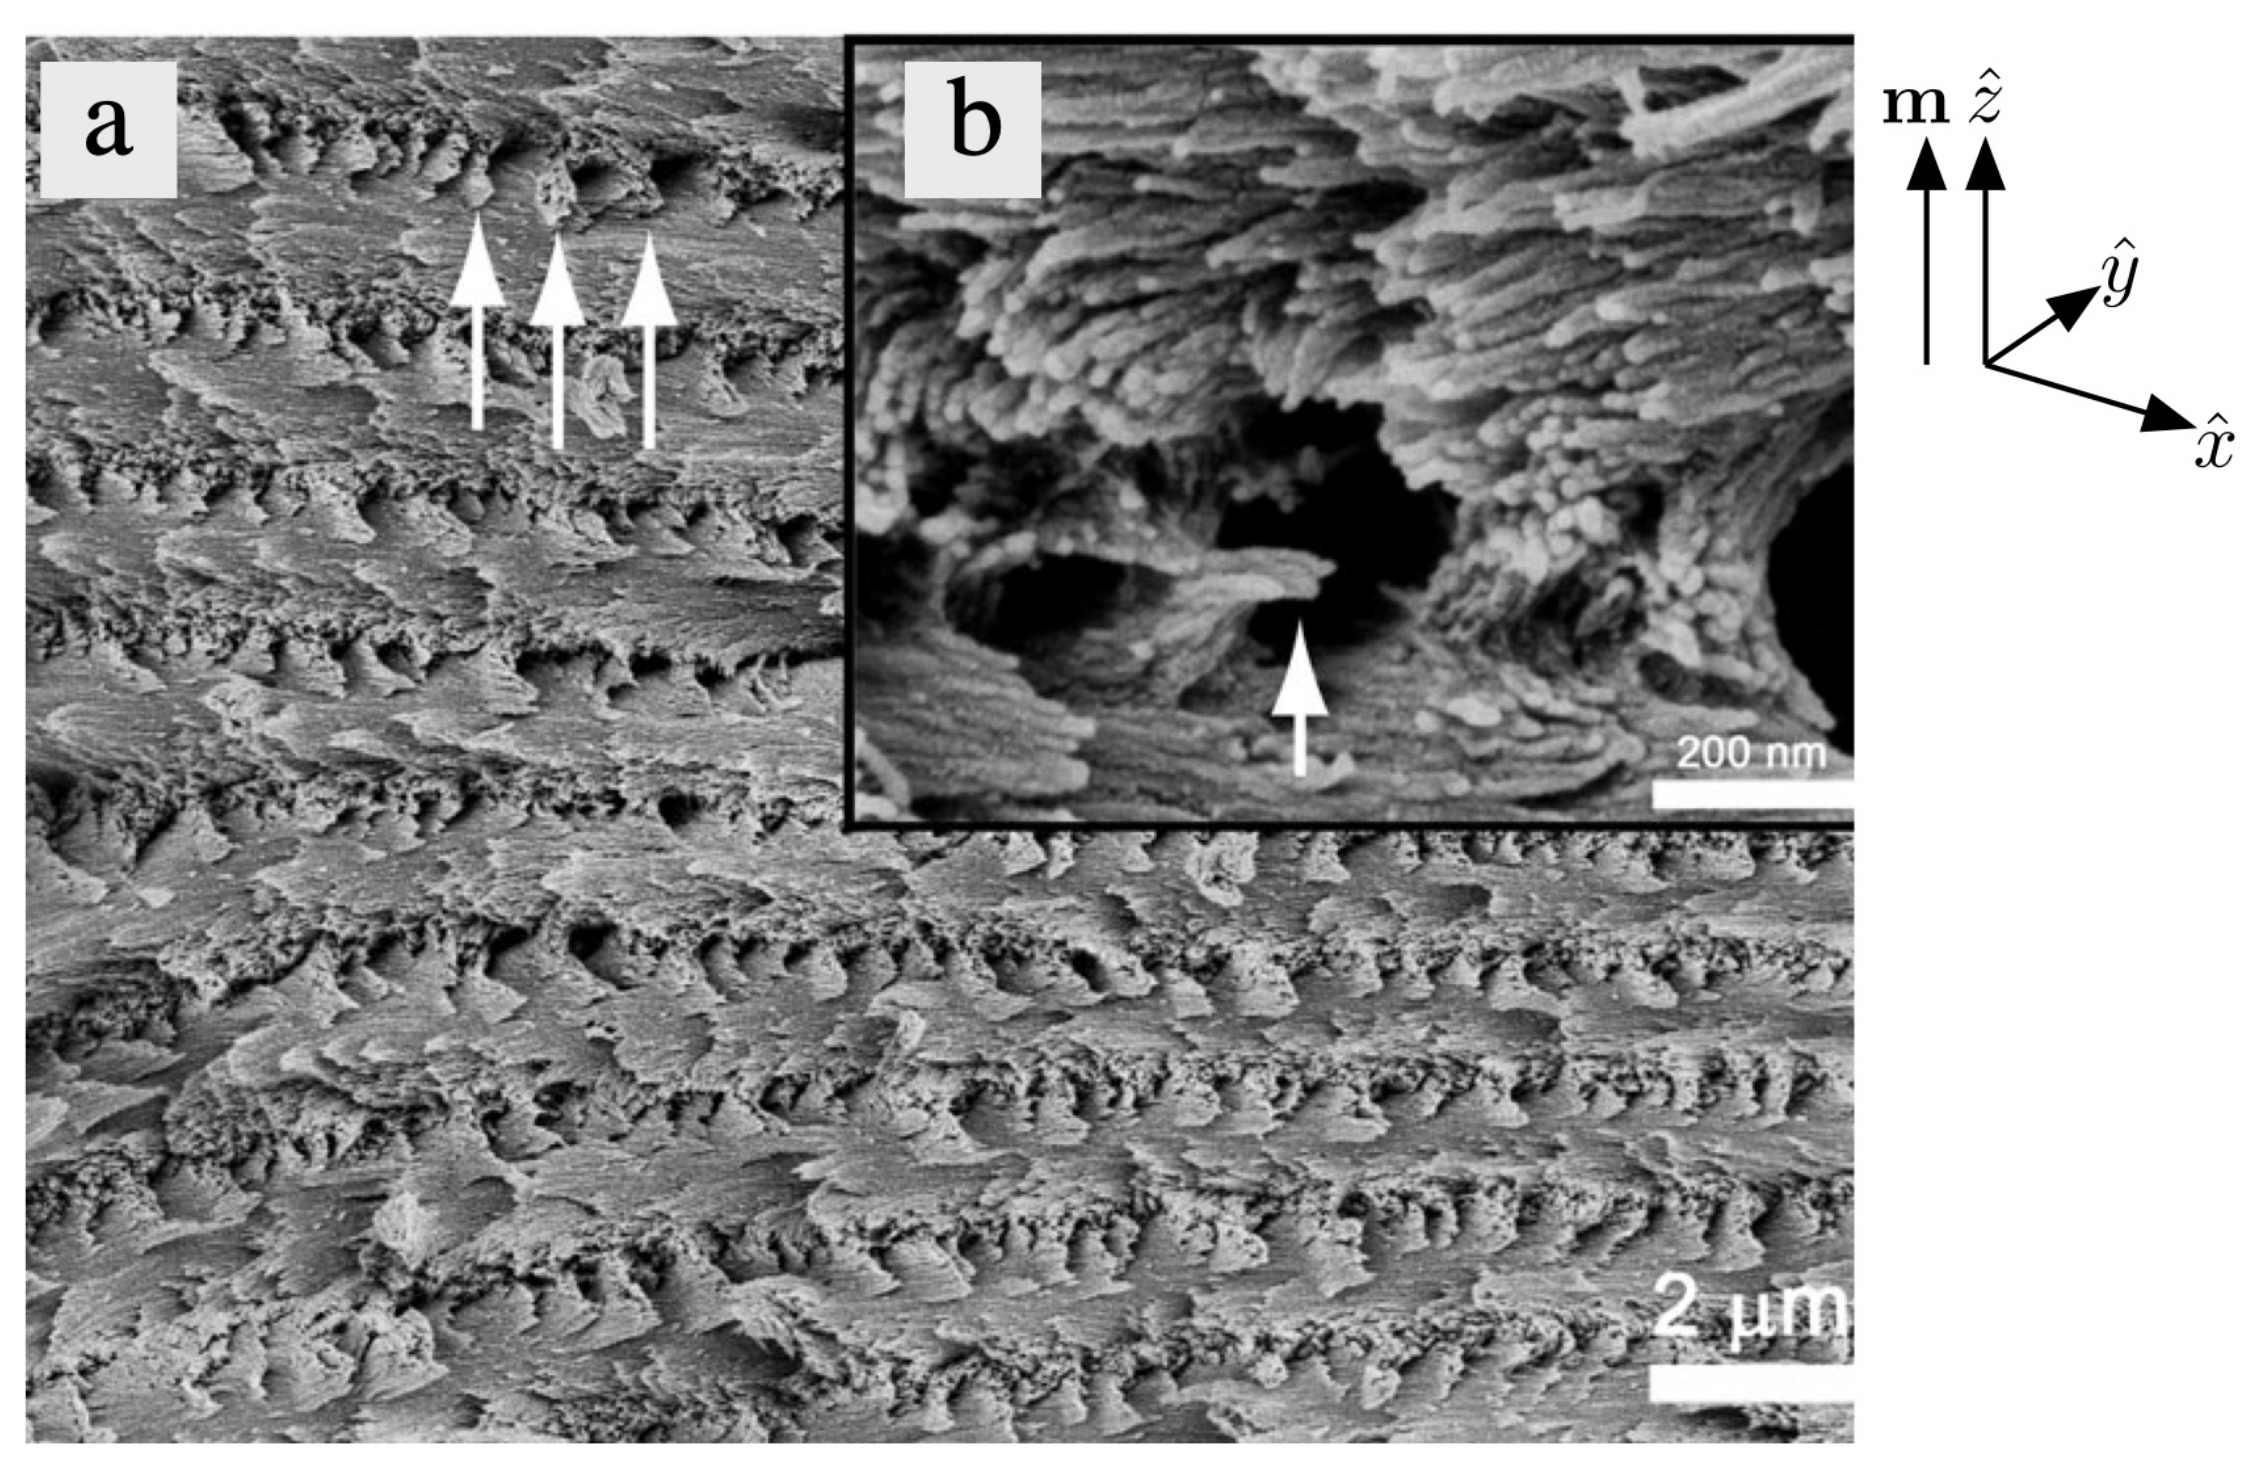
There are now many examples of beautiful scanning electron microscopy (SEM) images of surfaces of fractured films that were produced by drying cholesteric CNC suspensions, which at low resolution might give the impression that there would in fact be a layered organization of the rod-like particles themselves. While many reports indeed refer to such images as evidence of a layered structure in CNC cholesterics, the explanation provided by Majoinen et al. [49] for their exquisite high-resolution images, reproduced in Figure 4, clearly shows that no layers are needed. When assessing these images it is important to remember that we are no longer looking at a liquid crystal phase, but a solid that has been formed by compressing a kinetically arrested cholesteric structure (see Section 7.2), bringing the CNC rods into direct contact. This causes some clustering and probably increases the degree of order. Such close contacts and clustering are certainly not the case in the liquid crystalline state, in which electrostatic repulsion keeps the rods individualized and thermal fluctuations keep them in constant motion.
Once the fracture is done, the orientation of the main plane of the fracture (which in the best case contains the helix axis, m) selects two orientations of n that represent opposite extremes in terms of mechanical properties. Let us assume that the helix is indeed in the fracture plane and let us for simplicity retain m = z ^ and choose x ^ to be in the same plane, i.e., the fracture plane is an x z plane, with y ^ its normal. Let us make the definition complete by setting y = 0 in the fracture plane. Wherever n is along x ^ , i.e., it is in the fracture plane, only the comparatively weak van der Waals forces and inter-CNC hydrogen bonds resist against the fracture. Even though hydrogen bonds should not be considered weak, it is still reasonable to expect the film to break quite cleanly along y = 0 at these points. In contrast, when n is along y ^ , perpendicular to the fracture plane, covalent bonds within the crystalline CNCs would have to be broken to obtain a clean cut at y = 0 . Precisely because the cholesteric phase does not have any positional order of the rods, the majority of CNCs in regions with n y ^ will be crossing right over the fracture plane, beginning at y < 0 and ending at y > 0 , no matter where we choose our y = 0 fracture plane. Because the individual CNCs are unlikely to break, they will instead stick out from the fracture plane, see Figure 4, remaining partially embedded in either of the two surfaces created during the fracturing process (one with y < 0 and one with y > 0 ), at all locations where n y ^ . Because this happens twice per helix period (another manifestation of n=−n), the SEM image shows CNCs sticking out of the fracture plane twice per helix period. It also shows holes next to the protrusions, left when the CNCs that ended up sticking out from the other fracture section were removed. The resulting periodicity of clean versus rugged cut may at low resolution give an impression of a layered structure. The high-resolution images presented by Majoinen et al. (Figure 4) show very well that this is not the case; there is no positional order for the individual rods. Such images are very instructive, but unusual.
Another significant aspect that is not always acknowledged is that the helical pitch in an equilibrium cholesteric has nothing to do with the average particle separation distance of CNCs (or other colloidal nanorods) in the phase. As the (chiral) nematic phase has no long-range positional order, the CNCs are uniformly distributed throughout the phase and the average particle–particle distance is set by the volume fraction of the particles. If the helix of the cholesteric phase shortens at constant CNC volume fraction, only the director field rotation d φ d z gets more rapid; there is no closer approach of the CNCs. Two CNC suspensions with the same volume fraction of particles but different values of p will thus have identical average distance between the nanorods. If the ionic strength I is increased, allowing closer encounter of the rods, this may have an impact on the helix pitch, but the average particle separation is not reduced; assuming that the colloid is still stable and no aggregation or flocculation takes place, it cannot be reduced since otherwise the rods would leave unoccupied space in the system. However, the higher I, and consequent reduction in κ 1 , allows closer encounters as a result of fluctuations, which can be expected to strengthen the chiral interactions between rods and thereby increase the twisting d φ d z . This would explain a reduction in helix pitch upon increased I without any change in the average rod separation distance.
We hope it is now clear that the cholesteric helical modulation of the director field is something quite unique. It is scientifically very interesting, but also rich in potential misinterpretation pitfalls. Let us end this section with one final example. It is a quite common misconception that a helix would be required for the phase to be chiral. The helix is an expression of chirality of the phase, but it is not a prerequisite. Whether a helix forms or not, the cholesteric phase remains chiral as long as the chiral interactions are active between the rods (or molecules) building up the phase. Fundamentally, the fact that the building blocks lack mirror symmetry, and that one enantiomer is present at higher concentration than the opposite, renders the phase chiral. With no impact on the chirality of the phase, a cholesteric helix can unwind to the extent that p reaches infinity. In rare occurrences, this can happen spontaneously at a certain temperature, composition or pressure of a cholesteric phase that under other circumstances forms a director helix with finite pitch. More commonly, the phenomenon can arise as a result of strong confinement or application of an external field. Regardless of its origin, such helix unwinding should not be described as “dechiralization”, “cholesteric→nematic transition” or similar. A system with constant composition cannot undergo a transition between nematic and cholesteric.
For the majority of cholesterics (including all cholesteric CNC suspensions studied experimentally), which do not exhibit a twist inversion, the existence of an equilibrium, unconstrained helix pitch, p 0 , could be taken as the decisive parameter regarding whether we should refer to the phase as nematic or cholesteric. If we can define a p 0 < , then the phase is cholesteric. Thus even if we prevent helix formation by confining the phase in a small droplet or applying an external field, imposing an effective pitch p , the fact that the phase still exhibits a well-defined natural pitch p 0 < makes a very clear distinction from a non-chiral nematic phase. It does not matter if p 0 enters only in the free energy calculations or if it is allowed to express itself as a helix that we can detect experimentally; the phase remains cholesteric. We will see in Section 4.4 that this is not just a matter of semantics, but there is a real impact on the physics.
A significant fact in this context is that the equilibrium pitch p 0 of CNC-based cholesterics is always much larger than the scale of a rod forming the liquid crystal phase. The pitch typically ranges from about 3 to 100 μ m, thus three to five orders of magnitude greater than a CNC diameter. What this means is that chirality effects are secondary compared to the local nematic ordering of the nanorods, hence need not be considered when elucidating the origin of this ordering, as described in Section 4.3. In this review we will preferentially use the term “nematic” when we discuss local phenomena, such as the steric interactions at the heart of liquid crystal formation, that are not related to chirality or the helical modulation. To emphasize that an issue applies equally to non-chiral and chiral nematics, we sometimes write “(chiral) nematic”.

4.2. Nematic Elasticity

The long-range orientational order has the remarkable consequence that a (chiral) nematic phase exhibits an elastic response, in distinct contrast to regular isotropic liquids. This manifests itself, not as an elastic force arising from a distortion of the volume of material, as in solid state elasticity, but instead in elastic torques responding to deformations in the director field, acting to bring it to a uniform orientation of n. Only if a volumetric distortion has an impact on the director field will it cause an elastic response. Conversely, if confinement within a certain volume leads to deformation of the director field, the elastic response of the liquid crystal can—if the interfacial tension is sufficiently low—be strong enough to distort the volume even if no external force acts to deform it, as will be discussed at length in Section 4.4. The development of our understanding of nematic elasticity [47] can be traced back to early work by Oseen and Zocher, with later refinement by Frank (who coined the modern terminology) and by Saupe and Ericksen [50].
We analyze the nematic elasticity in terms of the increase in free energy density that a deformation gives rise to, using a set of elastic constants with the dimension of force (N). Each elastic constant quantifies the cost of a particular elementary deformation of the director field. The three elementary bulk deformations splay, twist and bend, which are the ones we need to consider in this review, are illustrated in Figure 5. The modern formulation of the elastic energy density (per unit volume) due to deformations of the (chiral) nematic director field can be written, for the case of a cholesteric phase:
f e = 1 2 K 1 · n 2 + 1 2 K 2 n · ( × n ) q 0 2 + 1 2 K 3 n × ( × n ) 2 1 2 K 24 · n · n + n × × n
While this expression may look daunting to some, it is actually quite straightforward to interpret, given the right explanations. The energy density is a sum of four terms, each a product of an elastic constant— K 1 for splay, K 2 for twist, K 3 for bend and K 24 for saddle-splay—and the derivative of the director field that describes the corresponding deformation. For the second term, describing twist, the derivative is compared to the natural twisting of cholesterics; we will come back to this modification in a moment. The elastic constants, with a magnitude on the order of pN, tell us how much a certain deformation ’costs’ in terms of increased free energy density of the (chiral) nematic. The derivatives, in turn, tell us how strong the deformation of each type actually is in a particular director field configuration. The first three terms, corresponding to splay, twist and bend, are all positive, since K 1 , K 2 and K 3 are all greater than zero and as each director field derivative is squared. This means that any such deformation increases the energy density. The fourth term, describing so-called saddle-splay deformation (the director field has negative Gaussian curvature, as in a horse saddle), can be negative or positive, hence this term can actually promote spontaneous distortion of a director field, as has been observed in lyotropic liquid crystals in strong curved confinement [51,52,53]. However, for this review we will ignore the fourth term, as its influence is negligible in bulk nematics or cholesterics, and in the situations of confinement that we will consider here it has been proposed that its effect can be represented by a renormalization of the splay elastic contribution [54].
An unusually large value of an elastic constant tells us that the corresponding deformation is unlikely to occur with significant strength, as it greatly increases the free energy. Conversely, if an elastic constant is unusually low, the deformation costs almost no energy, and we may expect thermal fluctuations to induce significant deformations of this type. If it is plausible to assume that a certain deformation will not occur (for instance due to an excessively large elastic constant or due to confinement that prevents the deformation) we may drop the corresponding term from Equation (9), as we can then assume that the derivative is zero. Note that the bulk deformation elastic constants, K 1 , K 2 and K 3 , cannot be zero, or approximated as such, as this would correspond to the unphysical situation that the deformation costs no energy, thereby allowing infinitely strong deformations.
The second term deserves special attention for this review. It describes twist deformation, a term that is straightforward to understand with respect to the uniform director field of a non-chiral nematic, where any twist amounts to a deformation. However, for a cholesteric phase, a twisted director field is the natural state, the ground state, because the helical modulation that develops spontaneously is equivalent to constant twist. Thus, a twist deformation in a cholesteric phase is not a twist per se, but any deviation from the natural twist d φ d z 0 (again assuming m = z ^ ), corresponding to the equilibrium helix pitch p 0 , or its corresponding wave vector magnitude,
q 0 = ± 2 π / p 0 ,
which enters the second term in Equation (9). This has the interesting consequence that a uniform director field, from the point of view of a cholesteric, exhibits a twist deformation! The director field has, in this case, been deformed by untwisting from its natural, twisted, state, which comes at a cost that is described by the second term in Equation (9). This is why it is so important not to refer to a cholesteric phase that has been prevented from forming a helix as if it were no longer cholesteric. A non-chiral nematic is in its ground state without a helix ( q 0 = 0 ), but a cholesteric in which the helix formation is suppressed is in a frustrated high-energy state ( q 0 0 ). A non-helical cholesteric and a non-chiral nematic may appear similar, but in terms of their free energies they are very different. We may note by comparison with Equation (6) that, numerically (also including the sign), q 0 = d φ d z 0 .
Note that, in contrast to the pitch p (and its equilibrium value p 0 ), the helix wave vector can be positive or negative-signed (hence the ± sign in Equation (10)), the first corresponding to right-handed and the second corresponding to left-handed twist. Thus also the choice of handedness given by chirality is taken care of by Equation (9): a twist with pitch p 0 but with the wrong handedness, giving the derivative in the second term the value q 0 , raises the energy by 2 K 2 q 0 2 . The twist deformation term of Equation (9) can of course describe a non-chiral nematic just as well: we achieve this by setting q 0 = 0 .
Equation (9) gives us the elastic energy density, which means that we must integrate over the volume of our (chiral) nematic in order to obtain the actual elastic contribution to the free energy of the phase. Since each derivative is a second order spatial derivative, each bulk term in Equation (9) is proportional to 1 / r 2 , where r is a characteristic length describing the deformation. For twist, the characteristic length is the pitch of the twisting and is thus independent of location, whereas for splay and bend, the characteristic length is the distance from the ’source’ of splay or the ’center’ of bending. If splay or bend is induced by confinement of the liquid crystal in a small volume, the characteristic length of splay or bend will be on the order of the volume radius. Therefore, when we calculate the elastic energy contribution by integrating the elastic energy density over the volume, effectively multiplying by r 3 , we see that the elastic free energies of splay and bend scale as r. This is an important observation for the analyses to follow in Section 4.4. However, let us first look into a more fundamental question.

4.3. The Origin of Nematic Phase Formation According to Onsager

What is the reason for the long-range orientational order in nematic nanorod suspensions? This question was first answered by Lars Onsager in the late 1940s [55], in a landmark theoretical paper that was inspired by experimental observations of nematic ordering in suspensions of tobacco mosaic virus (TMV), rod-like viruses with dimensions not too different from those of CNCs. The outcome of Onsager’s analysis is that the nematic ordering is of entropic origin: the free energy is reduced by developing long-range orientational order, because the loss in orientational entropy is more than compensated by the gain in translational entropy. By aligning along a common direction, the rods are free to translate much longer distances without being blocked by each other, compared to the situation of randomly oriented rods, which will cross each other’s paths much more frequently. The argument can also be reformulated in terms of excluded volume, the space not accessible for a rod due to the presence of other rods, restricting the freedom of motion and thus reducing the entropy: by lining up along a common direction, the overall excluded volume is minimized, raising the translational freedom and thus increasing the entropy, thereby reducing the free energy.
However, the gain in entropy from ordering happens only if the rods are sufficiently anisometric (anisotropic in shape) for the reduction in excluded volume per rod to be significant, and only if the volume fraction of rods is high enough for this to have any effect on the system as a whole. Intuitively, the higher the aspect ratio, the lower the required volume fraction for ordering to take place. Onsager quantified this, finding that the effective rod volume fraction ϕ , upon increasing from zero, at which the isotropic phase becomes unstable is:
ϕ 0 = 3.3 d e / L e
where d e is the effective rod diameter and L e is its effective length (we will come back to the meaning of ’effective’ in a moment). If ϕ > ϕ 0 in an Onsager suspension of nanorods, the nematic phase starts to nucleate. The phase transition is of first order and there is a significant coexistence regime, requiring a distinct difference between the two phases. For the non-disperse system that Onsager considered, where all rods are identical, the difference lies not only in the degree of order in each phase, but also in the volume fraction of rods. Where the nematic phase nucleates, it does so with a greater effective rod volume fraction:
ϕ 1 = 4.5 d e / L e
The increased rod volume fraction can be easily rationalized by considering the greater packing efficiency provided by the long-range orientational order. The value ϕ 1 can be considered the stability limit of the nematic phase, upon decreasing from a volume fraction ϕ > ϕ 1 .
For a global rod volume fraction ϕ , where ϕ 0 < ϕ < ϕ 1 , we have an isotropic phase with local ϕ iso = ϕ 0 coexisting with a nematic phase with local ϕ nem = ϕ 1 . The relative volume fraction of nematic phase increases from zero to one as the global ϕ increases from ϕ 0 to ϕ 1 . The higher rod volume fraction of the nematic phase, together with the fact that the rod material is almost never density matched with the solvent, means that a sample in the phase coexistence region, with ϕ 0 < ϕ < ϕ 1 , will separate macroscopically in a gravitational field, normally with the denser nematic phase sinking to the bottom and the less dense isotropic phase floating to the top. Should the rod material be less dense than the solvent, the opposite behavior would result, but we are not aware of any such system. This gravity-driven macroscopic separation of nematic from isotropic phase is the standard way of mapping out the coexistence region of the phase diagram: because the nematic phase is birefringent, due to the long-range orientational order, it appears bright between crossed polarizers, in contrast to the isotropic phase, which appears dark. An example is shown in Figure 6. When doing this type of experiment, it is imperative to wait long enough for gravity to do its work properly, in order to get correct results from such an investigation. The time required can be considerable, on the order of months. Indeed, beyond a certain CNC mass fraction, it will be infinite, as discussed in Section 5.
An important complication in practical research compared to Onsager’s theory is that the effective rod volume fraction ϕ is typically not experimentally accessible. Moreover, the ratio between mass and volume fraction of rods generally changes with the amount of rods. The reason is that the relevant volume is not the volume of each physical rod, approximately described by the diameter d and length L, but the total excluded volume, amounting to the volume of the actual rod plus the repulsion zone around it, approximately quantified by κ 1 (see Section 3). The effective volume of a rod is thus given by π ( d / 2 + κ 1 ) 2 ( L + 2 κ 1 ) π ( d / 2 + κ 1 ) 2 L . In other words, the effective rod diameter d e is significantly affected by the electric double layer, as κ 1 is on the order of the CNC diameter, whereas the effective length L e can be approximated with the physical length L, since L is at least two orders of magnitude greater than κ 1 . A further complication is that CNCs are not perfect rods, they are highly disperse with strong variations in L and d, and d can vary even within one and the same CNC.
Because κ 1 decreases with increasing ionic strength I, and because each suspended charged rod contributes to I as its counter ions are dissociated and dissolved in the water, κ 1 decreases with increasing rod content. In other words, the effective diameter, and thereby the effective volume, of a rod decreases as more rods are added to the suspension. This means that the ratio between mass and volume fraction decreases with increasing CNC mass fraction. At the same time, decreasing κ 1 increases the effective rod aspect ratio, thus decreasing ϕ 1 . Therefore, while Onsager predicts a linearly increasing volume fraction ν N of nematic phase as the rod volume fraction increases from ϕ 0 to ϕ 1 according to:
ν N = ϕ ϕ 0 ϕ 1 ϕ 0
the increase in ν N as a function of mass fraction w (with a w 0 corresponding to ϕ 0 and a w 1 to ϕ 1 ) is more complex. This is because the ratio w 0 / ϕ 0 is different from w 1 / ϕ 1 , because I increases when w is raised from w 0 to w 1 , affecting both ϕ and ϕ 1 .
In an elegant demonstration of the significance of I for the phase diagram of colloidal liquid crystals [56], Dong et al. prepared a series of CNC suspensions with H + counter ions to which varying amounts of HCl had been added. The amount was selected such that all samples had identical ionic strength, i.e., the less CNC in suspension, the more acid was added. When plotting the phase diagram of this constant-I suspension series, a linear behavior as in Equation (13) was seen also versus mass fraction. In a follow-up study [57], Dong and Gray carried out a systematic exchange of the counter ion associated to the CNC surface, finding significant impact. We will not discuss the results with organic counter ions, which were amphiphilic and thus a rather special case, but it is interesting to look at the study of monovalent inorganic counter ions. The authors found that the onset of liquid crystal formation increases with size of the counter ion, such that w 0 H + < w 0 N a + < w 0 K + < w 0 C s + . Interestingly, the plot of cholesteric phase fraction versus CNC mass fraction for different counter ions suggests that the linearity also increases with size of counter ion, to the extent that the mass fraction when the full sample became liquid crystalline was almost independent of the counter ion type. Dong and Gray also studied the effect of counter ions with higher valence than 1, e.g., Ca 2 + . As one might expect, such ions rapidly destabilize CNC suspensions, an effect that may be attributed to the stronger screening effect (Equation (1)) and specific adsorption onto the CNC surface. Another important factor is that divalent counter ions act as ’crosslinking agents’, a single counter ion binding together two CNCs. This effect was studied in the formation of hydrogels [58].
Abitbol et al. [32] wished to investigate the impact of surface charge, preparing CNCs with approximately the same aspect ratio, varying between 18 and 20, but the surface charge was altered between 0.27–0.89% sulfur (the exact meaning of the percentage was not specified). The raw material was the same, and only the acid hydrolysis conditions were varied. All suspensions formed a cholesteric phase, but the onset w 0 shifted to higher concentration with increasing surface charge. This outcome might seem surprising considering that stronger surface charge would be expected to give stronger repulsion. However, it also means a greater release of counter ions with every CNC rod. Note that the Debye length according to Equations (1)–(5) is dependent only on I, not on the surface charge. Thus, as the authors concluded, the outcome is due to the increase in I and the consequent reduction in κ 1 that comes with increased surface charge.
Several extensions and improvements of Onsager’s original theory have been developed over the years, coming to slightly different quantitative predictions but retaining the qualitative conclusions. Most significantly, various more recent treatments [59,60,61,62,63,64] have taken the effect of dispersity into account, a parameter that is very much a characteristic of CNCs, and which will play a significant role in Section 4.5. We should also emphasize that the Onsager theory was developed for the liquid crystal class called lyotropic, to which colloidal nematics and cholesterics belong [65]. The liquid crystals found in many modern display devices belong to the class of thermotropic liquid crystals. The hallmark of lyotropics is that the liquid crystalline order develops for particles or molecule aggregates suspended in an isotropic solvent, such as water in most CNC suspensions. In contrast, thermotropic liquid crystals have no solvent; their molecules form the liquid crystal phase themselves. The entity forming the liquid crystal phase, whether the particles of colloidal liquid crystals or the molecules of thermotropics, are often referred to as mesogens. They differ quite strongly between lyotropics and thermotropics, a typical thermotropic molecule having a length on the order of 3 nm and width about 0.5 nm, thus very much smaller and with much smaller aspect ratio than lyotropic mesogens such as CNCs. The Onsager theory would fail to explain liquid crystalline order in thermotropics, for which the corresponding theory was developed by Maier and Saupe [66]. We will not discuss thermotropic liquid crystals in this review, apart from occasional comparisons with CNC suspensions and other colloidal lyotropics when this is of interest.

4.4. Isotropic–Nematic Phase Coexistence and the Nucleation of Tactoids

If the global rod volume fraction of an initially isotropic CNC suspension is increased to ϕ > ϕ 0 , for instance in a dilute CNC suspension drop that is left to dry to form a colorful film, the cholesteric phase nucleates at various points of the isotropic background as tiny droplets, which grow in size as ϕ increases. These nuclei are called tactoids, a term originally introduced by Zocher [67] for the unusually shaped, spindle-like nuclei of nematic phase common in colloidal nematics. He had been the first to observe and report these nuclei a few years earlier, in suspensions of needle-like crystals of vanadium pentoxide [68]. The motivation for the term can be found in the Ancient Greek word τ α ´ ξ ι ς (táxis) which can be translated as "order", hence it is a very fitting term for a nucleus of a phase with nematic-like order. It has since been used to describe nematic or cholesteric nuclei, spindle-shaped or not, in many systems [69,70,71,72,73]. A good historical overview of the development of the empirical understanding of tactoids has been published by Sonin [74]. If instead of a nematic or cholesteric phase, a smectic liquid crystal develops directly from the isotropic phase, the corresponding nuclei are called bâtonnets, reflecting their strongly elongated shape promoted by smectic order [75,76,77].
The first attempt to explain tactoid formation was presented by Langmuir in 1938 [78]. Being more than a decade before Onsager’s explanation of nematic ordering in nanorod colloids, this was in many respects premature. In order to understand the tactoid shape, there are a few peculiarities of the nuclei of nematic phase in a nanorod suspension that we must take into account. The first is that the tactoid and its surrounding are very close in composition, thus the interfacial tension γ (equal to the energy per unit interface area) is extremely low, at least provided that n adopts its energy-minimizing orientation at the boundary of the nematic tactoid. Which this orientation is, and how strongly it is imposed, is dictated by a dimensionless parameter W called the anchoring strength at the boundary. With the interfacial energy density for an arbitrary director orientation at the tactoid boundary written f i = γ ( 1 + W ( c · n ) 2 ) , where c is the boundary normal, we see that W effectively quantifies the difference in interfacial energy density for the unfavored versus the favored alignment. Note that f i has the unit N/m, as it is an energy density per unit area. With this formulation of f i , a value W > 0 favors tangential alignment ( ( c · n ) 2 = 0 gives the minimum interfacial energy penalty) whereas W < 0 favors orthogonal alignment ( ( c · n ) 2 = 1 gives the maximum interfacial energy reduction). For tactoids of nematic or cholesteric phase in colloidal nanorod suspensions, W > 0 , i.e., the favored director alignment is tangential to the tactoid boundary. This can be rationalized by considering the impact of the very high aspect ratio of the mesogens: orthogonal orientation would come with significant translational entropy penalty for any mesogens approaching the boundary, which they cannot escape, thus raising the free energy at the boundary considerably [54]. In fact, it appears that this entropic penalty is so large that W is quite significant in magnitude, playing an important role in determining the characteristics of tactoids of small size.
We are only aware of one attempt to measure the interfacial tension γ between the isotropic and cholesteric phases in a CNC suspension, due to Chen and Gray [79], and the reported values were on the order of μ N/m (for the equilibrium configuration with n tangent to the tactoid boundary, ( c · n ) 2 = 0 ). To put this into context, the interfacial tension of oil droplets in water stabilized by surfactants is on the order of 30 mN/m. The same comparatively high values apply for many studies of thermotropic liquid crystal droplets dispersed in chemically different continuous phases like water or glycerol, the interface often being stabilized by surfactants or polymers. With the extremely low value of γ for the isotropic-nematic interface of tactoids in CNC suspensions it is not difficult to understand that tactoids can adopt non-spherical shapes much more readily than other liquid–in–liquid emulsions. Especially when comparing the liquid crystal behavior in tactoids with that observed in liquid crystal droplets dispersed in chemically different isotropic phases this difference must be taken into account.
The next peculiarity, at least in comparing with thermotropic liquid crystals, is related to the very different mesogen shape and size. The much higher aspect ratio and orders of magnitude greater length of colloidal mesogens mean that bend elastic distortions to the director field are substantially more costly in liquid crystals formed by CNC suspensions or other colloidal nanorods. In other words, K 3 is significantly greater than for most thermotropic liquid crystals. Considering the importance of translational entropy in colloidal nematics, one may expect also the splay elastic constant in CNC suspensions to be larger than that of standard thermotropics. The elastic response to bend and splay deformations can thus be expected to have a stronger impact in liquid crystalline CNC suspensions than in thermotropic analogs, for which most measurements of elastic constants were done.
Considering these three peculiarities, large values of K 1 and K 3 , very low value of the equilibrium interfacial tension γ , and strong anchoring W favoring tangential director field orientation at the tactoid boundary, we can begin to understand the behavior of tactoids. Let us, however, start by looking at what is known for droplets of liquid crystals in general, because this allows us to better highlight how tactoids of CNC suspensions (or similar chiral colloidal liquid crystals) are unusual compared with thermotropic liquid crystal droplets.
The question of how the (chiral) nematic phase behaves when confined strongly in small droplets was studied experimentally in quite some detail during the 1980s and 1990s by, among others, Lavrentovich and co-workers [80,81,82,83], by Bouligand and Livolant [84], by Crooker and co-workers [85,86] and by Drzaic [87], with theoretical contributions from Zumer and others [88] (this list is far from exhaustive). For cholesteric droplets with tangential director alignment at the boundary, much work was built on the seminal model dubbed the "Frank–Pryce model", presented by Robinson et al. [89] in 1958 (F.C. Frank and M.H.L. Pryce were not co-authors, but the appendix of the article refers to private communications with them). With n aligned along the boundary of the spherical droplet the helix would develop radially, thus with a defect in helix orientation at the core of the droplet. However, the tangential director field itself must contain a topological defect charge of +2 at every concentric spherical plane, a topological requirement expressed in what today is called the Poincaré–Hopf theorem [90,91]. The Frank–Pryce model thus suggests that a line of +2 defects develops along one radius of the droplet. Indeed, many experiments found such a structure in large tangentially aligned droplets of thermotropic cholesteric, provided that the equilibrium cholesteric pitch p 0 was significantly shorter than the droplet radius r [84,85,90,92]. In the regime r p 0 , the helix was found to develop gradually and with much distortion, as illustrated very well in Figure 3 in the review by Lopez-Leon and Fernandez-Nieves [90]. This is very different from the case of cholesteric colloidal suspensions, where tactoids with size on the order of the pitch generally show no trace of a helix, and then, as the tactoid grows, there is a sudden transition directly to a well-developed helix, but only along a single direction [72].
To understand this difference, we must first remember that the droplets considered in most thermotropic cholesteric studies were not in thermodynamic equilibrium with the surrounding liquid, which was not the isotropic phase of the same system but rather typically a water or glycerol phase. Here we use the term “droplet” for describing this situation, while we reserve the term “tactoid” for the equilibrium situation of liquid crystalline domains coexisting with their isotropic counterpart. When studying droplets, the interfacial tension γ is considerable, as mentioned above, ensuring that droplets are always spherical, regardless of size. In a seminal paper by Bouligand and Livolant [84], cholesteric droplets and tactoids in equilibrium with their isotropic phase were investigated, for thermotropics as well as for lyotropics. They found examples of tactoids of non-spherical shape as well as with non-radial helix orientations, even for thermotropic mixtures. Three recent works of large significance, focusing specifically on the deviation from spherical shape in colloidal tactoids, are due to Prinsen and van der Schoot [54] (theory), Jamali et al. [93] (nematic carbon nanotube suspensions, primarily experimental) and Nyström, Arcari and Mezzenga [72] (cholesteric suspensions of shortened amyloid fibrils, primarily experimental).
All analyses of how the liquid crystalline order develops within a droplet or tactoid are based on a comparison of the interfacial and nematic elasticity contributions to the free energy. Depending on the size of a cholesteric droplet or tactoid, represented by a characteristic length r (which is the radius in case of a sphere), we can distinguish three regimes, with distinctly different behaviors, each having a different term dominating the free energy. Because the energy due to splay or bend deformations of the nematic director field scales only as r (see Section 4.2), this dominates for the smallest tactoids or droplets, to the extent that the liquid crystal violates the anchoring imposed by the boundary and adopts a uniform, deformation-free director field [80]. The phase remains spherical in case of a thermotropic nematic droplet [80], where interfacial tension cannot be neglected, but for a tactoid of a (chiral) nematic colloidal nanorod suspension, significant elongation along n into the characteristic spindle-like tactoid shape is generally observed [68,74,93], see Figure 7a.
While the extremely low interfacial tension makes it understandable that a non-spherical shape is allowed, it is not at first obvious why the tactoid elongates, considering that the director field is undistorted; the elongation in this regime can thus not be driven by nematic elasticity. As argued by Prinsen and van der Schoot [54], the reason is the anchoring strength W, which is significant despite the extremely low equilibrium value of γ . The cost of violating the anchoring condition, as required to achieve a uniform director field in a finite volume, is therefore enough to drive elongation into the spindle-like shape with two sharp points. The spindle shape maximizes the interface with n almost parallel to the boundary and it even removes the regions (as compared to a spherical boundary) where the director would be perpendicular or near perpendicular. Tactoids in this smallest regime can be recognized in the polarizing microscope by their spindle-like shape and the fact that they give complete extinction when the tactoid is rotated with its long axis along one of the polarizers, as the undistorted director field means that the optic axis is exactly along the tactoid long axis. However, as they cannot grow very large without changing character, then entering the next regime, they may be difficult to detect.
As the tactoid grows, a new regime is entered, where the interfacial energy ( r 2 ) contribution starts dominating over that of elastic distortion ( r ). Therefore the tactoid realigns the director field in order to adhere to the anchoring conditions, thus with tangential n along the full boundary, at the cost of developing a distorted director field with slight splay and bend, still with n primarily along the spindle axis. This configuration, depicted in Figure 7b, minimizes the director field distortion as well as interfacial tension. We call this tactoid configuration ’bipolar’, reflecting the fact that the director field converges into two +1 defects at each ’pole’ of the tactoid (or slightly outside the tactoid, the defects then being virtual [54]). The transition to the bipolar regime is recognized in the polarizing microscope by the tactoids no longer showing extinction at any orientation, because the optic axis is no longer uniform, hence some parts of the tactoid will always show birefringence. There may be a twist distortion as well, promoted by K 24 [94,95], but this has not yet been investigated for colloidal tactoids to the best of our knowledge.
In tactoids of CNC suspensions, it is relatively rare to see pronounced spindle shape, with the two characteristic cusps, most likely because of a lower aspect ratio of most CNCs than of the vanadium pentoxide rods studied by Zocher [68], the carbon nanotubes studied by Jamali et al. [93] or the amyloid fibrils studied by Nyström et al. [72], giving rise to less extreme values of K 3 and of W. Nevertheless, the nucleating tactoids are always anisotropic in shape, but often smoothly ellipsoidal rather than spindle-like. A rare case where clearly spindle-shaped tactoids were reported is the study of bacterial CNC of quite extreme length, about 1–2 μ m, by Araki and Kuga [96]. Tactoids from both the smallest regimes, with uniform director field (uniformly black when the tactoid is aligned along a polarizer) or a bipolar one (full extinction impossible), can be seen in their micrographs, but no extensive analysis of the tactoids was carried out.
It is not surprising that the cholesteric helix, with its non-uniform director field, cannot develop in the smallest tactoids. If the whole tactoid size is on the order of the helix pitch, it is less costly to pay the twist elastic deformation cost of not developing the helix and maintaining a uniform director field. Indeed, estimates of the elastic energy contribution due to untwisting the helix by Nyström et al. [72] came to the conclusion that this term scales as r 3 . This explains why the helix is suppressed in very small tactoids, dominated by splay/bend elastic energy, as well as in intermediate tactoids, where the interfacial energy dominates, but eventually a tactoid grows large enough for the contribution r 3 to dominate, leading to development of the helix. Considering the comparatively strong anchoring favoring tangential director at the tactoid boundary, one might then expect the helix to develop radially, in order to maintain a tangential director everywhere along the tactoid boundary. However, this does not happen for CNC suspension tactoids. Instead, the cholesteric singles out one direction along which the helix forms (usually along a short axis of a tactoid, which follows from the fact that the twisting must start from a director that was initially along the tactoid long axis), thus again violating the anchoring conditions strongly, see Figure 7c–d. The reason is most likely the large value of the bend constant for colloidal liquid crystals: a radial helix entails a continuous bend, very strong at the core of the tactoid. The elastic energy cost of this bend must be much larger than the periodic violation of the anchoring conditions along the tactoid boundary that a uniform helix orientation requires.
The threshold for the helix development transition obviously depends on the twist elastic constant K 2 , telling how large the cost is for not developing the natural helix with wave vector q 0 , as well as the wave vector itself, which quantifies how large the twist distortion is in a non-helical cholesteric director field. Because the uniformly aligned helix axis violates anchoring, the threshold should also be related to γ and/or W. These four parameters are indeed the key components of the threshold expression established by Nyström et al. [72]:
V α 2 γ W α 2 K 2 q 0 2 3 .
Here, V is the minimum tactoid volume for helix development and α is the tactoid aspect ratio, α = R / r , with R the longest and r the shortest radius.
Also the transition to helical tactoids is easily evidenced by polarizing microscopy (Figure 8), revealing periodic dark and bright ’fingerprint’ stripes (see Section 7.1) perpendicular to m. The tactoid appears dark where n orients along the viewing direction, as we are then looking along the optic axis, thus not seeing the effect of birefringence, and it is maximally bright when n is in the sample plane, giving maximum effect of the birefringence. Note that m must not be aligned parallel to either polarizer to see the brightness modulation. In Figure 8e the radial variation in m shows this clearly, the fingerprint texture being replaced by uniform black wherever m is parallel to one of the polarizers. As the tactoid grows further it often (but not always) elongates along m, an observation that to the best of our knowledge has not been discussed in detail, and which is not entirely obvious to explain. The tangential anchoring should favor expansion of the tactoid perpendicular to m, in order to maximize the interface with the favored director alignment. A possible explanation may be kinetic, the likelihood of incorporation of CNCs from the isotropic surrounding being higher at the bottom and top of the helix, since it is easier to adapt to the uniform director orientation at these points than the continuously changing orientations along the helix sides. Eventually, the tactoid may get so large ( r 10 p 0 ) that the helix orients radially (Figure 8e) and we then see a texture similar to that of thermotropic cholesteric droplets with tangential alignment, although we never saw evidence of the Frank–Pryce defect line. We will come back to why this may be in a moment.
Spherically symmetric tactoids of large size are actually quite rare, because in most cases tactoids meet and coalesce before growing large on their own. Tactoid coalescence was studied early on by Zocher and Jacobsohn [67] and more recently by Kaznacheev et al. for vanadium pentoxide [70], by Lettinga et al. for f d virus suspensions [97] and by Moser et al. for collagen-based cholesterics [73], showing a common evolution of merging tactoids. For CNC suspensions it has recently been studied extensively by the MacLachlan group, under the targeted concept of ’tactoid annealing’ [98], an issue we will come back to when discussing the challenge of obtaining optically uniform CNC films in Section 7. The coalescence process generally causes topological defects in the director field in the resulting larger tactoid. When multiple tactoids have coalesced a hole may even be left in the middle. Rearranging the director field can compensate for these defects but this typically takes a long time. The low value of γ means that very irregular shapes arise and remain stable for long time. Furthermore, due to the slightly higher density of the tactoids compared to the surrounding isotropic phase, because of their higher nanorod density (Equation (12)), they will gradually settle to the bottom of the suspension where they coalesce into a continuous and macroscopically visible liquid crystal phase.
The study of collagen-based cholesterics by Mosser et al. [73] is worth mentioning also for their experimental approach to probe a large region of the phase diagram in a single sample. Because the main thermodynamic control variable in lyotropic liquid crystals is the concentration of mesogen, we need to vary the concentration in a controlled way in order to map out the phase diagram. Typically this is done in a rather tedious manner by preparing individual samples with varying mesogen concentration and investigating each one individually (Figure 6), but Mosser et al. instead developed two ingenious set-ups for evaporating the water from the original collagen solutions in such a way that a controlled concentration gradient developed along the sample. This experimental approach may be useful to explore also in CNC suspension research.
Some representative polarizing micrographs of CNC suspension tactoids are shown in Figure 8. In the smallest tactoids (panel a), fingerprint stripes due to the helical director modulation can be seen in some but not all tactoids. Those where no stripes are seen are often out of focus. Most likely, these are suspended in the bulk of the isotropic phase whereas the tactoids that are sharply imaged have reached the bottom of the capillary in which the sample is studied, providing a clean cut through the tactoid that is easier to image optically. The absence of visible fingerprint texture in the other tactoids thus does not mean that these tactoids do not exhibit a helical director field, only that the imaging does not allow its detection. In addition to the tactoid being out of focus, another reason for not seeing the stripes may be that the tactoid is oriented with the helix axis m more or less along the viewing direction. The breaking of the symmetry that the glass substrate of the capillary provides for those tactoids that have settled at the bottom may provide an aligning influence, guiding m into the plane, thereby making it easier to visualize the stripes. Indeed, the fact that the stripe distance is relatively constant from tactoid to tactoid suggests that this is the case; if m were randomly oriented in space, we should see the fingerprint texture with great variation in periodicity, depending on how m is oriented within the tactoid with respect to the viewing direction.
As the tactoids grow, a variety of tactoid shapes can be seen, some clearly being remnants of tactoid merging (c–d). Panel (e) shows a relatively rare case of a nearly spherical tactoid with radial helix orientation, showing a texture similar to those seen in many studies of thermotropic cholesteric droplets. However, no trace of the Frank–Pryce defect line can be seen, which could indicate that the line is directed along the viewing direction. However, as mentioned above, tactoids of this size, that can be imaged with sharp pitch bands, are very likely sessile on the capillary bottom, i.e., the tactoid is only a hemisphere. This would allow the director field to develop without defects except at the central core, hence the Frank–Pryce defect line would not be needed. Interestingly, the tactoid looks quite dark around the center, suggesting that the central core is not cholesteric but isotropic, an energetically favorable way of removing the defect, as demonstrated by Kumacheva and co-workers for fully spherical CNC suspension droplets [99]. Yet, the center is not as dark as the surrounding isotropic phase, which we can explain by the fact that, in the middle, we are looking through the cholesteric exterior of the tactoid, and here we are observing it along m; the long pitch then gives rise to optical rotation of linearly polarized light [100,101], letting some light through the crossed polarizers. Another interesting observation is that the rings are not circles but spirals, as emphasized by highlighting one such spiral in Figure 8e. When the highlighted spiral passes its origin, it has skipped a full helix pitch. This indicates a certain asymmetry within the tactoid.
For long time, the only method for studying tactoids experimentally was polarizing microscopy, giving images such as those in Figure 8. Confocal microscopy was also used in the study of amyloid fibril suspensions by Nyström et al. [72] and of virus suspensions by Lettinga et al. [97]. The limited resolution of these optical methods, applied to objects like tactoids which can be tens or even hundreds of microns in size, restricts the detail with which tactoid formation, growth and merging can be studied. This changed thanks to the work of MacLachlan and coworkers [98,102,103], who managed to capture multiple stages of tactoid development in CNC suspensions by ’freezing-in’ the momentary structure using UV-induced photopolymerization of a reactive monomer dissolved in the water. The solid objects with structures templated by the liquid crystalline tactoids, as well as their isotropic surrounding, could then be beautifully investigated with high resolution by conducting scanning electron microscopy on the surfaces arising by fracturing the samples.

4.5. CNC Fractionation by Liquid Crystal Phase Separation and the Impact of Aspect Ratio on Phase Sequence

Tactoids, and the early stage of isotropic–nematic phase separation at which they occur, are of great interest for a disperse system such as CNCs. The reason is to be found in Equation (11): because ϕ 0 decreases with increasing rod aspect ratio, the very first tactoids that form in a disperse CNC suspension as its mass fraction w is increased will contain the longest rods. Likewise, the last remaining isotropic phase as we approach the CNC fraction where the full sample is cholesteric (or the first isotropic droplets (sometimes called atactoids) emerging if we dilute a fully cholesteric CNC suspension) will contain the shortest rods. Indeed, in a study by Dong et al. on filter paper-derived CNCs [104], later confirmed for bacterial cellulose by Hirai et al. [105], longer rods were found to predominantly populate the cholesteric phase, and shorter rods predominantly the isotropic phase, consistent with theoretical considerations by Lekkerkerker [60]. Interestingly, the experimental studies reported higher dispersity in rod aspect ratio in the cholesteric than in the isotropic fraction.
Already Onsager hinted at the possibility of fractionating length disperse colloidal suspensions but he did not develop a theory that takes dispersity into account. The baton was first picked up by Flory and Abe [59], then by Lekkerkerker and co-workers [60,61,62] and later by Bates and Frenkel [63] and others. A very recent contribution, discussing also CNCs as example, was published in this journal by Wensink [64]. These analyses look into how the biphasic coexistence regime is affected by the dispersity, a broadening being a significant consequence, and to what extent fractionation should be possible. The work of Wensink also looks into issues like the expected helical pitch development.
In a recent study of our group [106] we put this size-selective sorting provided by liquid crystal phase separation to use, repeatedly separating physically the cholesteric phase developing in a CNC suspension in the biphasic regime ( w 0 < w < w 1 ), and subjecting each fraction, the cholesteric and the isotropic, to another phase separation of the same type. The cholesteric phase was diluted until it again was roughly in the middle of the coexistence regime while the isotropic phase was concentrated until the same point. By repeating the separation three times, a final cholesteric fraction with significantly increased average rod length and a final isotropic fraction with significantly reduced average rod length resulted. In [106] we reported roughly unchanged dispersity for the cholesteric fraction, but we subsequently found that this was an artifact due to the difficulty in physically separating the phases; we have improved the method and confirmed that both fractions have reduced dispersity, as will be published soon.
The beauty of this procedure is that the change in rod character and reduction in dispersity has a strong impact on the liquid crystal phase sequence. The pristine disperse CNC suspension had an average rod length of about 0.2 μ m and diameter about 4 nm, whereas after fractionation the average length in the cholesteric-derived sample was 0.23 μ m but only 0.17 μ m in the sample derived from the isotropic phases. There was less change in the diameter, and the average aspect ratios ( L / d ) in the final fractions were 61 and 46, respectively (as determined by atomic force microscopy, AFM). When establishing the phase diagrams for the two fractionated samples and comparing it to the original one, we found significant and—in the case of the long-rod fraction—very beneficial changes. The onset mass fraction of liquid crystal formation had reduced from the original w 0 init 5 wt.% to w 0 long 3 wt.%, and the stability limit of the cholesteric phase shifted from w 1 init 11.8 wt.% to w 1 long 6 wt.%. In other words, not only had the onset of liquid crystal formation been pushed down to much lower CNC mass fractions, but also the phase coexistence window had been made much narrower by the reduction in dispersity. The reductions in w 0 , w 1 and w 1 w 0 are highly beneficial, as they lead to an expanded equilibrium range of a completely liquid crystalline phase that can be studied experimentally. This is because the phenomenon of kinetic arrest, ending the equilibrium behavior, was unaffected by the fractionation. We will discuss the reason for this unexpected and very interesting finding in Section 5.
The liquid crystal-based fractionation is so powerful because all fractions originate from the same CNC suspension. In other words, only the rod aspect ratio changes, while surface charge, type of stabilization and all other properties remain the same (assuming that there is no systematic variation with rod length of these properties in the mother suspension). This is a significant difference from previous studies trying to assess the impact of rod length, carried out on CNCs, and often also CNFs, that were produced using different procedures, from different raw materials. Therefore, rod lengths are varied at the same time as many other properties, making it difficult to draw clearcut conclusions. Nevertheless, similar trends were reported in these works. Dispersions of wood-derived CNC showed a decrease in w 0 from ∼5 wt.% to ∼3 wt.% as the aspect ratio L / d increased, again connected to an increase of the average length L from 100 nm to 150 nm [107,108]. However, the rods with higher L / d also showed lower surface charge densities, complicating the analysis. The authors proposed that the rod dimensions and geometry influence w 0 to a greater extent than the surface charge. CNCs derived from bacterial cellulose [96,105,109] and tunicin [109] have significantly larger aspect ratios, in the range of 50–150, and very low values of w 0 0.5 wt.%. In case of CNCs obtained from filter paper (thus originally wood-derived) with L / d in the range of 13–50, the biphasic region was found in the range between 5 and 13 wt.% [56]. This can be compared to CNCs derived directly from wood with aspect ratios in the range of 13–20 and biphasic region spanning 3–7 wt.% [108].

5. The End of Equilibrium: Kinetic Arrest, Percolation, Gel Formation and Glass Transitions

When we concentrate a CNC suspension to a mass fraction on the order of w = 10 wt.%, we leave the equilibrium phase diagram and the sample enters a kinetically arrested gel-like state. From a practical point of view, the kinetic arrest is on the one hand a blessing, because it locks the cholesteric order in place even as the water is evaporated and the particle fraction is increased all the way to 100 wt.% [19]. Were it not for the kinetic arrest, other structures would replace the cholesteric order, such as smectic states or solid crystalline states, and the helical structure would be lost. It is thus the kinetic arrest of the helical structure that allows us to form the colorful cellulose films from CNC suspensions that has created such a strong applied interest in the material, simply by evaporating the water. The loss of equilibrium is a mixed blessing, however, because gelation often sets in at such low CNC mass fraction that the sample has not yet reached liquid crystalline order throughout the sample. This limits us, from a fundamental science point of view, because we cannot study the liquid crystal behavior of many CNC suspensions without the presence of isotropic droplets coexisting with the liquid crystal. From a practical point of view, it means that we have plenty of internal boundaries between tactoids that have not coalesced, and even coalesced tactoids are unable to unify their helix orientations. The helix orientation in the final film can thus be largely uncorrelated from place to place, giving rise to optical properties that are highly non-uniform. This will be further discussed in Section 7.
Do we today understand what is going on at this stage? We believe the answer is largely yes, but in order to provide the explanation, we need to complement our understanding of the behavior of electrostatically stabilized colloids with a digression into non-equilibrium phenomena such as gelation and glass transition.

5.1. Percolation and Kinetic Arrest in CNC Suspensions

A high particle aspect ratio, as for nanorods like CNCs, promotes not only liquid crystalline ordering, but also the chance of close approaches between particles. For a certain overall mass or volume fraction, the likelihood of close approaches scales with the effective aspect ratio, thus L / ( d + 2 κ 1 ) . At sufficient concentration of particles with sufficient aspect ratio, we may eventually reach a state of potential particle connectivity extending throughout the system, a phenomenon that physicists call geometric percolation or connectivity percolation. It is important to note that almost all research on percolation has been done for isotropic systems, i.e., where there is no long-range order in the rod orientation. As we will come back to in a moment, the orientational order of (chiral) nematics actually has a profound impact on percolation [110], an aspect that needs to be considered in order to fully understand the behavior of kinetic arrest in cholesteric CNC suspensions.
Percolation can have multiple consequences for the behavior of the system, which ones depending on the nature of the percolating particles and the interactions between them. If the particles that came into contact remain connected, to the extent that the percolating network can resist mechanical stresses, we get what is called rigidity percolation: once a stable continuous network of particles exists throughout the system, the whole system stops flowing. We can also call this state of long-term connectivity gelation, and the colloidal suspension has transitioned from a sol (unconnected particles suspended in a fluid matrix) to a gel. This is a non-equilibrium state, stabilized kinetically: the system is generally not in a state of minimum free energy, but nevertheless retains its structure because it is unable to rearrange into the energy-minimizing structure. An energy barrier much greater than thermal energy must be overcome in order to leave the state. We say that the rod arrangement is kinetically arrested. Rigidity percolation is highly relevant to CNC suspensions, since they all enter a kinetically arrested gel-like state above a threshold mass fraction w k , that shows many of the hallmarks of rigidity percolation.
The stable connectivity of rigidity percolation requires attractive interactions that maintain the connection despite the impact of thermal fluctuations and, at least to some extent, sustain also externally imposed stresses (a soft gel may easily be broken). As discussed in Section 3, this can be provided by the van der Waals attraction, which is very strong when particles are in close contact. However, because we are dealing with colloids, in which particles should generally not aggregate, the CNCs have been prepared with the surface charge that prevents such close contact. On the other hand, we have seen in Section 3, illustrated in Figure 2, that an increased ionic strength, provided, e.g., by the additional counter ions as we add more CNCs into suspension, will weaken the electrostatic repulsion, eventually to the extent that no barrier exists. Considering other attractive interactions, e.g., hydrogen bonding in case of CNCs, we might also have a situation where a secondary minimum gets sufficiently deep upon reduction of electrostatic repulsion to trigger flocculation of particles into loose aggregates, without inducing permanent aggregation into the primary minimum. By increasing the CNC mass fraction w, we might thus expect to reach the threshold for geometric percolation as well as the limit of colloidal stability, which would then give rise to rigidity percolation, since long-term stable bonds between CNCs would be formed. Importantly, the CNC mass fraction required to loose colloidal stability, in the sense that the electrostatic stabilization no longer dominates over van der Waals attraction, is apparently above the geometric percolation threshold. If this were not the case, the loss of colloidal stability would simply lead to local rod aggregation and sedimentation rather than gelation. Further contributions may well be expected from hydrophobic interactions, still not very well investigated in the context of CNC suspensions.
The mass or volume fraction of rods required for percolation is called the percolation threshold. Because of the dependence on aspect ratio of the likelihood of encounters, the percolation threshold is proportional to ( d + 2 κ 1 ) / L , just like the threshold for liquid crystal formation. This makes percolation a particularly delicate phenomenon in case of CNC suspensions: one would expect an increased rod aspect ratio to promote liquid crystal formation as well as gelation, but as will be discussed below, the impact is more complex. In contrast to liquid crystal formation, percolation does not require the rod to be very stiff or straight. Considering this, it is not difficult to understand that CNFs, much longer than CNCs but also more flexible, kinked and potentially even branched, tend to percolate and form gels before any long-range orientational order develops. We are not aware of any study reporting liquid crystal formation in CNF suspensions, even if some long-range order may appear together with kinetic arrest.

5.2. Kinetic Arrest by Glass Transition or Gelation?

In contrast to the percolation threshold, the reduction of κ 1 does not depend on the rod aspect ratio, only on the ionic strength I, which in turn is proportional to the total amount of CNCs in suspension, assuming that no further ions are added ( I = I c ). Therefore, a very high rod aspect ratio could reduce the percolation threshold to such an extent that we reach geometric percolation long before the electrostatic repulsion is sufficiently reduced to create lasting bonds between rods. Would this mean that no kinetic arrest can take place? Not necessarily. There is another possible origin of kinetic arrest, that would occur in the opposite extreme of low ionic strength. This is not strictly a percolation transition, because it is not triggered by the appearance of continuous networks throughout the system, but it is also related to the volume fraction of rods, and their aspect ratio. The kinetic arrest would in this case be more of a glass transition, in the sense that the rods become trapped from rearrangement, not by forming networks but rather by being stuck in a ’cage’. This ’electrostatic caging’ is promoted by large κ 1 —hence the requirement of low ionic strength—as well as sufficient effective volume fraction of rods to form the cage. The mobility of any individual probe rod is restricted by the presence of all the surrounding rods through the excluded volume that they cause for the probe rod, given by the volume of the actual rods and the addition provided by κ 1 . Above the threshold for kinetic arrest in this scenario, a rod could not leave its ’cage’ of excluded volume formed by surrounding rods, although it is not part of a network.
A complication is that the surface charge and ionic strength are not independent, as we always have electroneutrality. The higher the surface charge, the more counter ions are released when a rod is suspended, and thus the higher the ionic strength I. This scenario thus requires a delicate balance of surface charge and particle aspect ratio, but it has been proposed to occur, e.g., for f d virus suspensions [111]. These nanorods have many similarities to CNCs, but there are also significant differences. While CNCs are highly disperse, viruses are, by virtue of their biological origin, non-disperse, i.e., every virus particle has the same length and diameter. They also have a significantly greater aspect ratio than most CNCs (bacterial CNCs being a possible exception), with d = 6.6 nm and L = 0.88 μ m [112] for fd. Finally, and very significantly for this discussion, their surface charge is substantially greater than for CNCs. Rod-like viruses, like f d , consist of a single helically packed nucleic acid chain surrounded by a ’capsid’, a cylindrical coating of proteins. The coating of f d consists of about 2700 proteins, each with the same mix of charged amino acids [113]. At neutral pH, the charge amounts to about 3.4 q per protein [112], where q is the elementary charge. Therefore, each f d virus nanorod carries a negative surface charge of more than 9000 q !
How does this compare with typical CNC qualities? For the commercial CNC that we studied in Ref. [106], finding clear evidence of counter ion-induced gelation (see below), the supplier gave the information that the particles have a sulfur content of 0.95 wt.%. Our AFM investigations of the CNC showed that the pristine sample had an average physical rod length of about 0.2 μ m and an average physical rod radius of about 2 nm, yielding a volume of an average rod of cellulose that is V 1 C N C = π ( 2 × 10 7 cm ) 2 × 0.2 × 10 4 cm 2.5 × 10 18 cm 3 . With a cellulose density of 1.5 g/cm 3 , this gives us a mass of an average CNC of 3.8 × 10 18 g. The manufacturer’s information then tells us that an average rod carries 3.6 × 10 20 g of sulfur. To turn this into a count of the −SO 3 groups on the CNC, we divide by the molar mass of sulfur and multiply by Avogadro’s constant, obtaining:
N S = 3.6 × 10 20 g 32.065 g / mol × 6.022 × 10 23 mol 1 700 .
In other words, a typical CNC rod has a surface charge of about 700 q , an order of magnitude lower than f d virus. In addition, the CNC does not have nearly the same aspect ratio, so in order to compare the two systems, we should normalize to particle mass or length (the diameters of CNC and f d are similar enough to ignore the difference), the latter being simpler. With a CNC having roughly a quarter of the length of an f d rod, we thus find that the length-normalized surface charge is about three times greater for f d than for CNC.
As discussed above, an increase in surface charge comes with greater I c for the same amount of rods, hence the rod mass fraction must be low in order not to loose colloidal stability when the surface charge is as high as in f d . Because of the high L / d , this is the case for cholesteric f d virus suspensions, where the caging-based kinetic arrest was proposed. Indeed, Kang and Dhont reported remarkably low w 0 0.15 wt.% and w 1 0.34 wt.%. Furthermore, w k , the threshold mass fraction for kinetic arrest, is much lower, w k 1.2 wt.%, a factor 10 lower than w k in the CNC suspensions studied in [106] (details below). As the length-normalized surface charge of f d is only about a factor 3 greater, the counter ion concentration at comparable mass fractions should also be three times greater, meaning that w k for f d corresponds to about three times lower I c than in CNC suspensions. This could indeed suggest that the reasons for kinetic arrest in the f d virus and in the wood-derived CNC suspensions are different.
With bacterially derived CNC, we may actually reach situations not too different from f d virus suspensions, and one interesting report suggests that we may then see kinetic arrest by glass transition also here. This is the study by Araki and Kuga [96] of the phase behavior of bacterial CNC suspensions discussed in the context of tactoid formation in Section 4.4. As mentioned there, these CNCs were exceptionally long, 1–2 μ m, and they had a board-like shape, with a typical cross section of 10 nm by 50 nm. The surface charge per unit area was fairly normal for CNC, 0.02 charges per square nanometer surface area, which computes to a total CNC charge of 2400 q assuming 1 μ m length. Normalized by the length, this is not too different from the 700 q per rod for the wood-derived CNC just mentioned. Because of the very long rods, and a higher than usual aspect ratio, the onset of liquid crystallinity was very low, w 0 0.1 wt.%, comparable to the case of f d virus. In contrast, the mass fraction for achieving a completely liquid crystalline sample was much higher than for f d , w 1 1.7 wt.%, a difference most likely due to the high dispersity of the bacterial CNC, the presence of short CNCs raising w 1 (see Equation (12)).
The onset of kinetic arrest was detected earlier than for most CNC suspensions, with w k 3 wt.%, but compared to the f d suspension, this is still a factor 3 greater. This compares well with the fact that the f d had about three times greater surface charge. Araki and Kuga did not see textures indicative of helix formation in the pristine cholesteric CNC suspensions, an observation that is probably related to the high viscosity of these suspensions (phase separation between isotropic and cholesteric phases was reported to be slow) and the fact that kinetic arrest sets in at such low CNC mass fractions. Surprisingly, the viscosity decreased upon addition of NaCl salt (the effect of salt addition in CNC suspensions will be discussed in more detail in Section 6.3) and now a periodically striped texture indicative of helix formation was seen with 0.1 mM NaCl added to a 1.58 wt.% CNC suspension. This amount of salt also increased the liquid crystal onset to w 0 0.1 mM NaCl 0.4 wt.%. The similarities with the f d virus suspensions and the fact that salt addition counteracted the kinetic arrest seen in the pristine system renders it plausible that these bacterial CNC suspensions may indeed be experiencing the electrostatic caging-induced glass transition in the pristine state. The addition of NaCl would reduce the Debye length to such an extent that the caging does not occur, the viscosity decreases, and the helix then has a chance to develop.
Nordenström et al. [114] set out to determine experimentally whether the kinetic arrest in various CNC and CNF suspensions is of gelation or of glass transition type, and also if the rod volume fraction required for kinetic arrest scaled as d / L or not. To this end they compared several different types of CNC as well as CNF, thereby spanning a broad range of aspect ratios, from 29 for the shortest CNC type to about 1000 for the longest CNF. Their experiments suggest that the threshold indeed follows classical percolation behavior within this range. While they did not mention if their samples formed liquid crystal phases or not, the d / L scaling for the percolation threshold, expected for isotropic but not for liquid crystalline suspensions [110] (see below), suggests that their samples were predominantly isotropic. In order to test for gelation versus glass formation, they re-diluted the sample, in order to check if the sample started flowing again. As they found that this was always the case, their conclusion was that the kinetic arrest was of the glass transition type.
There are, however, a few significant aspects that the study did not take into account. First, a recovery of flow with complete redispersion of the particles could be expected even after rigidity percolation if the connectivity triggering the network formation is due to CNCs being stuck in a deep secondary minimum in Figure 2 rather than reaching the primary minimum. As mentioned in Section 3, the strong hydrogen bonding capacity of cellulose might contribute to such a situation, although it needs to be investigated further. Second, even if rigidity percolation is driven by particles reaching the primary energy minimum separation, dilution of the gel might still cause the sample to start flowing again, because now the particle fraction is below the percolation threshold. The expansion upon dilution could break the volume-spanning network, creating sections of aggregated particle networks suspended in the solvent. We may thus get back to a flowing system, but it is not necessarily identical at the individual particle scale to the system prior to kinetic arrest. As will become clear in a moment, we had this situation in our study of kinetically arrested CNC suspensions. Finally, by using so drastically different sample types for varying the rod aspect ratio, many other parameters are varied at the same time, not least surface charge, stiffness and linearity when comparing CNF with CNC. This leaves the study open in the sense that we do not know the impact of the other parameters, the variations of which were not negligible.
In our recent systematic study of kinetic arrest in CNC suspensions [106] we did not use different samples prepared by different production methods, but instead we compared different fractions separated from one and the same original CNC suspension, with Na + counter ions, using the liquid crystal-based fractionation scheme described in Section 4.5. Recall that our fractionation changed the average rod length from 0.2 μ m in the pristine suspension to 0.23 μ m in the cholesteric-derived long-rod fraction and 0.17 μ m in the isotropic-derived short-rod fraction, corresponding to average L / d values of 61 and 46, respectively. At first sight, these differences may not appear to be so dramatic, but as described in Section 4.5, the liquid crystal phase diagram was much enhanced, moving w 0 and w 1 to significantly lower values, narrowing the coexistence range, and leaving a large range of equilibrium cholesteric phase without coexisting isotropic droplets. Yet there was no change to w k , the onset mass fraction for kinetic arrest. For the pristine suspension as well as for the short- and long-rod fractions, w k 12 wt.%. Based on this fractionation-independent w k we conjectured that kinetic arrest is triggered by the system reaching a critical ionic strength I k or, more specifically (see below), a critical counter ion concentration c c k . This gives a strong hint that the gelation is related to loss of colloidal stability, enabling rigidity percolation.
To further test this hypothesis, we added NaCl salt to several samples of CNC suspensions, from the long- as well as from the short-rod fractions, with CNC mass fractions from w = 1 wt.% up to w = 11 wt.% and in each sample we tuned the NaCl concentration such that the Na + counter ion concentration c c reached the critical value c c k , the same as in a salt-free sample at w k . Indeed, now all samples gelled, down to w = 3 wt.%! This is a very clear indication that the kinetic arrest in this study is a gelation phenomenon and that the increase of c c beyond c c k , apparently the limit of colloidal stability, is the trigger. Further support of this conclusion was found in rheological experiments. Freely flowing samples showed a greater loss modulus than storage modulus ( G > G ), as typical for viscoelastic liquids. This changed for the kinetically arrested samples, which all had G < G , typical of a gel. We note (see Equation (2)) that the addition of NaCl up to c c = c c k leads to an ionic strength I that is greater than I k of a salt-free sample at w k , since I is also affected by the added free Cl co-ions. The loss of colloidal stability thus appears not to be a simple consequence of κ 1 being reduced below a critical value, as κ 1 fundamentally is a function of I, not of c c . Possibly, ion-specific processes within the double layers surrounding each CNC rod, where Na + ions are much more prominent than Cl ions [41], need to be taken into account explicitly.
When we studied suspensions with mass fractions near w k by AFM, another curious observation was that rods tend to connect in chains, more or less end-to-end, effectively forming much longer ’supra rods’, albeit also more flexible. Based on this, we conjectured that the kinetically arrested state is an example of rigidity percolation where the percolating entities are not the individual CNCs, but rather the supra rods formed by this peculiar aggregation. The reason that the fractionation had no effect on w k could then be easily understood: the aspect ratio even of the longest CNCs could be so low that the percolation threshold for individual rods ends up at mass fractions far beyond the mass fractions where rods start connecting. The connection drastically increases the effective rod length (with no difference depending on the starting sample), bringing down the percolation threshold and thus rapidly triggering rigidity percolation and gelation. The AFM measurements are illustrative also in terms of distinguishing aggregation by particles reaching the primary or secondary minimum in the free energy curve. As discussed above and as probed by Nordenström et al. [114], dilution should lead to redispersion of rods that have aggregated only by flocculation. In contrast, truly coagulated rods will stay connected, as energy is required to move them out of the deep primary minimum in which they are stuck. When preparing samples for AFM measurements, the suspension is diluted by many orders of magnitude, as we need sparse deposition on the substrate for proper imaging. Despite this very strong dilution (which certainly led to very easily flowing samples), we clearly saw chains of CNCs in the AFM images. This gives clear evidence that the kinetic arrest in this case was indeed due to rigidity percolation through permanently connected CNCs, thus to gelation.
Since we are discussing liquid crystal phases, a key question that nevertheless is almost always overlooked in the context of CNC suspensions is what impact the orientational order has on percolation. The vast majority of studies of percolation, experimental, theoretical and simulations, have been carried out on isotropic systems, with random-aligned rods. An exception is the team of van der Schoot and Schilling, who have studied percolation in liquid crystalline systems for some time. A recent work from the team, by Finner et al. [110], has critical consequences for the understanding of kinetic arrest in CNC suspensions. While their study focused on electrical percolation, i.e., where finite-sized conductive rods eventually connect to form a macroscopically conductive system, their conclusions can be transferred to the case of rigidity percolation with some additional considerations. Importantly, the systems considered in [110] deal with a colloid of only one type of rods, which may undergo an isotropic–nematic transition and/or percolation as the rod volume/mass fraction is increased. In this respect, their system is perfectly analogous to the CNC suspensions considered in this review.
The take-home messages in [110] are that (1) rod connectivity is the most critical component for percolation when nematic ordering is considered, and (2) that much of what we know about percolation in isotropic systems is turned on its head when the effect of long-range orientational order is taken into account. How is then the critical parameter ’connectivity’ defined? Finner et al. define it by introducing a critical rod-to-rod distance d c , such that two rods are considered connected if they approach each other by less than d c . They find four regions of very different behavior depending on the connectivity, i.e., on the magnitude of d c . For low d c , i.e., weak connectivity (the rods need to get very close to be considered connected), percolation never takes place; while in the isotropic phase the likelihood of two rods getting close to each other is greater, due to the random orientation, the low value of d c means that nematic ordering takes over before percolation of isotropically arranged rods can be seen. Once the nematic phase forms, the essential outcome is that d c must pass a certain threshold value for having percolation but, very interestingly, percolation then happens for all rod fractions and any rod aspect ratio, as long as the phase stays nematic.
This reminds very much of our system, where gelation was seen beyond a critical value of the counter ion concentration, c c k , provided that we can correlate c c k with d c . Indeed, such a correlation is plausible, because while a high d c in the work of Finner et al. means that two rods are considered connected even if they are not very close, in our case c c = c c k means that connectivity in terms of attraction—by van der Waals interactions, hydrogen bonding or the hydrophobic effect—dominating over electrostatic repulsion will happen although it requires close encounters, because the high counter ion content enables such close encounters. Thus, while we without doubt have quasi-linear chain aggregation in CNC suspensions as we approach c c = c c k , and thus effective rods with much greater aspect ratio, this may not be the most important point. Rather, the critical issue is that the gelation threshold value of c c k corresponds to a threshold connectivity, which brings the cholesteric CNC suspension into the regime where percolation takes place regardless of aspect ratio.
Nevertheless, a remaining important question is what the origin of the peculiar end-to-end aggregation might be. Finner et al. noticed in their simulations that their percolating clusters were extended along n, attributing this to the nematic order, but a detailed explanation of why we do not see mainly side-to-side aggregation, which should also be promoted by orientational order, was not given. In [106], we proposed a potentially generic explanation based on the different effects of counter ion fluctuations near a rod end and near a rod side. However, we were later made aware of a significant aspect of the chemical properties of CNCs that may be even more relevant. Lokanathan et al. [115] demonstrated that the ends of CNCs can be selectively functionalized by reductive amination without any alterations at the sides of the CNCs. This can only be explained with the presence of aldehyde groups and proves that the terminal glucosyl moiety of each CNC rod is able to undergo spontaneous isomerization, in analogy to the mutarotation known from cyclic sugars. In Figure 9, the isomerization process of CNCs in suspension is depicted, showing how the terminal glucosyl moiety can transform from cyclic β -d-glucopyranosyl via the open-chained d-glucosyl, which incorporates the aldehyde functionality, to α -d-glucopyranosyl, again cyclic. The isomerization is catalyzed, for example, by acids, which are often still present in CNC suspensions due to the acidic hydrolysis which is applied during production.
Looking at the different isomers, one can imagine that at least the open-chained D-glucosyl as well as the α -d-glucopyranosyl moieties possess polarizabilities differing from the remaining β ( 1 4 ) glycosidic linked d-glucosyl moieties, and thus may also lead to different surface densities of -SO 3 groups during acid hydrolysis. These variations in the surface charge and/or the van der Waals attractions between the sides and the terminal ends of the CNCs might explain the end-to-end aggregation. Furthermore, we may speculate about the formation of new β ( 1 4 ) glycosidic bonds if the hydroxyl group of a starting d-glucosyl moiety, marked in green on the left in Figure 9, would attack the aldehyde group of the terminal d-glucosyl moiety of another rod. This would then lead to an end-to-end condensation of the rods. While these ideas would need to be corroborated with further experiments, they seem quite plausible, and they would provide a rather straight-forward explanation to the end-to-end aggregation. At w w k (or by adding NaCl until reaching c c c c k ), the colloidal stability is still just barely retained on the sides but not at the ends, where the surface charge is presumably lower. As CNCs fluctuate in the sample, they thus build the chains seen in AFM, probably contributing to triggering rigidity percolation.
It is interesting to note that also f d virus has different proteins coating the ends compared to the cylindrical side [116], thus also here the side-to-side interaction may be different from the end-to-end interaction. In fact, Petrova et al. found linear chain formation of f d virus at high ionic strength, very similar to our situation, when the viruses were adsorbed on a weakly charged cationic lipid membrane [116]. While the authors attributed the linear chain formation to the interactions with the membrane, the fact that linear chain formation was observed only at high I, and considering the contrast between sides and ends of the f d virus proteins, a further investigation of localized variations in colloidal stability would certainly be motivated. Possibly, the influence of ordering the virus rods into a plane provided by the lipid membrane might be comparable to the influence of liquid crystalline order in a cholesteric nanorod suspension. There are clearly interesting questions to investigate here in the future, where comparisons between CNC and f d virus suspensions may be very worthwhile.

5.3. How Do We Detect Kinetic Arrest Experimentally?

A simple, approximate experimental method of detecting kinetic arrest is to gently turn a sample vial upside down and observe the evolution with time. If after 24 h the suspension did not sink to the bottom, we tend to consider the sample to be kinetically arrested [114,117], although it can, righteously, be considered too simplistic for an absolute confirmation [118]. Nordenström et al. [114] used this method combined with dynamic light scattering to investigate the kinetic arrest in their study (see above). Phan-Xuan et al. [119] measured the critical aggregation concentration of a CNC system with addition of mono-, di- and trivalent ions using the appearance of turbidity as a criterion. They also studied the system with small angle X-ray scattering and supported the experiments with a simple coarse-grain model in Monte Carlo simulations. They showed that, at low ionic strength, the suspensions with monovalent ions are stable, the critical aggregation concentration depending on ion type along the order Li + > Na + > K + > Cs + . For di- or trivalent ions the critical concentrations are significantly lower, as expected from the squared dependence on z i in Equation (2).
Rheology is another key tool for identifying the gelation threshold and analyzing the nature of the formed network. A differentiation can be made between a viscoelastic liquid and a solid-like gel by evaluating the development of the two moduli, G and G , as a function of frequency, where for a viscoelastic liquid G < G and a solid-like gel has G > G . The first reported systematic investigation of the rheological behavior of CNC suspensions that we are aware of was done in 2011 by Ureña-Benavides et al. [120]. Shafiei-Sabat et al. [121] later conducted a rheological study in which they compared two wood-derived CNC suspensions with different degrees of sulfonation, in disordered and ordered states, finding that CNCs with higher surface charge are kinetically arrested at higher mass fraction than CNCs with lower surface charge. Higher sulfate group content led to a broad biphasic transition region, forming a gelled state at higher w compared to those with lower degree of sulfonation. Probably, the lower surface charge in this case decreased the electrostatic repulsion sufficiently to promote aggregation at lower w. The authors did not detect any difference in particle size between the two systems they studied, although this could have had an influence. In 2016, some of us conducted a study confirming these observations [117]. Our rheological investigation demonstrated a clear difference for CNCs with high and low surface charge in a semi-logarithmic representation of shear viscosity versus concentration. For CNCs with low surface charge the transition to kinetic arrest was distinguished by a sudden superlogarithmic increase of viscosity whereas for CNCs carrying more surface charges no such trend was observed at any shear rate in the investigated concentration regime.
Considering that cholesteric CNC suspensions tend to develop a helical structure; also, the texture as observed in polarizing microscopy can be used as a test of kinetic arrest. We used this method in a study of CNC suspensions in different non-aqueous solvents [122], interpreting the inability over several days of a birefringent bulk CNC suspension to form a fingerprint texture as a sign of kinetic arrest. Comparison with rheological data for the suspensions showed that this interpretation was correct. A general point to remember when investigating CNC suspension experimentally, concerning kinetic arrest or other aspects, is that the sample history can have significant impact, as is typical for non-ergodic systems such as gels. Differences in kinetic arrest behavior have been attributed to varying hydrolysis conditions [117,120] or differences in the sonication procedure [108].

6. Tuning the Equilibrium Behavior—And Its Range—By Modifying the Solvent

So far in this review, the continuous phase surrounding the CNCs has been discussed almost only in terms of its content of counter ions released from the CNCs when they are brought in suspension, and the assumption has generally been that the liquid used for the continuous phase is water. There is, however, also a rich body of research on mixed or entirely non-aqueous suspension hosts [123,124,125,126,127], sometimes with additives that can range from simple salts to reactive molecules that can be transformed into macromolecular structures like organic polymers or silica. Looking back at the definition of the Debye screening length, Equation (5), we find that both the relative permittivity of the solvent and the concentration of free ions have a major impact on κ 1 and thus on the behavior of colloidal suspensions. This makes it worthwhile to have a deeper look into this topic.
There are many applied reasons for modifying the continuous phase, for instance in order to make composites where helically arranged CNCs are embedded in a solid matrix, inorganic [128,129,130,131,132,133] or organic [134,135,136,137,138,139,140,141], that is templated by the CNCs (the CNCs may be removed afterwards). To make mechanically durable and flexible composites it is interesting to incorporate synthetic polymers, but as many of them (and their corresponding monomers) are not water-soluble, a switch to a non-aqueous solvent for the CNC suspension may be necessary. On the other hand—and more interesting from the perspective of this review—much can also be learnt from such studies from a basic science point of view. Our understanding of the particle–particle and particle–solvent interactions in CNC suspensions, not least how the chirality transfer mechanism at the heart of the cholesteric helix formation works, is for instance far from satisfactory, and it may benefit from seeing how other solvents affect the self-organization.
To keep this review contained we will not go into most of these rich paths of explorative CNC-based materials science, but we will focus only on two aspects, from which we can learn much about how the organization of CNCs is affected by the continuous phase. We will look at the effects of replacing water by non-aqueous solvents, and we will look into how the equilibrium phase diagram and helical pitch of aqueous cholesteric CNC suspensions are affected by addition of salt or glucose. However, first we look at a practical challenge of large significance.

6.1. The Challenge of Preparing Non-Aqueous CNC Suspensions and How to Overcome It

Suspending CNCs in non-aqueous solvents is challenging for two reasons. The first reason is that we may need alternative methods to stabilize the CNCs in the new suspension medium, since electrostatic repulsion is not necessarily a viable option in organic solvents. The second reason is that CNCs are usually prepared in acidic aqueous solutions and thus have to be transferred to another solvent without risking irreversible agglomeration of the CNCs (see Section 3). Concerning the colloidal stability of the, usually highly charged, CNCs in non-aqueous solvents, a variety of different approaches can be found in the literature. The most straightforward way is to choose other polar solvents such as the conventional organic solvents dimethyl sulfoxide (DMSO), N , N -dimethyl formamide (DMF) or tetrahydrofuran (THF) [142,143,144,145,146,147] or mixtures with ionic liquids [148,149,150]. Okura et al. [151] investigated the dispersibility and shear-induced birefringence of CNCs that had been produced by HCl hydrolysis in 21 different solvents. They concluded that a high relative permittivity ϵ r as well as a high viscosity of the solvent are beneficial for stabilizing CNCs (the viscosity obviously only contributing to kinetic stabilization). Furthermore, they noted that the CNCs could only be dispersed in amphoteric solvents, i.e., solvents which are strong Lewis acids and bases at the same time, due to their ability to strongly interact with the hydrophilic CNCs.
Further methods to promote colloidal stability of CNCs in non-aqueous solvents are to change the acid used for hydrolysis [146], neutralize the CNCs with base to make them less polar [138] or alter their surface properties by covalently bonding larger chemical moieties to their surface [123,144,152,153,154,155,156,157,158,159,160,161,162,163,164,165,166]. As work in the latter field has been extensively documented, we will not go into detail here, but refer to two reviews by Eyley and Thielemans [124] and by Habibi [123] about surface modification of CNCs. With the right choice of modification and degree of substitution, the range of solvents stabilizing CNC suspensions can be largely expanded. For example, Yuan et al. [167] acetylated the surface with iso-octadecenyl succinic anhydride and investigated dispersion quality in 16 different solvents. While the pristine CNCs showed good suspension properties in solvents with a relative permittivity of ϵ r 37.8 , the modified CNCs could only be suspended in solvents with a moderate to low relative permittivity of 37.8 ϵ r 2.2 . Last but not least, it is possible to stabilize CNCs in apolar solvents such as cyclohexane or toluene by adding surfactants that adsorb to the hydrophilic surface of the CNCs and thus make them hydrophobic [125,126,161,168,169].
To transfer CNCs from one solvent to another, a common approach has been to freeze-dry aqueous suspensions of pristine [143,144,147,158,159], surface modified [153,154,157,162,165,167] or surfactant-stabilized [125,126,155,161,168,169] CNCs. Especially for pristine CNCs, freeze drying is preferable to other drying methods, since the strong capability of the CNCs to form hydrogen bonds may otherwise lead to irreversible agglomeration. This effect can be avoided by introducing stabilizers, such as surfactants or surface modifications, before drying. Furthermore, two groups showed that stabilized CNCs can be dried in vacuum at 45 C to 50 C without aggregation [158,164]. A second method that can be used when the old and new solvent are miscible is to strongly centrifuge the original CNC suspension to bring the CNCs to the bottom of the vial, remove the supernatant liquid and replace it with the desired new solvent; this process is then repeated until almost all water is gone [163]. Tian et al. [164] compared the two methods using pristine CNCs and concluded that the second one is preferable, because they found in their study that CNCs agglomerated stronger during freeze-drying, to the extent that it might be impossible to re-suspend them again. A third method is to mix the aqueous CNC suspension with the other solvent, followed by evaporation of the water under atmospheric [144] or reduced pressure [122] conditions. Obviously, this method can only be applied to solvents with boiling point considerably higher than that of water and which do not form a eutectic mixture with water. The new solvent must also either be able to disperse the CNCs on its own or it must host the stabilizer required for stable dispersion. Furthermore, elevated temperatures encountered in the procedure might lead to hydrolysis of sulfate groups, altering the properties of the CNCs.

6.2. Liquid Crystallinity and Kinetic Arrest of Non-Aqueous CNC Suspensions

Up to now, only few studies investigated liquid crystalline organization of CNC suspensions in non-aqueous media in detail. Often the sole evidence published for anisotropy is the observation of birefringence in larger vials [144,157,167,169] or flow-induced birefringence [144,147,151,154,162]. Some researchers went one step further by conducting polarizing microscopy investigations of the textures of the non-aqueous suspensions. Two publications describe the formation of tactoids in toluene [168] or DMF [138]. Several more report the observation of fingerprint textures [122,125,126,138,155,158,168,170], which proves that the helix formation is preserved in a variety of solvents. On the other hand, some authors only find uncharacteristic textures without any evidence for the formation of macroscopically chiral structures in suspensions of surface-modified [153,154,159] or surfactant-stabilized [169] CNCs in toluene or chlorobenzene. Xu and coworkers [159] concluded from the lack of evidence of helical modulation that surface grafting makes “the twisty rods smooth and straight”. Indeed, the chiral interactions between rods may well be affected by the process. However, as discussed in Section 4.1, absence of a detectable helix is not a sign of the phase not being cholesteric; there are many factors that may prevent or delay the development of the helical director field modulation so we may still have q 0 0 . At least three [153,154,169] of the four publications which report uncharacteristic textures additionally mention a high viscosity of the suspensions. This leads us to propose that the suspensions may have been in or in the proximity of a kinetically arrested state at the investigated concentrations. The inability to develop a helix would then be due to a loss of equilibrium, rather than loss of chirality. We have seen this type of kinetic arrest-induced loss of helix-related textures in our own studies of non-aqueous CNC suspensions [122].
Regarding the pitch of the helix, when it develops in non-aqueous solvents, quite varying values have been published: Yi et al. [158] found a pitch of 1–2 μ m for polystyrene-grafted CNCs in DMF compared to 2–3 μ m for ungrafted CNCs in water. For surfactant-stabilized CNCs Heux et al. [125] measured a pitch of 4 μ m in cyclohexane, while Zhou et al. [168] reported a value of 17 μ m in toluene. It is difficult to draw conclusions and improve our understanding of the physics behind the helix formation from such singled-out values, especially if we consider that these values cannot be compared directly due to potentially very different CNC mass fractions for each reported value, and differing stabilization and production methods employed. Consequently, in the following we will focus on only a few publications which investigate liquid crystallinity of CNC suspensions in non-aqueous media in a systematic and comparative manner.
Frka-Petesic et al. studied the orientation and unwinding of the cholesteric helix by an applied electric field [155]. To overcome certain disadvantages of water, e.g., the high electrical conductivity, they used toluene as a solvent, using surfactants for stabilizing the CNCs after transfer to this nonpolar host. In this context, they also investigated the phase behavior and equilibrium pitch p 0 of the system. They found a two-phase coexistence region roughly between 20 and 25 wt.%, where the mass fraction refers to combined CNC and surfactant in relation to the total mass, and they did not observe kinetic arrest up to the maximum investigated CNC content of 38 wt.%. Although the mass fraction of the pure CNC is somewhat lower, as the surfactant is also considered, we note that the rod mass fractions are significantly higher here than in aqueous CNC suspensions. With increasing mass fraction, the authors found p 0 to decrease from roughly 4 to 2 μ m. Interestingly, they mentioned that the chiral interactions which lead to the helical precession of the CNCs cannot be transmitted from one CNC to the next by electrostatic interactions, because ion dissociation is hindered by the low relative permittivity of toluene ( ϵ r = 2.38 ) and thus cannot contribute to the chirality transfer through the solvent.
A similar system of surfactant-stabilized CNCs in cyclohexane was investigated by Elazzouzi-Hafraoui et al. [126]. They changed not only the concentration range but also the rod length of the CNCs by altering the temperature during treatment with sulfuric acid. They found a similar dependence of aspect ratio for the phase diagram as predicted by Onsager theory and known from aqueous CNC suspensions (see Section 4.3 or Section 4.5, respectively): w 0 shifts from 16 to 21 wt.% and w 1 from 32 to 41 wt.% when the aspect ratio was reduced. Next to the aspect ratio, an accordingly altered surface charge due to the changed treatment time with sulfuric acid might play a role, too. However, this is not discussed in the publication. For very long rods (and thus a comparatively low surface charge) they found a kinetically arrested state, then above 22 wt.%, immediately after the end of the isotropic phase. Considering the theoretical results of Finner et al. [110] (see Section 5.1), we suspect that percolation and ordering, with appearance of birefringence, probably happened simultaneously in that case. We have seen the exact same phenomenon in CNC suspensions in the low-permittivity solvent DMF [122].
For the helical pitch Elazzouzi-Hafraoui et al. found a decrease from roughly 4.6 to 2.5 μ m for high aspect ratios and from 6.2 to 2.6 μ m for low aspect ratios when increasing the mass fraction. Note that, since the aspect ratio influences w 0 and w 1 , this does not necessarily mean that the aspect ratio has a direct impact on the pitch, but it can rather be related to the differences in CNC mass fraction at which the helix pitch was measured for the different aspect ratios. The authors compared their values to the ones found in an aqueous CNC system [56] which was produced with a similar method, showing pitch values one order of magnitude larger than in the cyclohexane system. Elazzouzi-Hafraoui et al. attribute the difference to stronger chiral interactions of CNCs in solvents with a low relative permittivity such as cyclohexane ( ϵ r = 2.02 ) compared to water ( ϵ r = 80.20 ). While this may be true, it is important to note that neither the lack of surfactants nor the substantially smaller diameter of the CNCs in the pristine aqueous system were considered, nor the roughly one order of magnitude greater mass fraction of CNC in the non-aqueous system. All these differences need to be taken into account, hence it is unclear whether or not the differences in pitch can be traced back to the solvent properties alone.
The only way to learn more about the specific effect of the solvent on CNC suspensions, is to investigate the same type of CNCs, i.e., with no differences in the CNC source, production method, surface charge and particle size, in varying solvents. We did this in a study from 2016 [122] for the solvents water ( ϵ r = 80.20 ), formamide ( ϵ r = 111.0 ), N-methyl formamide (NMF, ϵ r = 189.0 ) and N , N -dimethyl formamide (DMF, ϵ r = 38.25 ) and found striking correlations between the relative permittivity and the properties of the suspension. This set of solvents is interesting also from another perspective, and this is the ability to form hydrogen bonds. While formamide resembles water in the sense that both solvents form 3D networks of hydrogen bonds, NMF can only form 1D hydrogen bond chains, and DMF can act only as hydrogen bond acceptor, hence there are no solvent–solvent hydrogen bonds in DMF.
Starting with this latter solvent, we found that kinetic arrest coincides with the occurrence of birefringence at the low value w k 2 wt.%. This can be explained by the poor stabilization of the charged rods in DMF due to its low permittivity, reducing κ 1 according to Equation (1) and thus allowing closer encounters between rods. An additional effect may be the greater prominence of inter-CNC hydrogen bonding in a solvent that is such a poor hydrogen bond partner, deepening the secondary energy minimum in Figure 2 and thus increasing the chance of long-lasting connections between rods that meet. Percolation and gelation at low w would be the result. Note that the situation is not comparable to that of Frka-Petesic et al. [155] and Elazzouzi-Hafraoui et al. [126], where the solvents toluene and cyclohexane have much lower values of ϵ r still, because the CNCs were stabilized by surfactant in those studies. In contrast, we studied the behavior of pristine CNCs prepared by hydrolysis with sulfuric acid, thus electrostatically stabilized with H + counter ions, after transfer to DMF.
For the other three solvents, we initially reported that all phase diagrams were shifted to slightly lower mass fractions as ϵ r increased. A more careful look at the data, however, reveals that the onset CNC mass fraction w 0 is increased slightly as the permittivity of the solvent is increased, while w 1 shifts in the opposite direction. For water, w 0 2.5 wt.%, increasing to w 0 2.6 wt.% in NMF and w 0 2.7 wt.% in formamide. The variations are on the order of the error so one should be careful about drawing far-reaching conclusions here. The corresponding values for the stability limit of the cholesteric phase change more, w 1 8 wt.% for water, w 1 7.5 wt.% for formamide and w 1 7.3 wt.% for NMF. In the biphasic regime, we see a cross-over behavior around w 4 wt.%, corresponding to roughly 20% cholesteric and 80% isotropic phase. It is important to remember that the values reported here refer to the full macroscopic volume of the sample, which is highly disperse in terms of CNC rod length. Remembering the discussion in Section 4.5, this means that w 0 always refers to the longest rods of the sample nucleating the first tactoids of cholesteric phase, and w 1 always corresponds to the shortest rods, requiring the highest mass fraction to develop long-range order.
In order to make sense of these observations we note that the change in ϵ r has a direct as well as an indirect effect on the suspension. The direct effect is an increase of the Debye screening length as we move from water to formamide to NMF, since κ 1 ϵ r , see Equation (1). This would thus increase the effective volume fraction of the CNC at the same mass fraction, which would tend to reduce the critical mass fractions, explaining the change in w 1 , although the effect on the critical volume fraction ϕ 0 would also need to be considered. The indirect effect is more subtle. The CNCs used here still had the H + counter ions remaining after sulfuric acid hydrolysis, and here the degree of dissociation from the −SO 3 groups at the CNC surface can vary quite significantly depending on the solvent. A higher value of ϵ r promotes dissociation, as seen in the definition of the Bjerrum length, Equation (4), which decreases with increasing ϵ r . A higher ϵ r thus makes it easier for thermal energy to keep counter ions dissociated from the particles, yielding a greater concentration c c of free counter ions in the solvent. As Equation (1) has ϵ r in the numerator and I in the denominator, we see that the changes in dielectric permittivity and in free counter ion concentration could compensate each other, depending on how much c c is affected. It could be that the dissociation is very high in a high-permittivity solvent at low CNC content, while increasing CNC content gradually reduces the degree of H + dissociation, such that the increase in κ 1 provided by higher ϵ r starts dominating. This might explain the cross-over to lower critical mass fractions for high-permittivity solvents as w increases, but more extensive investigations are needed to draw clear conclusions. The dispersity of the sample, and the different effects of a greater Debye length on short and long rods, respectively, may be another factor to consider.
As for the helical pitch and how it depends on CNC mass fraction, we detected quite a remarkable effect of the relative permittivity of the solvent. In contrast to the conclusions from Elazzouzi-Hafraoui et al., we found that the magnitude of the pitch decreases with increasing ϵ r , a difference we attribute to our CNCs being pristine while theirs were surfactant-stabilized. However, most significantly, the variation in pitch with CNC mass fraction is greatly reduced as ϵ r increases. With water we found that p 0 decreases over a broad range, from 48 to 16 μ m as the CNC mass fraction increases from w 0 2.5 wt.% to w 1 8 wt.%. With formamide the pitch started out much shorter, decreasing from 16 to 12 μ m as the CNC content changed from w 0 2.7 wt.% to w 1 7.5 wt.%. With NMF, having the highest ϵ r , p 0 stayed more or less constant at the very low value of 3 μ m regardless of CNC mass fraction, from w 0 2.6 wt.% to w 1 7.3 wt.%. Moreover, also the time to develop the helix was strongly affected by the variations in ϵ r . Even though a linear dependence of this time on viscosity (increasing with increasing w) was found for all samples, the slope of this dependence was much greater for water than for the high-permittivity solvents formamide and NMF. The effect is significant, as illustrated by the fact that the time to reach the equilibrium p 0 at w = 8 wt.% decreased from 3 days in water to 14 h in formamide. It thus appears that high solvent permittivity has a dramatic effect in strengthening the chiral interactions between the CNCs, but the reason for this is not yet clear.
Concerning the mass fraction w k at which kinetic arrest occurs, no clear connection to the relative permittivity was found. It increased slightly from w k 8 wt.% in water to w k 9 wt.% in formamide and NMF. The highest w k value was actually found for formamide, possibly because this solvent gives a maximum dielectric permittivity while still maintaining a 3D hydrogen network between solvent molecules, thus counteracting the attractive interactions between CNCs due to inter-CNC hydrogen bonding.
Recapping this section, we want to point out that CNCs suspended in a variety of solvents are able to form the same liquid crystal structures as in conventional aqueous suspensions and that the solvent properties, especially the relative permittivity, have proved to be potent tools to alter characteristics such as the phase behavior, the helix pitch and its dependence on CNC mass fraction, as well as the kinetics of the system. However, one has to consider that alternative stabilization methods, i.e., the use of surfactants or surface grafting, have a major impact on the particle characteristics compared to suspensions with pristine CNCs. Moreover, it is important to recognize that the relative permittivity of the solvent can affect the behavior of a colloidal suspension in more than one way, directly and indirectly, and that variations in hydrogen bonding capacity of the solvent molecules can have strong impact on the interaction with the CNCs. This makes intuitive predictions about the colloid behavior difficult.

6.3. The Response of the Equilibrium Phase Diagram and Helix Pitch to Selected Solutes in the Aqueous Phase

Many papers have been published where the effects of salt addition on the characteristics of films produced by drying CNC suspensions have been investigated. The problem is that quite a few of them do not look into the equilibrium phase diagram behavior; often, the starting point is a low-concentration suspension that is fully isotropic, and the investigations are then focused on films formed by drying this suspension, while little or no investigations are done at intermediate concentrations. This renders it tremendously difficult to draw clear conclusions regarding the reasons for the characteristics of the final dry film, because—as should be clear from the previous sections of this review—there are so many factors of the equilibrium system that influence the end results, from the onset and completion of liquid crystal formation, to the helical modulation of the director field, to the tactoid dynamics, to the end of equilibrium via kinetic arrest, that we cannot know if one is more important than the other, and how they may be connected. Therefore, in this section we look exclusively at the papers that have investigated the effects of additives on the equilibrium behavior of aqueous CNC suspensions. As above, we point out that any mentions of w 0 and w 1 refer to the macroscopic, disperse, sample, hence the two values effectively correspond to different rod aspect ratios.
A classic paper is the already mentioned study by Dong et al. [56], in which they obtained a linear relationship between cholesteric volume fraction and CNC mass fraction by keeping the ionic strength constant through adjustment with HCl addition (see Section 4.3 in the context of Equation (13)). They also looked at how the phase diagram was shifted by salt addition, comparing HCl, NaCl and KCl. The authors found that the choice of salt did not matter, H + , Na + and K + cations having identical effects, and that all of them shifted the phase diagram to higher CNC mass fractions. A plot of w 0 versus concentration of added NaCl suggests a dependence on salt addition that roughly follows a square root relationship, but the authors did not fit any functions to the data. Considering the reported lack of sensitivity to the effect of counter ion of the added salt, it is worthwhile in this context to remind of the follow-up paper by Dong and Gray [57] discussed in Section 4.3, where they showed that the type of ion does matter, at least for the onset of liquid crystal formation, if salt is not simply added but if the counter ions of the CNCs are instead exchanged.
In [56], the authors also looked at the impact on the helical pitch of salt addition, again finding that the choice of counter ion was irrelevant, all salts having a very strong reducing effect on the pitch. For simplicity they considered a constant CNC mass fraction w fix , corresponding to the mid point of the phase coexistence region prior to salt addition, and they found that p 0 decreased non-linearly (again no fit was done so the exact function was not established) from ∼63 μ m in the pristine suspension to ∼30 μ m with the maximum possible salt addition of 2.5 mM. [171] When evaluating this effect one should note that the CNC mass fraction stayed constant, but the system moved from the mid point of the phase coexistence region to very near w 0 due to the effect of salt addition on the phase diagram. It would have been interesting to know how the pitch versus CNC mass fraction function was affected, but the reduction in p 0 as w fix w 0 via salt addition suggests that the effect may be similar to that of increasing ϵ r of the solvents, discussed above. Therefore, we may expect that increased ionic strength reduces not only the absolute value of the pitch but also its dependence on w.
In our study of two series of sulfuric acid-derived CNC with different strengths of the surface charge [117] we found that the relative effect of salt addition on w 0 is roughly the same for both CNC types. For instance, the addition of 2 mM NaCl to a suspension of the low surface charge (L) CNC increased the onset from w 0 L 3 wt.% to about 5 wt.%, whereas the same NaCl addition to the high surface charge (H) CNC-type shifted the onset from w 0 L 3.5 wt.% to about 5.5 wt.%, thus in both cases a shift of about 2 wt.%. Regarding the helix pitch, the salt-free suspensions showed slightly longer p 0 at identical w for low surface charge and both sample types showed a general trend of decreasing pitch upon NaCl addition, although experimental circumstances made data unreliable as well as somewhat inconsistent.
From a practical point of view in terms of tuning the parameters of cholesteric CNC suspensions and solid films made from them (discussed in Section 7.4), a problem with salt addition is that both the pitch and the phase diagram are strongly affected, making it impossible to tune one parameter without affecting also the other. In this respect, a very interesting additive is glucose, which was explored by Mu and Gray in a paper [172] investigating both the impact on the equilibrium CNC suspension properties and on the films dried from them, using acid form CNC (H + counter ions). We will come back to their observations regarding the latter aspect in Section 7.4, as we here focus on the equilibrium behavior. Interestingly, no impact whatsoever of glucose addition was found on the equilibrium liquid crystal phase diagram, w 0 being identical to the glucose-free suspension even up to 10% D-(+)-glucose [173]. In contrast, the equilibrium pitch was affected significantly by the glucose addition. Using a stock solution with w = 5.2 wt.% (in the coexistence regime, nearer w 1 than w 0 ), the cholesteric pitch was found to decrease from 11 μ m without glucose to 7 μ m with 10% glucose. In a preliminary experiment (to be published) where we tried to repeat this using a CNC suspension with Na + counter ions, we confirmed the absence of an effect on w 0 but the change in pitch was in the opposite direction, towards slightly longer values. While these data need to be confirmed, it could be that the type of counter ions plays an important role for the response of the helix formation even to uncharged additives like glucose. While Mu and Gray did not give quantitative data for w 1 and w k , the discussion suggests that w k was decreased, as glucose addition apparently promoted gelation. As we will see in Section 7.4, this had a striking effect on the color of the dried films produced by these suspensions.

7. Creating Color with CNCs by Drying Suspensions Into Solid Films: Where Intriguing Science Meets Promising Applications

We now have a quite good overview of how CNC suspensions behave in equilibrium and where the equilibrium range ends. When we move our focus to the process of making the colorful dried films that provides much of the applied motivation for CNC research, by evaporating the solvent from a sessile drop of CNC suspension, we must leave equilibrium for two reasons. First, the process of evaporating liquid from a droplet is fundamentally a non-equilibrium situation as we continuously change the composition of our system. Second, as we have seen above, the kinetic arrest that marks the end of equilibrium even in a closed system typically happens with some 90 wt.% water left in the system. This means that the path from the equilibrium CNC suspension to a selectively reflecting film covers a very extensive range of non-equilibrium behavior. Luckily, this range has recently been exquisitely analyzed by Frka-Petesic et al. [174], allowing us to largely refer to their paper for the details of the process. In this final section of our review before it is time to conclude, we will, nevertheless, summarize the key components of this important step. However, first we will explain where the selective reflection colors come from in the first place, pointing out what is needed to see the colors and how their presence should be tested experimentally. We also need to look into another non-equilibrium phenomenon that takes place in a droplet from which water is being evaporated, occurring prior to kinetic arrest, namely the coffee-ring effect. We will focus solely on aqueous suspensions of CNC in this section, as we are not aware of reports of films produced by drying non-aqueous CNC suspensions.

7.1. Bragg Reflection and Structural Color in Cholesteric Liquid Crystals

If we place a short-pitch cholesteric liquid crystal sample with vertical helix axis m on a black background and observe it along m (normal incidence), it will be difficult not to notice that the sample intensely (and quite beautifully) reflects a narrow wavelength range of light, giving it a strongly colored appearance, see Figure 10b,c. With “short-pitch”, we here mean 0.25 p 0.5 μ m, the range boundaries to be explained below. Moreover, if you look at the sample through right- and left-handed circular polarizers (for instance the right and left eyes of a pair of 3D cinema glasses, as in Figure 10), you will notice that the reflected color is unaffected by one of the polarizers but completely blocked by the other. Now, if you incline the sample such that you are looking along an angle θ 0 away from m (oblique incidence), making sure that ambient light is sufficiently diffuse that the sample gets illuminated from the opposite side at the corresponding angle θ , you will find that the reflection color is blue-shifted, i.e., the wavelength of the reflected color is shorter.
All these effects are illustrated in Figure 10b,c for the case of a large film prepared by drying a CNC suspension as well as for a small sample of thermotropic cholesteric liquid crystal enclosed between glass substrates with aligning layers, as reference. Both have reflection largely in the orange-red region for normal incidence. While the CNC film has a left-handed helical modulation the thermotropic sample is right-handed. You will notice that the effects just described apply perfectly to the small thermotropic sample, which we know has uniform helix pitch and perfectly vertical orientation of m, thanks to the aligning layers. With the CNC film, in contrast, we notice in Figure 10b that the left-handed circular polarization of the reflected light quickly is lost as θ is increased from zero. Moreover, the blue-shifting of the reflection color is more dramatic for the thermotropic sample than for the CNC sample. Figure 10c shows that the reflection from the thermotropic sample, viewed under the exact same conditions, retains very strong right-handed circular polarization even for very large θ . What we can conclude from this comparison is that dry CNC films indeed exhibit much of the optical characteristics that are inherent to equilibrium short-pitch cholesteric liquid crystals, but the behavior is often less pronounced, suggesting imperfections in the structure. As we will discuss a bit further below, removing these imperfections is a major goal for applied CNC research today. However, in order to do so, we first need to be able to characterize the films properly. To this end, let us first establish what the expected optical behavior is for an ideal cholesteric liquid crystal.
As mentioned in Section 4.1 the long-range orientational order renders a nematic phase birefringent, with refractive indices n and n | | for polarization perpendicular and parallel, respectively, to n. In terms of optics, the helical modulation of the director in a cholesteric is thus equivalent to a helical modulation of the optic axis. For a certain linear polarization of light entering along the helix direction, this means that the refractive index varies periodically between n | | and n with a period p / 2 , see Figure 10a.
Elucidating the optical properties of a birefringent medium with a helically modulated optic axis is not trivial: one needs to solve Maxwell’s equation for a medium with a continuously rotating dielectric permittivity tensor. The first to attempt this was Oseen [47], publishing the results in German in a journal of the Swedish Academy in 1928, then in English in his seminal 1933 Faraday Transactions paper on the theory of liquid crystals [175]. This allowed him to explain some of the curious optical properties of cholesterics, namely the fact that there is a wavelength band gap in which light incident along the helix axis m is separated into two circularly polarized eigenmodes, one of which is fully reflected and one of which is transmitted. Although his calculations were mainly restricted to the case of normal incidence, he also noted that the reflection at oblique incidence should be shifted to shorter wavelengths, i.e., the observed blueshift was qualitatively accounted for.
Twenty years later, Hessel de Vries published the next milestone paper [101] regarding the optical properties of cholesterics (without mentioning Oseen’s prior work). This was more complete and covered many other aspects, including the variation in optical rotatory power for wavelengths outside the bandgap and the effect of the sample boundaries. The language in de Vries’ article is closer to modern terminology than that of Oseen’s, and we can thus easily recognize many key points in this article, such as the width of the bandgap being equal to p Δ n , where Δ n = n | | n , i.e., the magnitude of the nematic birefringence. While de Vries also restricted the calculations to normal incidence, he makes a note in the introduction (without derivation or motivation) that the selective reflection wavelength at oblique incidence approximately follows Bragg’s law, noting that there appears to be repeated reflections at periodically spaced internal planes. These are, of course, as imaginary as were Lawrence Bragg’s planes applied to x-ray crystallography, but they are a helpful tool. In cholesterics, the planes are defined by the locations along m where the refractive index repeats itself, as graphically illustrated in Figure 10a (see caption for further details). More detailed analyses of the behavior at oblique incidence were presented by Fergason [176] (this paper considers samples with arbitrary helix orientation with respect to the sample plane), Dreher and Meier [177] (here an analysis of how far the analogy with Bragg reflection holds is provided) and Berreman and Scheffer [178,179] (numerical analyses of oblique incidence properties are compared with experimental data).
As the optics of cholesterics is truly complex we will not go into further detail, but refer the interested reader to the above references. Here, we instead summarize the key outcomes of the theories, which are very important for properly understanding what to expect from cholesteric CNC suspensions and films prepared by drying them, and for analyzing samples in a proper manner.
  • Light incident along the helix axis, m, with a wavelength λ c , as measured inside the cholesteric, that is identical to the helix pitch p, is separated into two eigenmodes that are perfectly circularly polarized, one right-handed and one left-handed. The mode with handedness opposite to that of the helix propagates unobstructed, but the one with the same handedness cannot propagate at all; it is totally back-reflected. This means that analysis of the reflected light through circular polarizers will show the reflected color if the polarizer has the handedness of the helix, while it will show no reflection if the polarizer has the opposite handedness.
  • Because the cholesteric is birefringent and thus does not have one single refractive index, the condition λ c = p is not uniquely defined when considering light wavelengths λ in air, prior to entering the cholesteric. Therefore, we find a band of air wavelengths that satisfy the reflection condition, from λ m i n = p n to λ m a x = p n | | (assuming Δ n > 0 ). This gives us a reflection band of width p Δ n for the air wavelengths around λ 0 = p n ¯ that are selectively reflected, where the average refractive index is calculated as n ¯ = n | | 2 + n 2 2 . (To calculate the average refractive index we must first calculate the average dielectric permittivity, ϵ r = n 2 , which is the proper material constant for use with Maxwell’s equations, and then take the square root, n = ϵ r .) Considering that visible light wavelengths in air range from about 400 nm (violet) to about 700 nm (deep red), and that the average refractive index in dry CNC films can be expected to be n ¯ 1.6 (based on values reported for n and n | | for crystalline cellulose [14]), this means that the helix pitch in the film should be in the range 250 < p < 440 nm in order to see selective reflection at normal incidence.
  • For oblique incidence, i.e., if the incoming light beam does not enter along m but at an angle θ from the helix axis, the mean selective reflection wavelength, as measured in air, varies approximately according to Bragg’s law:
    N λ 0 = p n ¯ cos θ .
    Here, N is an integer that can be greater than 1 for oblique incidence, i.e., higher-order reflections may occur under these conditions. For normal incidence, N = 1 strictly, because the perfectly sinusoidal modulation of the refractive index along the helix has no harmonics [177].
  • The polarizations of the eigenmodes at oblique incidence, θ 0 , are elliptical rather than circular. This means that, since any elliptical polarization different from circular can be separated into one left- and one right-handed circular component, neither of which is zero, analysis of the reflected light through circular polarizers should not give perfect extinction with the polarizer that has opposite handedness of the helix. However, for a well-aligned ideal cholesteric helix, the deviation from circular polarization is very small even up to large angles, hence the effect is practically negligible, see Figure 10c. Thus, even at oblique incidence, circular polarizers are very useful for assessing the quality of a cholesteric film.
  • If the helix axis m is in the plane of the sample, no selective reflection will be seen. If the pitch is smaller than light wavelengths, the light averages the effect of the helix and experiences regular birefringence where m is the optic axis, with extraordinary component n e = n for polarization along m and ordinary component n o = n ¯ for polarization perpendicular to m. (The refractive indices n and n | | , and through them also n ¯ , still refer to orientations with respect to n.) Note that this means that the birefringence of the short-pitch cholesteric observed perpendicular to m is negative. On the other hand, if the pitch is longer than light wavelengths, light will resolve the variations of optic axis orientation, and the sample appears with the characteristic ’fingerprint’ texture that we have seen in, e.g., Figure 8, where dark bands correspond to n normal to the sample plane, along the light incidence, and bright bands are seen for n in the sample plane (assuming that m is parallel to neither polarizer nor analyzer). This means that the distance between two consecutive dark (or bright) bands is p / 2 ( n = n ).

7.2. Drying a Cholesteric Gel: The Appearance of Color and Its Dependence on Drying Conditions

As we have just seen, visible selective reflection typically calls for a helix pitch below 0.5 μ m, yet the equilibrium cholesteric pitch in CNC suspensions is often on the order of tens of μ m, going down to ∼3 μ m in the shortest cases. So, how do we explain the appearance of visible color in the films? The answer must be sought in the non-equilibrium process that starts with kinetic arrest and ends with a dry colorful film, a stage of drying that was long left largely uninvestigated [11]. Frka-Petesic et al. took on the task of filling this knowledge gap, considering the process first on a more qualitative level [14], then with extraordinary detail, combining theory, simulation and experiments, in an absolutely exquisite study [174]. We believe this will become a landmark paper, as it explains almost all mysteries of the optical characteristics of films prepared by drying CNC suspensions.
The kinetic arrest marks the end of dynamic liquid crystalline organization within the sessile droplet from which dry CNC films are made. Whatever arrangement of CNCs prevails at this point is locked in place; tactoids can no longer merge or reorient and any boundaries or discontinuities in the director and/or helix orientation field will remain. However, at this point we still have 90 wt.% of the sample mass left in the form of water, which will leave the sample by evaporation (or diffusion; see below) as the kinetically arrested droplet is transformed into a dry film. If we consider a droplet that is pinned to its substrate, which is generally the case on hydrophilic substrates [14], the removal of the water will induce a significant compression along the vertical direction of the lab frame, which we now denote z ^ for clarity. Considering the typical quite low values of w k 10 wt.%, the compression factor α = d f / d k a can be considerable, where we define the droplet thickness at kinetic arrest as d k a and the final film thickness as d f . A value of α = 0.1 can readily be expected, the result seen nicely in Figure 4; the rods are stacked right on top of each other in the dry film, very differently from the equilibrium liquid crystal phase situation. The significance of this compression on the optical properties can be tremendous, because of the complex distortion of the helical structure that it entails, as illustrated in Figure 11, from [174].
The first key observation of Frka-Petesic et al. is that the uniaxial compression will not only compress the helix pitch to a much lower value, thereby explaining why we get pitch values on the order of visible light wavelengths in the dry films although the equilibrium helix pitch never goes below p 0 3 μ m, but also that the factor by which the pitch changes depends greatly on the orientation of m with respect to the lab frame at the point of kinetic arrest. The original helix orientation at kinetic arrest of an arbitrary domain, with final pitch p k (which may be longer than p 0 , since the time to acquire the equilibrium pitch diverges with the diverging viscosity as w k is approached), is illustrated in Figure 11a. A local Cartesian coordinate system ( e 1 ^ , e 2 ^ , e 3 ^ ) is introduced, with the original helix axis orientation given by m and the director rotating in the e 1 ^ , e 2 ^ plane. Only if m = e 3 ^ = z ^ would the helix pitch be maximally reduced to the minimum final value of p f min = α p k . With a non-zero angle β between m = e 3 ^ and z ^ the compression will be smaller, as is qualitatively easy to see from Figure 11. Quantitatively, the helix pitch compression depends on the original helix tilt β as [174]:
p f / p k = 1 sin 2 β + α 2 cos 2 β
We may quickly verify for the extreme values that p f / p k ( β = 0 ) = α and that p f / p k ( β = 90 ) = 1 , as expected.
Next, the authors also realized that the compression along z ^ applied to a domain with inclined helix, m = e 3 ^ z ^ , will also reorient the helix, towards a slightly more vertical direction m . The reason is that the only physically meaningful definition of a helix axis is one that is perpendicular to the director, but as is clear from Figure 11b, showing the helix after compression by a factor α , the direction e 3 ^ is clearly no longer perpendicular to n after compression. Instead, a new helix orientation m can be identified as in Figure 11c. This is related to the fact that the original local coordinate system ( e 1 ^ , e 2 ^ , e 3 ^ ) is no longer orthonormal, i.e., it is no longer a Cartesian coordinate system.
Finally, and very importantly, the new helix axis m no longer describes a perfectly helicoidal modulation of the optic axis, in which the optic axis rotates by a constant amount d φ / d m (where we define the variable m to indicate location along the new helix axis m ). Instead we find regions of decreased twist ( d φ / d m ) alternating with regions of increased twist ( d φ / d m ) + > ( d φ / d m ) (see [174] for details). This is significant because this deformed helix can no longer be described by a pure sinusoidal function. Its function contains higher harmonics, which means that the selective reflection is no longer circularly polarized as for an ideal cholesteric helix. Moreover, in contrast to the case of equilibrium cholesterics, with a perfectly sinusoidal helical director modulation, we can now have higher-order Bragg reflections even for observation along the helix axis ( N > 1 in Equation (16)). Thus, domains that did not exhibit a vertical helix axis at the point of kinetic arrest, m z ^ , will (1) have a longer final pitch p f than vertical domains, (2) have a helix axis that is not oriented along the film normal (although it is closer to the film normal than the original helix axis was), (3) reflect light that is not perfectly circularly polarized, hence it passes both a right- and a left-handed circular polarizer, and (4) give rise to higher-order reflections even for observation along the helix.
With this excellent analysis by Frka-Petesic et al. of the effect of vertical compression of a kinetically arrested cholesteric CNC suspension we realize that there are considerable analogies between the way in which colorful dry CNC films are made and the ’anisotropic deswelling’ method introduced by Heino Finkelmann and co-workers for aligning cholesteric liquid crystal elastomers (CLCEs) [180]. When making a CLCE, a solution of reactive mesogens in excess volatile solvent is kept in a vial and the solvent is evaporated while the reactive mesogens polymerize to form a 3D network. The network formation corresponds to the kinetic arrest in a drying CNC suspension. While the original anisotropic deswelling method employed long-term centrifugation during solvent evaporation to ensure the required unidirectionality of sample compression [180,181], thereby orienting the helix perpendicular to the resulting elastomer film, we recently demonstrated that the same effect can be achieved without centrifugation if the solution droplet is pinned to the substrate to avoid horizontal compression [182], just as for the case of drying CNC suspensions. Moreover, when a CLCE is stretched in the film plane, perpendicular to the helix axis, the perfect sinusoidal modulation of the optic axis is lost. Just like for films produced by drying CNC suspensions in which m is not vertical, an alternating arrangement of rapid and slow director rotations results, removing the circular polarization of the reflected light such that the color is seen almost with equal strength through left- and right-handed circular polarizers [182,183].
We may now go back to the clearly non-ideal optical behavior of the dried CNC film in Figure 10, explaining all observed discrepancies by applying the model of Frka-Petesic et al. First, the reason why the color stays red over a much greater tilting range than for the thermotropic sample is that there were domains in the kinetically arrested sample from which the film was made in which the helix axis was not vertical in the lab frame, m z ^ . We note that the color at normal incidence observation is red, which means, according to Bragg’s law, that the pitch of the domains with vertically oriented helix in the film must be on the long side of what generates visible light, i.e., p 0.5 μ m. Frka-Petesic et al. tell us that these domains have the strongest compressed helix, i.e., the shortest pitch, which means that domains with longer pitch will be reflecting in the infrared for observation along the helix. We will thus see almost only the reflection from the domains with vertically oriented helix, which retains a near-perfect helicoidal modulation and thus gives us strong circular polarization, the color disappearing when observing through a right-handed polarizer. As we start observing the film obliquely, however, domains with longer pitch will eventually start reflecting in the visible, as explained by Bragg’s law. This means that, while the reflection from the original domains blue-shifts towards yellow, this reflection is mixed with a new red reflection from the tilted domains, and it is difficult to see a clear change in color. What is easy to see is the loss of circular polarization, which we can now understand to be a result of the reflection from the tilted domains, in which the helix has been distorted by the compression, losing its circularly polarized reflection.
The analysis of Frka-Petesic et al. goes much further still, also discussing, for instance, which periodic patterns may arise at the intersection between tactoids and substrate when the helix is not vertical, and how the distribution of final helix orientations should change depending on the compression factor and the original quality of alignment. We encourage the reader to discover these and other aspects by reading the original paper.
Strengthened with this insight we can conclude that in order to get as close as possible to ideal cholesteric optics from dried CNC films, it is imperative to ensure a vertical helix orientation as well as a single value of p throughout the sample prior to kinetic arrest. There are a few strategies aimed at reaching this goal, two of which we will describe now. The first approach is to apply a magnetic field in the vertical direction [3,46,184,185,186]. Because CNCs have negative diamagnetic anisotropy, n tends to align perpendicular to an applied magnetic field, which means that m will align along the field. The first studies of magnetic field alignment of cholesteric CNC suspensions reported rather high required field strengths [3,184,185] but more recent reports show that very good results can be achieved with reasonable fields (0.5–1.2 T), easily obtainable with commercially available permanent NdFeB magnets [186]. Second, a smart way that was introduced by the MacLachlan group is ’tactoid annealing’ [98], meaning that the evaporation of the water is slowed down very much by raising the humidity of the surrounding atmosphere. Tactoids then have time to merge and adopt a uniform helix orientation, tending to vertical as the tactoids sink to the bottom and feel the planar-aligning influence of the bottom substrate. If the drying is carried out in a petri dish, for instance, once the CNC mass fraction reaches a high enough value to have a significant cholesteric fraction, but low enough to not enter kinetic arrest, a cover can be placed on it to stop evaporation for a time on the order of a day or two. This gives the tactoids that have formed time to merge and the helix to align vertically. The cover can then be removed, or a small hole can be opened, in order to complete the water evaporation to produce the dry CNC film, with improved optical properties thanks to a more uniform orientation of m.
The slowing-down of the droplet drying can be done in another smart way, which also has another highly beneficial effect. We will see how in the following section, after we have introduced one more critically important non-equilibrium phenomenon.

7.3. The Coffee-Ring Effect and How to Avoid It

From a general colloids and interface science perspective, studying the evaporation of colloidal suspensions and the linked process of particle deposition on the supporting substrates is a phenomenologically simple physical problem, or at least it may appear so. This also holds true for the case of CNC suspensions that are dried to yield colorful films. However, a more detailed look at the problem reveals that, regardless of the particular drying geometry under investigation (e.g., a sessile drop on a glass slide or a thick liquid film inside a Petri dish), a multitude of physicochemical phenomena are simultaneously at work. These typically include, for instance, macroscopic phenomena such as hydrodynamic flow patterns [187] and microscopic effects such as particle-particle and particle-interface interactions [188]. Additionally, phenomena that simultaneously involve different length- as well as time-scales, such as wetting and the dynamics of the three-phase contact line, are always part of the puzzle [187,188]. Apart from its scientific beauty, the problem of evaporating colloidal suspensions—not only CNC suspensions—is an important one from a practical viewpoint. Developing multifunctional surfaces requires patterning of (nano) particles in a controlled and reproducible fashion, so that their collective properties, for instance, can emerge. Intuitively, a simple strategy to pattern particles on solids is to cast a given volume of particle suspension on the surface and let the solvent evaporate, as we do when making dry CNC films. Despite its conceptual and practical simplicity, however, this method poses several challenges, as we will now explain.
In a typical experiment of drying a colloidal suspension, a sessile drop is dispensed on a partially wetting solid substrate, i.e., with a contact angle of less than 90 (volume on the order of μ L, drop base radius on the order of mm). Very frequently, the suspension drop is pinned on the substrate, which means that its contact line is not allowed to recede (or advance) to a new position other than its initial one. Contact line pinning is a general phenomenon that is observed even in drops of pure liquids, and it is attributed to heterogeneities on the substrate surface, which can be either of geometrical (i.e., roughness) or chemical (i.e., non-uniform surface composition) nature. In particle-laden drops, the additional effect of self-pinning might occur, where the concentration of particles at the contact line can strengthen the initial pinning [189]. When the solvent in a pinned sessile drop evaporates, the mass of liquid lost near the edge of the drop is larger than that at its center. This is because the probability of escape of an evaporating solvent molecule depends on its point of departure. Escaping molecules undergo a random walk, and a molecule starting from the center of the drop has a higher probability to be re-adsorbed compared to a molecule near the contact line [189]. Surface tension dictates that the free surface of the drop (i.e., the liquid–gas interface) must always assume the shape of a spherical cap. This, in combination with the geometrical constraint of contact line pinning, and the non-uniform evaporation rate across the free surface of the drop, results in liquid being squeezed outwards to replenish the molecules lost there. The particles suspended in the drop will be dragged to the edge because of this flow, leading to a progressive increase in the local particle concentration (i.e., at the drop edge). When all solvent molecules are lost, most particles that were initially uniformly dispersed in the drop are gathered at the initial drop periphery, forming ring-shaped deposits. This phenomenon, known as the coffee-ring effect, was first explained by Deegan and co-corkers in a seminal paper published in 1997 [190].
The coffee-ring effect occurs in a plethora of situations of evaporating colloidal suspensions, regardless of the specific properties of the system (substrate, solvent and particles) and it is insensitive to numerous experimental conditions [189]. This can be understood if we consider that the main requirements for the coffee-ring effect to take place, namely (i) a non-zero contact angle, (ii) contact line pinning, (iii) enhanced evaporation at the drop edge and (iv) absence of counter-acting flows such as Marangoni effects (discussed below), are met in numerous occasions. The requirements are also fulfilled in the case of evaporating CNC suspensions, hence it is reasonable to hypothesize that the coffee-ring effect is an integral part of the process of CNC film formation. Figure 12a, showing superpositions of images acquired during the evaporation of an aqueous CNC suspension droplet containing a small amount of polystyrene microspheres that act as flow tracers, confirms this hypothesis. During the interval 0.80 t evap 0.87 t evap , where t evap is the total evaporation time, tracers follow a radial flow with a direction from the drop center to its edge. However, the tracers cannot reach the edge of the drop because a large number of them has already accumulated in a thick band that starts from the contact line. Qualitatively, the same hydrodynamic pattern is retained until the end of the drying process, but the thickness of the band significantly increases with increasing t (see image corresponding to 0.93 t evap 1.00 t evap ). It is reasonable to assume that the dispersed CNC particles also follow the flow pattern revealed by the tracer microparticles. This is confirmed by the characteristic ring-shaped deposition patterns that are obtained after complete water evaporation (inset in Figure 12a and top panel of Figure 12b). The ring morphology of the CNC film is quantitatively verified by measuring the height profile with a profilometer (Figure 12b, bottom panel).
The first authors that reported on the connection of the coffee-ring effect to the morphological and optical properties of dry CNC films resulting from sessile drop evaporation, were Mu and Gray five years ago [191]. These authors used profilometry to characterize the morphology of the obtained CNC deposits, and mentioned that the increased CNC concentration at the drop periphery must be due to the coffee-ring effect, which transports the CNCs toward the edge of the pinned drop. Furthermore, they attempted to connect the longer wavelength reflection colors at the outer region of their films to the enhanced tendency of the system to ’freeze-in’ the cholesteric structure due to this local increase in CNC concentration. The authors concluded that mass transfer and gradients in CNC concentration during the film formation process affect the pitch and the orientation of the cholesteric helix [191]. Despite the reasonable reference to the coffee-ring effect, Mu and Gray did not provide direct evidence of its occurrence. To our knowledge, Figure 12a is the first report of flow visualization of the coffee-ring effect in drying drops of aqueous CNC suspensions.
To further understand the coffee-ring effect and its impact, we need to look into the details of the film drying procedure, this time focusing mainly on the period before kinetic arrest. It is worth noting that, although the coffee-ring effect occurs in sessile drops, its main component, the evaporation-induced outward flow, has a strong impact on the characteristics of deposits obtained from drying situations/configurations other than sessile drops, if a pinned contact line exists. Therefore, the following discussion is important regarding the drying of CNC suspensions in general, regardless of the specific drying geometry. Figure 12b immediately reveals the most common shortcoming of employing suspension evaporation for CNC film production. When viewed under white light illumination and at normal incidence, the film displays a radial variation of reflection colors. Applying what we have learnt above, we can conclude that there is a radial variation in the microstructure within the material, possibly with pitch as well as helix orientation variations.
Apart from its profound influence on the morphology of the final deposit, the capillary outward flow (see Figure 12a) obviously dictates the evolution of particle distribution within the drop, both in space and time during the evaporation process. The resulting particle concentration gradients are particularly important in the case of drying CNC suspension drops, because we are dealing with a lyotropic liquid crystal: the CNC mass fraction w is, after all, the main parameter which dictates the phase behavior, helix pitch, and thus the properties of the system. Any drying drop is, by definition, an out-of-equilibrium system, where at any stage insufficient time is provided for the system to reach an equilibrium configuration that corresponds to its particular particle concentration at that point in time. To further complicate matters, a given average mass fraction for the drop does not provide information about the local mass fractions at different locations within the drop. These are defined by the hydrodynamic flow patterns, which transport particles to specific locations, acting against diffusion which tends to distribute particles uniformly. If we wish to avoid the radial color variations and acquire homogeneous optical properties, we thus must counteract these flows, so we must inhibit the factors that induce them.
A crucial parameter that calls for special attention is the total evaporation time (in other words, the drop lifetime), a slowed-down drying process being the key element of the previously mentioned tactoid annealing strategy [98]. This slowing-down was achieved by increasing the relative humidity, R H , allowing the tactoids inside the droplet to rearrange, fuse and adopt a uniform helix orientation. In addition, increasing the R H of the environment in which a sessile CNC suspension drop dries dramatically weakens the strength and impact of the coffee-ring effect on the CNC deposition after the evaporation process is complete. The benefits of weakening the evaporation-induced flow can be seen in Figure 12c, where R H was significantly increased during the droplet drying. This resulted in the final CNC deposit adopting a more uniform disk-like morphology (compared to the ring-shaped pattern in Figure 12b for lower R H ), as evidenced from the measured height profile across the film.
We have very recently carried out a detailed investigation on the impact of R H on the CNC distribution in the dry films and their optical uniformity [192], finding that the relative humidity strongly affects the hydrodynamics of the drying drops. In drops that dry quickly under ambient humidity, the coffee-ring effect dominates for a large portion of the drop lifetime. On the contrary, in drops that dry slowly under humid conditions, there is an antagonism between a weakened evaporative outward flow and a circulatory flow linked to the formation of tactoids. The former dominates only toward the end of the drying process, rendering the impact of the coffee-ring effect significant only for a small portion of the drop lifetime. This results in the homogeneous distribution of CNC particles in the dry film, leading also to quite uniform structural color, as the one shown in Figure 12c.
One of the best demonstrations of how useful it is to slow down the drying process can be found in the study by Zhao et al., where arrays of extremely uniform CNC microfilms were fabricated by drying multiple nanoliter sessile drops on substrates with patterned wettability [9]. Their key trick was to inhibit evaporation completely by covering the CNC suspension droplet under a thin layer of immiscible oil (hexadecane), thereby replacing water loss by evaporation with water loss by diffusion into the oil. Since this is saturated in water at very low concentrations, accepting more water only after the water has evaporated from the oil phase, the water extraction is dramatically slowed down and it takes place uniformly across the film, thus not setting the usual hydrodynamic flows in motion. This strategy led to films of a single color and a dome-shaped morphology, as verified by profilometry. Contrarily, when a droplet of CNC suspension of the same type (and the same volume) was dried in ambient conditions, the strong evaporation-driven radial flow led to strong coffee-ring-like particle deposition and films with radial color variation. The slowing-down of water loss by coverage by an oil phase was systematically studied earlier by Shimura et al. for the purpose of avoiding evaporation-driven abnormalities in aqueous protein solutions during capillary electrophoresis [193]. The data in Figure 2 of that paper are very useful for identifying the right amount of oil to a certain aqueous droplet volume for tuning the drying rate to a desired value.
Another approach was explored by Gençer et al. [194]. They introduced ethanol into the atmosphere in which a sessile CNC suspension droplet was evaporating, thereby setting up a circulatory Marangoni flow that partially compensated for the evaporative outward flow. Marangoni flows are surface flows that are caused by gradients in the interfacial tension of a liquid, themselves caused by gradients in temperature (thermal Marangoni) or concentration of a surface-active component such as surfactants (solutal Marangoni). It has been shown that both thermal [195] and solutal [196] Marangoni flows can have a dramatic impact on the distribution of colloidal particles upon drying of a sessile suspension drop. In the case of Gençer et al., [194], adsorption of ethanol at the air–water interface led to a local reduction in the surface tension and thus the emergence of a solutal Marangoni flow. While this should allow for a much faster drying than with oil coverage, the balancing of the flows is challenging. Although the results presented were promising, the films were not as uniform as when drying the CNC suspension under oil. Moreover, the ethanol will diffuse into the CNC suspension, thereby certainly affecting the liquid crystal self-organization.

7.4. To What Extent Can We Tune the Properties of CNC Films?

If we succeed in achieving uniform film color, the next desirable step would be to be able to select which color the film exhibits. It would also be valuable if we can work on the mechanical properties of the film, in particular making them less brittle and more flexible than a pristine CNC film. Several groups have worked along these goals for a long time, also long before the full complexity of the drying process was realized. The focus has often been only on the final film, without paying attention to the intermediate stages, hence it is not always easy to draw clearcut conclusions. Nevertheless, the experimental findings may give valuable insights, so we summarize some reports on tuning the properties of CNC films that we are aware of.
Pan et al. [197] reported an increase in the helix pitch of dry CNC films when increasing the initial concentration of the suspension used, although the range studied for the starting suspension was always in the low-concentration, fully isotropic regime. They also explored addition of NaCl up to 0.5 mM, then finding a linear decrease with salt concentration for the pitch in the solid film. Beck et al. investigated the influence of ultrasonic energy treatment of aqueous CNC suspensions that were dried in polystyrene Petri dishes to produce iridescent films [198]. Ultrasonication by sonotrode tip red-shifted the reflection wavelength band, the magnitude increasing with the energy input per gram of CNC, see Figure 13a. Suspensions treated with different energy inputs could be mixed and drying of these mixtures led to films with reflection bands corresponding to an intermediate level of ultrasonication. The authors suggested that this effect was electrostatic, involving the release of ions trapped in the bound water layer at the surface of the CNC. Parker et al. argued that the ion release cannot explain the observations on its own, and suggested that ultrasonic breaking of CNCs effectively leads to a reduction in chiral species, which could thus explain a redshift [14]. To the best of our knowledge, potential artifacts from titanium particle release from the sonotrode tip have not been investigated in this context. At least in the field of carbon nanotube research, the contamination by sonication-derived titanium particles has been confirmed to be significant [199], and it is not impossible that such particles will also influence the cholesteric liquid crystal self-organization in CNC suspensions. Nguyen et al. varied the substrate on which CNC suspensions were dried, achieving varying contact angles of the suspension drops [200]. Opaque films were formed on the most hydrophobic substrates like polytetrafluoroethylene, whereas blue films were formed on the most hydrophilic surfaces, such as aluminum. Drying on substrates with intermediate wettability, such as cellulose acetate, gave rise to yellow-red films. One should note that studying the effect of varying wettability is far from trivial, because it is always accompanied by changes in other parameters that also play important roles in different aspects of the drying (and the liquid crystal self-organization) process.
Several groups have explored the role of additives introduced in CNC suspensions on the properties of the dried films, thus connecting to the discussion in Section 6.3 but now with the focus on the final dry film rather than the equilibrium properties. The shortening of the equilibrium cholesteric pitch that is typically provided by salt addition (Section 6.3) would lead to the expectation that also the pitch of the final film is blue-shifted by salt addition. This is indeed what Revol et al. found in their seminal study focusing on achieving visible reflection from dried CNC films [3], tuning the normal incidence reflection color from the infrared to yellow, see Figure 13b. They achieved similar results by reducing the CNC surface charge by controlled desulfation.
We can now come back to the study by Mu and Gray of addition of D-(+)-glucose to CNC suspensions, discussed regarding the equilibrium behavior in Section 6.3. As mentioned there, the glucose tends to decrease the equilibrium pitch without impacting w 0 , but it also promotes gelation, suggesting that w k is reduced. When investigating the films prepared by drying glucose-enriched CNC suspensions, Mu and Gray found the surprising result that the color was red-shifted the more glucose was added. The authors proposed that the explanation is to be found in the promoted gelation: although the glucose tends to reduce the equilibrium pitch at a certain CNC mass fraction, the earlier kinetic arrest means that the pitch locked in by gelation was still longer than without glucose, leading to longer pitch in the dry film and thus a red shift of the reflection color. Another aspect is that the glucose remains in the final film, thus probably reducing the effective compression somewhat. A shift to longer reflection wavelengths was also observed by Guidetti et al. [202] when adding zwitterionic surfactants, with head groups that contain positive ammonium as well as negative sulfate groups. A model was proposed where the ammonium group was assumed to electrostatically interact with the negatively charged sulfate groups of the CNC, the hydrophobic alkyl tail of the surfactant acting as a small ’spring’ between CNCs. With increasing surfactant concentration (keeping the CNC mass fraction w constant), the normal incidence reflection shifted from mainly green-yellow to red and eventually to infrared.
Apart from low molar mass additives, the influence of macromolecules on the optical properties of CNC films has been studied extensively. Bardet et al. [203] explored the effect of an anionic polyelectrolyte (sodium polyacrylate) and a neutral polymer (polyethylene glycol) on the self-assembly properties of CNC in suspension and films produced by drying. The film color was blue-shifted by increasing the amount of non-adsorbing sodium polyacrylate. This effect was attributed to a decrease in the equilibrium chiral nematic pitch, which could be either due to osmotic pressure differences or because of the highly hygroscopic character of sodium polyacrylate, resulting in enhanced adsorption of water molecules. Polyethylene glycol was found to increase the flexibility of the CNC films. In a following study, Yao et al. reported that intercalation of polyethylene glycol macromolecules between CNC led to an increase in the pitch of the composite film. As a result, increasing the relative amount of polyethylene glycol caused a continuous red-shift of the reflectance band, which enabled the authors to tune the photonic bandgap of the film by varying its composition [134], see Figure 13c.
The beauty of non-cellulosic polymer incorporation is that the films also become much less brittle, reaching sufficient flexibilities for complete bending without breaking [134,203]. An interesting alternative is to polymerize reactive monomers within the drying CNC suspension, a route explored by Wu et al. [135]. By making a sandwich structure including a thin polymer sheet acting as a λ / 2 plate between two polymerized CNC sheets, they mimicked the marvelously smart structure of the Plusiotis resplendens beetle [12,204] that reflects all light with wavelengths in the reflection wavelength band, thus right- as well as left-handed polarizations, thanks to the handedness inversion provided by the λ / 2 plate. The resulting composites were not only flexible and highly uniform in color, but they also changed their shape in response to exposure to humid air.
An interesting variation of the concept with an introduced λ / 2 plate was presented by Fernandes et al. [205]. They took advantage of the cracks that frequently form within films produced by drying CNC suspensions, filling this with the commonly used thermotropic nematic liquid crystal 5CB (4’-n-pentylbiphenyl-4-carbonitrile). As it aligned with its director, and thus optic axis, in the plane of the film, and as the crack thickness was about right to give the 5CB layer a λ / 2 retardation effect, the relaxed-state film reflected both circular polarizations. However, by applying an electric field they could switch the director of the 5CB layer out of plane, thereby removing the optical effect of the intermediate layer, getting the one-handed circular polarization reflectivity back. This allowed them to dynamically switch between polarized and unpolarized reflectivity. MacLachlan and co-workers explored a similar approach [136], infiltrating a dried CNC film with the thermotropic liquid crystal 8CB (4’-n-octylbiphenyl-4-carbonitrile) such that it replaced the air in the pores of the film. By heating or cooling the composite past the temperature where 8CB transitions into an isotropic liquid, they could switch the overall reflective properties thanks to the refractive index modulation in the 8CB-filled pores. At room temperature, the film reflected green light, whereas at 48 C, with 8CB in the isotropic phase, the film was colorless.

7.5. Parameters and Effects Meriting Further Investigations

Our understanding of CNC suspensions and their liquid crystal as well as non-equilibrium behavior is finally starting to mature, such that clear strategies can be laid out on how to make valuable materials from CNCs. Nevertheless, there are still significant open questions remaining and a few issues have not yet been thoroughly addressed. We end this review by highlighting some of them, as inspiration for future research thrusts.
Although there has been a strong increase in the number of groups exploring film formation from drying CNC suspensions, there remains the question about the quality and the properties of the CNC particles utilized. Some reproducibility difficulties can certainly be attributed to incomplete characterization of the CNCs, with uncontrolled parameters leading to different results during different experiments. Many groups prepare their own CNC batches, typically applying sulfuric acid hydrolysis on materials from cotton or wood sources. Even though a specific preparation protocol is frequently followed [104], small variations in the procedure are perhaps unavoidable. On the other hand, there are now several companies that produce CNCs on industrial scale. Reid et al pointed out the importance of the various sources and the preparation methods (e.g., hydrolysis conditions and post-extraction treatments) on the properties and hence the behavior of CNCs [15]. This calls for a thorough characterization of any type of CNCs prior to using it for fundamental or applied studies. They discussed in detail the methods and procedures that should be employed, for instance to characterize the dimensions and surface properties of CNCs and their colloidal stability. As we have discussed in detail in this review, these properties dictate both the equilibrium and non-equilibrium behaviors of CNC suspensions and thus the properties of CNC films resulting from drying them. Furthermore, a detailed comparison of the characteristics of CNCs prepared on the bench scale to commercial batches from various companies was done.
Some phenomena that can be expected to affect the formation of films, and thus their optical features, have either so far been generally overlooked or they have just not been investigated thoroughly yet. For instance, naturally occurring flows (i.e., not imposed by external fields) in drying aqueous CNC suspensions have not yet been sufficiently investigated. The impact of surface tension-driven Marangoni flows was so far discussed only in the previously mentioned paper by Gençer et al. [194]. The authors provided interfacial tension measurements on drops of varying CNC concentration and calculated the appropriate dimensionless groups (e.g., the Marangoni number). Despite the many hints that flow phenomena are crucial in defining the macroscopic film morphology and its microstructure, the only published flow visualization data we are aware of are those in Figure 12a. Therefore, more studies on these surface flows (mostly solutal, as thermal Marangoni flows are typically very weak for aqueous drops) are needed. Moreover, convective flows can arise from density variations inside a drying drop [206], which can be for example caused by the simultaneous presence of lighter isotropic regions and heavier anisotropic regions; the influence of such flows has not been studied yet.
The discussion about the impact of CNC alignment and anchoring on the interfaces involved in suspension drying (i.e., the various substrate/suspension and suspension/surrounding interfaces) has been very limited up to now. Saha and Davis recently investigated the effect of surface anchoring by slowly drying CNC suspensions sandwiched between a glass slide and a glass coverslip, under high relative humidity [201]. The resulting films displayed dot-shaped domains with planar helix orientation and subtle mosaic defects, see Figure 13d. On the contrary, suspension drying without the coverslip yielded films with many mosaic defects, fingerprint textures and randomly oriented domains of different colors. The authors suggested that the anchoring of CNC particles to both glass surfaces had significant influence on particle ordering during water loss. Their alignment on both surfaces should lead to a tendency for planar helix orientation (i.e., the helix axis being perpendicular to the film). The authors mentioned, however, that other effects such as the confined evaporation and the prevention of skin formation might play a vital role in this drying geometry.
Entirely different approaches to depositing the CNC suspension like dip coating [207] can be used, in particular when thin films are desired, but the analysis of the complex non-equilibrium situation here is challenging. Hoeger et al. used blade coating to deposit CNC suspensions on mica, gold and silica substrates, with and without pre-adsorbed cationic polyelectrolyte, for studying the relevance of the CNC-substrate interaction [208]. They discussed their observations in the context of shear, capillary and electrostatic forces. Although attention starts to be paid on these issues, quantitative investigations of the alignment of CNC particles on different types of substrates (e.g., hydrophilic vs. hydrophobic [200]) or at the free surface of the suspensions (that could be a suspension/air or suspension/oil interface [9]) are still largely missing.
There are still some apparently conflicting observations between different studies, for instance regarding gelation or glass formation and regarding the impact on helix pitch of certain additives. One aspect that seems not to have been sufficiently investigated in this context is the importance of the native CNC counter ions and the additives, at least regarding the onset of kinetic arrest. Many studies on the effect of ionic strength were carried out with acid-form CNCs, thus with native H + counter ions, but then NaCl was added as the electrolyte to tune the ionic strength. It is not given that the effect will be identical to the case where HCl is added to acid-form CNCs (to our knowledge, only investigated systematically in one study [56]) or where NaCl is added to CNCs with native Na + counter ions. Even the interaction with non-ionic additives like glucose or nonionic polymers may be different for acid- and salt-form CNCs.

8. Summary and Outlook

Compared to many research activities requiring advanced and often expensive machinery, perhaps even large-scale facilities setting up highly unusual experimental conditions, and/or exclusive compounds available only in minute quantities, research on CNC suspensions may seem incredibly simple and low-key: what could possibly be complicated about a drop of water containing suspended particles of cellulose, the most abundant organic polymer on Earth, evaporating on a table in a regular lab? We hope that this review has demonstrated how false such a view point is, and that the processes taking place as the water leaves that droplet, giving birth to a beautiful as well as very useful colored film, are immensely complex. In order to reach the applied goal of making cellulose films with controlled and tunable structural colors, we need to understand all aspects of each of these processes. We need to understand what governs the colloidal stability of the CNC nanorods, with the choice of solvent, surface charge and counter ions all playing vital parts. We need to understand why and how the rod suspension may organize into a long-range ordered cholesteric phase, what happens inside the tactoids and at their boundaries, and how the tactoids eventually merge and form a macroscopic ordered phase. This includes being aware of the many subtleties of the helical director modulation that makes the CNC suspension so interesting, in equilibrium as well as after kinetic arrest, when the helix is being compressed as the water evaporates. We then need to understand the optics of a birefringent medium in which the optic axis rotates along a direction that may or may not be vertical, and the rotation may or may not be constant within the film. Furthermore since we start with a droplet of fluid particle suspension from which the solvent evaporates, we need to understand the hydrodynamic flows that take place within the droplet, moving particles around, and how these are affected by the underlying substrate as well as the phase bounding the droplet at its top. Of course, one also needs to understand the chemistry going into making the CNCs in the first place.
With this review we have tried to explain and discuss most of these aspects except for the CNC production in a way that any researcher working with, or desiring to work with, CNC suspensions has a chance to grasp the full complexity of these materials, providing links to further reading when our account does not go sufficiently deep. The present time is actually particularly exciting, because we are now, for the first time, at a stage where all the processes of the complex procedure behind CNC film production are recognized, and most of them are on the way of being understood, if not already clarified at a satisfactory level. We sincerely hope that our review can be helpful as well as stimulating, that it might guide experimental work into the right directions, and thereby make our understanding of the complex class of soft matter that colloidal cholesteric liquid crystals constitute a bit richer and a bit more complete. In the long run, this will hopefully also bring the dream of making sustainable materials with controlled tunable structural color, and/or enhanced mechanical properties, from wood or other renewable cellulose sources, a little bit closer to realization.

Author Contributions

This review was coordinated by J.P.F.L. who also wrote most of the text, with all authors giving input throughout. In particular, C.S. wrote most of Section 2 and provided Figure 1 (with AFM images from C.H.-R.), J.R.B. wrote most of Section 6 and provided Figure 9, and M.A. wrote most of Section 7.3 and provided Figure 12. C.H.-R. and Z.T. contributed with components to images (Figure 1, Figure 6, Figure 8 and Figure 10) and gave contributions to the text in several parts of the article. All authors have read and agreed to the published version of the manuscript.

Funding

This research was funded by The Fonds National de la Recherche (FNR), Luxembourg, grants MISONANCE (C14/MS/8331546), SSh (C17/MS/11688643) and COReLIGHT (C18/MS/12701231). C. Schütz acknowledges financial support from the Alexander von Humboldt Foundation for her stay in Luxembourg.

Conflicts of Interest

The authors declare no conflict of interest. The funders had no role in the writing of the manuscript.

References and Notes

  1. Zugenmaier, P. Crystalline Cellulose and Derivatives: Characterization and Structures; Springer Series in Wood Science; Springer: Berlin, Germany, 2010; p. 285. [Google Scholar]
  2. Revol, J.; Bradford, H.; Giasson, J.; Marchessault, R.; Gray, D. Helicoidal self-ordering of cellulose microfibrils in aqueous suspension. Int. J. Biol. Macromol. 1992, 14, 170–172. [Google Scholar] [CrossRef]
  3. Revol, J.F.; Godbout, L.; Gray, D. Solid self-assembled films of cellulose with chiral nematic order and optically variable properties. J. Pulp Pap. Sci. 1998, 24, 146–149. [Google Scholar]
  4. Bardet, R.; Roussel, F.; Coindeau, S.; Belgacem, N.; Bras, J. Engineered pigments based on iridescent cellulose nanocrystal films. Carbohydr. Polym. 2015, 122, 367–375. [Google Scholar] [CrossRef]
  5. Frka-Petesic, B.; Vignolini, S. So much more than paper. Nat. Photon. 2019, 13, 365–367. [Google Scholar] [CrossRef]
  6. Giese, M.; Blusch, L.K.; Khan, M.K.; MacLachlan, M.J. Functional Materials from Cellulose-Derived Liquid-Crystal Templates. Angew. Chem. Int. Ed. 2015, 54, 2888–2910. [Google Scholar] [CrossRef] [PubMed]
  7. Zhang, Y.P.; Chodavarapu, V.P.; Kirk, A.G.; Andrews, M.P. Nanocrystalline cellulose for covert optical encryption. SPIE Org. Photonic Mater. Devices XIV 2012, 8258, 825808. [Google Scholar]
  8. Zhang, Y.P.; Chodavarapu, V.P.; Kirk, A.G.; Andrews, M.P. Structured color humidity indicator from reversible pitch tuning in self-assembled nanocrystalline cellulose films. Sens. Actuators B 2013, 176, 692–697. [Google Scholar] [CrossRef]
  9. Zhao, T.H.; Parker, R.M.; Williams, C.A.; Lim, K.T.P.; Frka-Petesic, B.; Vignolini, S. Printing of Responsive Photonic Cellulose Nanocrystal Microfilm Arrays. Adv. Funct. Mater. 2018, 29, 1804531. [Google Scholar] [CrossRef] [Green Version]
  10. Giese, M.; Blusch, L.; Khan, M.; Hamad, W.; MacLachlan, M. Responsive mesoporous photonic cellulose films by supramolecular cotemplating. Angew. Chem. Int. Ed. 2014, 53, 8880–8884. [Google Scholar] [CrossRef]
  11. Lagerwall, J.P.F.; Schütz, C.; Salajkova, M.; Noh, J.; Park, J.H.; Scalia, G.; Bergström, L. Cellulose nanocrystal-based materials: From liquid crystal self-assembly and glass formation to multifunctional thin films. NPG Asia Mater. 2014, 6, e80. [Google Scholar] [CrossRef] [Green Version]
  12. Srinivasarao, M. Nano-optics in the biological world: Beetles, butterflies, birds, and moths. Chem. Rev. 1999, 99, 1935–1961. [Google Scholar] [CrossRef] [PubMed]
  13. Mitov, M. Cholesteric liquid crystals in living matter. Soft Matter 2017, 13, 4176–4209. [Google Scholar] [CrossRef] [PubMed]
  14. Parker, R.; Guidetti, G.; Williams, C.; Zhao, T.; Narkevicius, A.; Vignolini, S.; Frka-Petesic, B. The Self-Assembly of Cellulose Nanocrystals: Hierarchical Design of Visual Appearance. Adv. Mater. 2017, 30, 1704477. [Google Scholar] [CrossRef] [PubMed]
  15. Reid, M.; Villalobos, M.; Cranston, E. Benchmarking Cellulose Nanocrystals: From the Laboratory to Industrial Production. Langmuir 2017, 33, 1583–1598. [Google Scholar] [CrossRef] [PubMed]
  16. Nickerson, R.F.; Habrle, J.A. Cellulose Intercrystalline Structure. Ind. Eng. Chem. 1947, 39, 1507–1512. [Google Scholar] [CrossRef]
  17. Rånby, B.; Ribi, E. Über den Feinbau der Zellulose. Experientia 1950, 6, 12–14. [Google Scholar] [CrossRef]
  18. Marchessault, R.; Morehead, F.; Walter, N. Liquid crystal systems from fibrillar polysaccharides. Nature 1959, 184, 632–633. [Google Scholar] [CrossRef]
  19. Liu, Q.; Campbell, M.; Evans, J.; Smalyukh, I. Orientationally ordered colloidal co-dispersions of gold nanorods and cellulose nanocrystals. Adv. Mater. 2014, 26, 7178–7184. [Google Scholar] [CrossRef]
  20. Moon, R.; Martini, A.; Nairn, J.; Simonsen, J.; Youngblood, J. Cellulose nanomaterials review: Structure, properties and nanocomposites. Chem. Soc. Rev. 2011, 40, 3941–3994. [Google Scholar] [CrossRef]
  21. Wicklein, B.; Salazar-Alvarez, G. Functional hybrids based on biogenic nanofibrils and inorganic nanomaterials. J. Mater. Chem. A 2013, 1, 5469–5478. [Google Scholar] [CrossRef] [Green Version]
  22. Eichhorn, S.J. Cellulose nanowhiskers: Promising materials for advanced applications. Soft Matter 2011, 7, 303–315. [Google Scholar] [CrossRef]
  23. Klemm, D.; Kramer, F.; Moritz, S.; Lindstrom, T.; Ankerfors, M.; Gray, D.; Dorris, A. Nanocelluloses: A New Family of Nature-Based Materials. Angew. Chem. Int. Ed. 2011, 50, 5438–5466. [Google Scholar] [CrossRef] [PubMed]
  24. Nishiyama, Y.; Langan, P.; Chanzy, H. Crystal structure and hydrogen-bonding system in cellulose Iβ from synchrotron X-ray and neutron fiber diffraction. J. Am. Chem. Soc. 2002, 124, 9074–9082. [Google Scholar] [CrossRef] [PubMed]
  25. Atalla, R.; Vanderhart, D. Native cellulose: A composite of two distinct crystalline forms. Science 1984, 223, 283–285. [Google Scholar] [CrossRef] [PubMed]
  26. Eichhorn, S.; Dufresne, A.; Aranguren, M.; Marcovich, N.; Capadona, J.; Rowan, S.; Weder, C.; Thielemans, W.; Roman, M.; Renneckar, S.; et al. Review: Current international research into cellulose nanofibres and nanocomposites. J. Mater. Sci. 2010, 45, 1–33. [Google Scholar] [CrossRef] [Green Version]
  27. Yamamoto, H.; Horii, F. CPMAS carbon-13 NMR analysis of the crystal transformation induced for Valonia cellulose by annealing at high temperatures. Macromolecules 1993, 26, 1313–1317. [Google Scholar] [CrossRef]
  28. Yamamoto, H.; Horii, F.; Hirai, A. In situ crystallization of bacterial cellulose II. Influences of different polymeric additives on the formation of celluloses Iα and Iβ at the early stage of incubation. Cellulose 1996, 3, 229–242. [Google Scholar] [CrossRef]
  29. Majoinen, J.; Haataja, J.; Appelhans, D.; Lederer, A.; Olszewska, A.; Seitsonen, J.; Aseyev, V.; Kontturi, E.; Rosilo, H.; Österberg, M.; et al. Supracolloidal multivalent interactions and wrapping of dendronized glycopolymers on native cellulose nanocrystals. J. Am. Chem. Soc. 2014, 136, 866–869. [Google Scholar] [CrossRef]
  30. Usov, I.; Nyström, G.; Adamcik, J.; Handschin, S.; Schütz, C.; Fall, A.; Bergström, L.; Mezzenga, R. Understanding nanocellulose chirality and structure-properties relationship at the single fibril level. Nat. Commun. 2015, 6, 7564. [Google Scholar] [CrossRef] [Green Version]
  31. Belton, P.S.; Tanner, S.F.; Cartier, N.; Chanzy, H. High-resolution solid-state carbon-13 nuclear magnetic resonance spectroscopy of tunicin, an animal cellulose. Macromolecules 1989, 22, 1615–1617. [Google Scholar] [CrossRef]
  32. Abitbol, T.; Kam, D.; Levi-Kalisman, Y.; Gray, D.; Shoseyov, O. Surface Charge Influence on the Phase Separation and Viscosity of Cellulose Nanocrystals. Langmuir 2018, 34, 3925–3933. [Google Scholar] [CrossRef] [PubMed]
  33. Su, Y.; Burger, C.; Hsiao, B.S.; Chu, B. Characterization of TEMPO-oxidized cellulose nanofibers in aqueous suspension by small-angle X-ray scattering. J. Appl. Crystallogr. 2014, 47, 788–798. [Google Scholar] [CrossRef]
  34. Schütz, C.; Agthe, M.; Fall, A.; Gordeyeva, K.; Guccini, V.; Salajková, M.; Plivelic, T.; Lagerwall, J.; Salazar-Alvarez, G.; Bergström, L. Rod Packing in Chiral Nematic Cellulose Nanocrystal Dispersions Studied by Small-Angle X-ray Scattering and Laser Diffraction. Langmuir 2015, 31, 6507–6513. [Google Scholar] [CrossRef] [PubMed]
  35. Elazzouzi-Hafraoui, S.; Nishiyama, Y.; Putaux, J.; Heux, L.; Dubreuil, F.; Rochas, C. The shape and size distribution of crystalline nanoparticles prepared by acid hydrolysis of native cellulose. Biomacromolecules 2008, 9, 57–65. [Google Scholar] [CrossRef] [PubMed]
  36. Zakri, C.; Poulin, P. Phase behavior of nanotube suspensions: From attraction induced percolation to liquid crystalline phases. J. Mater. Chem. 2006, 16, 4095–4098. [Google Scholar] [CrossRef]
  37. Barry, E.; Dogic, Z. Entropy driven self-assembly of nonamphiphilic colloidal membranes. Proc. Natl. Acad. Sci. USA 2010, 107, 10348–10353. [Google Scholar] [CrossRef] [PubMed] [Green Version]
  38. Edgar, C.; Gray, D. Influence of dextran on the phase Behavior of suspensions of cellulose nanocrystals. Macromolecules 2002, 35, 7400–7406. [Google Scholar] [CrossRef]
  39. Beck-Candanedo, S.; Viet, D.; Gray, D. Induced phase separation in cellulose nanocrystal suspensions containing ionic dye species. Cellulose 2006, 13, 629–635. [Google Scholar] [CrossRef]
  40. Beck-Candanedo, S.; Viet, D.; Gray, D. Induced phase separation in low-ionic-strength cellulose nanocrystal suspensions containing high-molecular-weight blue dextrans. Langmuir 2006, 22, 8690–8695. [Google Scholar] [CrossRef]
  41. Israelachvili, J.N. Intermolecular and Surface Forces, 3rd ed.; Academic Press: Burlington, MA, USA, 2010. [Google Scholar]
  42. Kang, K.; Wilk, A.; Patkowski, A.; Dhont, J. Diffusion of spheres in isotropic and nematic networks of rods: Electrostatic interactions and hydrodynamic screening. J. Chem. Phys. 2007, 126, 214501. [Google Scholar] [CrossRef] [Green Version]
  43. Sluckin, T.J.; Dunmur, D.A.; Stegemeyer, H. Crystals that Flow: Classic Papers from the History of Liquid Crystals; Taylor and Francis: London, UK, 2004. [Google Scholar]
  44. Lagerwall, J.P.; Scalia, G. Introduction. In Liquid Crystals with Nano and Microparticles: (In 2 Volumes); Lagerwall, J.P., Scalia, G., Eds.; World Scientific: Singapore, 2016. [Google Scholar]
  45. Lagerwall, J.P.F.; Giesselmann, F. Current topics in smectic liquid crystal research. ChemPhysChem 2006, 7, 20–45. [Google Scholar] [CrossRef] [PubMed]
  46. De France, K.; Yager, K.; Hoare, T.; Cranston, E. Cooperative Ordering and Kinetics of Cellulose Nanocrystal Alignment in a Magnetic Field. Langmuir 2016, 32, 7564–7571. [Google Scholar] [CrossRef] [PubMed]
  47. Lagerwall, S.T. On some important chapters in the history of liquid crystals. Liq. Cryst. 2013, 40, 1698–1729. [Google Scholar] [CrossRef]
  48. Enz, E.; La Ferrara, V.; Scalia, G. Confinement-Sensitive Optical Response of Cholesteric Liquid Crystals in Electrospun Fibers. ACS Nano 2013, 7, 6627–6635. [Google Scholar] [CrossRef] [PubMed]
  49. Majoinen, J.; Kontturi, E.; Ikkala, O.; Gray, D.G. SEM imaging of chiral nematic films cast from cellulose nanocrystal suspensions. Cellulose 2012, 19, 1599–1605. [Google Scholar] [CrossRef]
  50. de Gennes, P.G.; Prost, J. The Physics of Liquid Crystals; Clarendon Press: Oxford, UK, 1993. [Google Scholar]
  51. Nayani, K.; Chang, R.; Fu, J.; Ellis, P.; Fernandez-Nieves, A.; Park, J.; Srinivasarao, M. Spontaneous emergence of chirality in achiral lyotropic chromonic liquid crystals confined to cylinders. Nat. Commun. 2015, 6, 8067. [Google Scholar] [CrossRef]
  52. Jeong, J.; Kang, L.; Davidson, Z.; Collings, P.; Lubensky, T.; Yodh, A. Chiral structures from achiral liquid crystals in cylindrical capillaries. Proc. Natl. Acad. Sci. USA 2015, 112, E1837–E1844. [Google Scholar] [CrossRef] [Green Version]
  53. Davidson, Z.; Kang, L.; Jeong, J.; Still, T.; Collings, P.; Lubensky, T.; Yodh, A. Chiral structures and defects of lyotropic chromonic liquid crystals induced by saddle-splay elasticity. Phys. Rev. E 2015, 91, 050501. [Google Scholar] [CrossRef] [Green Version]
  54. Prinsen, P.; van der Schoot, P. Shape and director-field transformation of tactoids. Phys. Rev. E 2003, 68, 021701. [Google Scholar] [CrossRef] [Green Version]
  55. Onsager, L. The effects of shape on the interaction of colloidal particles. Ann. N. Y. Acad. Sci. 1949, 51, 627–659. [Google Scholar] [CrossRef]
  56. Dong, X.; Kimura, T.; Revol, J.; Gray, D. Effects of ionic strength on the isotropic-chiral nematic phase transition of suspensions of cellulose crystallites. Langmuir 1996, 12, 2076–2082. [Google Scholar] [CrossRef]
  57. Dong, X.; Gray, D. Effect of counterions on ordered phase formation in suspensions of charged rodlike cellulose crystallites. Langmuir 1997, 13, 2404–2409. [Google Scholar] [CrossRef]
  58. Yang, C.H.; Wang, M.X.; Haider, H.; Yang, J.H.; Sun, J.Y.; Chen, Y.M.; Zhou, J.; Suo, Z. Strengthening Alginate/Polyacrylamide Hydrogels Using Various Multivalent Cations. ACS Appl. Mater. Interfaces 2013, 5, 10418–10422. [Google Scholar] [CrossRef] [PubMed]
  59. Flory, P.J.; Abe, A. Statistical thermodynamics of mixtures of rodlike particles. 1. Theory for polydisperse systems. Macromolecules 1978, 11, 1119–1122. [Google Scholar] [CrossRef]
  60. Lekkerkerker, H.N.W.; Coulon, P.; Van Der Haegen, R.; Deblieck, R. On the isotropic-liquid crystal phase separation in a solution of rodlike particles of different lengths. J. Chem. Phys. 1984, 80, 3427–3433. [Google Scholar] [CrossRef]
  61. Odijk, T.; Lekkerkerker, H.N. Theory of the isotropic-liquid crystal phase separation for a solution of bidisperse rodlike macromolecules. J. Phys. Chem. 1985, 89, 2090–2096. [Google Scholar] [CrossRef] [Green Version]
  62. Vroege, G.J.; Lekkerkerker, H.N.W. Phase-transitions in lyotropic colloidal and polymer liquid-crystals. Rep. Prog. Phys. 1992, 55, 1241–1309. [Google Scholar] [CrossRef]
  63. Bates, M.A.; Frenkel, D. Influence of polydispersity on the phase behavior of colloidal liquid crystals: A Monte Carlo simulation study. J. Chem. Phys. 1998, 109, 6193–6199. [Google Scholar] [CrossRef] [Green Version]
  64. Wensink, H. Effect of Size Polydispersity on the Pitch of Nanorod Cholesterics. Crystals 2019, 9, 143. [Google Scholar] [CrossRef] [Green Version]
  65. Neto, A.M.F.; Salinas, S.R.A. The Physics of Lyotropic Liquid Crystals: Phase Transitions and Structural Properties (Monographs on the Physics and Chemistry of Materials); Oxford University Press: New York, NY, USA, 2005. [Google Scholar]
  66. Maier, W.; Saupe, A. Eine einfache molekulare Theorie des nematischen kristallinflüssigen Zustandes. Z. Für Naturforschung A 1958, 13, 564–566. [Google Scholar] [CrossRef]
  67. Zocher, H.; Jacobsohn, K. Über Taktosole. Kolloidchem. Beihäfte 1929, 28, 167–206. [Google Scholar] [CrossRef]
  68. Zocher, H. Über freiwillige Strukturbildung in Solen (Eine neue Art anisotrop flüssiger Medien). Z. Für Anorg. Und Allg. Chem. 1925, 147, 91–110. [Google Scholar] [CrossRef]
  69. Puech, N.; Grelet, E.; Poulin, P.; Blanc, C.; van der Schoot, P. Nematic droplets in aqueous dispersions of carbon nanotubes. Phys. Rev. E 2010, 82, 020702. [Google Scholar] [CrossRef] [PubMed] [Green Version]
  70. Kaznacheev, A.; Bogdanov, M.; Taraskin, S. The nature of prolate shape of tactoids in lyotropic inorganic liquid crystals. J. Exp. Theor. Phys. 2002, 95, 57–63. [Google Scholar] [CrossRef]
  71. Robinson, C. Liquid-crystalline structures in solutions of a polypeptide. Trans. Faraday Soc. 1956, 52, 571. [Google Scholar] [CrossRef]
  72. Nyström, G.; Arcari, M.; Mezzenga, R. Confinement-induced liquid crystalline transitions in amyloid fibril cholesteric tactoids. Nat. Nanotechnol. 2018, 13, 330–336. [Google Scholar] [CrossRef] [PubMed]
  73. Mosser, G.; Anglo, A.; Helary, C.; Bouligand, Y.; Giraud-Guille, M. Dense tissue-like collagen matrices formed in cell-free conditions. Matrix Biol. 2006, 25, 3–13. [Google Scholar] [CrossRef]
  74. Sonin, A. Inorganic lyotropic liquid crystals. J. Mater. Chem. 1998, 8, 2557–2574. [Google Scholar] [CrossRef]
  75. Lehmann, O. Flüssige Kristalle und die Theorien des Lebens; Johann Ambrosius Barth: Leipzig, Germany, 1908. [Google Scholar]
  76. Friedel, G. Les états mésomorphes de la matière. Ann. Phys. 1922, 18, 273–474. [Google Scholar] [CrossRef]
  77. Blanc, C. Interplay between Growth Mechanisms and Elasticity in Liquid Crystalline Nuclei. Prog. Theor. Phys. Suppl. 2008, 175, 93–102. [Google Scholar] [CrossRef] [Green Version]
  78. Langmuir, I. The Role of Attractive and Repulsive Forces in the Formation of Tactoids, Thixotropic Gels, Protein Crystals and Coacervates. J. Chem. Phys. 1938, 6, 873–896. [Google Scholar] [CrossRef]
  79. Chen, W.; Gray, D.G. Interfacial tension between isotropic and anisotropic phases of a suspension of rodlike particles. Langmuir 2002, 18, 633–637. [Google Scholar] [CrossRef]
  80. Lavrentovich, O. Topological defects in dispersed liquid crystals, or words and worlds around liquid crystal drops. Liq. Cryst. 1998, 24, 117–125. [Google Scholar] [CrossRef]
  81. Kurik, M.V.; Lavrentovich, O. Defects in liquid crystals: Homotopy theory and experimental studies. Physics-Uspekhi 1988, 31, 196–224. [Google Scholar] [CrossRef]
  82. Volovik, G.; Lavrentovich, O. Topological dynamics of defects: Boojums in nematic drops. Zh Eksp Teor Fiz 1983, 85, 1997–2010. [Google Scholar]
  83. Kurik, M.; Lavrentovich, O. Negative-positive monopole transitions in cholesteric liquid-crystals. JETP Lett. 1982, 35, 444–447. [Google Scholar]
  84. Bouligand, Y.; Livolant, F. The organization of cholesteric spherulites. J. Phys. 1984, 45, 1899–1923. [Google Scholar] [CrossRef]
  85. Xu, F.; Crooker, P. Chiral nematic droplets with parallel surface anchoring. Phys. Rev. E 1997, 56, 6853–6860. [Google Scholar] [CrossRef]
  86. Xu, F.; Kitzerow, H.S.; Crooker, P. Director configurations of nematic-liquid-crystal droplets: Negative dielectric anisotropy and parallel surface anchoring. Phys. Rev. E 1994, 49, 3061. [Google Scholar] [CrossRef]
  87. Drzaic, P.S. Liquid Crystal Dispersions; World Scientific: Singapore, 1995. [Google Scholar]
  88. Bezic, J.; Zumer, S. Structures of the cholesteric liquid crystal droplets with parallel surface anchoring. Liq. Cryst. 1992, 11, 593–619. [Google Scholar] [CrossRef]
  89. Robinson, C.; Ward, J.; Beevers, R. Liquid crystalline structure in polypeptide solutions. Part 2. Discuss. Faraday Soc. 1958, 25, 29–42. [Google Scholar] [CrossRef]
  90. Lopez-Leon, T.; Fernandez-Nieves, A. Drops and shells of liquid crystal. Colloid Polym. Sci. 2011, 289, 345–359. [Google Scholar] [CrossRef]
  91. Urbanski, M.; Reyes, C.G.; Noh, J.; Sharma, A.; Geng, Y.; Jampani, V.S.R.; Lagerwall, J.P. Liquid crystals in micron-scale droplets, shells and fibers. J. Phys. Condens. Matter 2017, 29, 133003. [Google Scholar] [CrossRef] [Green Version]
  92. Candau, S.; Roy, P.; Debeauvais, F. Magnetic Field Effects in Nematic and Cholesteric Droplets Suspended in a Isotropic Liquid. Mol. Cryst. Liq. Cryst. 1973, 23, 283–297. [Google Scholar] [CrossRef]
  93. Jamali, V.; Behabtu, N.; Senyuk, B.; Lee, J.; Smalyukh, I.; van der Schoot, P.; Pasquali, M. Experimental realization of crossover in shape and director field of nematic tactoids. Phys. Rev. E 2015, 91, 042507. [Google Scholar] [CrossRef] [PubMed] [Green Version]
  94. Jeong, J.; Davidson, Z.; Collings, P.; Lubensky, T.; Yodh, A. Chiral symmetry breaking and surface faceting in chromonic liquid crystal droplets with giant elastic anisotropy. Proc. Natl. Acad. Sci. USA 2014, 111, 1742–1747. [Google Scholar] [CrossRef] [Green Version]
  95. Nayani, K.; Fu, J.; Chang, R.; Park, J.; Srinivasarao, M. Using chiral tactoids as optical probes to study the aggregation behavior of chromonics. Proc. Natl. Acad. Sci. USA 2017, 114, 3826–3831. [Google Scholar] [CrossRef] [Green Version]
  96. Araki, J.; Kuga, S. Effect of Trace Electrolyte on Liquid Crystal Type of Cellulose Microcrystals. Langmuir 2001, 17, 4493–4496. [Google Scholar] [CrossRef]
  97. Lettinga, M.P.; Kang, K.; Imhof, A.; Derks, D.; Dhont, J.K. Kinetic pathways of the nematic–isotropic phase transition as studied by confocal microscopy on rod-like viruses. J. Phys. Condens. Matter 2005, 17, S3609. [Google Scholar] [CrossRef] [Green Version]
  98. Tran, A.; Hamad, W.; MacLachlan, M. Tactoid Annealing Improves Order in Self-Assembled Cellulose Nanocrystal Films with Chiral Nematic Structures. Langmuir 2018, 34, 646–652. [Google Scholar] [CrossRef]
  99. Li, Y.; Jun-Yan Suen, J.; Prince, E.; Larin, E.; Klinkova, A.; Thérien-Aubin, H.; Zhu, S.; Yang, B.; Helmy, A.; Lavrentovich, O.; et al. Colloidal cholesteric liquid crystal in spherical confinement. Nat. Commun. 2016, 7, 12520. [Google Scholar] [CrossRef] [PubMed] [Green Version]
  100. Lagerwall, J.P. A phenomenological introduction to liquid crystals and colloids. In Liquid Crystals with Nano and Microparticles: (In 2 Volumes); Lagerwall, J.P., Scalia, G., Eds.; World Scientific: Singapore, 2016; pp. 11–93. [Google Scholar]
  101. De Vries, H. Rotary power and other optical properties of certain liquid crystals. Acta Cryst. 1951, 4, 219–226. [Google Scholar] [CrossRef] [Green Version]
  102. Wang, P.; Hamad, W.; MacLachlan, M. Structure and transformation of tactoids in cellulose nanocrystal suspensions. Nat. Commun. 2016, 7, 11515. [Google Scholar] [CrossRef] [PubMed]
  103. O’Keeffe, O.; Wang, P.; Hamad, W.; MacLachlan, M. Boundary Geometry Effects on the Coalescence of Liquid Crystalline Tactoids and Formation of Topological Defects. J. Phys. Chem. Lett. 2019, 10, 278–282. [Google Scholar] [CrossRef] [PubMed]
  104. Dong, X.; Revol, J.; Gray, D. Effect of microcrystallite preparation conditions on the formation of colloid crystals of cellulose. Cellulose 1998, 5, 19–32. [Google Scholar] [CrossRef]
  105. Hirai, A.; Inui, O.; Horii, F.; Tsuji, M. Phase Separation Behavior in Aqueous Suspensions of Bacterial Cellulose Nanocrystals Prepared by Sulfuric Acid Treatment. Langmuir 2009, 25, 497–502. [Google Scholar] [CrossRef]
  106. Honorato-Rios, C.; Lehr, C.; Schütz, C.; Sanctuary, R.; Osipov, M.A.; Baller, J.; Lagerwall, J.P.F. Fractionation of cellulose nanocrystals: Enhancing liquid crystal ordering without promoting gelation. NPG Asia Mater. 2018, 10, 455–465. [Google Scholar] [CrossRef]
  107. Beck-Candanedo, S.; Roman, M.; Gray, D. Effect of reaction conditions on the properties and behavior of wood cellulose nanocrystal suspensions. Biomacromolecules 2005, 6, 1048–1054. [Google Scholar] [CrossRef]
  108. Shafiei-Sabet, S.; Hamad, W.Y.; Hatzikiriakos, S.G. Rheology of Nanocrystalline Cellulose Aqueous Suspensions. Langmuir 2012, 28, 17124–17133. [Google Scholar] [CrossRef]
  109. Khandelwal, M.; Windle, A.H. Self-assembly of bacterial and tunicate cellulose nanowhiskers. Polymer 2013, 54, 5199–5206. [Google Scholar] [CrossRef]
  110. Finner, S.; Schilling, T.; van der Schoot, P. Connectivity, Not Density, Dictates Percolation in Nematic Liquid Crystals of Slender Nanoparticles. Phys. Rev. Lett. 2019, 122, 097801. [Google Scholar] [CrossRef] [PubMed] [Green Version]
  111. Kang, K.; Dhont, J.K.G. Glass Transition in Suspensions of Charged Rods: Structural Arrest and Texture Dynamics. Phys. Rev. Lett. 2013, 110, 015901. [Google Scholar] [CrossRef] [PubMed] [Green Version]
  112. Purdy, K.; Fraden, S. Isotropic-cholesteric phase transition of filamentous virus suspensions as a function of rod length and charge. Phys. Rev. E 2004, 70, 061703. [Google Scholar] [CrossRef] [PubMed] [Green Version]
  113. Zimmermann, K.; Hagedorn, H.; Heuck, C.C.; Hinrichsen, M.; Ludwig, H. The ionic properties of the filamentous bacteriophages Pf1 and fd. J. Biol. Chem. 1986, 261, 1653–1655. [Google Scholar] [PubMed]
  114. Nordenström, M.; Fall, A.; Nyström, G.; Wågberg, L. Formation of Colloidal Nanocellulose Glasses and Gels. Langmuir 2017, 33, 9772–9780. [Google Scholar] [CrossRef]
  115. Lokanathan, A.; Nykänen, A.; Seitsonen, J.; Johansson, L.; Campbell, J.; Rojas, O.; Ikkala, O.; Laine, J. Cilia-mimetic hairy surfaces based on end-immobilized nanocellulose colloidal rods. Biomacromolecules 2013, 14, 2807–2813. [Google Scholar] [CrossRef]
  116. Petrova, A.; Herold, C.; Petrov, E. Conformations and membrane-driven self-organization of rodlike fd virus particles on freestanding lipid membranes. Soft Matter 2017, 13, 7172–7187. [Google Scholar] [CrossRef] [Green Version]
  117. Honorato-Rios, C.; Kuhnhold, A.; Bruckner, J.R.; Dannert, R.; Schilling, T.; Lagerwall, J.P. Equilibrium Liquid Crystal Phase Diagrams and Detection of Kinetic Arrest in Cellulose Nanocrystal Suspensions. Front. Mater. 2016, 3, 21. [Google Scholar] [CrossRef] [Green Version]
  118. Lettinga, M.P. Kolloid-Tagung 2019. In Proceedings of the 49th Conference of the German Colloid Society, Stuttgart, Germany, 23–25 September 2019. [Google Scholar]
  119. Phan-Xuan, T.; Thuresson, A.; Skepö, M.; Labrador, A.; Bordes, R.; Matic, A. Aggregation behavior of aqueous cellulose nanocrystals: The effect of inorganic salts. Cellulose 2016, 23, 3653–3663. [Google Scholar] [CrossRef] [Green Version]
  120. Urena-Benavides, E.E.; Ao, G.; Davis, V.A.; Kitchens, C.L. Rheology and Phase Behavior of Lyotropic Cellulose Nanocrystal Suspensions. Macromolecules 2011, 44, 8990–8998. [Google Scholar] [CrossRef]
  121. Shafeiei-Sabet, S.; Hamad, W.Y.; Hatzikiriakos, S.G. Influence of degree of sulfation on the rheology of cellulose nanocrystal suspensions. Rheol. Acta 2013, 52, 741–751. [Google Scholar] [CrossRef]
  122. Bruckner, J.; Kuhnhold, A.; Honorato-Rios, C.; Schilling, T.; Lagerwall, J. Enhancing Self-Assembly in Cellulose Nanocrystal Suspensions Using High-Permittivity Solvents. Langmuir 2016, 32, 9854–9862. [Google Scholar] [CrossRef] [PubMed]
  123. Habibi, Y. Key advances in the chemical modification of nanocelluloses. Chem. Soc. Rev. 2014, 43, 1519–1542. [Google Scholar] [CrossRef] [PubMed]
  124. Eyley, S.; Thielemans, W. Surface modification of cellulose nanocrystals. Nanoscale 2014, 6, 7764–7779. [Google Scholar] [CrossRef] [PubMed] [Green Version]
  125. Heux, L.; Chauve, G.; Bonini, C. Nonflocculating and chiral-nematic self-ordering of cellulose microcrystals suspensions in nonpolar solvents. Langmuir 2000, 16, 8210–8212. [Google Scholar] [CrossRef]
  126. Elazzouzi-Hafraoui, S.; Putaux, J.L.; Heux, L. Self-assembling and Chiral Nematic Properties of Organophilic Cellulose Nanocrystals. J. Phys. Chem. B 2009, 113, 11069–11075. [Google Scholar] [CrossRef]
  127. Frka-Petesic, B.; Jean, B.; Heux, L. First experimental evidence of a giant permanent electric-dipole moment in cellulose nanocrystals. EPL 2014, 107, 28006. [Google Scholar] [CrossRef]
  128. Nguyen, T.D.; Hamad, W.Y.; MacLachlan, M.J. CdS Quantum Dots Encapsulated in Chiral Nematic Mesoporous Silica: New Iridescent and Luminescent Materials. Adv. Funct. Mater. 2014, 24, 777–783. [Google Scholar] [CrossRef]
  129. Shopsowitz, K.E.; Kelly, J.A.; Hamad, W.Y.; MacLachlan, M.J. Biopolymer Templated Glass with a Twist: Controlling the Chirality, Porosity, and Photonic Properties of Silica with Cellulose Nanocrystals. Adv. Funct. Mater. 2014, 24, 327–338. [Google Scholar] [CrossRef]
  130. Shopsowitz Kevin, E.; Stahl, A.; Hamad Wadood, Y.; MacLachlan Mark, J. Hard Templating of Nanocrystalline Titanium Dioxide with Chiral Nematic Ordering. Angew. Chem. Int. Ed. 2012, 51, 6886–6890. [Google Scholar] [CrossRef]
  131. Kelly, J.A.; Shopsowitz, K.E.; Ahn, J.M.; Hamad, W.Y.; MacLachlan, M.J. Chiral Nematic Stained Glass: Controlling the Optical Properties of Nanocrystalline Cellulose-Templated Materials. Langmuir 2012, 28, 17256–17262. [Google Scholar] [CrossRef] [PubMed]
  132. Qi, H.; Roy, X.; Shopsowitz, K.E.; Hui, J.K.H.; MacLachlan, M.J. Liquid-Crystal Templating in Ammonia: A Facile Route to Micro- and Mesoporous Metal Nitride/Carbon Composites. Angew. Chem. Int. Ed. 2010, 49, 9740–9743. [Google Scholar] [CrossRef] [PubMed]
  133. Shopsowitz, K.; Qi, H.; Hamad, W.; MacLachlan, M. Free-standing mesoporous silica films with tunable chiral nematic structures. Nature 2010, 468, 422–425. [Google Scholar] [CrossRef] [PubMed]
  134. Yao, K.; Meng, Q.; Bulone, V.; Zhou, Q. Flexible and Responsive Chiral Nematic Cellulose Nanocrystal/Poly(ethylene glycol) Composite Films with Uniform and Tunable Structural Color. Adv. Mater. 2017, 29, 1701323. [Google Scholar] [CrossRef]
  135. Wu, T.; Li, J.; Li, J.; Ye, S.; Wei, J.; Guo, J. A bio-inspired cellulose nanocrystal-based nanocomposite photonic film with hyper-reflection and humidity-responsive actuator properties. J. Mater. Chem. C 2016, 4, 9687–9696. [Google Scholar] [CrossRef]
  136. Giese, M.; De Witt, J.; Shopsowitz, K.; Manning, A.; Dong, R.; Michal, C.; Hamad, W.; MacLachlan, M. Thermal switching of the reflection in chiral nematic mesoporous organosilica films infiltrated with liquid crystals. ACS Appl. Mater. Interfaces 2013, 5, 6854–6859. [Google Scholar] [CrossRef]
  137. Kelly, J.; Shukaliak, A.; Cheung, C.; Shopsowitz, K.; Hamad, W.; MacLachlan, M. Responsive photonic hydrogels based on nanocrystalline cellulose. Angew. Chem. Int. Ed. 2013, 52, 8912–8916. [Google Scholar] [CrossRef]
  138. Cheung, C.C.Y.; Giese, M.; Kelly, J.A.; Hamad, W.Y.; MacLachlan, M.J. Iridescent Chiral Nematic Cellulose Nanocrystal/Polymer Composites Assembled in Organic Solvents. ACS Macro Lett. 2013, 2, 1016–1020. [Google Scholar] [CrossRef]
  139. Giese, M.; Khan Mostofa, K.; Hamad Wadood, Y.; MacLachlan Mark, J. Imprinting of Photonic Patterns with Thermosetting Amino-Formaldehyde-Cellulose Composites. ACS Macro Lett. 2013, 2, 818–821. [Google Scholar] [CrossRef]
  140. Khan, M.; Giese, M.; Yu, M.; Kelly, J.; Hamad, W.; MacLachlan, M. Flexible mesoporous photonic resins with tunable chiral nematic structures. Angew. Chem. Int. Ed. 2013, 52, 8921–8924. [Google Scholar] [CrossRef]
  141. Shopsowitz Kevin, E.; Hamad Wadood, Y.; MacLachlan Mark, J. Flexible and Iridescent Chiral Nematic Mesoporous Organosilica Films. J. Am. Chem. Soc. 2012, 134, 867–870. [Google Scholar] [CrossRef] [PubMed]
  142. Terpstra, A.S.; Arnett, L.P.; Manning, A.P.; Michal, C.A.; Hamad, W.Y.; MacLachlan, M.J. Iridescent Chiral Nematic Mesoporous Organosilicas with Alkylene Spacers. Adv. Opt. Mater. 2018, 6, 1800163. [Google Scholar] [CrossRef]
  143. Rao, A.; Divoux, T.; McKinley, G.; Hart, A. Shear melting and recovery of crosslinkable cellulose nanocrystal-polymer gels. Soft Matter 2019, 15, 4401–4412. [Google Scholar] [CrossRef] [PubMed] [Green Version]
  144. Okita, Y.; Fujisawa, S.; Saito, T.; Isogai, A. TEMPO-Oxidized Cellulose Nanofibrils Dispersed in Organic Solvents. Biomacromolecules 2011, 12, 518–522. [Google Scholar] [CrossRef] [PubMed]
  145. Wu, W.; Song, R.; Xu, Z.; Jing, Y.; Dai, H.; Fang, G. Fluorescent cellulose nanocrystals with responsiveness to solvent polarity and ionic strength. Sens. Actuators B 2018, 275, 490–498. [Google Scholar] [CrossRef]
  146. Espinosa, S.C.; Kuhnt, T.; Foster, E.J.; Weder, C. Isolation of Thermally Stable Cellulose Nanocrystals by Phosphoric Acid Hydrolysis. Biomacromolecules 2013, 14, 1223–1230. [Google Scholar] [CrossRef] [PubMed]
  147. Viet, D.; Beck-Candanedo, S.; Gray, D. Dispersion of cellulose nanocrystals in polar organic solvents. Cellulose 2007, 14, 109–113. [Google Scholar] [CrossRef]
  148. Sánchez, P.; Tsubaki, S.; Pádua, A.; Wada, Y. Kinetic analysis of microwave-enhanced cellulose dissolution in ionic solvents. Phys. Chem. Chem. Phys. 2020, 22, 1003–1010. [Google Scholar] [CrossRef]
  149. Lethesh, K.; Evjen, S.; Venkatraman, V.; Shah, S.; Fiksdahl, A. Highly efficient cellulose dissolution by alkaline ionic liquids. Carbohydr. Polym. 2020, 229, 115594. [Google Scholar] [CrossRef]
  150. Rajeev, A.; Basavaraj, M.G. Confinement effect on spatio-temporal growth of spherulites from cellulose/ionic liquid solutions. Polymer 2019, 185, 121927. [Google Scholar] [CrossRef]
  151. Okura, H.; Wada, M.; Serizawa, T. Dispersibility of HCl-treated Cellulose Nanocrystals with Water-dispersible Properties in Organic Solvents. Chem. Lett. 2014, 43, 601–603. [Google Scholar] [CrossRef]
  152. Gauche, C.; Felisberti, M.I. Colloidal Behavior of Cellulose Nanocrystals Grafted with Poly(2-alkyl-2-oxazoline)s. ACS Omega 2019, 4, 11893–11905. [Google Scholar] [CrossRef] [PubMed]
  153. Hu, Z.; Berry, R.M.; Pelton, R.; Cranston, E.D. One-Pot Water-Based Hydrophobic Surface Modification of Cellulose Nanocrystals Using Plant Polyphenols. ACS Sustain. Chem. Eng. 2017, 5, 5018–5026. [Google Scholar] [CrossRef]
  154. Fumagalli, M.; Sanchez, F.; Boisseau, S.M.; Heux, L. Gas-phase esterification of cellulose nanocrystal aerogels for colloidal dispersion in apolar solvents. Soft Matter 2013, 9, 11309. [Google Scholar] [CrossRef]
  155. Frka-Petesic, B.; Radavidson, H.; Jean, B.; Heux, L. Dynamically Controlled Iridescence of Cholesteric Cellulose Nanocrystal Suspensions Using Electric Fields. Adv. Mater. 2017, 29, 1606208. [Google Scholar] [CrossRef] [Green Version]
  156. Kovalenko, A. Predictive Multiscale Modeling of Nanocellulose Based Materials and Systems. IOP Conf. Ser. Mater. Sci. Eng. 2014, 64, 012040. [Google Scholar] [CrossRef] [Green Version]
  157. Gousse, C.; Chanzy, H.; Excoffier, G.; Soubeyrand, L.; Fleury, E. Stable suspensions of partially silylated cellulose whiskers dispersed in organic solvents. Polymer 2002, 43, 2645–2651. [Google Scholar] [CrossRef]
  158. Yi, J.; Xu, Q.; Zhang, X.; Zhang, H. Chiral-nematic self-ordering of rodlike cellulose nanocrystals grafted with poly(styrene) in both thermotropic and lyotropic states. Polymer 2008, 49, 4406–4412. [Google Scholar] [CrossRef]
  159. Xu, Q.; Yi, J.; Zhang, X.; Zhang, H. A novel amphotropic polymer based on cellulose nanocrystals grafted with azo polymers. Eur. Polym. J. 2008, 44, 2830–2837. [Google Scholar] [CrossRef]
  160. Goffin, A.; Habibi, Y.; Raquez, J.; Dubois, P. Polyester-grafted cellulose nanowhiskers: A new approach for tuning the microstructure of immiscible polyester blends. ACS Appl. Mater. Interfaces 2012, 4, 3364–3371. [Google Scholar] [CrossRef]
  161. Ljungberg, N.; Bonini, C.; Bortolussi, F.; Boisson, C.; Heux, L.; Cavaillé, J. New nanocomposite materials reinforced with cellulose whiskers in atactic polypropylene: Effect of surface and dispersion characteristics. Biomacromolecules 2005, 6, 2732–2739. [Google Scholar] [CrossRef] [PubMed]
  162. Araki, J.; Wada, M.; Kuga, S. Steric stabilization of a cellulose microcrystal suspension by poly (ethylene glycol) grafting. Langmuir 2001, 17, 21–27. [Google Scholar] [CrossRef]
  163. Siqueira, G.; Bras, J.; Dufresne, A. New process of chemical grafting of cellulose nanoparticles with a long chain isocyanate. Langmuir 2010, 26, 402–411. [Google Scholar] [CrossRef] [PubMed]
  164. Tian, C.; Fu, S.; Habibi, Y.; Lucia, L. Polymerization topochemistry of cellulose nanocrystals: A function of surface dehydration control. Langmuir 2014, 30, 14670–14679. [Google Scholar] [CrossRef]
  165. Blachechen, L.S.; de Mesquita, J.P.; de Paula, E.L.; Pereira, F.V.; Petri, D.F.S. Interplay of colloidal stability of cellulose nanocrystals and their dispersibility in cellulose acetate butyrate matrix. Cellulose 2013, 20, 1329–1342. [Google Scholar] [CrossRef]
  166. Braun, B.; Dorgan, J. Single-step method for the isolation and surface functionalization of cellulosic nanowhiskers. Biomacromolecules 2009, 10, 334–341. [Google Scholar] [CrossRef]
  167. Yuan, H.; Nishiyama, Y.; Wada, M.; Kuga, S. Surface acylation of cellulose whiskers by drying aqueous emulsion. Biomacromolecules 2006, 7, 696–700. [Google Scholar] [CrossRef]
  168. Zhou, Q.; Brumer, H.; Teeri, T.T. Self-Organization of Cellulose Nanocrystals Adsorbed with Xyloglucan Oligosaccharide-Poly(ethylene glycol)-Polystyrene Triblock Copolymer. Macromolecules 2009, 42, 5430–5432. [Google Scholar] [CrossRef]
  169. Salajkova, M.; Berglund Lars, A.; Zhou, Q. Hydrophobic cellulose nanocrystals modified with quaternary ammonium salts. J. Mater. Chem. 2012, 22, 19798–19805. [Google Scholar] [CrossRef]
  170. Xu, Y.; Dai, Y.; Nguyen, T.; Hamad, W.; MacLachlan, M. Aerogel materials with periodic structures imprinted with cellulose nanocrystals. Nanoscale 2018, 10, 3805–3812. [Google Scholar] [CrossRef]
  171. There is a confusing discrepancy between the plotted data, from which these numbers were taken, and the text, which states a pitch change from ∼80 μm to ∼10 μm
  172. Mu, X.; Gray, D. Formation of chiral nematic films from cellulose nanocrystal suspensions is a two-stage process. Langmuir 2014, 30, 9256–9260. [Google Scholar] [CrossRef] [PubMed]
  173. The percentage is given as 10% w/v without further clarification. While this mixing of mass and volume in a percent indication is quite commonly used in some communities, it causes problems because the meaning is not clearly defined. In addition, a percentage should be dimensionless, whereas here we have the dimension kg/m3. We assume that 1% here means 1 g in 100 mL, but this interpretation may be incorrect
  174. Frka-Petesic, B.; Kamita, G.; Guidetti, G.; Vignolini, S. Angular optical response of cellulose nanocrystal films explained by the distortion of the arrested suspension upon drying. Phys. Rev. Mater. 2019, 3, 045601. [Google Scholar] [CrossRef] [Green Version]
  175. Oseen, C.W. The theory of liquid crystals. Trans. Faraday Soc. 1933, 29, 883. [Google Scholar] [CrossRef]
  176. Fergason, J.L. Cholesteric Structure-1 Optical Properties. Mol. Cryst. 1966, 1, 293–307. [Google Scholar] [CrossRef]
  177. Dreher, R.; Meier, G. Optical properties of cholesteric liquid crystals. Phys. Rev. A 1973, 8, 1616. [Google Scholar] [CrossRef]
  178. Berreman, D.; Scheffer, T. Bragg reflection of light from single-domain cholesteric liquid-crystal films. Phys. Rev. Lett. 1970, 25, 577–581. [Google Scholar] [CrossRef]
  179. Berreman, D.W.; Scheffer, T.J. Reflection and Transmission by Single-Domain Cholesteric Liquid Crystal Films: Theory and Verification. Mol. Cryst. Liq. Cryst. 1970, 11, 395–405. [Google Scholar] [CrossRef]
  180. Kim, S.T.; Finkelmann, H. Cholesteric liquid single-crystal elastomers (LSCE) obtained by the anisotropic deswelling method. Macromol. Rapid Commun. 2001, 22, 429–433. [Google Scholar] [CrossRef]
  181. Finkelmann, H.; Kim, S.; Munoz, A.; Palffy-Muhoray, P.; Taheri, B. Tunable mirrorless lasing in cholesteric liquid crystalline elastomers. Adv. Mater. 2001, 13, 1069–1072. [Google Scholar] [CrossRef]
  182. Kizhakidathazhath, R.; Geng, Y.; Jampani, V.S.R.; Charni, C.; Sharma, A.; Lagerwall, J.P.F. Facile Anisotropic Deswelling Method for Realizing Large-Area Cholesteric Liquid Crystal Elastomers with Uniform Structural Color and Broad-Range Mechanochromic Response. Adv. Funct. Mater. 2019, 1909537. [Google Scholar] [CrossRef] [Green Version]
  183. Mao, Y.; Terentjev, E.M.; Warner, M. Cholesteric elastomers: Deformable photonic solids. Phys. Rev. E 2001, 64, 041803. [Google Scholar] [CrossRef] [PubMed]
  184. Revol, J.; Godbout, L.; Dong, X.; Gray, D.; Chanzy, H.; Maret, G. Chiral Nematic Suspensions of Cellulose Crystallites—Phase-separation and Magnetic-field Orientation. Liq. Cryst. 1994, 16, 127–134. [Google Scholar] [CrossRef]
  185. Kimura, F.; Kimura, T.; Tamura, M.; Hirai, A.; Ikuno, M.; Horii, F. Magnetic alignment of the chiral nematic phase of a cellulose microfibril suspension. Langmuir 2005, 21, 2034–2037. [Google Scholar] [CrossRef] [PubMed]
  186. Frka-Petesic, B.; Guidetti, G.; Kamita, G.; Vignolini, S. Controlling the Photonic Properties of Cholesteric Cellulose Nanocrystal Films with Magnets. Adv. Mater. 2017, 29, 1701469. [Google Scholar] [CrossRef] [PubMed]
  187. Larson, R.G. Transport and deposition patterns in drying sessile droplets. AIChE J. 2014, 60, 1538–1571. [Google Scholar] [CrossRef] [Green Version]
  188. Anyfantakis, M.; Baigl, D. Manipulating the Coffee-Ring Effect: Interactions at Work. ChemPhysChem 2015, 16, 2726–2734. [Google Scholar] [CrossRef]
  189. Deegan, R.D.; Bakajin, O.; Dupont, T.F.; Huber, G.; Nagel, S.R.; Witten, T.A. Contact line deposits in an evaporating drop. Phys. Rev. E 2000, 62, 756. [Google Scholar] [CrossRef] [Green Version]
  190. Deegan, R.D.; Bakajin, O.; Dupont, T.F.; Huber, G.; Nagel, S.R.; Witten, T.A. Capillary flow as the cause of ring stains from dried liquid drops. Nature 1997, 389, 827–829. [Google Scholar] [CrossRef]
  191. Mu, X.; Gray, D.G. Droplets of cellulose nanocrystal suspensions on drying give iridescent 3-D “coffee-stain” rings. Cellulose 2015, 22, 1103–1107. [Google Scholar] [CrossRef]
  192. Dupas, Lagerwall and Anyfantakis, in preparation
  193. Shimura, K.; Uchiyama, N.; Kasai, K. Prevention of evaporation of small-volume sample solutions for capillary electrophoresis using a mineral-oil overlay. Electrophoresis 2001, 22, 3471–3477. [Google Scholar] [CrossRef]
  194. Gençer, A.; Schütz, C.; Thielemans, W. Influence of the Particle Concentration and Marangoni Flow on the Formation of Cellulose Nanocrystal Films. Langmuir 2016, 33, 228–234. [Google Scholar] [CrossRef] [PubMed] [Green Version]
  195. Hu, H.; Larson, R.G. Marangoni effect reverses coffee-ring depositions. J. Phys. Chem. B 2006, 110, 7090–7094. [Google Scholar] [CrossRef] [PubMed]
  196. Varanakkottu, S.; Anyfantakis, M.; Morel, M.; Rudiuk, S.; Baigl, D. Light-Directed Particle Patterning by Evaporative Optical Marangoni Assembly. Nano. Lett. 2016, 16, 644–650. [Google Scholar] [CrossRef] [PubMed]
  197. Pan, J.; Hamad, W.; Straus, S. Parameters Affecting the Chiral Nematic Phase of Nanocrystalline Cellulose Films. Macromolecules 2010, 43, 3851–3858. [Google Scholar] [CrossRef]
  198. Beck, S.; Bouchard, J.; Berry, R. Controlling the Reflection Wavelength of Iridescent Solid Films of Nanocrystalline Cellulose. Biomacromolecules 2011, 12, 167–172. [Google Scholar] [CrossRef]
  199. Hirscher, M.; Becher, M.; Haluska, M.; Dettlaff-Weglikowska, U.; Quintel, A.; Duesberg, G.; Choi, Y.; Downes, P.; Hulman, M.; Roth, S. Hydrogen storage in sonicated carbon materials. Appl. Phys. A Mater. Sci. Process. 2001, 72, 129–132. [Google Scholar] [CrossRef]
  200. Nguyen, T.; Hamad, W.; MacLachlan, M. Tuning the iridescence of chiral nematic cellulose nanocrystals and mesoporous silica films by substrate variation. Chem. Commun. 2013, 49, 11296–11298. [Google Scholar] [CrossRef]
  201. Saha, P.; Davis, V.A. Photonic Properties and Applications of Cellulose Nanocrystal Films with Planar Anchoring. ACS Appl. Nano Mater. 2018, 1, 2175–2183. [Google Scholar] [CrossRef]
  202. Guidetti, G.; Atifi, S.; Vignolini, S.; Hamad, W. Flexible Photonic Cellulose Nanocrystal Films. Adv. Mater. 2016, 28, 10042–10047. [Google Scholar] [CrossRef]
  203. Bardet, R.; Belgacem, N.; Bras, J. Flexibility and color monitoring of cellulose nanocrystal iridescent solid films using anionic or neutral polymers. ACS Appl. Mater. Interfaces 2015, 7, 4010–4018. [Google Scholar] [CrossRef]
  204. Mitov, M. Cholesteric Liquid Crystals with a Broad Light Reflection Band. Adv. Mater. 2012, 24, 6260–6276. [Google Scholar] [CrossRef] [PubMed]
  205. Fernandes, S.; Almeida, P.; Monge, N.; Aguirre, L.; Reis, D.; de Oliveira, C.; Neto, A.; Pieranski, P.; Godinho, M. Mind the Microgap in Iridescent Cellulose Nanocrystal Films. Adv. Mater. 2017, 29, 1603560. [Google Scholar] [CrossRef] [PubMed] [Green Version]
  206. Kang, K.H.; Lim, H.C.; Lee, H.W.; Lee, S.J. Evaporation-induced saline Rayleigh convection inside a colloidal droplet. Phys. Fluids 2013, 25, 042001. [Google Scholar] [CrossRef] [Green Version]
  207. Song, W.; Lee, J.K.; Gong, M.S.; Heo, K.; Chung, W.J.; Lee, B.Y. Cellulose Nanocrystal-Based Colored Thin Films for Colorimetric Detection of Aldehyde Gases. ACS Appl. Mater. Interf. 2018, 10, 10353–10361. [Google Scholar] [CrossRef]
  208. Hoeger, I.; Rojas Orlando, J.; Efimenko, K.; Velev Orlin, D.; Kelley Steve, S. Ultrathin film coatings of aligned cellulose nanocrystals from a convective-shear assembly system and their surface mechanical properties. Soft Matter 2011, 7, 1957–1967. [Google Scholar] [CrossRef]
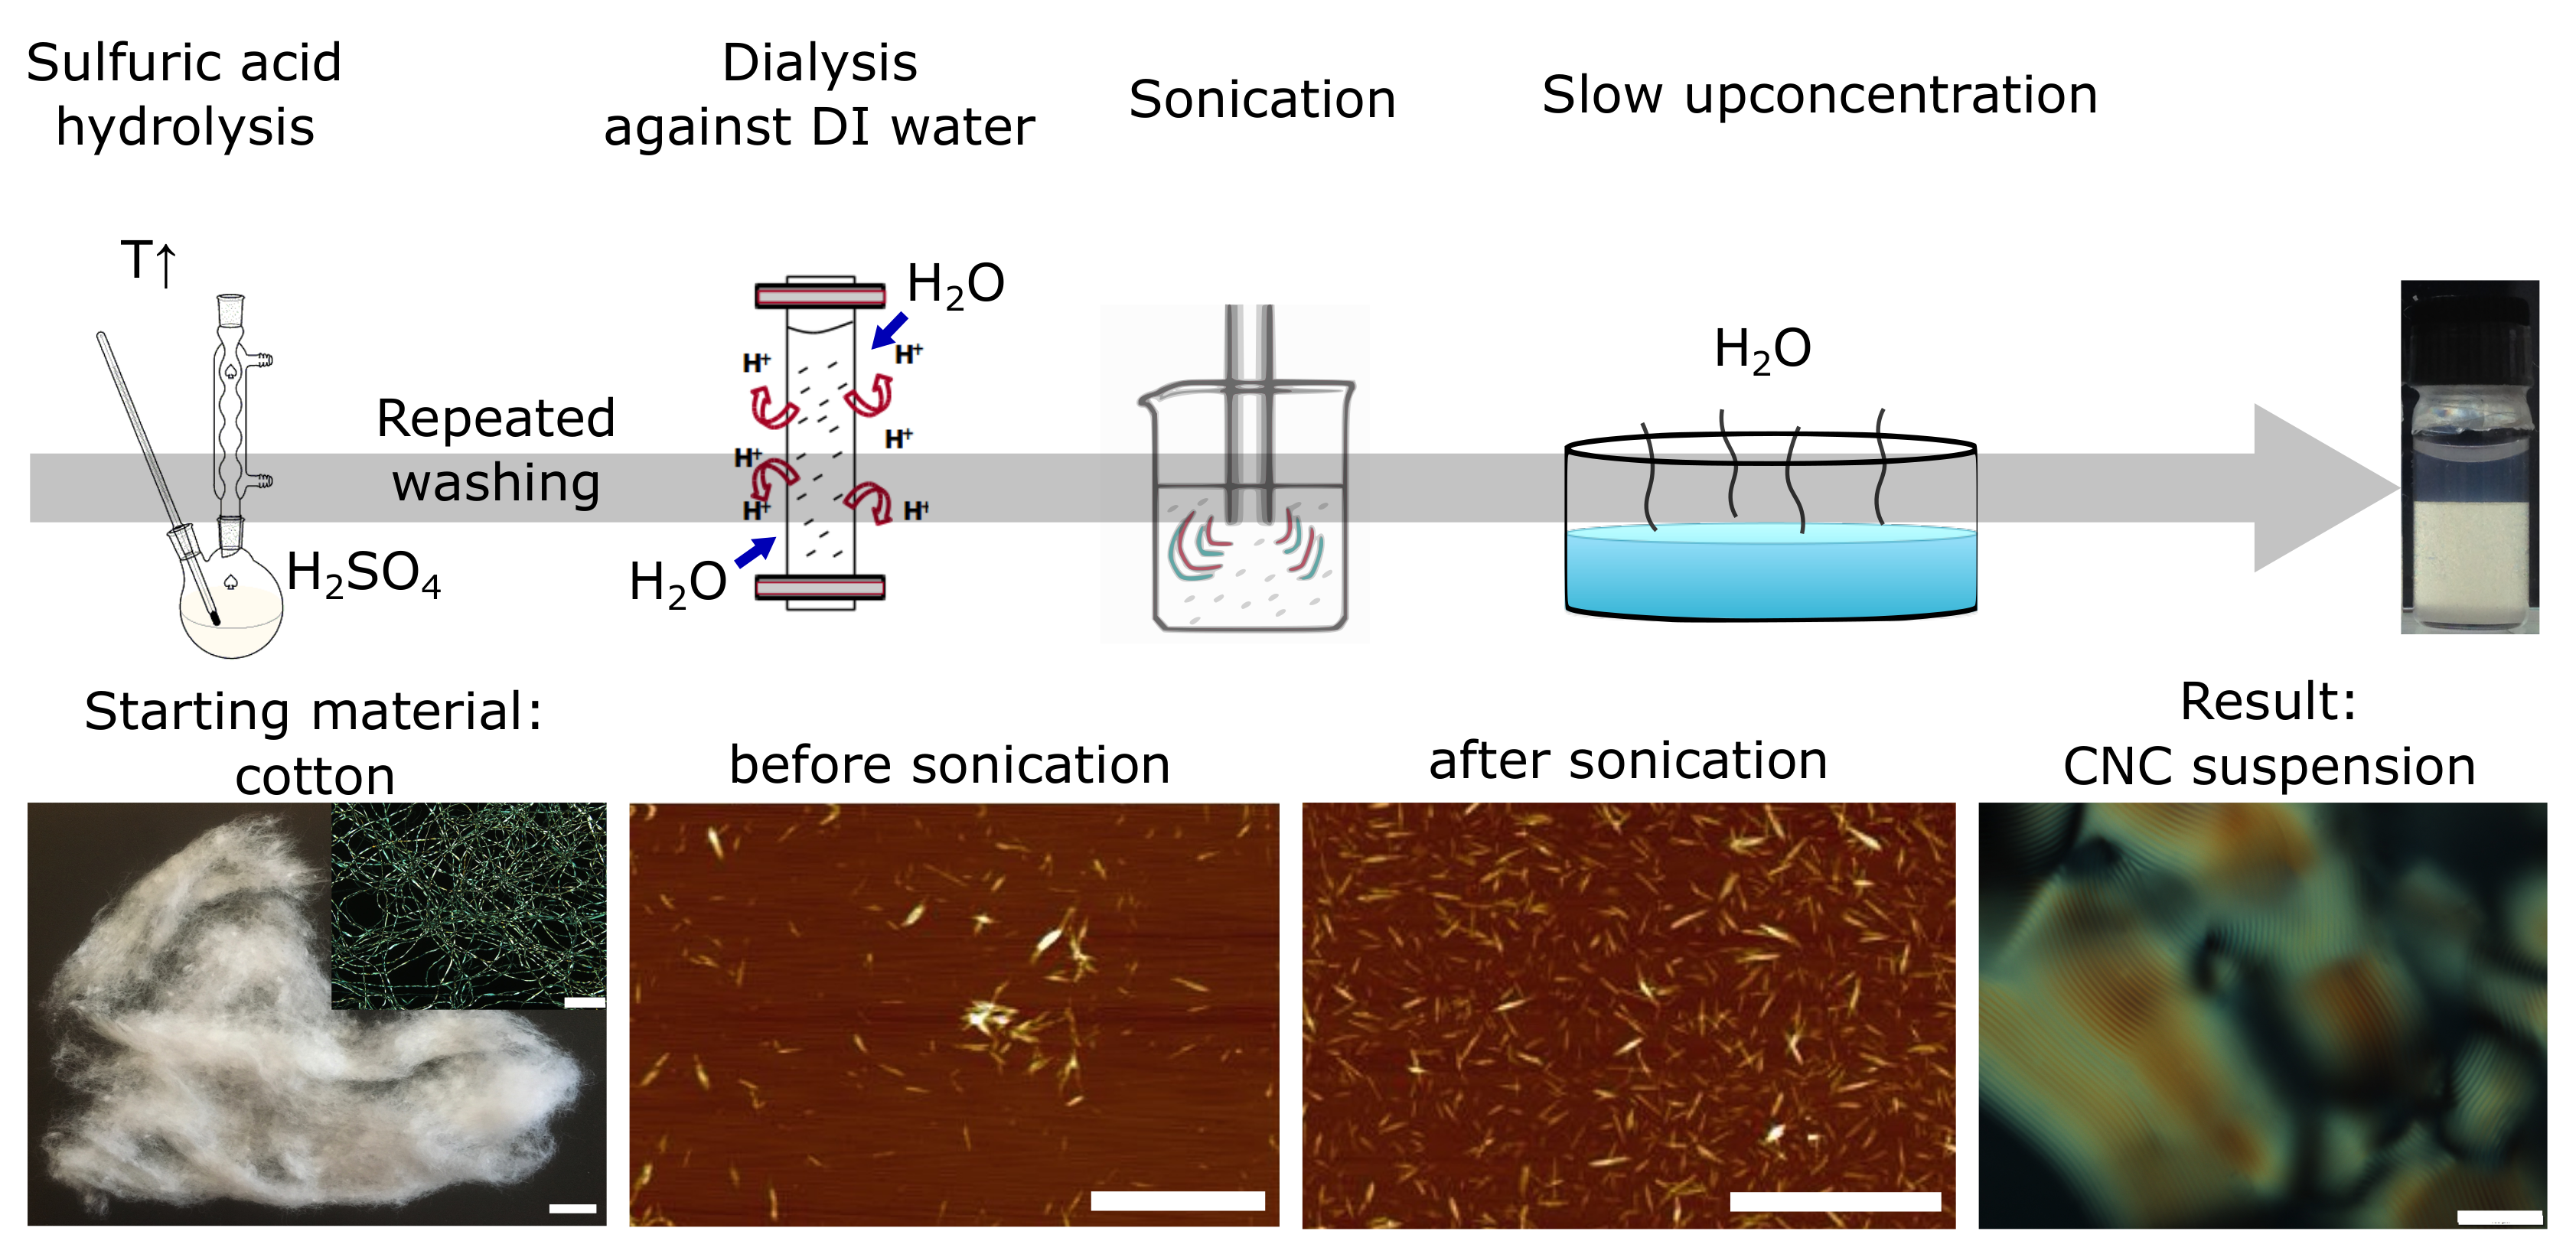
Figure 1. Upper line: simplified schematic of a typical CNC production scheme, here starting from a slurry of sulfuric acid and cotton; CNF or bacterial cellulose can be used instead. The sulfuric acid attacks the weaker regions in the cellulose fibrils and removes them, while at the same time providing the remaining CNCs with charged −SO 3 groups on their surface. The hydrolysis is terminated by dilution with excess water and the remaining acid is removed by repeated washing and dialysis. The highly diluted product is then ultra-sonicated to realize well dispersed CNCs. In a final step the diluted suspension is often concentrated (sometimes under reduced pressure) to give a maximum mass fraction of CNCs that still forms a stable suspension in water. This stock suspension can then be diluted again to achieve lower mass fractions. Lower line, from left to right: cotton as example of an untreated cellulose source (macroscopic and microscopic, as imaged by polarized light microscopy, scale bars are 1 cm and 500 μ m, respectively); AFM images of CNCs before and after sonication (scale bar 1 μ m), produced by sulfuric acid hydrolysis, with H + counter ions, both samples prepared by depositing a suspension with a mass fraction of w = 0.002 wt.% on the substrate used for imaging; polarized optical micrograph of the cholesteric phase formed by a CNC suspension (scale bar 100 μ m).
Crystals 10 00199 g001
Figure 2. Qualitative sketch of the interaction potential between electrostatically stabilized colloidal particles, as a function of particle separation x, at low (blue) and high (pink) ionic strength I, respectively, according to DLVO theory. Each main contribution (thin curves) to the total energy is sketched in addition to the total interaction potential (thick curves). At low I, an electrostatic energy barrier at a distance κ 1 (the Debye screening length) from the particle surface, prevents the particles from reaching the primary minimum that corresponds to particle aggregation and loss of colloid stability. The reduction of the electrostatic repulsion range upon increasing I eventually reduces the energy barrier to such an extent that thermal fluctuations will bring the particles to the primary minimum, at a separation distance shorter than κ 1 , and the colloid loses its stability.
Crystals 10 00199 g002
Figure 3. (a,b) Illustrations of the helix that is traced by the tip (red) of the director n (blue) as it continuously changes its orientation within the x y -plane when we move up the helix axis m, here considered along the z ^ -axis, for the case of right-handed (a) and left-handed (b) helical director modulations. Note that these drawings do not show any CNC rods, only the variation through space of n. A representative ’snapshot’ of rod distributions, as influenced by the helical director modulation and the imperfect orientational order ( S 0.8 ) is instead shown in part (c). The corresponding director helix is left-handed, as in (b) and as in CNC suspensions.
Crystals 10 00199 g003
Figure 4. (a) Scanning Electron Microscopy image with exceptional detail of the surface obtained by fracturing a film created by drying a cholesteric CNC suspension, the axis m of the helical director modulation being nearly in the film plane and vertical in the image. White arrows highlight regions where CNC rods protrude from the fracture surface. The inset (b) shows individual CNCs near such a region, where n is perpendicular to the fracture plane. Next to the protruding CNCs are holes, left by the removal of the corresponding rods that ended up stuck in the opposite fracture section. Note that rods are packed an order of magnitude closer in this solid film than in an equilibrium cholesteric liquid crystal phase, and their degree of order is probably greater as well. Reprinted by permission from Springer Nature Cellulose [49], Copyright 2012.
Crystals 10 00199 g004
Figure 5. Illustrations of the three elemental director field deformations splay, twist and bend.
Crystals 10 00199 g005
Figure 6. A series of CNC suspensions with increasing mass fraction w from left to right (the values, in wt.%, are indicated at the top of each vial), viewed between crossed polarizers after Earth gravity has separated the isotropic (dark, top) and cholesteric (bright, bottom) phases. Prior to taking the photo, all samples had been left undisturbed for 6 months. By quantifying the volume fraction of cholesteric to isotropic phase at each w, the coexistence regime of the phase diagram is mapped out.
Crystals 10 00199 g006
Figure 7. A schematic overview of tactoids of increasing size, from top to bottom, developing in a cholesteric-forming colloidal nanorod suspension. Each tactoid type (one per row) is sketched as it is viewed along x ^ , y ^ and z ^ (see local coordinate systems for guidance), where we define z ^ = m as the orientation of the helix when it develops. The drawings do not represent cross sections, but the projection into the paper plane of the outer tactoid surface. We sketch the director field in black and for the helix we draw side views in the first two columns, indicating n in the figure plane with red lines and n perpendicular to this plane with red dots, thus with a rotation of n by 90 in-between. Row (a) depicts the smallest tactoid (rarely seen in CNC suspensions), in which the director field is uniform, violating the anchoring conditions. The next row shows a tactoid of slightly larger size, where the anchoring condition is respected, a director field with bend and splay deformations developing within the tactoid. In the view along x ^ we use ’nails’ to illustrate the director field tilting out of the plane as a result of the surface curvature, the ’head’ of the nail pointing towards us, the ’tip’ pointing away. In row (c), a tactoid just large enough for the helix to develop is shown, the twisting developing from a non-helical director field that was originally pointing along x ^ (as in rows a,b). The final row shows the most commonly observed tactoids in CNC suspensions, where the helix has developed with many pitches, still along a single direction throughout the tactoid (orthogonal to the corresponding direction in c), still violating the anchoring conditions. We draw the situation for an ellipsoidal shape, elongated along m, which is common once the tactoids grow to sizes of several pitch lengths. The curving director pattern along z ^ in rows (c) and (d) is the projection of a hemispherical cap viewed along the helix. It has been created using the construction of Bouligand and Livolant [84], stacking 50 slices taken at constant z distances on top of each other, from the base to the top of the hemisphere, as illustrated in the inset between rows (c) and (d). We used 20 rotation of n from one slice to the next. Note that the views along x ^ , y ^ and z ^ are correlated, to better illustrate the helical variation of the director field. Red dotted lines between the sketches emphasize this aspect in row (d).
Crystals 10 00199 g007
Figure 8. Representative polarizing microscopy micrographs (crossed polarizers) of tactoids of cholesteric CNC suspensions, soon after ’birth’ (a) and later in the growth process (bd), eventually reaching sizes where radial helix orientation occurs (e). Even in the smallest tactoids in (a), the helix has probably developed, although the focus may render it difficult to see (see discussion in main text). In the last panel one ’dark ring’ has been emphasized, to highlight the non-closing spiral-like character of the stripes in the ’fingerprint’ texture decorating the tactoids. The distance between two consecutive stripes is p / 2 (see Section 7.1). Scale bars correspond to 50 μ m.
Crystals 10 00199 g008
Figure 9. CNCs are composed of several thousands of β ( 1 4 ) linked D-glucosyl moieties. The terminal glucosyl moiety undergoes acid catalyzed isomerization. Thereby the functionality of the group which is highlighted in pink changes from hydroxyl to aldehyde. The blue arrows indicate the rearrangement of the chemical bonds. Next to the two shown six-membered cyclic pyranosyl isomers, two five-membered cyclic furanosyl isomers (not shown) could form additionally. Isomerization of the starting glucosyl moiety is not possible.
Crystals 10 00199 g009
Figure 10. Illustration of visible Bragg reflection from cholesteric structures. (a) Schematic illustration of how the helical modulation of the director, and thereby the optic axis, gives rise to angle-dependent Bragg reflection. On the left, a realistic depiction of rods in a cholesteric arrangement is shown. Next to it a commonly used simplified representation is drawn, where a long horizontal line represents n in the paper plane whereas a vanishing line means that n is perpendicular. If we consider light incident along the helix axis m with polarization in the paper plane (p) it will experience a refractive index n p , m that varies with a period of p / 2 between n and n | | , as indicated on the right. If we instead consider light entering at an oblique angle θ with respect to m, we can apply Bragg’s simplification and consider that light is reflected every time the refractive index repeats itself, for instance being n as in the figure. The two drawn light rays reflected at different levels along m, separated by p / 2 from each other, will then have slightly different path lengths, as indicated in red. In order to get constructive interference, the difference must be an integer N times the wavelength, i.e., we obtain Bragg’s condition N λ 0 = p n ¯ cos θ , where λ 0 is the central reflection wavelength as measured in air and n ¯ is the average refractive index (see main text). (b) Viewing angle-dependent selective reflection of a large square dried CNC film (11.5 cm side length) and a small cell containing a thermotropic cholesteric. The CNC film is viewed partially through 3D cinema glasses, thus through a left-handed circular polarizer on the left and a right-handed one on the right. For normal incidence the reflected light is left-handed circularly polarized but with increasing viewing angle the circular polarization is lost. The color is blue-shifted, i.e., λ 0 moves to shorter values, as expected for increasing θ . (c) For comparison, the thermotropic sample is viewed through the right and left circular polarizers under identical illumination and imaging conditions as a function of viewing angle. The circular polarization (here right-handed) is retained even for a large θ .
Crystals 10 00199 g010
Figure 11. Illustration of the process of helix compression and axis reorientation upon drying a CNC suspension after the kinetic arrest, following Frka-Petesic et al. [174]. The uncompressed state (a) is compared to the state after uniaxial compression, showing representative director arrows that, before compression, were perpendicular to the original helix (b), as well as arrows perpendicular to the redefined helix representative of the compressed and deformed state (c). See main text for further explanation. Reprinted figure with permission from [174], http://dx.doi.org/.10.1103/physrevmaterials.3.045601. Copyright (2019) by the American Physical Society.
Crystals 10 00199 g011
Figure 12. The coffee-ring effect in evaporating droplets of aqueous CNC suspension and its elimination via slow drying. (a) Superposition of transmission optical microscopy images acquired during the evaporation of a droplet (volume 1 μ L) of an unsonicated aqueous CNC suspension (starting concentration w = 4 wt.%) to which we have added 0.1 mg/mL polystyrene spheres (diameter 1 μ m). The droplet was deposited on a glass coverslip and dried at ambient laboratory conditions (relative humidity, R H = 40 %). The polystyrene spheres act as tracers that enable flow visualization. The variable τ is a reduced evaporation time, τ = t / t evap , where t evap is the total evaporation time. The inset shows the colorful reflection of a fully dried film that was obtained by drying the same suspension, under very similar experimental conditions (volume 2 μ L, R H = 50 %). (b,c) Reflection optical microscopy images and corresponding height profiles, obtained by profilometry, of CNC deposits from droplets (volume 2 μ L) of unsonicated aqueous CNC suspensions (starting concentration w = 5 wt.%) deposited on glass coverslips, dried at low ( R H = 50 %, a) and high ( R H = 90 %, b) relative humidity; from M.Sc. thesis of M. Dupas, U. Luxembourg 2018, supervised by M. Anyfantakis.
Crystals 10 00199 g012
Figure 13. Examples of parameters and conditions affecting the selective reflection of films formed by drying CNC suspensions. (a) Impact of ultrasonication treatment. Photographs (insets) and reflection spectra (diagram) of CNC films prepared from suspensions treated with ultrasonication energies of 750 J/g CNC (E) and 2225 J/g CNC (G). Film (F) was prepared by drying a 1:1 mixture of the suspensions used to prepare films (E) and (G). The scale bar is 1 cm. Adapted with permission from Ref. [198]. Copyright 2011 American Chemical Society. (b) The influence of electrolyte addition. Increasing the concentration of NaCl added to an acid-form CNC suspension leads to a decrease in the wavelength of the reflection band of the dried CNC films. Reprinted with permission from Ref. [3]. Copyright 1998 Pulp and Paper Technical Association of Canada. (c) The effect of added polymers. Transmission spectra and reflection photographs of films of CNC/polyethylene glycol composite films (diameter 9 cm) at various CNC/polymer compositions; blue: 90/10; green: 80/20 and red: 70/30. Adapted with permission from Ref. [134]. (d) The effect of surface anchoring and orientation of liquid crystalline CNC suspensions. Cross-polarized images of films dried in water vapor saturated atmosphere assisted by orbital shear with a glass coverslip off (left) and on (right) during drying. The scale bars are 100 μ m. Reprinted with permission from Ref. [201]. Copyright 2018 American Chemical Society.
Crystals 10 00199 g013