Article

A Novel Phenolic Foam-Derived Magnetic Carbon Foam Treated as Adsorbent for Rhodamine B: Characterization and Adsorption Kinetics

1
College of Materials Science and Engineering, Nanjing Forestry University, Nanjing 210037, China
2
Jiangsu Co-Innovation Center of Efficient Processing and Utilization of Forest Resources, Nanjing 210037, China
*
Authors to whom correspondence should be addressed.
Crystals 2020, 10(3), 159; https://doi.org/10.3390/cryst10030159
Submission received: 12 February 2020 / Revised: 22 February 2020 / Accepted: 26 February 2020 / Published: 1 March 2020
(This article belongs to the Section Crystalline Materials)

Abstract

:
In recent decades, dye wastewaters produced by dye-manufacturing and dye-consuming industries have become a growing water pollution problem. Herein, a novel phenolic foam-derived magnetic carbon foam is synthesized by in-situ pyrolysis of iron acetylacetonate (Fe(acac)3) containing phenolic resin and its corresponding application as an adsorbent for the removal of Rhodamine B from effluent is investigated. The characterization of the as-prepared adsorbent is carried out by SEM, EDS, XRD, XPS, VSM, FT-IR, Raman, and BET. The magnetic carbon foam is observed to consist of a CFe15.1/C matrix modified with α-Fe/Fe3C/Fe2O3 composites, possessing a 3D porous architecture formed by inter-connected cells with diameters of 50–200 μm and narrow ligaments with thicknesses of ~20 μm. Experimental tests demonstrate that the equilibrium of adsorption behavior of Rhodamine B onto the obtained adsorbent can be reached within 40 min and the corresponding maximum adsorption capacity is 258.03 mg/g. The effects of contact time and adsorbent dosage on the adsorption performance are investigated. Besides, four models are introduced to fit the experimental data to evaluate the adsorption kinetics. The overall rate constant is determined by the chemisorption process, according to the pseudo-second order adsorption kinetics mechanism. Besides, the pH effect on RhB adsorption onto magnetic carbon foam is investigated, with the pH values varying from 3 to 10. The above results prove the application prospect of magnetic carbon foam prepared in this work in dye wastewater treatment.

1. Introduction

With the improvement of people’s living standard, our demand for beauty is increasing day by day, but this is also accompanied by the production of dye wastewaters [1]. Now, across the globe, 3000~4000 kilotons of wastewater generated from dye manufacturing and dye-consuming industries are directly discharged into natural water sources every day, doing great damages to the ecosystem’s aquatic communities, inducing mutagenic effects on mammals’ organs, and, thus, greatly threatening human health [2]. Therefore, effective treatments of dye wastewaters are urgently needed, which is of interest, but is also a challenge [3].
As we know, simple treatments cannot effectively remove dyes from various aqueous solutions since the dyes normally possess complex structures, poor degradabilities, and high solubilities. Based on this, many ways are designed to solve this tricky problem. However, these methods possess non-negligible disadvantages which restrict their real industrial applications. For example, ozonation [4] and extraction [5] require much oxidizing agent or organic solvent for the treatment processes and the excessive chemicals may cause secondary pollution. Filtration [6] is not suitable for use in extreme environments since the flux of the used membrane decreases when time goes by due to its non-resistance to corrosion. Besides, the electrochemical treatments [7] are highly energy-guzzling, and the microbial biological treatments [8] are easily passivated by the nonbiodegradable heterocyclic and aromatic components of the dye molecules. Comparatively, the adsorption technique has attracted great interest in the field of dye wastewater treatment due to its advantages such as initial cost, flexibility and simplicity of design, ease of operation, and insensitivity to toxic pollutants [9,10].
Recent progress indicates that magnetic porous carbon adsorbents that consist of solid skeletons and air cavities are ideal candidates for the removal treatments of dyes due to their advantages such as chemical stabilities, large specific surface areas, and strong adsorption capacities [11,12]. Furthermore, it is easy to collect, recycle, and reuse the adsorbents that adsorb pollutants under the action of external magnetic field, which is attributed to the magnetic phases in the adsorbent composites. Unfortunately, large-scale, low-cost, and simple production of porous carbon-based magnetic adsorbents is still a challenge [13,14]. Fabrication of such carbon-based composites always involves templates, complex surface functionalization or couple agents, and a large number of pre-prepared magnetic particles which are easy to agglomerate during the composition processes. These factors make the corresponding preparation processes complex, expensive, and harmful to the environment. Thus, exploring sustainable and economic methods to fabricate porous carbon-based magnetic adsorbents is urgently desired.
Herein, a novel phenolic foam-derived magnetic carbon foam is synthesized by in-situ pyrolysis of iron acetylacetonate (Fe(acac)3) containing phenolic resin. The as-prepared magnetic carbon foam is characterized by SEM, EDS, XRD, XPS, VSM, FT-IR, Raman, and BET. Furthermore, four models are introduced to fit the experimental data to evaluate the adsorption kinetics. Further, the pH effect on RhB adsorption onto magnetic carbon foam is investigated with the pH values varying from 3 to 10.

2. Materials and Methods

2.1. Materials

Glacial acetic acid and sodium hydroxide with analytical grade were purchased from Shanghai Shenbo Chemical Co., LTD and Guangdong Xilong Scientific Co., LTD, respectively. Phenol (w%, ≥99.5%), formaldehyde (w%, 40%), phosphoric acid, and Tween-80 were purchased from Sinopharm Chemical Reagent Co., LTD. N-pentane, p-toluene sulfonic acid, Fe(acac)3, dimethylformamide (DMF), and RhB with analytical grade were purchased from Aldrich (Darmstadt, Germany). All aqueous solutions were prepared with de-ionized water.

2.2. Preparation of Magnetic Carbon Foam

Phenol and aqueous formaldehyde solution (w/w, 37%) were mixed with a molar ratio of 1:8. Further, 20% sodium hydroxide solution was added into the mixture with a final concentration of 0.5% (w/w). After being heated in a water bath at 80 °C for 5.0 hours with 300 r/min mechanical agitation, Fe(acac)3 DMF solution with a concentration of 0.12 g/mL was added into the system. The pH value of the mixture was adjusted to neutrality by dripping 36% acetic acid. The product was then dehydrated in vacuum (0.08 MPa) for 1.0 hour at 40 °C, for 15 min at 50 °C, and for 1.0 hour at 60 °C, respectively. The obtained phenolic resin was then mixed with Tween-80, n-pentane, and mixed acid solution consisting of p-toluene sulfonic acid and phosphoric acid. Then, the foaming process was performed at 70 °C for 15 min. The following pyrolysis treatment of the as-prepared Fe(acac)3 containing foam is according to our previous publication [15], and the magnetic carbon foam was obtained.

2.3. Adsorption Experiment

Firstly, 5 g RhB was dissolved in 500 mL deionized water under slight ultrasonic and RhB stock solution with the concentration of 10 g/L was obtained. Concentrations ranging from 1 mg/L to 15 mg/L were obtained by diluting the stock solution with different ratios and were introduced to determine the standard quantitation curve of RhB samples by measuring the optical density (OD) of RhB aqueous solutions at 550 nm under UV-vis spectroscopy (UV-3500, Shimadzu, Japan). The following calculation of the concentration obtained after each adsorption experiment is based on this standard quantitation curve. And in order to be closer to the practical application, if not specified, all experiments were performed without adjusting the pH value. All the adsorption experiments were repeated three times and the average value was obtained for the following calculations.

2.3.1. The Adsorption Capacity q (mg/g) and Efficiency η (%) Values of the Magnetic Adsorbent

The q and η values were calculated using Equations (1) and (2).
q = V 0 C 0 V 1 C 0 m adsorber
η = ( C 0 V 0 C 1 V 1 C 0 V 0 ) × 100 %
where C0 and C1 are the concentrations of RhB in initial and supernatant solution (mg/L), respectively. V0 and V1 correspond the volumes of the initial and supernatant RhB solution (L), respectively. madsorbent represents the adsorbent mass (g).

2.3.2. Effect of Adsorbent Dosage

The effect of adsorbent dosage on the adsorption behavior was investigated by incubating magnetic carbon foam with different dosages (from 5 mg to 23 mg) in RhB solution (15 mL, 100 mg/L) overnight in a thermostatic culture oscillator. The incubation temperature was set as 25 °C and rotation speed was set as 150 r/min. Then, the balanced concentrations of RhB solution in supernatant solution were calculated out according to the standard curve after being treated by magnetic separation in an external magnetic field.

2.3.3. Effect of Contact Time

Magnetic carbon foam (30 mg) was added into 100 mg/L RhB solution (40mL). During the incubation in a constant temperature culture oscillator (temperature: 25 °C, rotation speed: 150 r/min), samples were taken at constant time intervals and treated by magnetic separation for 5 min. Then, the residual concentrations of RhB solution in supernatant solution were tested by UV-vis spectroscopy and calculated according to the obtained standard curve.

2.3.4. Effect of pH

The adsorption of RhB with a concentration of 100 mg/L onto the magnetic carbon foam with a dosage of 8 mg was investigated at pH values varying from 3 to 10. The mixture was incubated overnight followed by magnetic separation, and the adsorption efficiency of RhB was calculated according to the obtained standard curve.

2.4. Characterization

Scanning electron microscopy (SEM) and energy-dispersive X-ray spectroscopy (EDS) were carried out by JSM-7800F (Japan Electronics Co., Ltd, Tokyo, Japan) coupled with a heat field emission electron gun (Oxford energy spectrometer, XMX1236, Oxford Instruments Co., Ltd, Shanghai, China) to investigate the morphologies and element distributions of the sliced samples. Microcomputed tomography (micro-CT) analysis was introduced to investigate the distribution of the accumulational magnetic nanoparticles in magnetic carbon foam, using a vivaCT 80 system (V6.5-3 Scanco Medical, Bruettisellen, Switzerland) [15], along with a 3D reconstruction process by MIMICS 19.0 (Materialise, Leuven, Belgium). Compressive strength measurement was operated by a universal capability test machine with a specimen damage time of 1 ± 0.5 min and a uniform force loading speed of 0.5 N/mm. The compressive strength of the specimens was calculated according to the following Equation (3): σ = F m a x b t , where F m a x represents the recorded maximum failure load (N), b and t are the length and width of the thrust surfaces of the obtained samples, respectively. X-ray diffraction (XRD) patterns of the samples were obtained on a Bruker D8 Advance powder X-ray diffractometer (Germany) operated at 40 kV and 40 mA using Cu-Ka radiation (λ = 1.54 Å) with 200 mg of each specimen. The X-ray photoelectron spectroscopy (XPS) spectrum was measured in an AXIS UltraDLD (Shimadzu, Japan) using an Al Ka X-ray source and was operated at 150 W. Fourier transform infrared and Raman spectroscopy analyses were performed by Thermo Scientific Nicolet 6700 FTIR spectrometer (USA) and Renishaw in-via Raman micro-spectrometer, respectively. Brunauer-Emmett-Teller (BET) analyses were performed on Quantachrome Autosorb-1-C Chemisorption-Physisorption Analyzer using nitrogen as the analysis gas. Magnetic measurements of each sample (10 mg) were carried out using a Lake Shore 7407 VSM provided by East Changing Technologies, Inc.

3. Results and Discussion

3.1. Characterization of the Samples

The SEM micrographs of the samples are shown in Figure 1A–C, along with the corresponding EDS mapping images (Figure 1D), representative images (Figure 1E), micro-CT imaging results (Figure 1F), and compressive strength testing results (Figure 1G), respectively. It is obvious that compared with phenolic resin foam without Fe(acac)3, Fe(acac)3-containing foam turns brown red while the micromorphology is basically unchanged, as shown in Figure 1E. After pyrolysis processes, both phenolic resin foams with and without Fe(acac)3 turn to shiny black with varying degrees of volume shrinkage. The carbonized foam derived from Fe(acac)3-containing foam shows better dimensional stability than the other one. Figure 1A–C show the SEM images of the cross-sectional morphology of the synthesized magnetic carbon foam in different magnifications. From Figure 1A and 1B, we may see that the magnetic carbon foam possesses a solid 3D porous architecture consisting of inter-connected cells in diameters of 50~200 μm and smooth ligaments with thicknesses of ~20 μm. Graphite-like sheets are observed to surround these ligaments as pointed by green arrows in Figure 1C and act as cell walls. Significantly from the high-resolution SEM images in Figure 1C, particles are observed to be modified intermittently throughout the surfaces of the ligaments and uniformly disperse on the supported sheets among the ligaments. The EDS elemental mapping results, as shown in Figure 1D, indicate that the obtained magnetic carbon foams consist of C, Fe, and O elements. Besides, the signal locations of Fe elements are observed to coincide with the particles signaled by yellow arrows in Figure 1D, indicating that these particles consist of Fe elements while the ligaments mainly consist of C and O elements. The dispersion of Fe elements inside the magnetic carbon foam is also proved by Micro-CT imaging, as shown in Figure 1F. As a control, the carbonized foam derived from phenolic resin foam without Fe(acac)3 shows no Micro-CT signals both in cross-section images and the 3D reconstruction image. Comparatively, a dense and uniform dispersion of Fe elements is observed inside the magnetic carbon foam. As we know, the mechanical properties of pollutant adsorbents are always the considered factors for their practical applications, which are directly related to the corresponding actual adsorption efficiencies and recycling capacities. The compressive strengths of the samples are tested as shown in Figure 1G. The compressive strength of phenolic resin foam is 0.15 ± 0.02 MPa, while the compressive strength of carbonized phenolic resin foam is only 0.05 ± 0.01 MPa. This changing trend is attributed to the carbonization of phenolic resin. It is worth noting that the compressive strength of magnetic carbon foam is calculated as 0.35 ± 0.02 MPa. This five-time increase of the mechanical property is due to the reinforce effect of the particles in-situ, which are synthesized inside the skeletons.
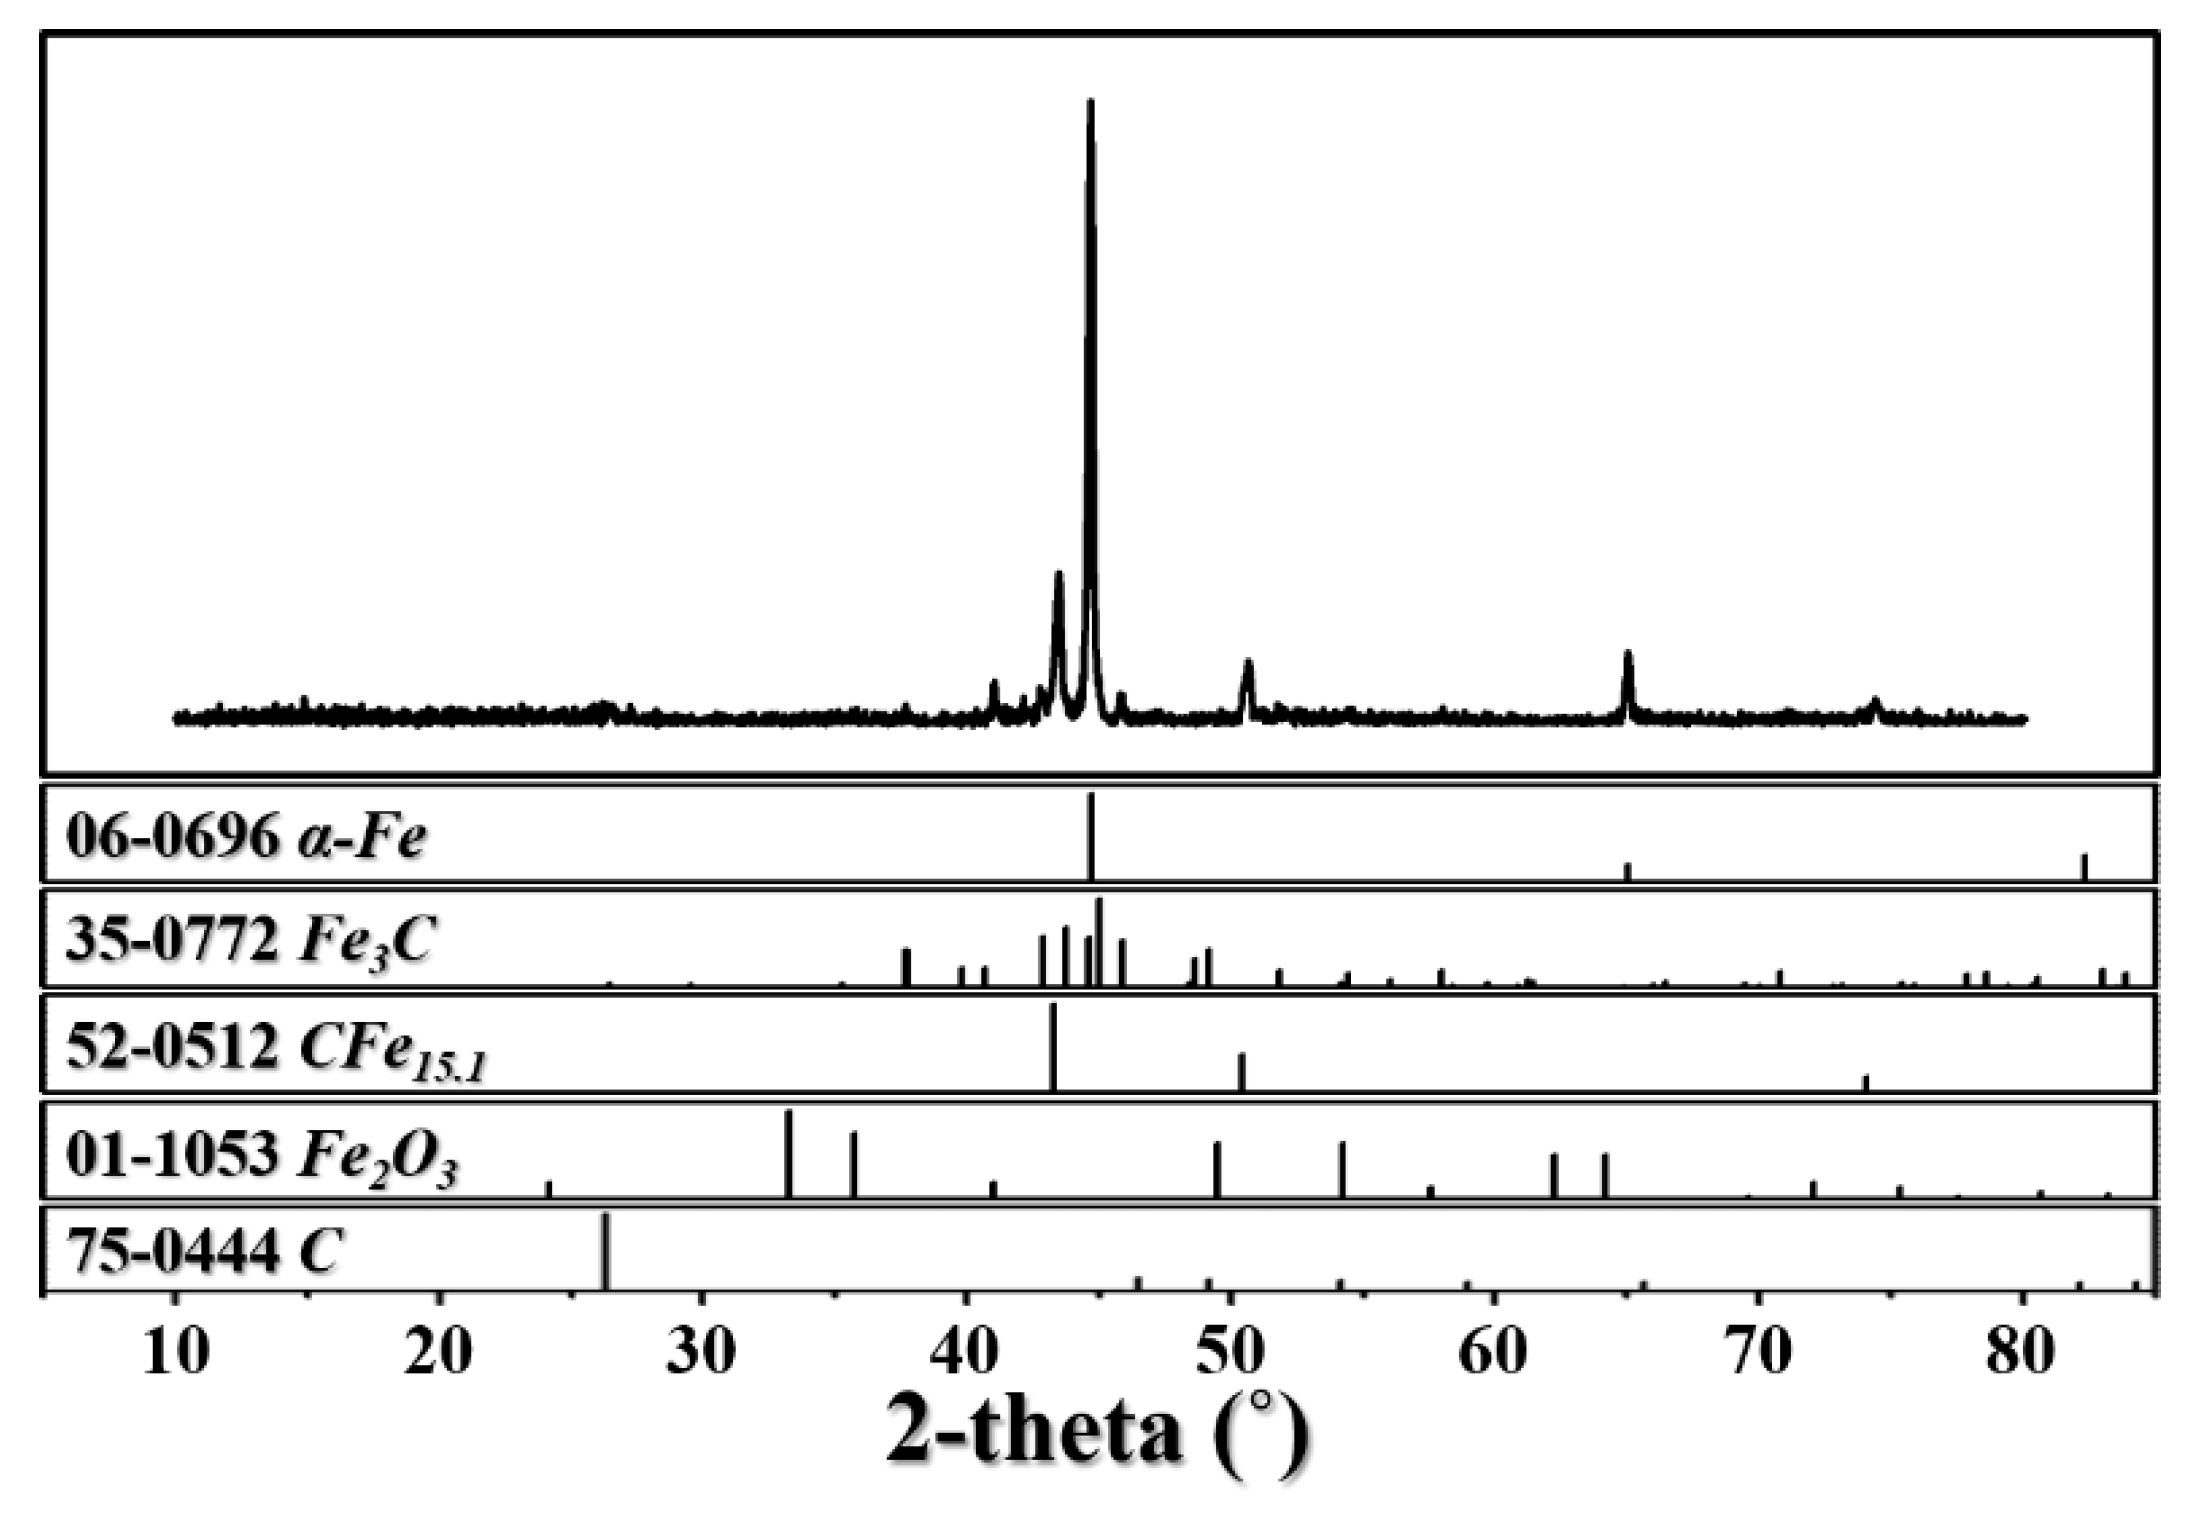
XRD is introduced to investigate the crystalline structures of the magnetic carbon foam as shown in Figure 2. It is observed from the XRD curve that the peak at 2θ = 44.6° is attributed to the combined diffraction peaks of the (110) plane of the body-centered cubic structure of α-Fe (JCPDS 06-696) and the (031) and (220) planes of Fe3C (JCPDS 35-0772) [16]. Besides, the peak at 2θ = 65.0° represents the (200) plane of α-Fe, and the peaks at 2θ = 43.5° and 45.8° correspond to the (102) and (131) planes of Fe3C. Fe2O3 is proved to be in-situ synthesized according to the peak at 2θ = 41.2° which represents the corresponding to (113) plane (JCPDS 01-1053) [17]. It is worth noting that the peaks at 2θ = 42.7°, 50.6°, and 74.4° which correspond to the (111), (200), and (220) planes of CFe15.1 (JCPDS 52-0512) indicate the formation of Austenite. The observed infiltration of liquid carbon into the crystal of iron skeleton is consistent with the EDS mapping results. Additionally, the peak at 2θ = 26.5° represents the (111) plane of graphite crystalline carbon (JCPDS 75-0444) which is observed in Figure 1C. All these XRD results imply that the as-synthesized magnetic carbon foam is the CFe15.1/C matrix modified with α-Fe/Fe3C/Fe2O3 composite particles.
The chemical compositions of the samples along with the preparation mechanism are further investigated by XPS, as shown in Figure 3. C, O, and Fe elements are observed for the magnetic carbon foam while phenolic resin foam and carbon foam exhibit no Fe XPS signal. This is because of the in-situ polymerization of Fe(acac)3 in phenolic resin. As shown in the high-resolution XPS spectra of C1s in Figure 3B, three individual peaks centered at ~284.5 eV, 285.0 eV, and 286.2 eV can be deconvoluted out for phenolic resin foam, which represent the C=C, C-C, and C-O bonds in the polymer [18]. The C1s spectrum of the carbon foam is observed to turn sharper with a reduced C-O percentage distribution and increased C-C and C=C percentage distributions. This is mainly attributed to the graphitization that happens inside the as-prepared carbon matrix during the pyrolysis treatment. An additional peak at 283.7 eV which corresponds to the C1s in Fe3C is observed for magnetic carbon foam. Meanwhile, the intensity of the C=C sub-peak increases while that of C-C decreases, indicating that amorphous carbon structures transform into aromatic clusters in the obtained carbon matrix at high temperatures. Two peaks at ~533.5 eV and ~532.6 eV are observed both for phenolic resin foam and carbon foam in the high-resolution XPS spectra of O1s in Figure 3C, which correspond to the C-O and C=O groups in phenolic resin and graphite oxide [19]. By comparison, the additional peak at ~530.3 eV indicates the formation of Fe2O3 inside the magnetic carbon foam, which is consistent with the two deconvoluted peaks at ~710.7 eV and ~724.3 eV from the spectrum of Fe2p of the magnetic carbon foam in Figure 3D [20]. In addition, the peaks at the binding energies of ~722.9 eV, ~708.8 eV, and ~720.0 eV, which are the characteristic doublet from Fe 2p core-level electrons of Fe3C and α-Fe, indicate their formations during the pyrolysis processes [21].
The corresponding reaction mechanism can be concluded based on the above XRD and XPS results. In detail, phenolic resin is firstly carbonized into char with -C- and aromatic-aromatic links, while Fe3O4 forms in-situ by thermal decomposition of Fe(acac)3 at ~300 °C [22]. The as-synthesized Fe3O4 further pyrolysis into α-Fe when the pyrolysis temperature increases to ~600 °C. During this process, Fe2O3 is also synthesized via the following interacts:
2 Fe 3 O 4 + O * 3 Fe 2 O 3
2 α Fe + 3 O * Fe 2 O 3
where O * is the by-product of polymer pyrolysis. As the temperature further increases to 1000°C, the formed Fe2O3 and α-Fe can react with the carbon matrix, resulting in the formation of Fe3C as the following equation:
6 Fe 2 O 3 + 4 C ( s ) 1000 4 Fe 3 C + 9 O 2
3 α Fe + C ( s ) 1000 Fe 3 C .
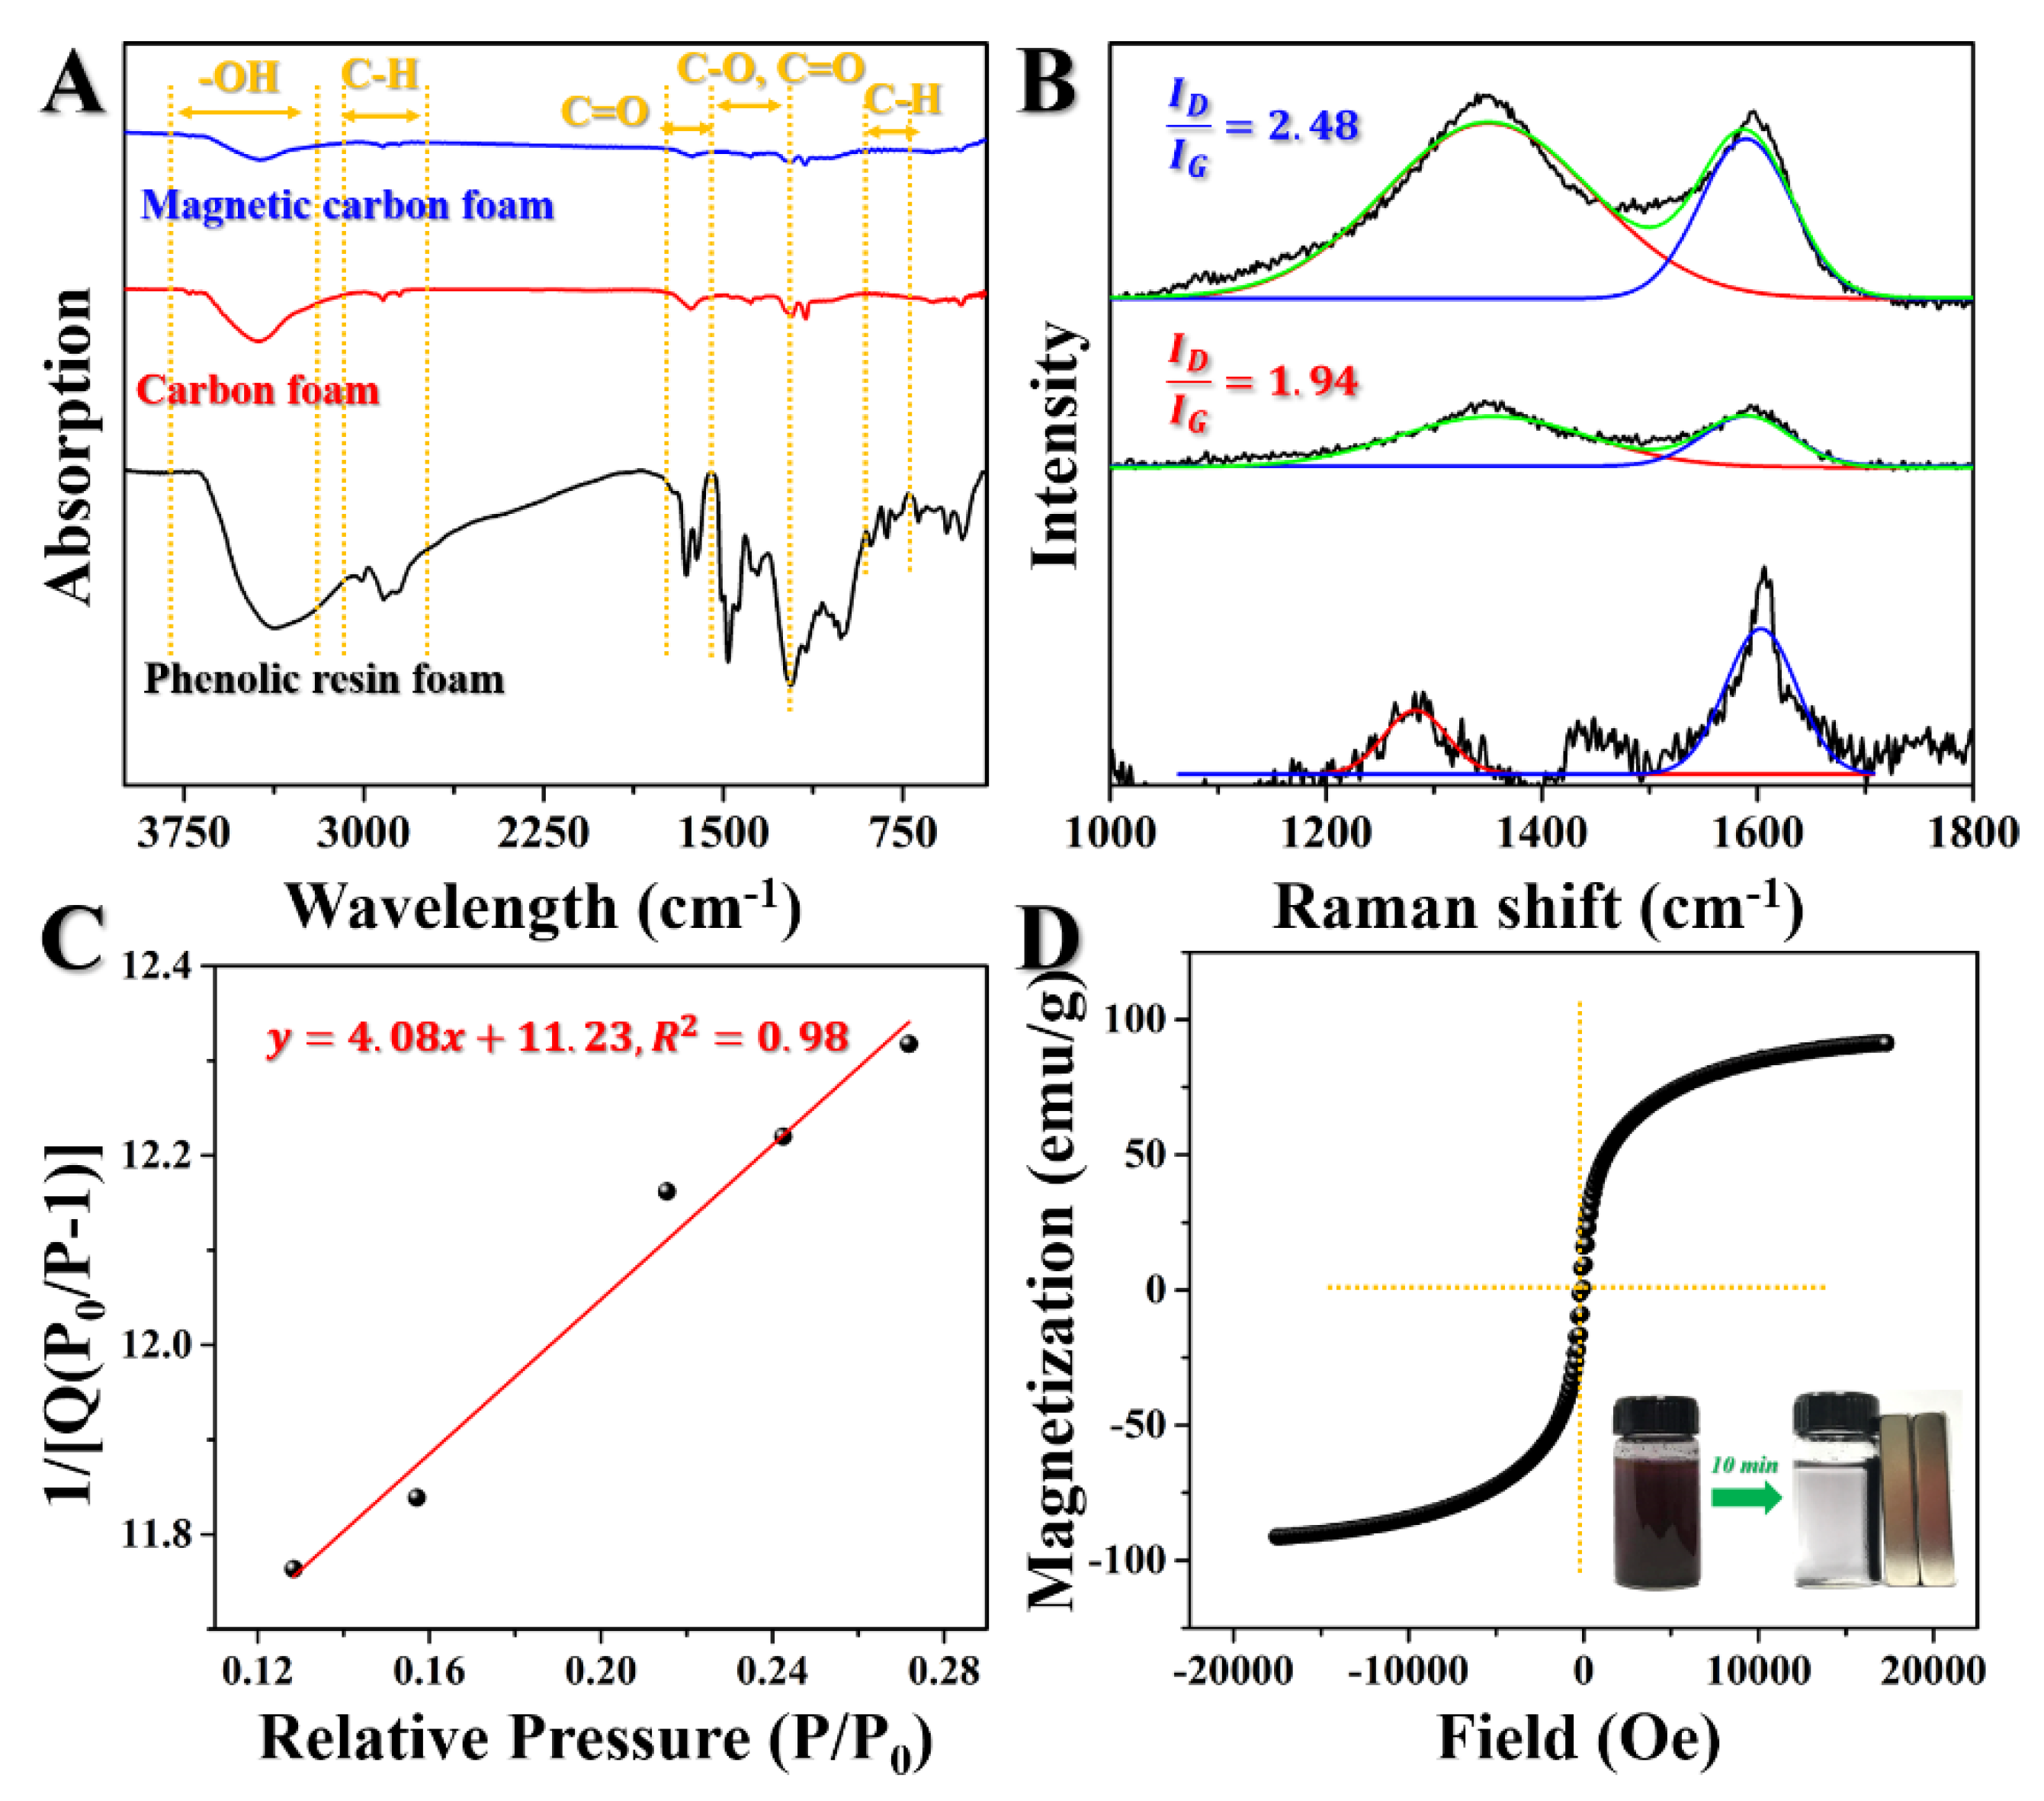
Figure 4A is the FT-IR spectra of the samples to investigate their functional groups. The adsorption bands at around 1720–1553 cm−1 and 1553–1214 cm−1, which represent the oxygen-containing functional groups of C=O and C-O groups, respectively, are observed to be destroyed, indicating the carbonization of phenolic resin foam. Additionally, the strong and broad bands with sub-bands at 1654–1008 cm−1, which correspond to the skeletal stretching and bending modes of aromatic structures containing residual O heteroatoms, are observed to diminish after the pyrolysis processes at 1000 °C. Besides, the intensities of the bonds at 900–700 cm−1, which are characteristic bonds of the out-of-plane bending modes of C-H groups, decrease after the pyrolysis treatment, indicating the graphitization and aromatic nucleus features of the carbon matrices. As we know, Raman spectroscopy is an effective method in this field which is sensitive to sp2 carbon structures and corresponding features on the nanometer-scale. The typical Raman spectra of phenolic resin foam, carbon foam, and magnetic carbon foam in the 1800–1000 cm−1 region are shown in Figure 4B. Two bands can be observed in all of these three spectra, one of which near 1340 cm−1 is D-band, which corresponds to the sp3 atom vibration of disordered graphite, while the other band is G-band near 1590 cm−1, representing the sp2 atom in-plane vibration of 2D hexagonal lattice, respectively [23]. The ID/IG value is observed to increase from phenolic resin foam to carbon foam, implying the transformation of the phenolic resin polymer into graphite-like carbon structures at high temperature. The ID/IG value further increases from 1.94 (carbon foam) to 2.48 (magnetic carbon foam) with the presence of Fe, indicating a rise of defect or edge-bonded graphite-like structures caused by the catalysis of Fe. As long as we know, the surface nature of porous adsorbents is an important factor that affects the corresponding adsorption capacity. Here, the specific surface area of magnetic carbon foam is measured by five-point BET surface measurement according to the equations:
P / P 0 Q ( 1 P / P 0 ) = 1 V m × C + C 1 V m × C × ( P / P 0 )
S BET = 4.35 V m ,
where P 0 and P are the saturation and the equilibrium pressure of adsorbates at the temperature of adsorption, Q is the adsorbed gas quantity. According to the nitrogen adsorption-desorption isotherm theory, C 1 V m × C and 1 V m × C are the slope and y-intercept values of the straight line as shown in Figure 4C. The calculated surface nature is 227.5 m2/g. This high surface area of the as-synthesized adsorbent provides a large number of effective sites for the possible contact with RhB and is beneficial for adsorption reactions. In addition, a typical hysteresis loop is obtained by VSM as shown in Figure 4D. The obtained saturation magnetization value is 91.5 emu/g, indicating that the adsorbent can respond quickly to the external magnetic field. As inserted in Figure 4D, the magnetic carbon foam which has adsorbed RhB from the mixture solution can be completely collected after incubation for 10 min in an external static magnetic field.

3.2. Adsorption Investigations

3.2.1. Effect of Adsorbent Dosage

RhB solutions of concentrations ranging from 1 mg/L to 15 mg/L are introduced to determine the corresponding standard quantitation curve by measuring the optical density (OD) values at 550 nm as shown in Figure 5A, and the structure of RhB is inserted. It is obvious in Figure 5A that the optical density of RhB solution at 554 nm increases with the increase of its concentration. As shown in Figure 5B, there is a linear relationship between the optical density and the concentration: y = 0.125 x + 0.061 ,   R 2 = 0.99 , where x represents the concentration of RhB solution, y is the corresponding optical density at 554 nm. The concentrations of the RhB solutions after being treated by the adsorption and magnetic separation treatments are calculated according to this fitting curve.
Experiments are carried out to determine the effect of the adsorbent dosage on RhB adsorption. It can be observed in Figure 5C that the intensity of the absorbance peak at 554 nm decreases with the increase of the adsorbent dose. After being treated with 23 mg magnetic carbon foam and magnetic separated in an external magnetic field, the supernatant of RhB solution exhibits no adsorption peak, indicating that RhB has been totally absorbed by the magnetic carbon foam from the solution. Figure 5D obviously demonstrates that the removal proportion of RhB increases with increasing the dosage of the adsorbent. This is attributed to the fact that with the increase of adsorbent dosage, more effective surface sites are available for the adsorption of RhB. However, the corresponding adsorption capacity of RhB decreases gradually from 258.03 mg/g to 66.22 mg/g with the dosage increase from 5 mg to 23 mg. This is mainly due to the probable collision among the adsorbent units in high solid content which induces the aggregations of the adsorbent and the decrease of the total effective surface area and thus passivates the adsorption behavior of the magnetic carbon foam. These results imply that the adsorption efficiency of the as-prepared magnetic carbon foam for RhB could no longer significantly increase by simply increasing the dosage of the adsorbent when a threshold value reaches. However, this adsorption capacity of as-synthesized magnetic carbon foam to RhB is larger than many other carbon-based adsorbents reported previously [24,25,26,27,28]. As shown in Figure 5D, when the amount of the adsorbent is between 9 mg and 19 mg, increasing the adsorbent dosage can effectively improve the adsorption efficiency from 86.15% to 98.86%. Then, by further increasing the adsorbent dosage, the improvement of the adsorption efficiency is not obvious. Based on this, the appropriate amount of the magnetic carbon foam should be selected according to the practical request of the adsorption efficiency.

3.2.2. Adsorption Kinetics

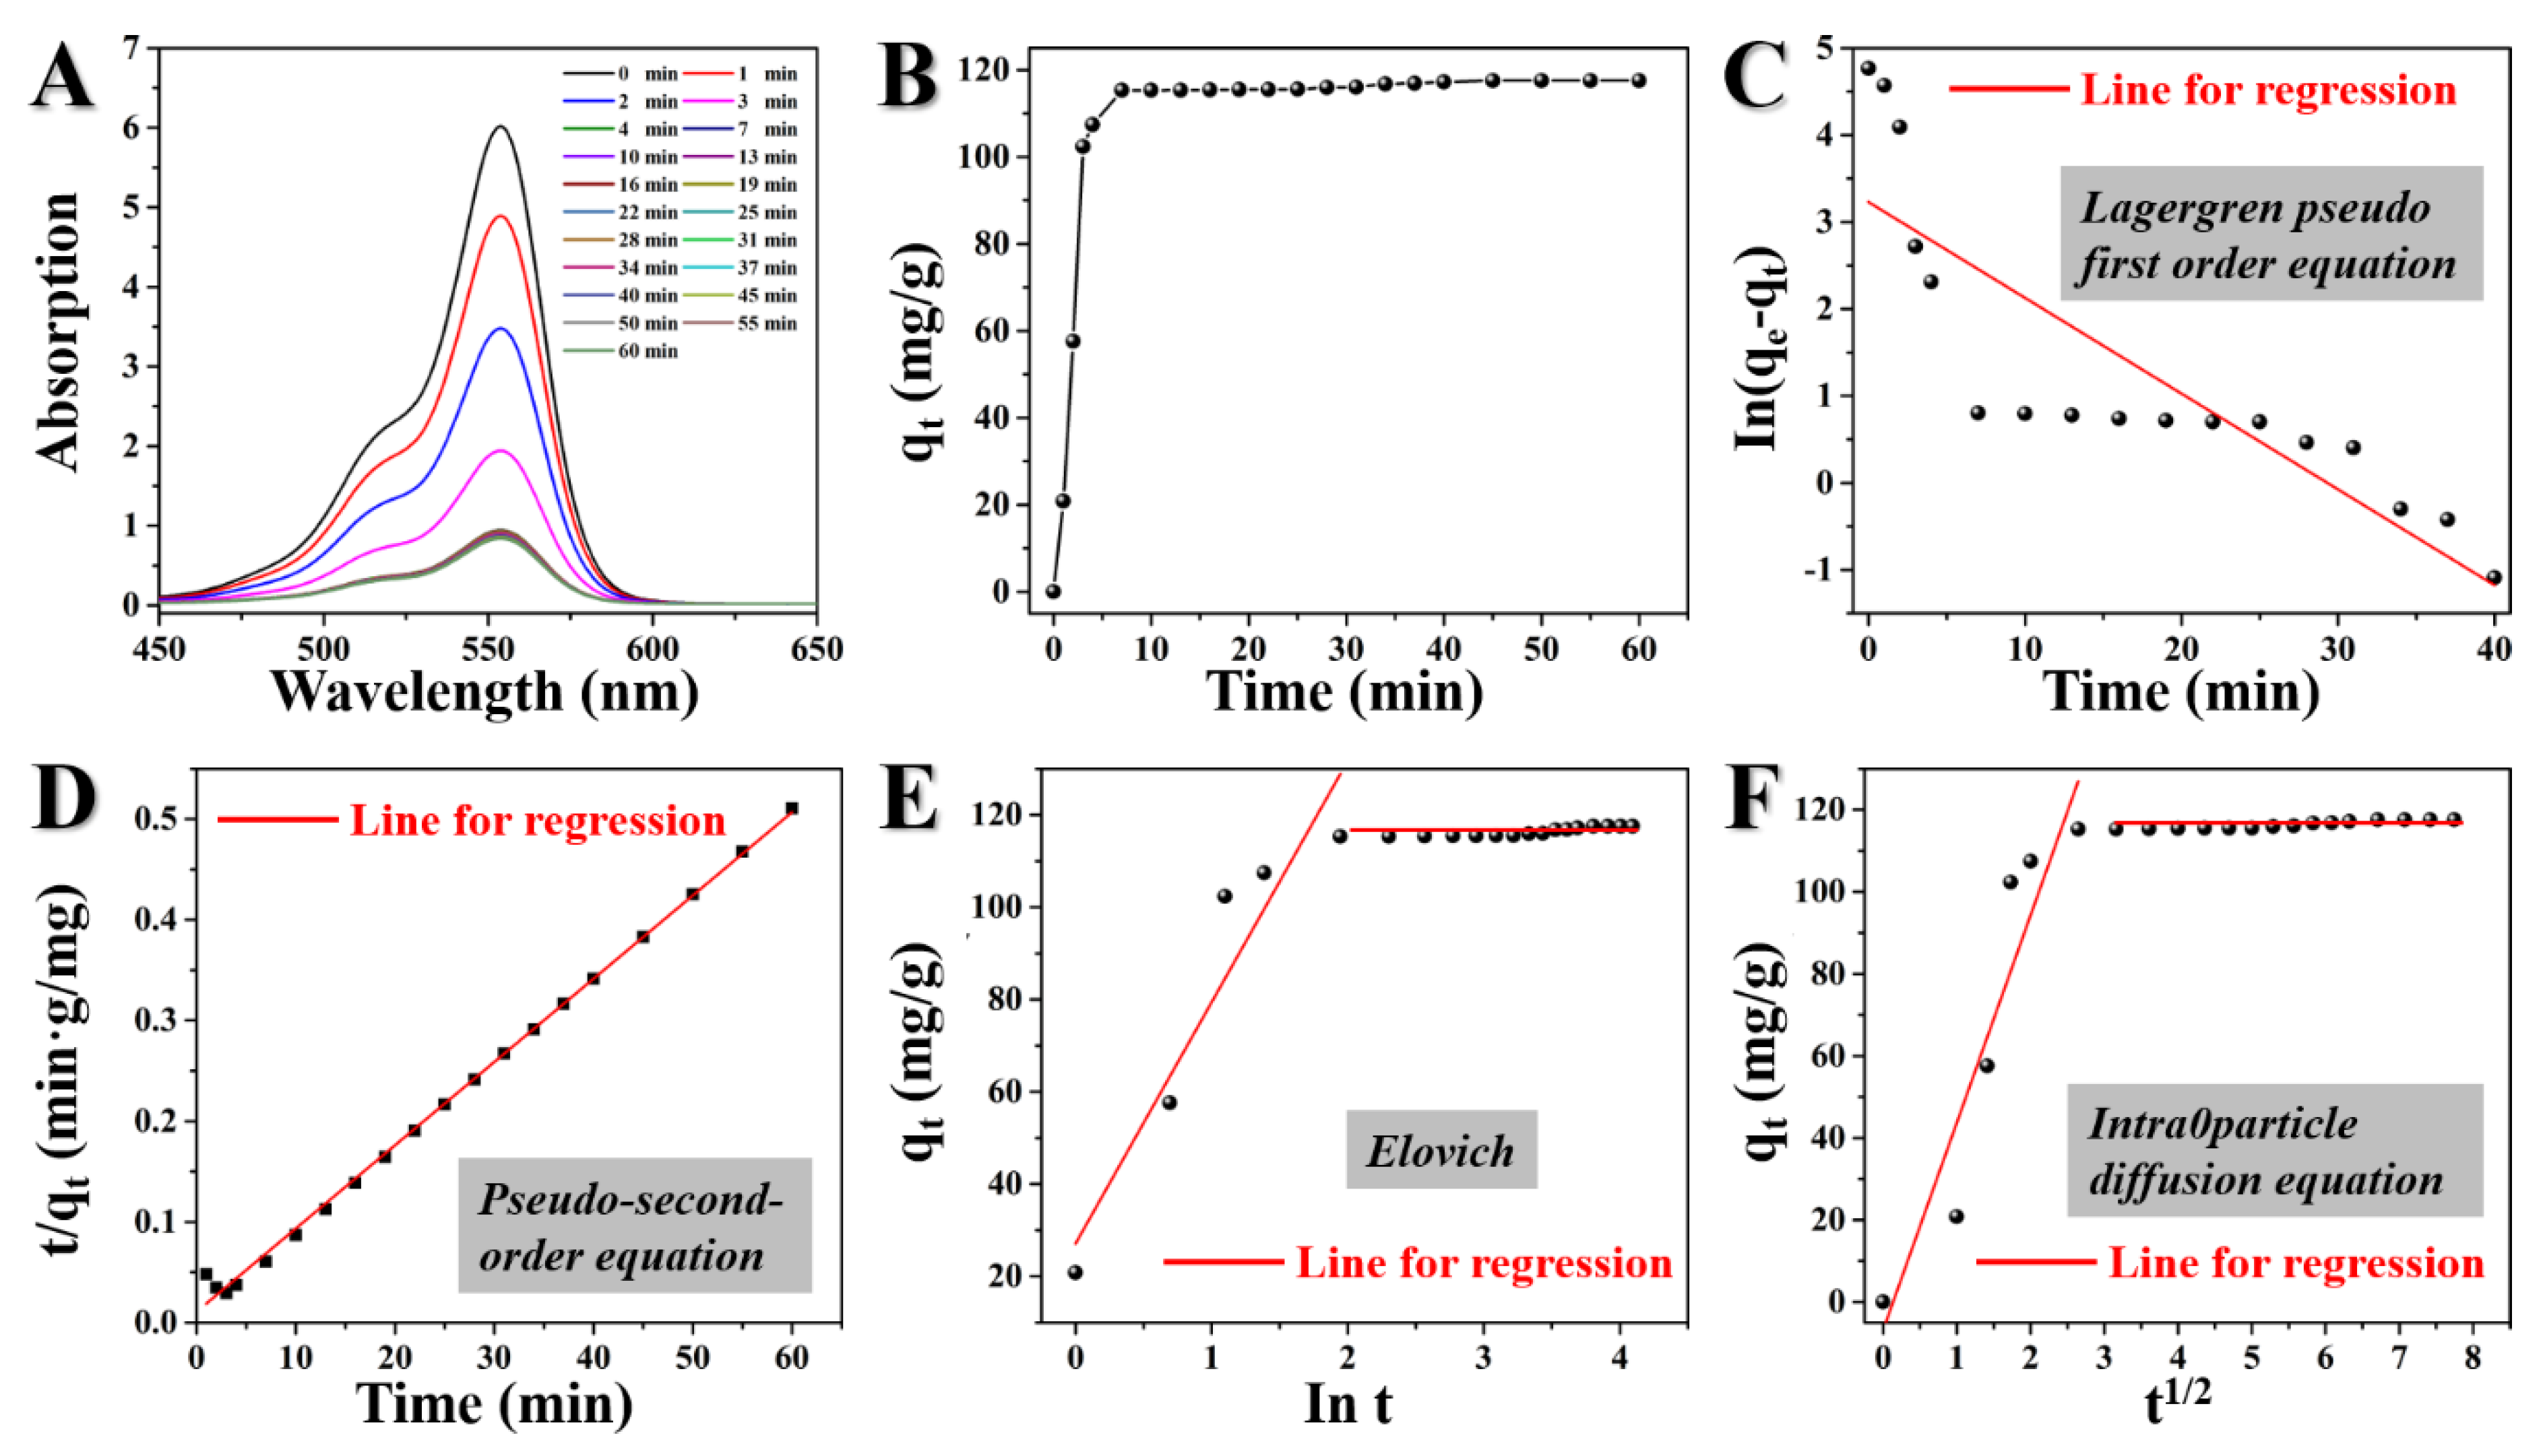
Firstly, experimental tests were carried out to investigate the effect of contact time on the RhB adsorption capacity of the magnetic carbon foam and the corresponding required equilibrium time, as shown in Figure 6A,B. We may see from Figure 6A that the optical density of RhB solution at 554 nm decreases with the increase of incubation time of magnetic carbon foam in the RhB solution. The corresponding adsorption capacity of the magnetic carbon foam at different incubation time increases with the increase of time in Figure 6B, following the adsorption processes including two phases: a violent adsorption process from 0 min to 7 min, followed by a much more moderate adsorption process until equilibrium. Equilibrium was established within 40 min. The rapid adsorption indicates that the adsorption of RhB by magnetic carbon foam takes place following a single step.
Then, four models were introduced to fit the experimental data to evaluate the adsorption kinetics of RhB onto magnetic carbon foam as shown in Figure 6C–F. Corresponding calculated results are listed in Table 1. According to pseudo-first order kinetics in (1) in Table 1, as shown in Table 1 [29], the adsorption interaction rate constant ( k 1 ) is dependent on the slope of the simulated linear line, where q t and q e correspond to the adsorbed amounts of RhB per unit mass of adsorbent at any time ( t ) and at equilibrium, respectively. The linear fitting equation is y = 0.11 x + 3.23 , where y represents ln ( q e q t ) and x represents t. According to the calculated parameters listed in Table 1 and the linear regression presented in Figure 6C, the experimental plots show poor linearity with a correlation coefficient (R2) value of only 0.715. As we know, there should be a deviation between the experimental value and the corresponding theoretical data when R2 is less than 0.99. Besides, the calculated q e according to the intercept of the fitting equation ( l n ( q e ) ) is 25.274 mg/g, which is far from the experimental value of 117.527 mg/g. Thus, the adsorption process of RhB on magnetic carbon foam does not follow pseudo-first order kinetics.
As we know, if the adsorption rate is with respect to the availability of adsorption sites on the adsorbent surface rather than adsorbate concentration in bulk solution, pseudo-second order kinetics should be applicable. The corresponding second-order equation is shown as in (2) in Table 1, where k 2 and h are the second order rate constant and the initial adsorption rate, respectively [30]. The linear fitting equation is y = 0.00827 x + 0.0106 , where x represents t and y represents t/ q t . The calculated plots displayed in Figure 6D and the corresponding calculated values of k 2 , h , and R 2 are listed in Table 1. Being compared with a pseudo-first order kinetic model, the R2 value obtained was 0.997, which is much closer to unity. Furthermore, the calculated q e according to the slope of the fitting equation (1/ q e ) was 120.92 mg/g, which is close to the experimental value. These results imply that the overall rate of the basic RhB adsorption behavior of magnetic carbon foam is controlled by the chemical process in accordance with the pseudo-second-order reaction mechanism. According to the Raman results in Figure 4B, the increase of defects or edge-bonded graphite-like structures as well as the high specific surface area as proved in Figure 4C make the carbon atoms in corresponding defect sites active, which is easy to oxidize in air, introducing more hydroxyl groups in humid environments. These hydroxyl groups can provide negative charge and absorb positive RhB through electrostatic reactions [31]. At the same time, the existence of these hydroxyl groups can form hydrogen bonds with the oxygen-containing groups in the molecular structure of RhB, thus further strengthening the binding between the adsorbent and dye waste [32].
The elovich equation given by (3) in Table 1 was used to explore the activation energy changing possibility during the adsorption reaction, where α and β are the adsorption and desorption rate constant, respectively [33]. According to (3) in Table 1, both parameters can be calculated by the slope value and intercept value of the simulation results as shown in Figure 6E. It is obvious in Figure 6E that the red linear fitting line for the first rapid adsorption step shows a good linear relationship with the data plots and the R2 value is much higher than that of pseudo-first order kinetics. Based on this, RhB molecules are supposed to be adsorbed strongly on the adsorption sites of the magnetic carbon foam by chemisorptive bonds.
As we know, the nature of the rate-limiting step in a batch system is normally dependent on the natural properties of the adsorbate and adsorbent. The adsorption process can be investigated according to the intra-particle diffusion kinetics model when the uptake of the absorbate varies with the incubation time and thus, intra-particle diffusion should be the rate-controlling factor [34]. According to (4) in Table 1, the linear fitting regression is presented in Figure 6F. Formula C, which corresponds to the intercept of the linear fitting curve, is supposed to be a constant which provides information about the boundary layer thickness. However, according to Table 1 and Figure 6F, the fitting curve is observed to possess a negative intercept, indicating that the intra-particle diffusion is not the predominant mechanism for the adsorption processes.

3.2.3. pH Effect on the Adsorption of RhB

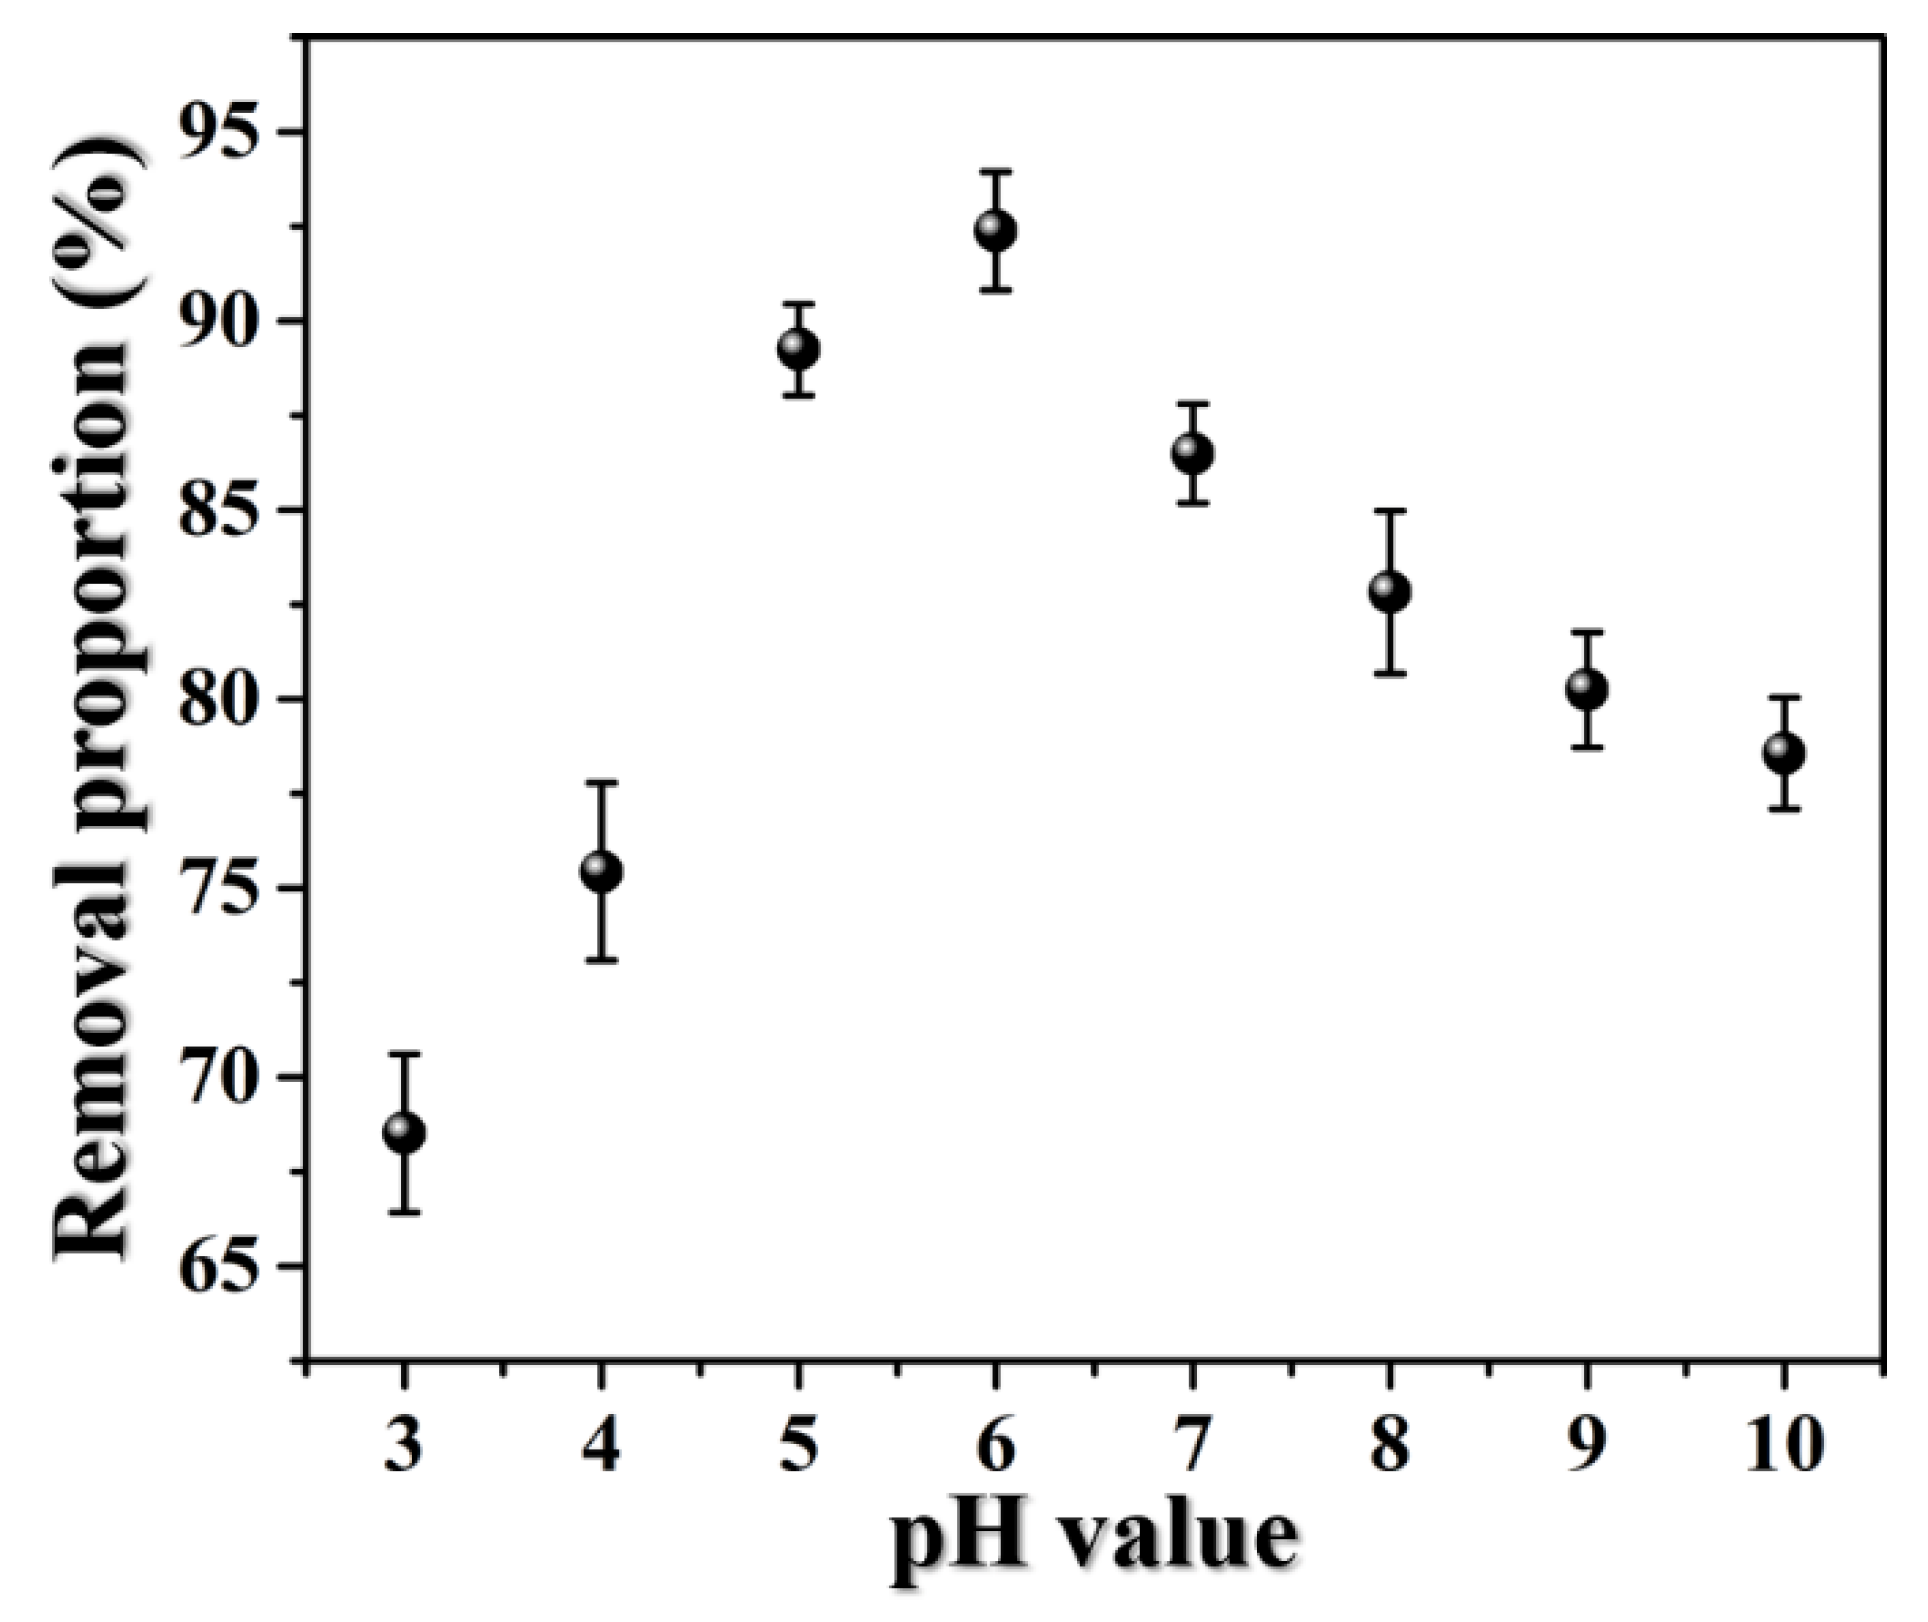
According to the molecular structure of RhB shown in Figure 5A, RhB has a dual nature and can exhibit as properties of a cationic dye and as properties of anionic dye which are pH-dependent. Batch experiments were carried out at different pH values, which varied from 3 to 10, for the purpose of investigating the pH effect on RhB adsorption onto magnetic carbon foam. The results are shown in Figure 7. It is obvious that RhB removal proportion increases from 68.51% to 92.37% with the increase of pH value from 3 to 6. This phenomenon is attributed to the presence of large numbers of hydrogen ions in the mixture at lower pH, which compete with the positive RhB cations to adsorb on the magnetic carbon foam. Then, the removal proportion decreases with the further decrease of pH values from 6 to 10. This is attributed to the decrease of the electrostatic force between the deprotonated RhB cations induced by the increasing hydroxide ions and the magnetic carbon foam. However, it is worth noting that the decreasing extent of the removal proportion with the increase of pH (~13.18%) is less than that with the decrease of pH value (~23.86%). This can be explained as the more hydroxide ions that form on the surface of magnetic carbon foams in alkaline environments, the more electrostatic repulsion, which leads to better dispersion of adsorbent, thus inhibiting further reduction of removal proportion.

4. Conclusions

In this study, a novel phenolic foam-derived magnetic carbon foam was synthesized by in-situ pyrolysis of iron acetylacetonate (Fe(acac)3) containing phenolic resin and was treated as an adsorbent for the removal of Rhodamine B from effluent. The SEM, XRD, and XPS results prove that the magnetic carbon foam consists of a CFe15.1/C matrix modified with α-Fe/Fe3C/Fe2O3 composites, possessing a 3D porous architecture formed by inter-connected cells with diameters of 50-200 μm and narrow ligaments with thicknesses of ~20 μm. The magnetic porous carbon adsorbent could respond quickly to the external magnetic field as it was conducive to the separation of the adsorbent. The equilibrium was established in 40 min with a maximum adsorption capacity of 258.03 mg/g, indicating the as-prepared magnetic carbon foam possesses excellent adsorption efficiency. The corresponding adsorption trend follows the pseudo-second order kinetics model. Besides, the adsorption behavior is pH-dependent. These experimental results indicate that synthesized magnetic carbon foam has great prospects in wastewater adsorption treatment.

Author Contributions

Y.Z. and Z.L. conceived and designed the experiment and wrote the manuscript. Q.W. and R.L. did all the experiments and analyzed the results. Y.L. supervised the project. All the authors contributed to the general discussion. All authors have read and agreed to the published version of the manuscript.

Funding

This research was funded by “The 13th five year plan” national key research and development plan (2018YFF0214501), the National Natural Science Foundation of China (No. 61601227, 31971740), China Postdoctoral Science Foundation (2017M621598), Nature Science Foundation of Jiangsu Province (BK20160939), Fujian science and technology plan project (2019N3014), Key University Science Research Project of Jiangsu Province (17KJA220004), Priority Academic Program Development of Jiangsu Higher Education Institutions (PAPD), Student Practice Innovation and Training Program of Jiangsu Province (201710298017Z).

Conflicts of Interest

The authors declare no conflict of interest.

References

  1. Kiwaan, H.A.; Atwee, T.M.; Azab, E.A.; El-Bindary, A.A. Photocatalytic degradation of organic dyes in the presence of nanostructured titanium dioxide. J. Mol. Struct. 2020, 1200, 127115. [Google Scholar] [CrossRef]
  2. Li, C.; Lai, K.; Zhang, Y.; Pei, L.; Huang, Y. Use of Surface-enhanced Raman Spectroscopy for the Test of Residuals of Prohibited and Restricted Drugs in Fish Muscle. Acta Chim. Sin. 2013, 71, 221. [Google Scholar] [CrossRef] [Green Version]
  3. Yagub, M.T.; Sen, T.K.; Afroze, S.; Ang, H.M. Dye and its removal from aqueous solution by adsorption: A review. Adv. Colloid Interface Sci. 2014, 209, 172–184. [Google Scholar] [CrossRef] [PubMed]
  4. Trojanowicz, M.; Bojanowska-Czajka, A.; Bartosiewicz, I.; Kulisa, K. Advanced Oxidation/Reduction Processes treatment for aqueous perfluorooctanoate (PFOA) and perfluorooctanesulfonate (PFOS)—A review of recent advances. Chem. Eng. J. 2018, 336, 170–199. [Google Scholar] [CrossRef]
  5. Luna Quinto, M.; Khan, S.; Picasso, G.; Taboada Sotomayor, M.D.P. Synthesis, characterization, and evaluation of a selective molecularly imprinted polymer for quantification of the textile dye acid violet 19 in real water samples. J. Hazard. Mater. 2020, 384, 121374. [Google Scholar] [CrossRef]
  6. Soyekwo, F.; Liu, C.; Wen, H.; Hu, Y. Construction of an electroneutral zinc incorporated polymer network nanocomposite membrane with enhanced selectivity for salt/dye separation. Chem. Eng. J. 2020, 380, 122560. [Google Scholar] [CrossRef]
  7. Ding, J.; Pan, Y.; Li, L.; Liu, H.; Zhang, Q.; Gao, G.; Pan, B. Synergetic adsorption and electrochemical classified recycling of Cr(VI) and dyes in synthetic dyeing wastewater. Chem. Eng. J. 2020, 384, 123232. [Google Scholar] [CrossRef]
  8. Liu, F.; Sun, L.; Wan, J.; Shen, L.; Yu, Y.; Hu, L.; Zhou, Y. Performance of different macrophytes in the decontamination of and electricity generation from swine wastewater via an integrated constructed wetland-microbial fuel cell process. J. Environ. Sci. 2020, 89, 252–263. [Google Scholar] [CrossRef]
  9. Naik, A.P.; Mittal, H.; Wadi, V.S.; Sane, L.; Raj, A.; Alhassan, S.M.; Al Alili, A.; Bhosale, S.V.; Morajkar, P.P. Super porous TiO2 photocatalyst: Tailoring the agglomerate porosity into robust structural mesoporosity with enhanced surface area for efficient remediation of azo dye polluted waste water. J. Environ. Manag. 2020, 258, 110029. [Google Scholar] [CrossRef]
  10. Siyal, A.A.; Shamsuddin, M.R.; Khan, M.I.; Rabat, N.E.; Zulfiqar, M.; Man, Z.; Siame, J.; Azizli, K.A. A review on geopolymers as emerging materials for the adsorption of heavy metals and dyes. J. Environ. Manag. 2018, 224, 327–339. [Google Scholar] [CrossRef]
  11. Hasanzadeh, M.; Simchi, A.; Shahriyari Far, H. Nanoporous composites of activated carbon-metal organic frameworks for organic dye adsorption: Synthesis, adsorption mechanism and kinetics studies. J. Ind. Eng. Chem. 2020, 81, 405–414. [Google Scholar] [CrossRef]
  12. Qi, C.; Xu, L.; Zhang, M.; Zhang, M. Fabrication and application of hierarchical porous carbon for the adsorption of bulky dyes. Microporous Mesoporous Mater. 2019, 290, 109651. [Google Scholar] [CrossRef]
  13. Lou, Z.; Yuan, C.; Zhang, Y.; Li, Y.; Cai, J.; Yang, L.; Wang, W.; Han, H.; Zou, J. Synthesis of porous carbon matrix with inlaid Fe3C/Fe3O4 micro-particles as an effective electromagnetic wave absorber from natural wood shavings. J. Alloys Compd. 2019, 775, 800–809. [Google Scholar] [CrossRef]
  14. Lv, Z.; Wang, H.; Chen, C.; Yang, S.; Chen, L.; Alsaedi, A.; Hayat, T. Enhanced removal of uranium(VI) from aqueous solution by a novel Mg-MOF-74-derived porous MgO/carbon adsorbent. J. Colloid Interface Sci. 2019, 537, A1–A10. [Google Scholar] [CrossRef]
  15. Lou, Z.; Li, R.; Wang, P.; Zhang, Y.; Chen, B.; Huang, C.; Wang, C.; Han, H.; Li, Y. Phenolic foam-derived magnetic carbon foams (MCFs) with tunable electromagnetic wave absorption behavior. Chem. Eng. J. 2019, 123571. [Google Scholar] [CrossRef]
  16. Jiang, W.-J.; Gu, L.; Li, L.; Zhang, Y.; Zhang, X.; Zhang, L.-J.; Wang, J.-Q.; Hu, J.-S.; Wei, Z.; Wan, L.-J. Understanding the High Activity of Fe–N–C Electrocatalysts in Oxygen Reduction: Fe/Fe3C Nanoparticles Boost the Activity of Fe–Nx. J. Am. Chem. Soc. 2016, 138, 3570–3578. [Google Scholar] [CrossRef]
  17. Bing, J.; Hu, C.; Nie, Y.; Yang, M.; Qu, J. Mechanism of Catalytic Ozonation in Fe2O3/Al2O3@SBA-15 Aqueous Suspension for Destruction of Ibuprofen. Environ. Sci. Technol. 2015, 49, 1690–1697. [Google Scholar] [CrossRef] [PubMed]
  18. Zhong, R.-S.; Qin, Y.-H.; Niu, D.-F.; Tian, J.-W.; Zhang, X.-S.; Zhou, X.-G.; Sun, S.-G.; Yuan, W.-K. Effect of carbon nanofiber surface functional groups on oxygen reduction in alkaline solution. J. Power Sources 2013, 225, 192–199. [Google Scholar] [CrossRef]
  19. Edwards, E.R.; Antunes, E.F.; Botelho, E.C.; Baldan, M.R.; Corat, E.J. Evaluation of residual iron in carbon nanotubes purified by acid treatments. Appl. Surf. Sci. 2011, 258, 641–648. [Google Scholar] [CrossRef] [Green Version]
  20. Ismail, H.M.; Cadenhead, D.A.; Zaki, M.I. Surface Reactivity of Iron Oxide Pigmentary Powders toward Atmospheric Components: XPS and Gravimetry of Oxygen and Water Vapor Adsorption. J. Colloid Interface Sci. 1996, 183, 320–328. [Google Scholar] [CrossRef]
  21. Liu, B.; Yao, H.; Daniels, R.A.; Song, W.; Zheng, H.; Jin, L.; Suib, S.L.; He, J. A facile synthesis of Fe3C@mesoporous carbon nitride nanospheres with superior electrocatalytic activity. Nanoscale 2016, 8, 5441–5445. [Google Scholar] [CrossRef] [PubMed]
  22. Xie, J.; Yan, C.; Zhang, Y.; Gu, N. Shape Evolution of “Multibranched” Mn–Zn Ferrite Nanostructures with High Performance: A Transformation of Nanocrystals into Nanoclusters. Chem. Mater. 2013, 25, 3702–3709. [Google Scholar] [CrossRef]
  23. Shao, Y.; Guizani, C.; Grosseau, P.; Chaussy, D.; Beneventi, D. Biocarbons from microfibrillated cellulose/lignosulfonate precursors: A study of electrical conductivity development during slow pyrolysis. Carbon 2018, 129, 357–366. [Google Scholar] [CrossRef]
  24. Han, J.; Jun, B.-M.; Heo, J.; Lee, G.; Yoon, Y.; Park, C.M. Highly efficient organic dye removal from waters by magnetically recoverable La2O2CO3/ZnFe2O4-reduced graphene oxide nanohybrid. Ceram. Int. 2019, 45, 19247–19256. [Google Scholar] [CrossRef]
  25. Zhang, Y.; Li, K.; Liao, J. Facile synthesis of reduced-graphene-oxide/rare-earth-metal-oxide aerogels as a highly efficient adsorbent for Rhodamine-B. Appl. Surf. Sci. 2020, 504, 144377. [Google Scholar] [CrossRef]
  26. Navarathna, C.M.; Dewage, N.B.; Karunanayake, A.G.; Farmer, E.L.; Perez, F.; Hassan, E.B.; Mlsna, T.E.; Pittman, C.U. Rhodamine B Adsorptive Removal and Photocatalytic Degradation on MIL-53-Fe MOF/Magnetic Magnetite/Biochar Composites. J. Inorg. Organomet. Polym. 2020, 30, 214–229. [Google Scholar] [CrossRef]
  27. Li, Y.; Yin, X.; Huang, X.; Tian, J.; Wu, W.; Liu, X. The novel and facile preparation of 2DMoS2@C composites for dye adsorption application. Appl. Surf. Sci. 2019, 495, 143626. [Google Scholar] [CrossRef]
  28. Li, Y.; Yan, X.; Hu, X.; Feng, R.; Zhou, M. Trace pyrolyzed ZIF-67 loaded activated carbon pellets for enhanced adsorption and catalytic degradation of Rhodamine B in water. Chem. Eng. J. 2019, 375, 122003. [Google Scholar] [CrossRef]
  29. Ma, Y.-X.; Li, X.; Shao, W.-J.; Kou, Y.-L.; Yang, H.-P.; Zhang, D.-J. Fabrication of 3D Porous Polyvinyl Alcohol/Sodium Alginate/Graphene Oxide Spherical Composites for the Adsorption of Methylene Blue. J. Nanosci. Nanotechnol. 2020, 20, 2205–2213. [Google Scholar] [CrossRef]
  30. Zhang, B.-L.; Qiu, W.; Wang, P.-P.; Liu, Y.-L.; Zou, J.; Wang, L.; Ma, J. Mechanism study about the adsorption of Pb(II) and Cd(II) with iron-trimesic metal-organic frameworks. Chem. Eng. J. 2020, 385, 123507. [Google Scholar] [CrossRef]
  31. Lu, Y.; Sun, Q.F.; Li, J.; Liu, Y.X. Fabrication, Characterization and Photocatalytic Activity of TiO2/Cellulose Composite Aerogel. KEM 2014, 609–610, 542–546. [Google Scholar] [CrossRef]
  32. Vargas, A.M.M.; Cazetta, A.L.; Kunita, M.H.; Silva, T.L.; Almeida, V.C. Adsorption of methylene blue on activated carbon produced from flamboyant pods (Delonix regia): Study of adsorption isotherms and kinetic models. Chem. Eng. J. 2011, 168, 722–730. [Google Scholar] [CrossRef]
  33. Wang, W.; Huang, G.; An, C.; Zhao, S.; Chen, X.; Zhang, P. Adsorption of anionic azo dyes from aqueous solution on cationic gemini surfactant-modified flax shives: Synchrotron infrared, optimization and modeling studies. J. Clean. Prod. 2018, 172, 1986–1997. [Google Scholar] [CrossRef]
  34. Tanhaei, B.; Ayati, A.; Lahtinen, M.; Sillanpää, M. Preparation and characterization of a novel chitosan/Al2O3/magnetite nanoparticles composite adsorbent for kinetic, thermodynamic and isotherm studies of Methyl Orange adsorption. Chem. Eng. J. 2015, 259, 1–10. [Google Scholar] [CrossRef]
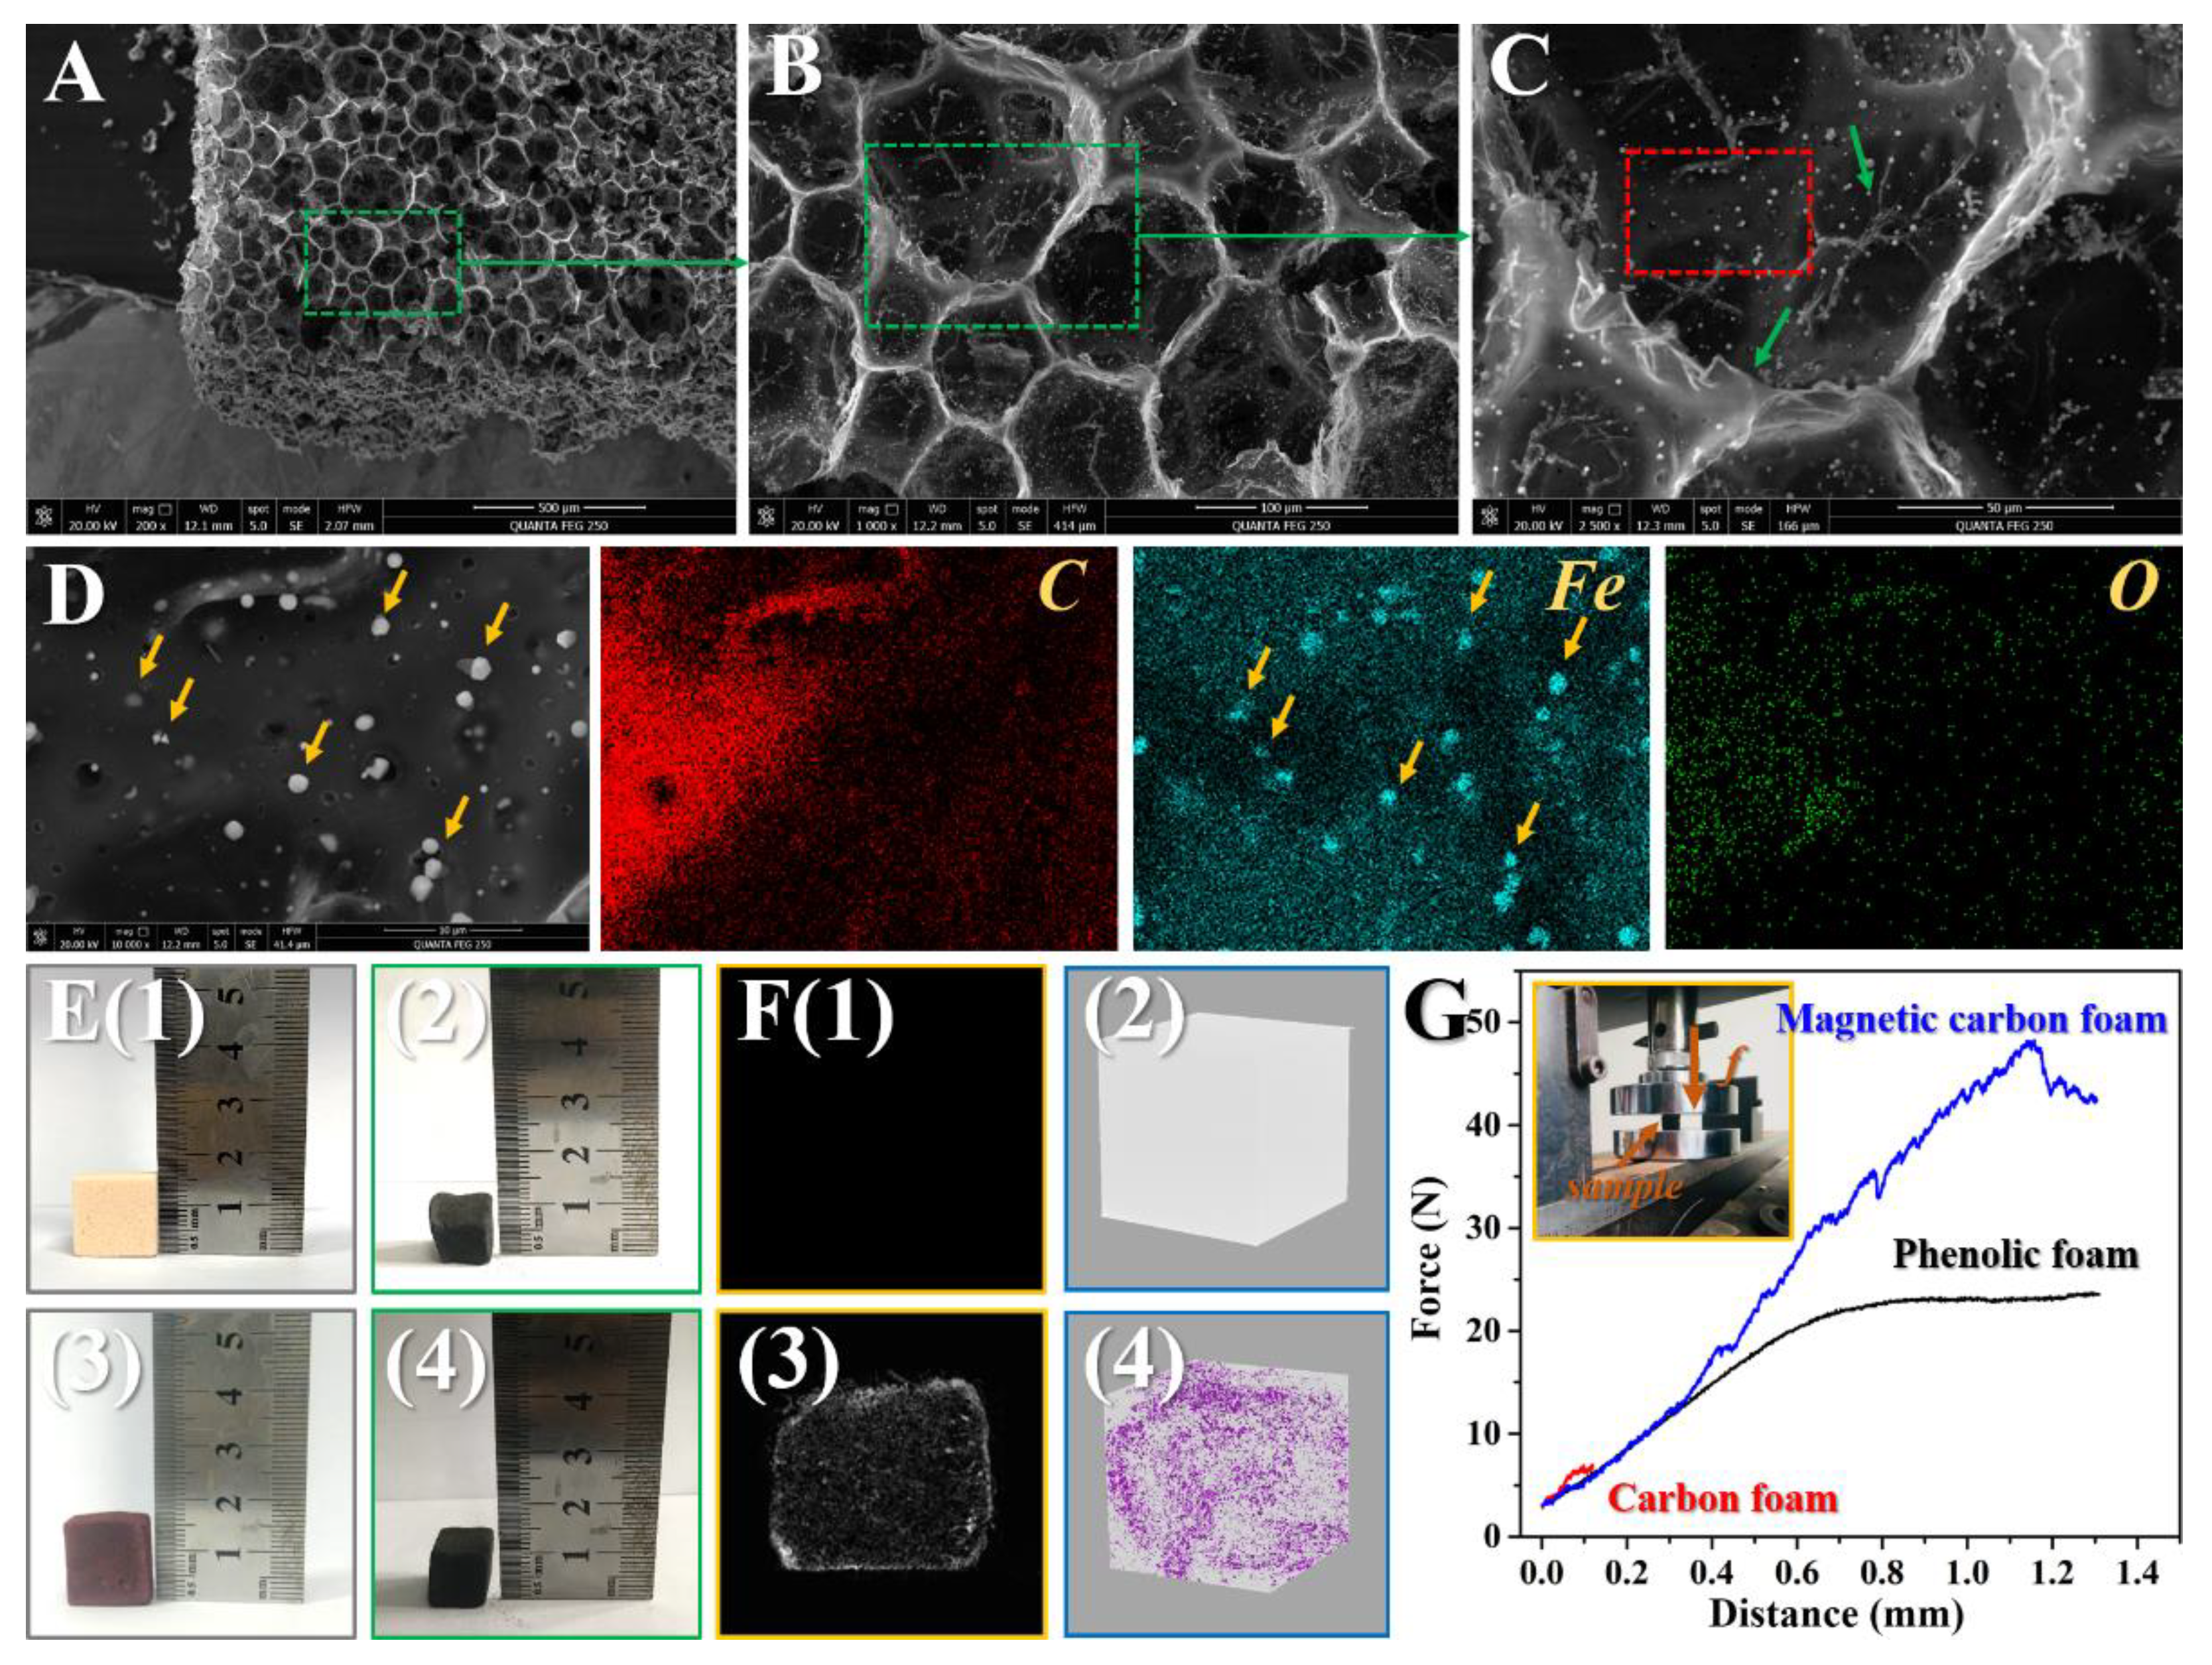
Figure 1. (A–C) The SEM micrographs of the magnetic carbon foam with different magnifications. (D) The corresponding EDS mapping images of the red-dashed squared area in Figure 1C. (E) Representative images of phenolic resin foam (1), carbon foam (2), phenolic resin foam containing Fe(acac)3 (3), and magnetic carbon foam (4). (F) Cross-sectional and 3D reconstructional micro-CT imaging results of carbon foam (1 and 2) and magnetic carbon foam (3 and 4), respectively. (G) Compressive strength testing results of phenolic resin foam (black), carbon foam (red), and magnetic carbon foam (blue).
Crystals 10 00159 g001
Figure 2. XRD curve of magnetic carbon foam.
Crystals 10 00159 g002
Figure 3. (A) Total XPS spectra for phenolic resin foam, carbon foam, and magnetic carbon foam. (B–D) High-resolution XPS spectra of C1s, O1s, and Fe2P for phenolic resin foam, carbon foam, and magnetic carbon foam, respectively.
Crystals 10 00159 g003
Figure 4. (A) FT-IR curves of phenolic resin foam (black), carbon foam (red), and magnetic carbon foam (blue), respectively. (B) Raman curves of phenolic resin foam, carbon foam, and magnetic carbon foam, respectively. (C) The five-point BET surface area analysis for magnetic carbon foam. (D) VSM curve of magnetic carbon foam. Insert: Mixed solution of RhB and magnetic carbon foam before and after 10 min magnetic separation.
Crystals 10 00159 g004
Figure 5. (A) The UV-vis spectroscopy adsorption results of RhB solutions with concentrations of 1, 3, 6, 9, 12, and 15 mg/L and the inserted RhB molecular structure. (B) The plots and corresponding fitting curve of the optical density of RhB solution at 554 nm vs concentrations. (C) The UV-vis spectroscopy adsorption results of RhB solutions treated with different dosages of magnetic carbon foam. (D) The removal proportion and the adsorption capacity of magnetic carbon foam.
Crystals 10 00159 g005
Figure 6. (A) Successive UV-vis spectra of the remaining RhB in the solution after being treated with magnetic carbon foam at different time intervals. (B) The kinetic data for RhB adsorption by magnetic carbon foam. (C–F) Fitting of Lagergren pseudo-first order, pseudo-second order, Elovich, and intra-particle diffusion kinetic models for RhB adsorption on magnetic carbon foam.
Crystals 10 00159 g006
Figure 7. Effect of pH on the adsorption of RhB by magnetic carbon foam.
Crystals 10 00159 g007
Table 1. Mathematical equations in RhB adsorption kinetics and kinetic parameters of various models fitted to experimental data.
Rhodamine B C0(mg/L): 100, qe(exp.) (mg/g): 117.527
Kinetic Models and ParametersLagergren pseudo-first order equation: ln(qe − qt) = lnqe − k1t (1)
k1 (min−1): 0.110 R2: 0.715
Pseudo-second-order: t/qt = 1/k2qe2 + t/qe , h = k2qe2 (2)
k2 (g·mg−1·min−1): 0.00643h (mg·g−1·min−1): 94.073R2: 0.997
Elovich: qt = 1/β·ln(αβ) + 1/β ln(t) (3)
α (mg·g−1·min2): 87.933β (g·mg−1·min): 0.0191R2: 0.870
Intra-particle diffusion equation: qt = k3·t1/2 + C (4)
k3 (mg·g−1·min−1/2): 50.574C: −6.857R2: 0.854