Review

Reaction Initiation in Enzyme Crystals by Diffusion of Substrate

Physics Department, University of Wisconsin-Milwaukee, Milwaukee, WI 53211, USA
Crystals 2020, 10(2), 116; https://doi.org/10.3390/cryst10020116
Submission received: 9 January 2020 / Revised: 4 February 2020 / Accepted: 7 February 2020 / Published: 13 February 2020
(This article belongs to the Special Issue Macromolecular Serial Crystallography)

Abstract

:
Ever since the first structure of an enzyme, lysozyme, was solved, scientists have been eager to explore how these molecules perform their catalytic function. There has been an overwhelmingly large body of publications that report the X-ray structures of enzymes determined after substrate and ligand binding. None of them truly show the structures of an enzyme working freely through a sequence of events that range from the formation of the enzyme–substrate complex to the dissociation of the product. The technical difficulties were too severe. By 1969, Sluyterman and de Graaf had pointed out that there might be a way to start a reaction in an enzyme crystal by diffusion and following its catalytic cycle in its entirety with crystallographic methods. The crystal only has to be thin enough so that the diffusion is not rate limiting. Of course, the key questions are as follows: How thin should the crystal be? Will the existing X-ray sources be able to collect data from a thin enough crystal fast enough? This review shines light on these questions.

1. Introduction

Although ordered in three dimensions, protein crystals appear soft and sometimes gel-like [1,2]. Unlike crystals of small molecules such as sugars, protein crystals display large, mostly water-filled pores that permit the diffusion of chemical compounds through the crystal lattice [3]. The soaking of protein crystals with heavy atom compounds, for example, has been extensively used to solve the phase problem in protein crystallography [1,4]. Enzymes are proteins with catalytic activity. The first X-ray structure of an enzyme was solved in 1965 [5]. However, X-ray structures are static and do not reveal how enzymes perform their function. It was pointed out very early on [6] that an enzymatic reaction may be initiated by the diffusion of a substrate. If the crystals are very small or very thin, diffusion might be much faster than the enzymatic cycle, meaning that it can be triggered by simply mixing the substrate with the crystals [6,7,8]. If reaction initiation through diffusion works, enzyme catalysis can then be observed “on-the-fly”, unperturbed, at room temperature and in real time by time-resolved crystallographic methods [7,9,10]. This provides an easy, straightforward way to structurally and kinetically analyze all kinds of enzymatic reactions [8] by preserving, and even exploiting, the dynamics of the molecular ensemble in the crystal.

2. Diffusion into Protein Crystals

Diffusion is governed by Fick’s 1st and 2nd laws. The 2nd law is a partial second order differential equation of the form
D 2 C = C t ,
where C is the time and space dependent concentrations in a volume, D the diffusion coefficient, and 2 the Laplace operator (divergence of the gradient) in a 3D space. This differential equation has solutions for certain boundary conditions. Fortunately, a solution exists for shoe-box-shaped objects like crystals with half edge length a, b, and c [11]:
C ( x , y , z , t ) = C 0 [ 1 64 π 3 l = 0 m = 0 n = 0 ( 1 ) l + m + n ( 2 l + 1 ) ( 2 m + 1 ) ( 2 n + 1 ) × cos ( 2 l + 1 ) π x 2 a cos ( 2 m + 1 ) π y 2 b cos ( 2 n + 1 ) π z 2 c × exp D π 2 4 [ ( 2 l + 1 ) 2 a 2 + ( 2 m + 1 ) 2 b 2 + ( 2 n + 1 ) 2 c 2 ] · t ]
The coefficients l, m, and n are integer numbers. Equation (2) looks complicated but can be easily coded in a computer program. It is evident that concentration C at position x,y,z and at time t within the shoe-box-shaped crystal is dependent on the initial outside concentration C0, on the position in the crystal, and on a time dependent exponential term. The term in the exponent D π 2 4 [ ( 2 l + 1 ) 2 a 2 + ( 2 m + 1 ) 2 b 2 + ( 2 n + 1 ) 2 c 2 ] merits special attention. It is a relaxation rate with units 1/s. The inverse of it is a characteristic time τc, also called the diffusion time. Obviously, the smaller the crystal half edge lengths a, b, and c are, the shorter τc is. Since it is a quadratic relationship, making the crystal smaller dramatically decreases the diffusion time. In addition, increasing the diffusion coefficient D decreases the diffusion time proportionally. Figure 1 shows a plot of concentrations in a cross section through the middle of a crystal with 5 μm edge lengths (2.5 μm half edge lengths) using the diffusion coefficient 2.3 × 10⁻⁶ cm/s of a larger ligand molecule, the antibiotic ceftriaxone, in water. As one can see, the approximate diffusion time to reach half the outside ligand concentration in the middle of the crystal is only about 5 ms. In rapid mixing experiments, one molecule of ligand per enzyme active site is required for optimum reaction initiation and must be delivered into the crystal by diffusion. This 1:1 ratio of catalytic clefts to substrate is called a stoichiometric concentration (StC). StC is the minimum concentration required to establish an essentially full occupancy of the ligand in the catalytic cleft under optimal conditions, in which the rate coefficients for substrate binding and dissociation strongly favor the formation of the enzyme–substrate complex. A high occupancy results in strong, easily interpretable ligand electron density in the catalytic cleft. The protein concentration in crystals can be quite large, on the order of 20–25 mmol/L [12] and higher [13,14]. Accordingly, StCs are also rather high in a crystal. However, if the outside ligand concentration C0 is much higher than the enzyme concentration in the crystal, StC is reached much faster than the diffusion time as also suggested by Equation (2). Accordingly, to effectively start a reaction in a crystal by diffusion and to produce a strong electron density signal in the catalytic cleft, (i) the crystal must be as small as possible, (ii) the outside ligand concentration C0 should be as high as possible and (iii) the diffusion coefficient should be as large as possible. All of this can be manipulated within limits. To address point (i), crystals with edge lengths in the single digit μm or even smaller need to be prepared. There are a number of methods to achieve this, which were all developed in recent years and subsumed by Beale and colleagues [15]. To reach high ligand concentrations (ii), the ligand needs be as soluble as possible in conditions near the chemical composition of the mother liquor that stabilizes the microcrystals. The ligand can also be provided in a low ionic strength buffer to maximize solubility. Crystals would usually decompose in such a buffer. However, crystal cracking happens, usually during times much longer than the millisecond time scale [12]. If diffusive mixing is complete before the crystal decomposes, and the mixture is measured sufficiently rapidly, such an approach is feasible. In addition, to keep ligand concentrations high, the ligand can be provided in much larger volumes compared to the crystal volume, so that the depletion of the ligand by diffusion into crystals remains small. This may be achieved by mixing the ligand with a much larger flow rate compared to that of the crystal slurry, or by the application of a large droplet containing ligand (see below for both techniques). To promote large diffusion coefficients (iii), large, water-filled channels or pores should be present in the crystal. This is crystal-form dependent, see [12] for an example. The shard crystal form of the β-lactamase used by Olmos and colleagues [12] is much better suited to facilitate fast diffusion than the much more compact needle crystal reported by the same team. However, the ligand was detected in both crystal forms. It appears as if protein dynamics transiently opened and closed channels in the very densely packed needle crystal form, so that effective diffusion was possible despite the restricted pore sizes. It should be mentioned at this point that all-atom molecular dynamics simulations of diffusion into protein crystals are challenging since these simulations require an in-silico representation of a chunk of crystal with a large number enzyme molecules and up to seconds in simulation times. This is still currently outside the scope of even the fastest computers. Accordingly, simplified crystal and protein models need to be employed [16], and diffusion coefficients in protein crystals are merely estimates.

3. X-ray Light Sources and Techniques that Support Mixing Experiments

Since fast reaction initiation by diffusion requires microcrystals, the X-ray light sources need to be powerful enough to generate a diffraction pattern from a crystal that is in the order of 10 μm or smaller. This has not been possible until recently. Originally, the idea of reaction initiation by diffusion was proposed for experiments at the X-ray free electron laser (XFEL) [7,8], but, now, microfocus beamlines at synchrotron light sources have also become sophisticated enough to interrogate tiny crystals. In any case, the rotation of the crystal through the Ewald sphere is only possible when very slow time scales are explored [17]. In all other cases, still exposures are required. Laue crystallography [18,19,20,21] has been used to avoid moving the crystal during X-ray exposure. With this method, the integrated reflection intensity can be collected almost instantaneously during exposure to a fast or ultrafast X-ray pulse [21]. It turns out, however, that the Laue method is very sensitive to crystal mosaicity. Due to the broad bandwidth of the pink X-ray beam, reflections become streaky and data processing is then not possible. In addition, a more empirical observation is that, caused by larger background noise, the spatial resolution in Laue crystallography may be inferior to that reached by monochromatic X-rays. In any case, the Laue method might enjoy a revival with recent successful data collection on microcrystals [22,23]. The advantage is that only a few diffraction patterns (on the order of 100–200) are necessary to cover reciprocal space. In contrast, with monochromatic X-rays, all reflections of a still exposure are partials and reflection intensities are therefore not proportional to the square of the structure factor amplitude. To reconstruct the integrated reflection intensity, 100 or more sightings of individual reflections are required [24] and their intensities averaged. This has been called Monte Carlo averaging, and it requires that tens of thousands of indexable diffraction patterns are collected for an accurate, high resolution dataset [25,26]. In any case, microcrystals are quickly damaged by exposure to X-ray radiation, sometimes even after exposure to only one X-ray pulse. This necessitates the exposure of a large number of fresh crystals to the X-rays. Serial crystallography was born [26,27].
XFELs produce femtosecond (fs) short, spatially coherent, hard X-ray pulses of unprecedented brilliance. The exposure to only one fs X-ray pulse completely damages a crystal [28,29]. Since diffraction is instantaneous, yet the damage requires some time to evolve, femtosecond X-ray pulses from an XFEL produce essentially damage-free diffraction patterns [26,27,29]. This is called the ‘diffraction-before-diffraction’ principle [26,30,31,32]. Already in the first experiments at XFELs [26,27,33], fresh microcrystals were provided and injected into the X-ray interaction volume by a liquid injector called a ‘gas dynamic virtual nozzle’ (GDVN) [34]. The GDVN generates a liquid jet that moves the crystals with a velocity of 10 m/s and faster into the X-ray interaction volume. During a typical 40 fs X-ray pulse from an XFEL, the jet only moves 400 fm (4 × 10⁻³ Å). The crystal is effectively frozen in space and time during X-ray exposure. Subsequently, serial crystallography was also adapted to work at the synchrotron [35,36]. Since X-ray pulses at synchrotrons are less intense than those at the XFEL, exposure to multiple synchrotron radiation pulses are required. When a GDVN is used, crystals move 10 mm across the X-ray beam during a typical 1 ms exposure time [35]. This is unacceptable. Therefore, at a synchrotron the use of a GDVN for mixing experiments is discouraged until technology advances to the point that X-ray diffraction patterns from single X-ray pulses can be analyzed [22,23,37]. Fixed targets (see below), however, could be equally well used at the XFEL and the synchrotron [35,38].
With serial micro-crystallography, the initiation of a reaction by diffusion is easily conceivable since this method automatically provides crystals that are three dimensionally thin, fulfilling the conditions envisioned by the early protein crystallographers. To make reaction initiation by diffusion feasible, a number of approaches are currently pursued: the mix-and-inject technique using a GDVN [8,12,39,40,41], acoustic ligand droplet ejection onto a chip [42] or a moving tape-containing crystals [43], and the ‘fountain pen’ method that also uses a tape drive [44] to transport the microcrystals towards the X-rays. All these techniques mix the ligand with the crystals and they do so reliably and rapidly. The latter two are suited for both XFEL and synchrotron applications. The former requires a mixing device [39,40,45,46,47] that terminates in a modified GDVN, producing a fast liquid jet. This approach should be used at XFELs only unless the devices (perhaps the electrospun injector [48]) that mix into a slowly moving liquid column become available to allow for longer exposure times that are necessary at the synchrotron.

4. Mixing Techniques for Structure-Based Enzymology

4.1. Jet Based Technique

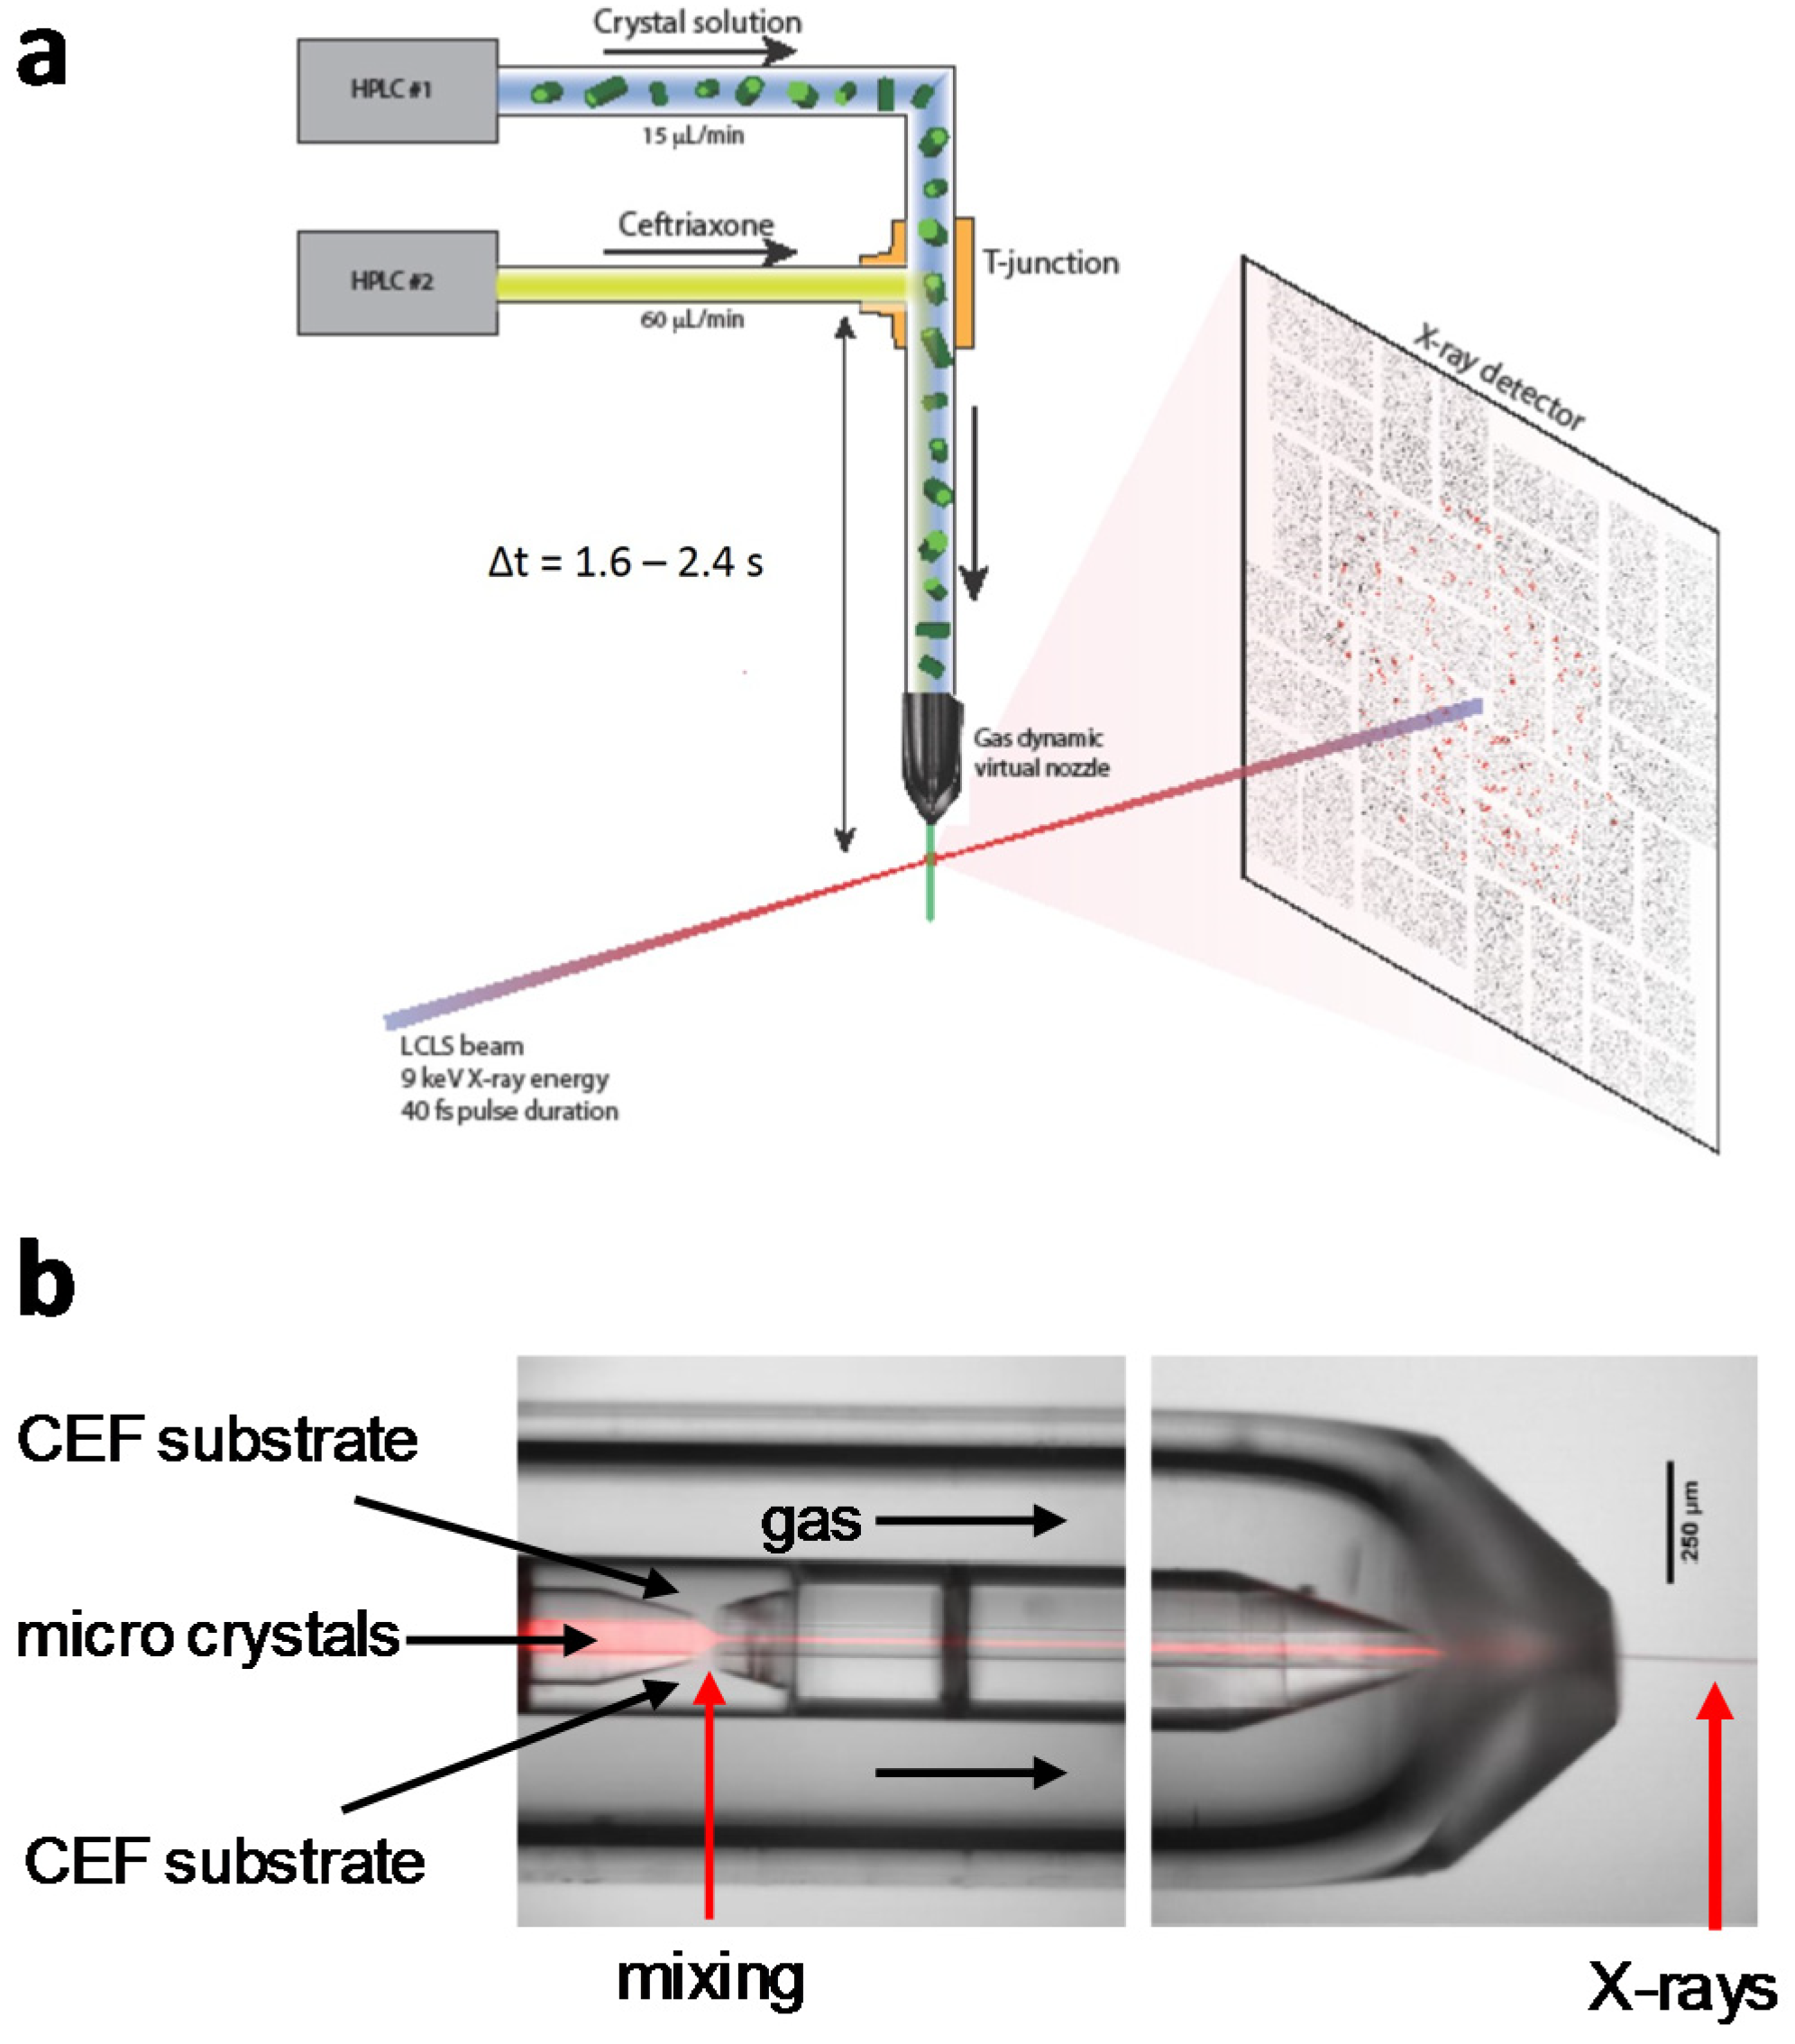
The terms ‘mix-and-inject’ [8] and ‘mix-and-inject serial crystallography’ (MISC) [39] suggest that a slurry of enzyme microcrystals is mixed with substrate, and the mixture is injected after a delay Δt into the X-ray interaction region. Mixing initiates the reaction by the diffusion of the substrate into the microcrystals. The diffusion time, or alternatively the time required for the substrate to reach StC, whichever is faster, determines the time resolution of the method. The time-delay is given by the time the X-rays probe the reacting crystals after mixing. The easiest mixing device is a T-junction installed upstream of an injector device, which is typically a GDVN that injects the mixture into the X-ray interaction region (Figure 2a). Enzyme microcrystals that run straight through the T-junction are mixed with substrate. The delay is determined by the flow rate and the distance of the T-junction from the end of the GDVN nozzle. When installed outside the nozzle rod that supports the GDVN in a vacuum chamber at an XFEL, typical time-delays are seconds [39,40], which is usually too long to investigate the catalytic cycle of enzymes. However, a slower reaction can be observed [40] or the steady state of the enzymes can be structurally probed [39]. Mix-and-inject techniques (in fact, mix- and-diffuse techniques) employing a T-junction way upstream of the nozzle rod were applied to investigate adenine binding to an RNA molecule acting as a riboswitch [40], see, e.g., [49] for a review on riboswitches. The presence of adenine initiates large conformational changes of the riboswitch that even cause unit cell and space group changes. Interestingly, the microcrystals absorb these changes by rearranging without cracking and the conformational changes can be followed on a second time scale. Once the specially designed mixing devices [45,46,47] became available (Figure 2b), millisecond and, in theory, sub-millisecond time-delays can be probed. The mixing device consists of a mixing region where a concentric flow of substrate is rapidly mixed with an enzyme slurry flowing through a central capillary. The time-delay is then provided by a delay line between the location of the mixer and the end of a GDVN-like nozzle that injects the mixture into the X-ray interaction region (Figure 2b). The time-delay is given by the length of the delay line and the flow rates of both substrate and crystal slurry. A mix-and-inject experiment that features single digit millisecond diffusion times to explore an enzymatically catalyzed reaction was recently conducted at the Linac Coherent Light Source (LCLS) [12] using an optimized mixing device produced by Pollack and colleagues [45] and is shown in Figure 2b. Microcrystals of the M. tuberculosis β-lactamase (BlaC) were flown into the mixer and mixed with 200 to 300 mmol/L of the cephalosporin antibiotic ceftriaxone (CEF). The mixture was probed at time-delays of 30, 100, and 500 ms (Figure 3). Previously [39], the steady state was probed using a T-junction upstream of the nozzle rod resulting in a 2 s delay time. Accordingly, a time series that consists of five time-points and spans from the unmixed state to the steady state at 2 s has been obtained. At 30 ms full occupancy of CEF is observed. As the catalytic cleft concentration in the BlaC crystals is about 25 mmol/L, a comparable amount of ligand must have been delivered purely by diffusion (Figure 3a) [12]. Since the turnover time of BLAC is about 1 s, this experiment shows that the mix-and-inject approach works properly and that diffusion is not rate- limiting in this case. After the formation of the enzyme–substrate complex (Figure 3a,b), the β-lactam ring of CEF is then opened at 500 ms, and the now inactive CEF is covalently bound to the catalytic serine (Ser-70) of the BLAC (Figure 3c). For the first time, the unknown structures of the non-covalent enzyme–ceftriaxone complex and an intermediate along the catalytic pathway with a covalently bound open ring cephalosporin is observed by means of the same experimental setup at ambient temperatures and in real time. Fifty years after the early protein crystallographers envisioned such an approach, it became reality, and can now be used to investigate all sorts of enzymatic reactions. MISC seems to be established now as an accepted technique to investigate enzymatic reactions [12,39,41,42].

4.2. Mixing on Fixed Targets

When microcrystals are applied to a thin solid material which is translated into the X-ray interaction volume, they can be conveniently exposed to X-ray pulses [43,44,50,51,52,53,54]. These fixed targets may consist of diverse materials, such as silicon (nitride), graphene, mylar, and more. Fixed targets are designed for serial crystallography, since individual microcrystals are deposited on these substrates and scanned subsequently through the X-ray interaction volume. It is easily conceivable how substrate droplets can be mixed rapidly with the deposited microcrystals, and a catalytic reaction is initiated by diffusion. The substrate might either be applied to the crystals with an acoustic droplet injector [42,43], or mixed as co-flow together with the crystals [44]. Serial crystallography with fixed targets may also be performed in vacuum [50,55] to reduce the scattering background. Bare surfaces harboring properly humidified microcrystals need to be protected from vacuum [55], otherwise the microcrystals dry out rapidly and decompose. However, any vacuum protection might interfere with the mixing process, and, consequently, a mixing experiment in vacuum will require complex technical innovations that are not yet available. Outside the vacuum, the extended exposure of microcrystals to dry air needs to be avoided. The advantage of a fixed target, however, is that its position and orientation can be precisely controlled. This way, it can be used at the XFEL as well as the synchrotron with both monochromatic X-rays [22] as well as with the Laue method [22,23]. With monochromatic X-rays at a synchrotron, the exposure times required to obtain a decent, interpretable diffraction pattern might be milliseconds [35,44], which constrains the time resolution. It must be assessed whether exposure times can be reduced further either by being able to index and analyze a larger number of sparse patterns [56] or by a quick excitation of the entire reflection range by a broader X-ray bandwidth [23]. In any case, to date, larger crystals are required at the synchrotron with correspondingly longer diffusion times that then limit the time resolution in addition to the millisecond exposure times. Certainly, applying enzyme crystals and substrate using either acoustic injection [42,43] or with a fountain pen style mixer [44] to a fast moving tape or to a smooth or patterned surface is an attractive concept and it may provide millisecond time resolution. Recently, a mixing experiment on the enzyme xylose isomerize (XI) on a chip has been performed at the PETRA III storage ring at DESY (Deutsches Elektronen-Synchrotron), Hamburg [42]. The experiments were performed at ambient pressure and at room temperature (20 °C). The somewhat larger crystals (~20 μm edge lengths) were kept moist using a flat nozzle that provided a humidified air stream across the entire chip. Pico-liter droplets of glucose (78 pL, 1 mol/L glucose) were ejected by an acoustic droplet injector onto the crystals. The mixture was subsequently probed by an X-ray exposure [42,57] that lasts milliseconds to accumulate enough diffracted intensity on the detector. The diffusion times were estimated from Equation (2) to be about 30 ms. However, already after 15 ms, strong electron density of glucose was found in the active site of the XI. This is owed to the very high applied ligand concentration that rapidly provides (near) StCs in the crystal. A previously unidentified intermediate with an open glucose ring was found after 60 s. Since the XI’s temperature optimum is higher than 60 °C, the enzyme is quite inactive at 20 °C. Accordingly, no further intermediates could be identified. A high temperature experiment is ultimately desirable to follow glucose isomerization to the end with this enzyme. When the temperature is varied, the barriers of activation of an enzymatically catalyzed reaction can be determined as demonstrated for a photoreceptor [14]. This would then provide a complete view of an enzymatically catalyzed reaction, which will go far beyond the approach envisioned 50 years ago by the early crystallographers. In summary, reaction initiation by diffusion works at synchrotrons and XFELs. Since, at XFELs, very small crystals can be probed, diffusion times may be appropriately fast (see Equation (2)), and initial phases of fast enzymatic reactions may be probed only there.

5. High Repetition Rate XFELs

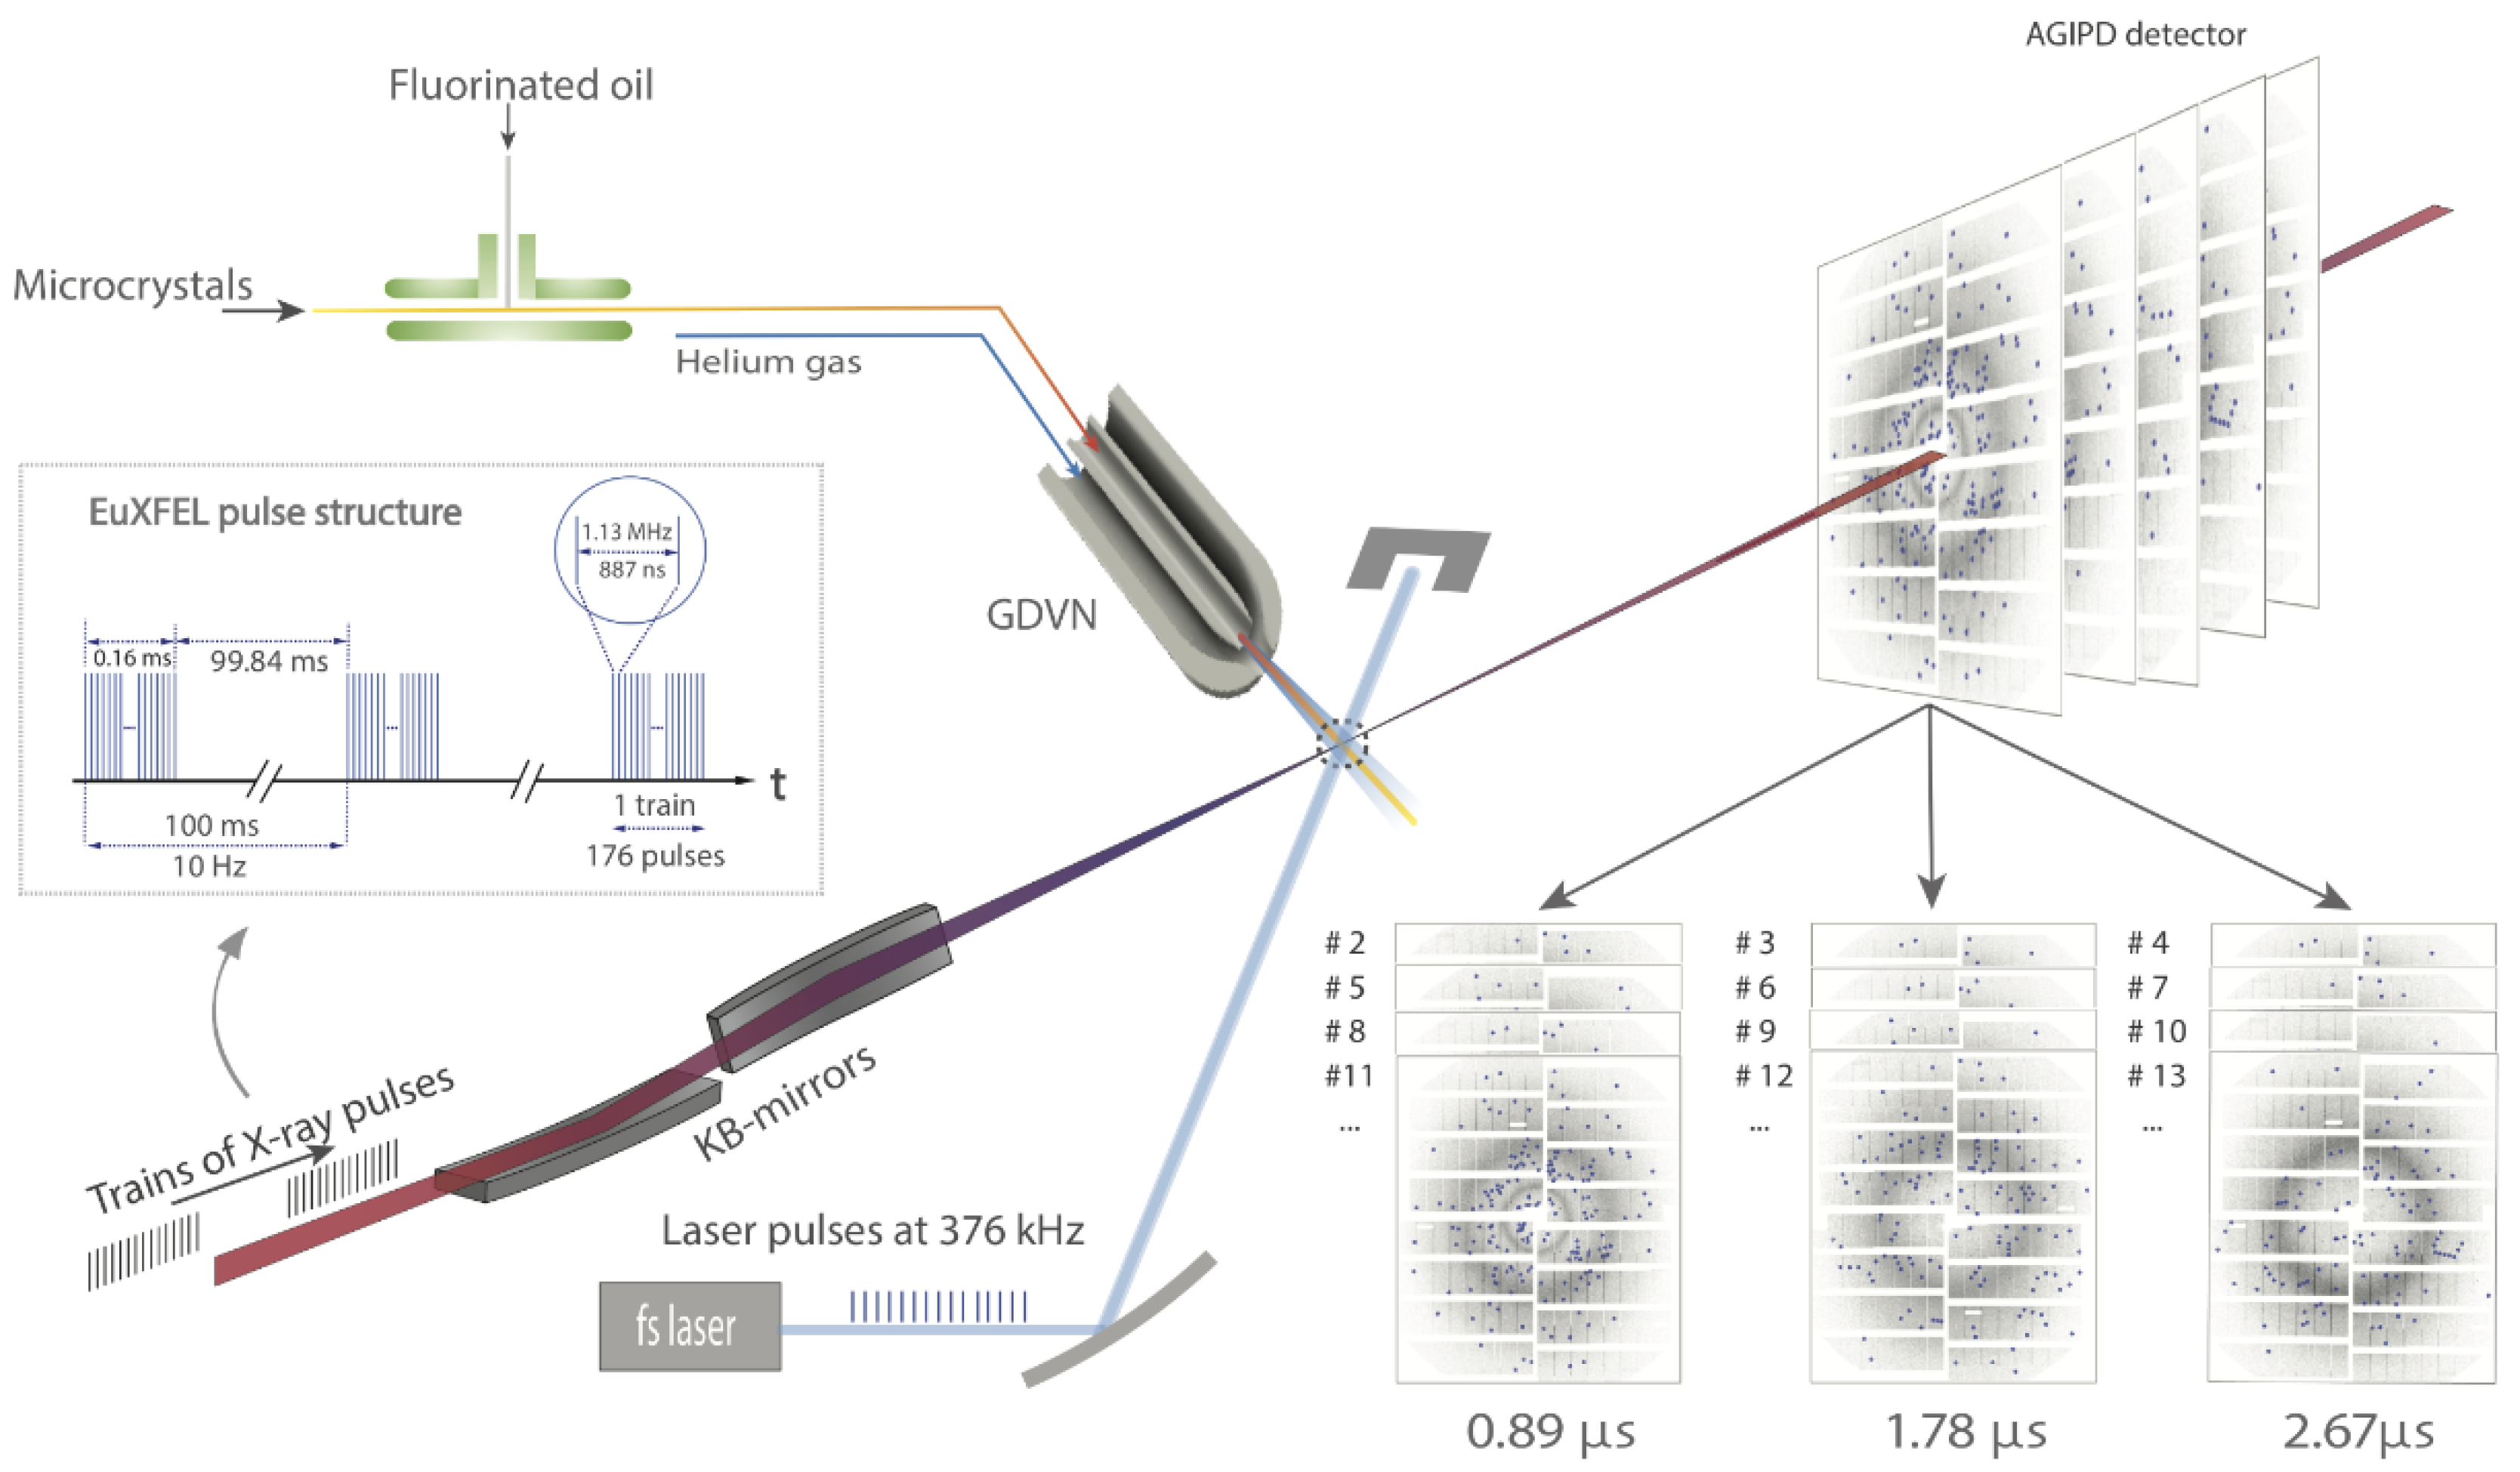
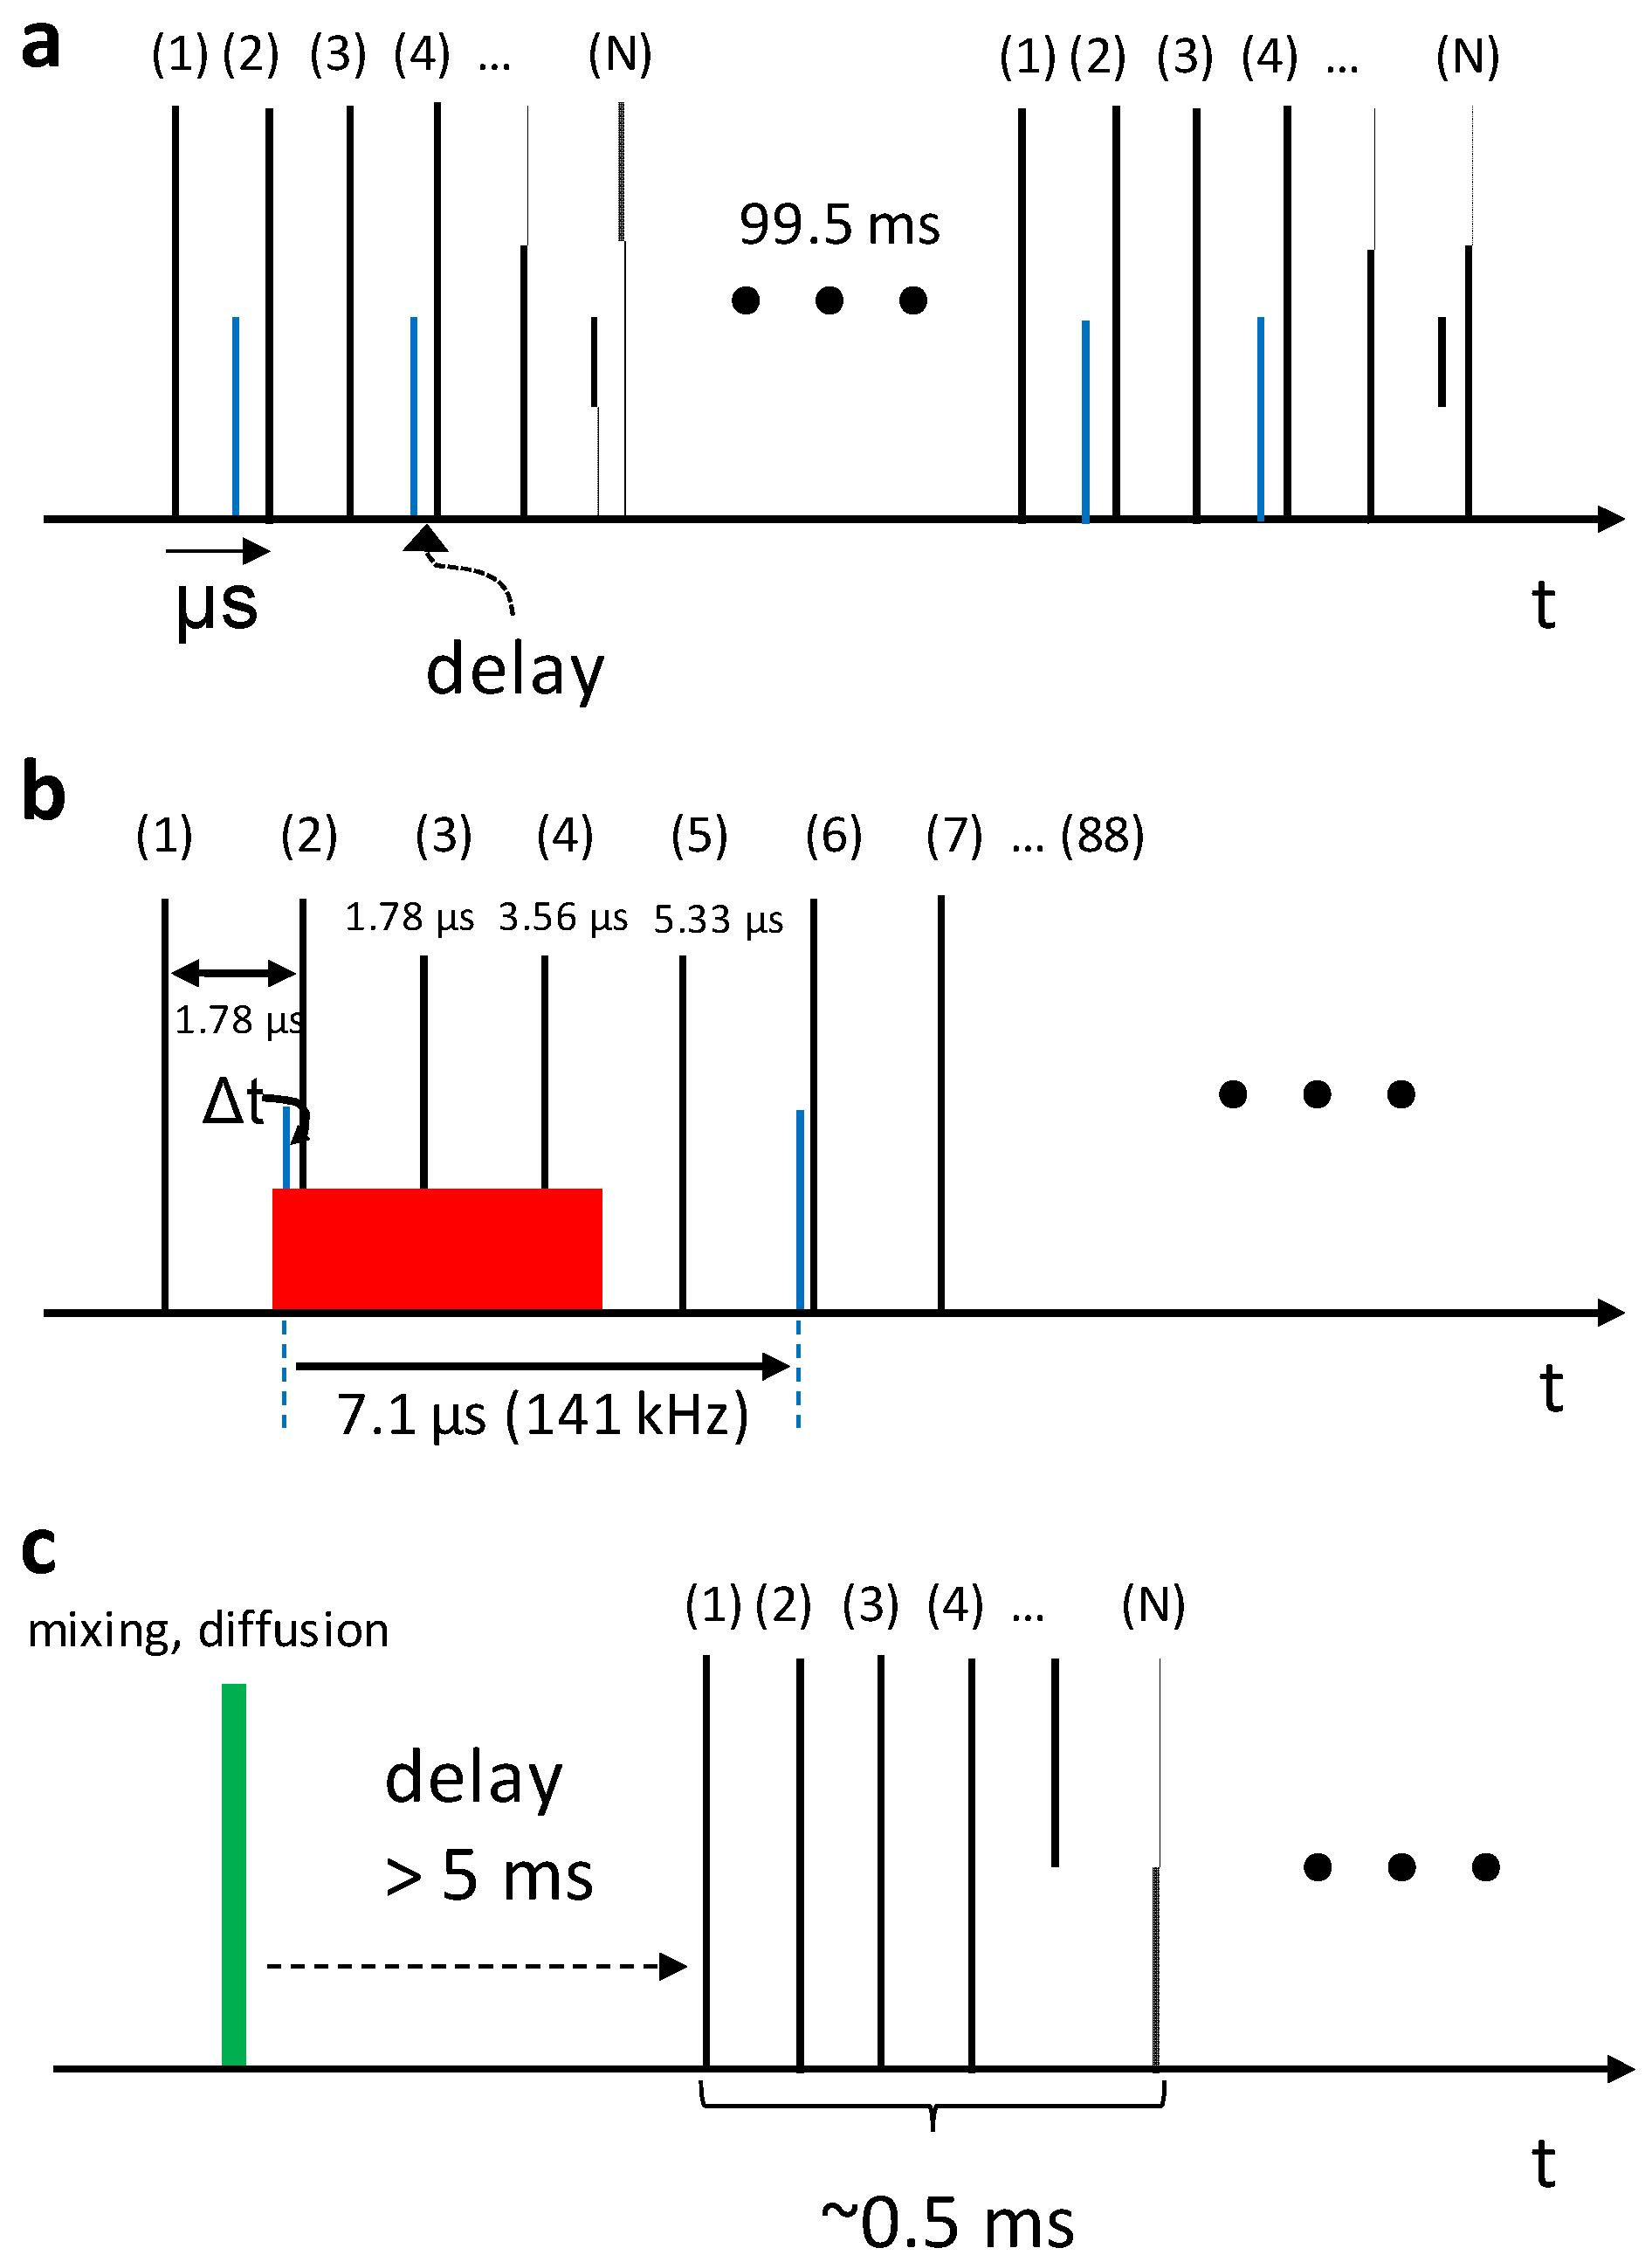
Recently, the first superconducting XFEL, the European XFEL (EuXFEL) in Germany, came online [58,59,60]. It features short trains of X-ray pulses with MHz intra-train pulse rates. A total of 10 of these trains repeat in one second (Figure 4). When the desired design specifications are reached, 2700 pulses can be in a train. Accordingly, the average X-ray pulse rate can be up to 27,000 pulses/s [58]. The high X-ray pulse repetition rates can be very beneficial for a mix-and-inject experiment, as discussed below. An X-ray detector, the Adaptive Gain Integrating Pixel Detector (AGIPD) [61,62], which works with MHz frame rates, was developed. For the first user-supported experiment at the EuXFEL in the fall of 2017, only 15 X-ray pulses were in a train [63]. These pulses, however, arrived with a 1.15 MHz rate, hence they were separated by about 0.9 μs. Accordingly, each pulse train lasted only 13 μs, from which high-quality diffraction data were collected. This successful experiment already provided invaluable information on how to design new experiments (including mix-and-inject experiments) with MHz X-ray pulse rates. In subsequent experiments [64,65], the number of X-ray pulses in the train steadily increased. From these, it becomes evident that spacing the X-ray pulses closely in time has essentially no impact on the quality of the structures determined from them [64,66,67]. For the first time-resolved crystallographic experiment at the EuXFEL [68] 176 pulses were provided for in each train, hence the average pulse rate was 1760 s−1. The MHz rates cause substantial challenges. These challenges are outlined here for a time-resolved experiment with the pump probe method, so that strategies for a mix-and-inject experiments can be understood more easily. In a pump–probe experiment, the optical laser pulses that start the reaction must be synchronized to the single X-ray pulses that probe the progress of the reaction after an ultra-short time-delay (Figure 5a). Accordingly, tunable optical lasers needed to be designed and constructed that generate powerful femtosecond optical pulses with MHz rates. Such an engineering marvel is available at the EuXFEL [69] and enables time-resolved serial femtosecond crystallographic (TR-SFX) [25] experiments at the SPB/SFX [70] and the FXE instruments [60]. A pump-probe TR-SFX experiment [68] was recently performed at the SPB/SFX instrument. It covered a previously unexplored time range in the photocycle of the photoactive yellow protein (PYP) [25,68,71,72,73]. The main challenge was that the GDVN must transport a once-excited jet volume entirely out of the X-ray interaction region before the next optical laser pulse excites a new volume. Otherwise, crystals might become excited twice or even multiple times with undesirable results. Appropriate waiting times must be anticipated before the next jet volume is excited (Figure 5b). As a result, only one out of four X-ray pulses in the train contributed to the ultrafast time-delays (Figure 5b), which reduced the data collection efficiency by a factor of 4. In Figure 6a, the different electron density determined at a 10 ps time-delay is shown as an example. Three subsequent pulses were used to measure how and when the excited jet volume left the X-ray interaction volume (Figure 6b–d). As the first X-ray pulse after the laser pulse (compare Figure 5b and Figure 6a) probes the 10 ps time-delay, the following X-ray pulses probe fast μs time-delays up to 5.33 μs (Figure 6b–d). This signal disappears completely in Figure 6d. This shows that shortly after 3.56 μs, the laser exited volume completely left the X-ray interaction volume (see the region marked in red in Figure 5b), and the reaction can be restarted in fresh crystals by another laser pulse to accumulate more diffraction patterns for the 10 ps time-delay.
Although the experiment on PYP was a pump–probe experiment, it already suggests ways how to design a successful mix-and-inject experiment that may benefit from all X-ray pulses in the trains. First and foremost, reaction initiation by diffusion is orders of magnitude slower, milliseconds, than the intra-train X-ray pulse separation time, which is on the order of 200 ns to 2 μs depending on the pulse repetition rate of the machine. Accordingly, reaction initiation in between the X-ray pulses in a train, as shown in Figure 5a,b, is not possible. However, the mix-and-inject method necessarily initiates the reaction in the nozzle (Figure 5c). A time-delay is exclusively determined by the distance between the mixing region and the X-ray interaction region (see Figure 2b). Once this distance is established, all X-ray pulses, regardless of whether they arrive within a single train or within subsequent trains, probe the same time-delay. Contrary to TR-FSX experiments, where the excited jet volumes must first leave the X-ray interaction region, mix-and-inject experiments can utilize the maximum permissible X-ray pulse rate for optimum data collection speed. Still, the jet produced by the mixing device must be fast enough that the gap that is forming in the jet after X-ray exposure [63,67,68] is transported away quickly enough, so that a fresh jet volume is present to interact with the next X-ray pulse. Otherwise the hit rate is decaying considerably, as also experienced in the TR-SFX experiment described above [68]. When the final design specifications are reached, 27,000 pulses/s are available, of which about 3500 patterns/s can be stored and streamed out by the AGIPD. With an assumed hit rate of 5% and an indexing rate of 60%, 25,000 indexed patterns that are necessary for a decent dataset require about 830,000 patterns [12,39,63,67,68]. Even with the AGIPD’s limited storage and readout capacity, a dataset can be collected within 230 s or 4 minutes. If technical improvements permit the use of all 2700 X-ray pulses in the train, a SFX dataset can be collected in only half a minute and requires only a few micrograms of protein [74]. In any case, pump–probe and mix-and-inject experiments are on the same footing and can make use of highly efficient data collection strategies at the high-repetition-rate XFELs.

6. Mix-and-Inject Experiments at High Repetition Rate XFELs

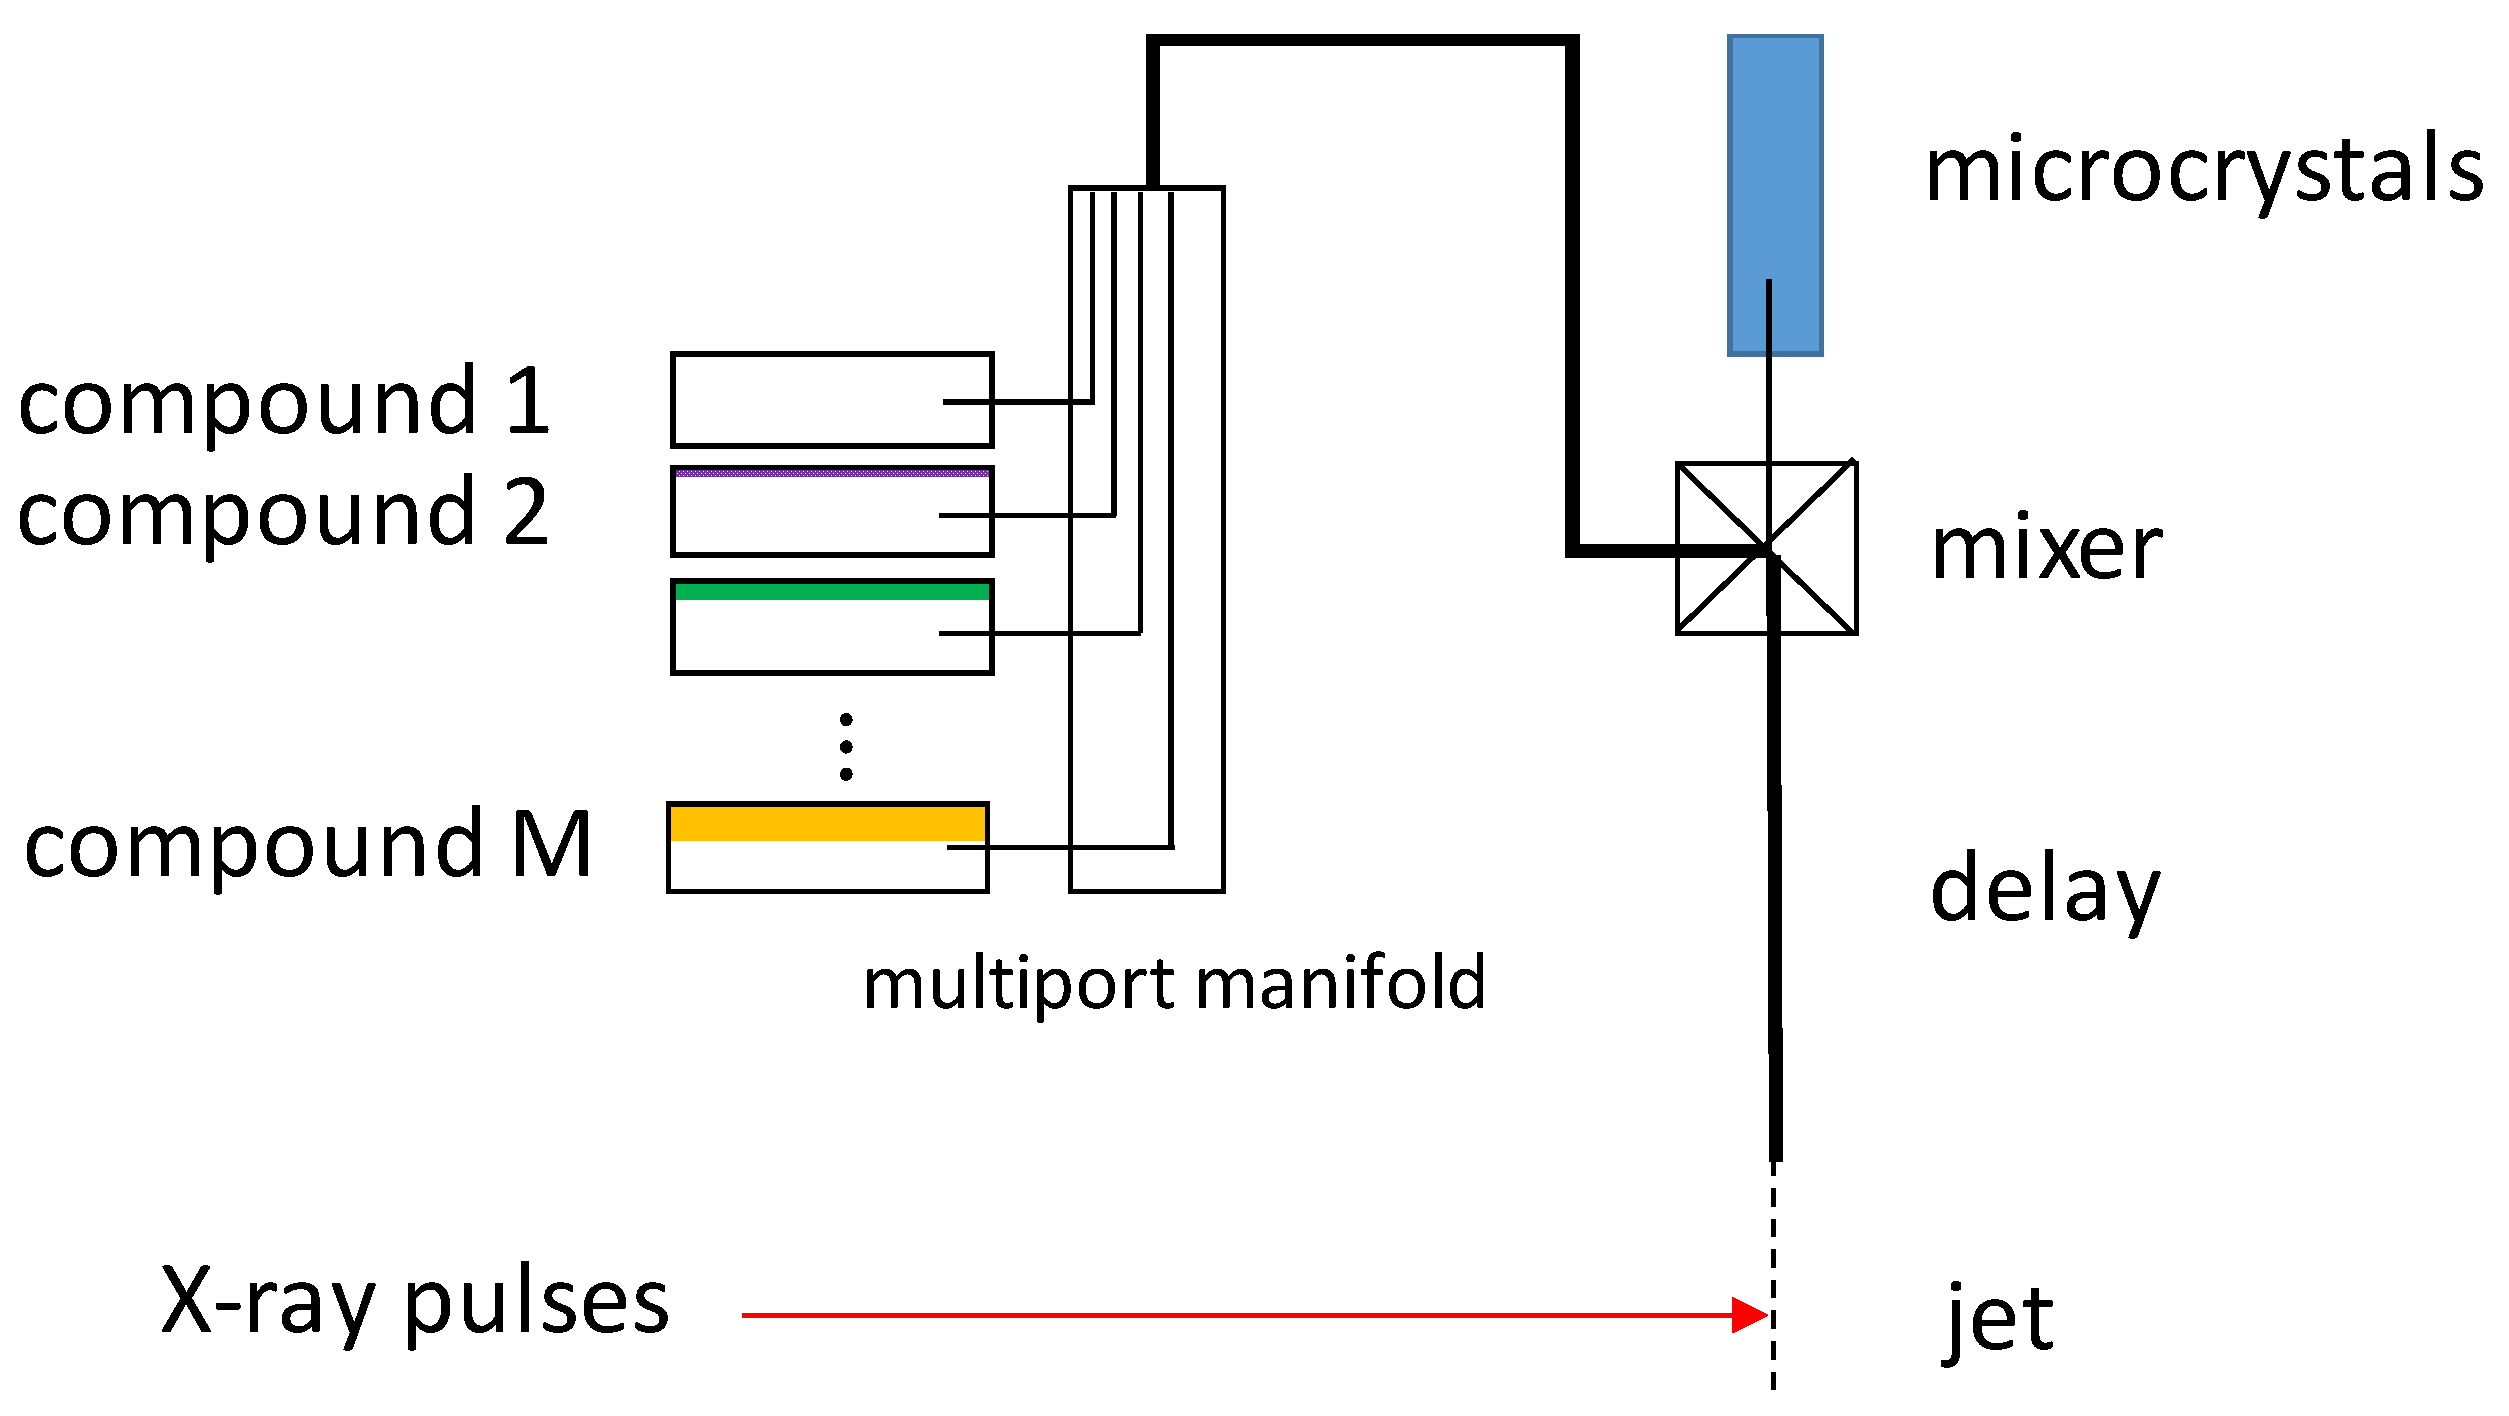
The EuXFEL opens new avenues to the rapid collection of multiple data sets. As schematically illustrated in Figure 7, multiple compounds, which can either be small chemicals, drugs, or drug fragments, can be mixed with microcrystals one by one. With this, highly efficient fragment screening [75] becomes conceivable as a tool for structure based drug design. As the collection of a dataset only takes a few minutes at the EuXFEL, hundreds of compounds can be investigated within a shift by subsequently applying them through a simple T-junction (Figure 2a and Figure 7). It may well be that in the near future the XFEL significantly contributes to the knowledge base to save lives either by directly observing molecules of biomedical importance in action through a mix-and-inject experiment, or by probing a drug target with a multitude of active compounds as suggested by Figure 7.

Funding

This work was supported by NSF Science and Technology Centers (grant no. NSF-1231306; Biology with X-ray Lasers).

Conflicts of Interest

The author declares no conflict of interest. The funders had no role in the design of the study; in the collection, analyses, or interpretation of data; in the writing of the manuscript, or in the decision to publish the results.

References

  1. Rupp, B. Biomolecular Crystallography: Principles, Practice, and Application to Structural Biology; Garland Science: New York, NY, USA, 2009. [Google Scholar]
  2. McPherson, A. Crystallization of Biological Macromolecules; Cold Spring Harbor Laboratory Press: New York, NY, USA, 1999. [Google Scholar]
  3. Carugo, O.; Blatova, O.A.; Medrish, E.O.; Blatov, V.A.; Proserpio, D.M. Packing topology in crystals of proteins and small molecules: A comparison. Sci. Rep. 2017, 7, 13209. [Google Scholar] [CrossRef]
  4. Kendrew, J.C.; Bodo, G.; Dintzis, H.M.; Parrish, R.G.; Wyckoff, H.; Phillips, D.C. A three-dimensional model of the myoglobin molecule obtained by x-ray analysis. Nature 1958, 181, 662–666. [Google Scholar] [CrossRef]
  5. Blake, C.C.; Koenig, D.F.; Mair, G.A.; North, A.C.; Phillips, D.C.; Sarma, V.R. Structure of hen egg-white lysozyme. A three-dimensional Fourier synthesis at 2 Angstrom resolution. Nature 1965, 206, 757–761. [Google Scholar] [CrossRef]
  6. Sluyterman, L.A.; de Graaf, M.J. The activity of papain in the crystalline state. Biochim. Biophys. Acta 1969, 171, 277–287. [Google Scholar] [CrossRef]
  7. Hajdu, J.; Neutze, R.; Sjogren, T.; Edman, K.; Szoke, A.; Wilmouth, R.C.; Wilmot, C.M. Analyzing protein functions in four dimensions. Nat. Struct. Biol. 2000, 7, 1006–1012. [Google Scholar] [CrossRef]
  8. Schmidt, M. Mix and Inject, Reaction Initiation by Diffusion for Time-Resolved Macromolecular Crystallography. Adv. Condens. Matter Phys. 2013, 1–10. [Google Scholar] [CrossRef] [Green Version]
  9. Moffat, K.; Chen, Y.; Ng, K.M.; Mcree, D.; Getzoff, E.D. Time-Resolved Crystallography—Principles, Problems and Practice. Philos. Trans. R. Soc. A 1992, 340, 175–189. [Google Scholar]
  10. Schmidt, M. Structure Based Enzyme Kinetics by Time-Resolved X-Ray Crystallography, Ultrashort Laser Pulses in Medicine and Biology; Springer: Berlin/Heidelberg, Germany, 2008. [Google Scholar]
  11. Carslaw, H.S.; Jaeger, J.C. Conduction Heat in Solids, 2nd ed.; Clarendon Press: Oxford, UK, 1959. [Google Scholar]
  12. Olmos, J.L., Jr.; Pandey, S.; Martin-Garcia, J.M.; Calvey, G.; Katz, A.; Knoska, J.; Kupitz, C.; Hunter, M.S.; Liang, M.; Oberthuer, D.; et al. Enzyme intermediates captured “on the fly” by mix-and-inject serial crystallography. BMC Biol. 2018, 16, 59. [Google Scholar] [CrossRef] [Green Version]
  13. Parak, F.; Hartmann, H.; Schmidt, M.; Corongiu, G.; Clementi, E. The hydration shell of myoglobin. Eur. Biophys. J. EBJ 1992, 21, 313–320. [Google Scholar] [CrossRef]
  14. Schmidt, M.; Srajer, V.; Henning, R.; Ihee, H.; Purwar, N.; Tenboer, J.; Tripathi, S. Protein energy landscapes determined by five-dimensional crystallography. Acta Crystallogr. D Biol. Crystallogr. 2013, 69, 2534–2542. [Google Scholar] [CrossRef]
  15. Beale, J.H.; Bolton, R.; Marshall, S.A.; Beale, E.; Carr, S.B.; Ebrahim, A.; Moreno-Chicano, T.; Hough, M.A.; Worrall, J.A.R.; Tews, I.; et al. Successful sample preparation for serialcrystallography experiments. J. Appl. Cryst. 2019. [Google Scholar] [CrossRef] [Green Version]
  16. Geremia, S.; Campagnolo, M.; Demitri, N.; Johnson, L.N. Simulation of diffusion time of small molecules in protein crystals. Structure 2006, 14, 393–400. [Google Scholar] [CrossRef] [Green Version]
  17. Helliwell, J.R.; Nieh, Y.P.; Raftery, J.; Cassetta, A.; Habash, J.; Carr, P.D.; Ursby, T.; Wulff, M.; Thompson, A.W.; Niemann, A.C.; et al. Time-resolved structures of hydroxymethylbilane synthase (Lys59Gln mutant) as it is loaded with substrate in the crystal determined by Laue diffraction. J. Chem. Soc. Faraday Trans. 1998, 94, 2615–2622. [Google Scholar] [CrossRef]
  18. Stoddard, B.L.; Cohen, B.E.; Brubaker, M.; Mesecar, A.D.; Koshland, D.E., Jr. Millisecond Laue structures of an enzyme-product complex using photocaged substrate analogs. Nat. Struct. Biol. 1998, 5, 891–897. [Google Scholar] [CrossRef]
  19. Stoddard, B.L. New results using Laue diffraction and time-resolved crystallography. Curr. Opin. Struct. Biol. 1998, 8, 612–618. [Google Scholar] [CrossRef]
  20. Moffat, K.; Szebenyi, D.; Bilderback, D. X-ray Laue Diffraction from Protein Crystals. Science 1984, 223, 1423–1425. [Google Scholar] [CrossRef]
  21. Ren, Z.; Bourgeois, D.; Helliwell, J.R.; Moffat, K.; Srajer, V.; Stoddard, B.L. Laue crystallography: Coming of age. J. Synchrotron Radiat. 1999, 6, 891–917. [Google Scholar] [CrossRef]
  22. Martin-Garcia, J.M.; Conrad, C.E.; Nelson, G.; Stander, N.; Zatsepin, N.A.; Zook, J.; Zhu, L.; Geiger, J.; Chun, E.; Kissick, D.; et al. Serial millisecond crystallography of membrane and soluble protein microcrystals using synchrotron radiation. IUCrJ 2017, 4, 439–454. [Google Scholar] [CrossRef]
  23. Meents, A.; Wiedorn, M.O.; Srajer, V.; Henning, R.; Sarrou, I.; Bergtholdt, J.; Barthelmess, M.; Reinke, P.Y.A.; Dierksmeyer, D.; Tolstikova, A.; et al. Pink-beam serial crystallography. Nat. Commun. 2017, 8, 1281. [Google Scholar] [CrossRef]
  24. Kirian, R.A.; Wang, X.; Weierstall, U.; Schmidt, K.E.; Spence, J.C.; Hunter, M.; Fromme, P.; White, T.; Chapman, H.N.; Holton, J. Femtosecond protein nanocrystallography-data analysis methods. Opt. Express 2010, 18, 5713–5723. [Google Scholar] [CrossRef]
  25. Tenboer, J.; Basu, S.; Zatsepin, N.; Pande, K.; Milathianaki, D.; Frank, M.; Hunter, M.; Boutet, S.; Williams, G.J.; Koglin, J.E.; et al. Time-resolved serial crystallography captures high-resolution intermediates of photoactive yellow protein. Science 2014, 346, 1242–1246. [Google Scholar] [CrossRef] [PubMed] [Green Version]
  26. Boutet, S.; Lomb, L.; Williams, G.J.; Barends, T.R.; Aquila, A.; Doak, R.B.; Weierstall, U.; DePonte, D.P.; Steinbrener, J.; Shoeman, R.L.; et al. High-resolution protein structure determination by serial femtosecond crystallography. Science 2012, 337, 362–364. [Google Scholar] [CrossRef] [PubMed] [Green Version]
  27. Chapman, H.N.; Fromme, P.; Barty, A.; White, T.A.; Kirian, R.A.; Aquila, A.; Hunter, M.S.; Schulz, J.; DePonte, D.P.; Weierstall, U.; et al. Femtosecond X-ray protein nanocrystallography. Nature 2011, 470, 73–77. [Google Scholar] [CrossRef] [PubMed]
  28. Lomb, L.; Barends, T.R.; Kassemeyer, S.; Aquila, A.; Epp, S.W.; Erk, B.; Foucar, L.; Hartmann, R.; Rudek, B.; Rolles, D.; et al. Radiation damage in protein serial femtosecond crystallography using an x-ray free-electron laser. Phys. Rev. B Condens. Matter Mater. Phys. 2011, 84, 214111. [Google Scholar] [CrossRef] [Green Version]
  29. Spence, J.C.; Hawkes, P.W. Diffract-and-destroy: Can X-ray lasers “solve“ the radiation damage problem? Ultramicroscopy 2008, 108, 1502–1503. [Google Scholar] [CrossRef]
  30. Neutze, R.; Wouts, R.; van der Spoel, D.; Weckert, E.; Hajdu, J. Potential for biomolecular imaging with femtosecond X-ray pulses. Nature 2000, 406, 752–757. [Google Scholar] [CrossRef]
  31. Chapman, H.N.; Barty, A.; Bogan, M.J.; Boutet, S.; Frank, M.; Hau-Riege, S.P.; Marchesini, S.; Woods, B.W.; Bajt, S.; Benner, H.; et al. Femtosecond diffractive imaging with a soft-X-ray free-electron laser. Nat. Phys. 2006, 2, 839–843. [Google Scholar] [CrossRef] [Green Version]
  32. Chapman, H.N.; Caleman, C.; Timneanu, N. Diffraction before destruction. Philos. Trans. R. Soc. B 2014. [Google Scholar] [CrossRef] [Green Version]
  33. Aquila, A.; Hunter, M.S.; Doak, R.B.; Kirian, R.A.; Fromme, P.; White, T.A.; Andreasson, J.; Arnlund, D.; Bajt, S.; Barends, T.R.; et al. Time-resolved protein nanocrystallography using an X-ray free-electron laser. Opt. Express 2012, 20, 2706–2716. [Google Scholar] [CrossRef]
  34. DePonte, D.P.; Weierstall, U.; Schmidt, K.; Warner, J.; Starodub, D.; Spence, J.C.H.; Doak, R.B. Gas dynamic virtual nozzle for generation of microscopic droplet streams. J. Phys. D Appl. Phys. 2008, 41, 19. [Google Scholar] [CrossRef] [Green Version]
  35. Stellato, F.; Oberthuer, D.; Mengning, L.; Bean, R.; Gati, C.; Yefanov, O.; Barty, A.; Burkhardt, K. Room-temperature macromolecular serial crystallography using synchrotron radiation. IUCrJ 2014, 1, 204–212. [Google Scholar] [CrossRef] [PubMed]
  36. Nogly, P.; James, D.; Wang, D.; White, T.A.; Zatsepin, N.; Shilova, A.; Nelson, G.; Liu, H.; Johansson, L.; Heymann, M.; et al. Lipidic cubic phase serial millisecond crystallography using synchrotron radiation. IUCrJ 2015, 2, 168–176. [Google Scholar] [CrossRef] [PubMed]
  37. Tolstikova, A.; Levantino, M.; Yefanov, O.; Hennicke, V.; Fischer, P.; Meyer, J.; Mozzanica, A.; Redford, S.; Crosas, E.; Opara, N.L.; et al. 1 kHz fixed-target serial crystallography using a multilayer monochromator and an integrating pixel detector. IUCrJ 2019, 6, 927–937. [Google Scholar] [CrossRef]
  38. Coquelle, N.; Brewster, A.S.; Kapp, U.; Shilova, A.; Weinhausen, B.; Burghammer, M.; Colletier, J.P. Raster-scanning serial protein crystallography using micro- and nano-focused synchrotron beams. Acta Crystallogr. D Biol. Crystallogr. 2015, 71, 1184–1196. [Google Scholar] [CrossRef] [PubMed] [Green Version]
  39. Kupitz, C.; Olmos, J.L., Jr.; Holl, M.; Tremblay, L.; Pande, K.; Pandey, S.; Oberthur, D.; Hunter, M.; Liang, M.; Aquila, A.; et al. Structural enzymology using X-ray free electron lasers. Struct. Dyn. 2017, 4, 044003. [Google Scholar] [CrossRef] [PubMed]
  40. Stagno, J.R.; Liu, Y.; Bhandari, Y.R.; Conrad, C.E.; Panja, S.; Swain, M.; Fan, L.; Nelson, G.; Li, C.; Wendel, D.R.; et al. Structures of riboswitch RNA reaction states by mix-and-inject XFEL serial crystallography. Nature 2017, 541, 242–246. [Google Scholar] [CrossRef] [PubMed]
  41. Dasgupta, M.; Budday, D.; de Oliveira, S.H.P.; Madzelan, P.; Marchany-Rivera, D.; Seravalli, J.; Hayes, B.; Sierra, R.G.; Boutet, S.; Hunter, M.S.; et al. Mix-and-inject XFEL crystallography reveals gated conformational dynamics during enzyme catalysis. Proc. Natl. Acad. Sci. USA 2019. [Google Scholar] [CrossRef]
  42. Mehrabi, P.; Schulz, E.C.; Agthe, M.; Horrell, S.; Bourenkov, G.; von Stetten, D.; Leimkohl, J.P.; Schikora, H.; Schneider, T.R.; Pearson, A.R.; et al. Liquid application method for time-resolved analyses by serial synchrotron crystallography. Nat. Methods 2019, 16, 979–982. [Google Scholar] [CrossRef]
  43. Roessler, C.G.; Agarwal, R.; Allaire, M.; Alonso-Mori, R.; Andi, B.; Bachega, J.F.; Bommer, M.; Brewster, A.S.; Browne, M.C.; Chatterjee, R.; et al. Acoustic Injectors for Drop-On-Demand Serial Femtosecond Crystallography. Structure 2016, 24, 631–640. [Google Scholar] [CrossRef] [Green Version]
  44. Beyerlein, K.R.; Dierksmeyer, D.; Mariani, V.; Kuhn, M.; Sarrou, I.; Ottaviano, A.; Awel, S.; Knoska, J.; Fuglerud, S.; Jonsson, O.; et al. Mix-and-diffuse serial synchrotron crystallography. IUCrJ 2017, 4, 769–777. [Google Scholar] [CrossRef]
  45. Calvey, G.D.; Katz, A.M.; Pollack, L. Microfluidic Mixing Injector Holder Enables Routine Structural Enzymology Measurements with Mix-and-Inject Serial Crystallography Using X-ray Free Electron Lasers. Anal. Chem. 2019, 91, 7139–7144. [Google Scholar] [CrossRef] [PubMed]
  46. Calvey, G.D.; Katz, A.M.; Schaffer, C.B.; Pollack, L. Mixing injector enables time-resolved crystallography with high hit rate at X-ray free electron lasers. Struct. Dyn. 2016, 3, 054301. [Google Scholar] [CrossRef] [PubMed] [Green Version]
  47. Ishigami, I.; Lewis-Ballester, A.; Echelmeier, A.; Brehm, G.; Zatsepin, N.A.; Grant, T.D.; Coe, J.D.; Lisova, S.; Nelson, G.; Zhang, S.; et al. Snapshot of an oxygen intermediate in the catalytic reaction of cytochrome c oxidase. Proc. Natl. Acad. Sci. USA 2019, 116, 3572–3577. [Google Scholar] [CrossRef] [PubMed] [Green Version]
  48. Sierra, R.G.; Gati, C.; Laksmono, H.; Dao, E.H.; Gul, S.; Fuller, F.; Kern, J.; Chatterjee, R.; Ibrahim, M.; Brewster, A.S.; et al. Concentric-flow electrokinetic injector enables serial crystallography of ribosome and photosystem II. Nat. Methods 2016, 13, 59–62. [Google Scholar] [CrossRef]
  49. Sherwood, A.V.; Henkin, T.M. Riboswitch-Mediated Gene Regulation: Novel RNA Architectures Dictate Gene Expression Responses. Annu. Rev. Microbiol. 2016, 70, 361–374. [Google Scholar] [CrossRef]
  50. Shelby, M.; Gilbile, D.; Grant, T.; Seuring, C.; Segelke, B.; He, W.; Evans, A.; Pakendorf, T.; Fischer, P.; Hunter, M.; et al. Fixed Target Delivery for Serial Femtosecond Crystallography of Weakly-Diffracting Objects. Protein Sci. 2019, 28, 109–110. [Google Scholar]
  51. Hunter, M.S.; Segelke, B.; Messerschmidt, M.; Williams, G.J.; Zatsepin, N.A.; Barty, A.; Benner, W.H.; Carlson, D.B.; Coleman, M.; Graf, A.; et al. Fixed-target protein serial microcrystallography with an x-ray free electron laser. Sci. Rep. 2014, 4, 6026. [Google Scholar] [CrossRef] [Green Version]
  52. Zarrine-Afsar, A.; Barends, T.R.M.; Muller, C.; Fuchs, M.R.; Lomb, L.; Schlichting, I.; Miller, R.J.D. Crystallography on a chip. Acta Crystallogr. D 2012, 68, 321–323. [Google Scholar] [CrossRef] [Green Version]
  53. Sui, S.; Wang, Y.X.; Kolewe, K.W.; Srajer, V.; Henning, R.; Schiffman, J.D.; Dimitrakopoulos, C.; Perry, S.L. Graphene-based microfluidics for serial crystallography. Lab A Chip 2016, 16, 3082–3096. [Google Scholar] [CrossRef]
  54. Kern, J.; Chatterjee, R.; Young, I.D.; Fuller, F.D.; Lassalle, L.; Ibrahim, M.; Gul, S.; Fransson, T.; Brewster, A.S.; Alonso-Mori, R.; et al. Structures of the intermediates of Kok’s photosynthetic water oxidation clock. Nature 2018, 563, 421–425. [Google Scholar] [CrossRef]
  55. Casadei, C.M.; Nass, K.; Barty, A.; Hunter, M.S.; Padeste, C.; Tsai, C.J.; Boutet, S.; Messerschmidt, M.; Sala, L.; Williams, G.J.; et al. Structure-factor amplitude reconstruction from serial femtosecond crystallography of two-dimensional membrane-protein crystals. IUCrJ 2019, 6, 34–45. [Google Scholar] [CrossRef] [PubMed] [Green Version]
  56. Li, C.F.; Li, X.X.; Kirian, R.; Spence, J.C.H.; Liu, H.G.; Zatsepin, N.A. SPIND: A reference-based auto-indexing algorithm for sparse serial crystallography data. IUCrJ 2019, 6, 72–84. [Google Scholar] [CrossRef] [PubMed]
  57. Schulz, E.C.; Mehrabi, P.; Muller-Werkmeister, H.M.; Tellkamp, F.; Jha, A.; Stuart, W.; Persch, E.; De Gasparo, R.; Diederich, F.; Pai, E.F.; et al. The hit-and-return system enables efficient time-resolved serial synchrotron crystallography. Nat. Methods 2018, 15, 901–904. [Google Scholar] [CrossRef] [PubMed] [Green Version]
  58. Altarelli, M.; Mancuso, A.P. Structural biology at the European X-ray free-electron laser facility. Philos. Trans. R. Soc. Lond. Ser. B Biol. Sci. 2014, 369, 20130311. [Google Scholar] [CrossRef] [Green Version]
  59. Mancuso, A. The Single Particles, Clusters and Biomolecules (SPB) Instrument at the European XFEL. Acta Crystallogr. A Found. Adv. 2013, 69, S143. [Google Scholar] [CrossRef]
  60. Galler, A.; Gawelda, W.; Biednov, M.; Bomer, C.; Britz, A.; Brockhauser, S.; Choi, T.K.; Diez, M.; Frankenberger, P.; French, M.; et al. Scientific instrument Femtosecond X-ray Experiments (FXE): Instrumentation and baseline experimental capabilities. J. Synchrotron Radiat. 2019, 26, 1432–1447. [Google Scholar] [CrossRef]
  61. Allahgholi, A.; Becker, J.; Delfs, A.; Dinapoli, R.; Goettlicher, P.; Greiffenberg, D.; Henrich, B.; Hirsemann, H.; Kuhn, M.; Klanner, R.; et al. The Adaptive Gain Integrating Pixel Detector at the European XFEL. J. Synchrotron Radiat. 2019, 26, 74–82. [Google Scholar] [CrossRef] [Green Version]
  62. Greiffenberg, D.; Collaboration, A. The AGIPD detector for the European XFEL. J. Instrum. 2012, 7. [Google Scholar] [CrossRef]
  63. Wiedorn, M.O.; Oberthur, D.; Bean, R.; Schubert, R.; Werner, N.; Abbey, B.; Aepfelbacher, M.; Adriano, L.; Allahgholi, A.; Al-Qudami, N.; et al. Megahertz serial crystallography. Nat. Commun. 2018, 9, 4025. [Google Scholar] [CrossRef] [Green Version]
  64. Yefanov, O.; Oberthur, D.; Bean, R.; Wiedorn, M.O.; Knoska, J.; Pena, G.; Awel, S.; Gumprecht, L.; Domaracky, M.; Sarrou, I.; et al. Evaluation of serial crystallographic structure determination within megahertz pulse trains. Struct. Dyn. 2019, 6, 064702. [Google Scholar] [CrossRef]
  65. Gisriel, C.; Coe, J.; Letrun, R.; Yefanov, O.M.; Luna-Chavez, C.; Stander, N.E.; Lisova, S.; Mariani, V.; Kuhn, M.; Aplin, S.; et al. Membrane protein megahertz crystallography at the European XFEL. Nat. Commun. 2019, 10, 5021. [Google Scholar] [CrossRef] [Green Version]
  66. Stan, C.A.; Milathianaki, D.; Laksmono, H.; Sierra, R.G.; McQueen, T.A.; Messerschmidt, M.; Williams, G.J.; Koglin, J.E.; Lane, T.J.; Hayes, M.J.; et al. Liquid explosions induced by X-ray laser pulses. Nat. Phys. 2016, 12, 966–971. [Google Scholar] [CrossRef]
  67. Grunbein, M.L.; Bielecki, J.; Gorel, A.; Stricker, M.; Bean, R.; Cammarata, M.; Dorner, K.; Frohlich, L.; Hartmann, E.; Hauf, S.; et al. Megahertz data collection from protein microcrystals at an X-ray free-electron laser. Nat. Commun. 2018, 9, 3487. [Google Scholar] [CrossRef]
  68. Pandey, S.; Bean, R.; Sato, T.; Poudyal, I.; Bielecki, J.; Cruz Villarreal, J.; Yefanov, O.; Mariani, V.; White, T.A.; Kupitz, C.; et al. Time-resolved serial femtosecond crystallography at the European XFEL. Nat. Methods 2019. [Google Scholar] [CrossRef]
  69. Palmer, G.; Kellert, M.; Wang, J.X.; Emons, M.; Wegner, U.; Kane, D.; Pallas, F.; Jezynski, T.; Venkatesan, S.; Rompotis, D.; et al. Pump-probe laser system at the FXE and SPB/SFX instruments of the European X-ray Free-Electron Laser Facility. J. Synchrotron Radiat. 2019, 26, 328–332. [Google Scholar] [CrossRef]
  70. Mancuso, A.P.; Aquila, A.; Batchelor, L.; Bean, R.J.; Bielecki, J.; Borchers, G.; Doerner, K.; Giewekemeyer, K.; Graceffa, R.; Kelsey, O.D.; et al. The Single Particles, Clusters and Biomolecules andSerial Femtosecond Crystallography instrument ofthe European XFEL: Initial installation. J. Synchrotron Radiat. 2019, 26, 660–676. [Google Scholar] [CrossRef]
  71. Pande, K.; Hutchison, C.D.M.; Groenhof, G.; Aquila, A.; Robinson, J.S.; Tenboer, J.; Basu, S.; Boutet, S.; Deponte, D.; Liang, M.; et al. Femtosecond Structural Dynamics Drives the Trans/Cis Isomerization in Photoactive Yellow Protein. Science 2016, 352, 725–729. [Google Scholar] [CrossRef] [Green Version]
  72. Jung, Y.O.; Lee, J.H.; Kim, J.; Schmidt, M.; Moffat, K.; Srajer, V.; Ihee, H. Volume-conserving trans-cis isomerization pathways in photoactive yellow protein visualized by picosecond X-ray crystallography. Nat. Chem. 2013, 5, 212–220. [Google Scholar] [CrossRef] [Green Version]
  73. Schotte, F.; Cho, H.S.; Kaila, V.R.; Kamikubo, H.; Dashdorj, N.; Henry, E.R.; Graber, T.J.; Henning, R.; Wulff, M.; Hummer, G.; et al. Watching a signaling protein function in real time via 100-ps time-resolved Laue crystallography. Proc. Natl. Acad. Sci. USA 2012, 109, 19256–19261. [Google Scholar] [CrossRef] [Green Version]
  74. Schmidt, M. Time-Resolved Macromolecular Crystallography at Pulsed X-ray Sources. Int. J. Mol. Sci. 2019, 20, 1401. [Google Scholar] [CrossRef] [Green Version]
  75. Thomas, S.E.; Collins, P.; James, R.H.; Mendes, V.; Charoensutthivarakul, S.; Radoux, C.; Abell, C.; Coyne, A.G.; Floto, R.A.; von Delft, F.; et al. Structure-guided fragment-based drug discovery at the synchrotron: Screening binding sites and correlations with hotspot mapping. Philos Trans. A Math. Phys. Eng. Sci. 2019, 377, 20180422. [Google Scholar] [CrossRef] [PubMed]
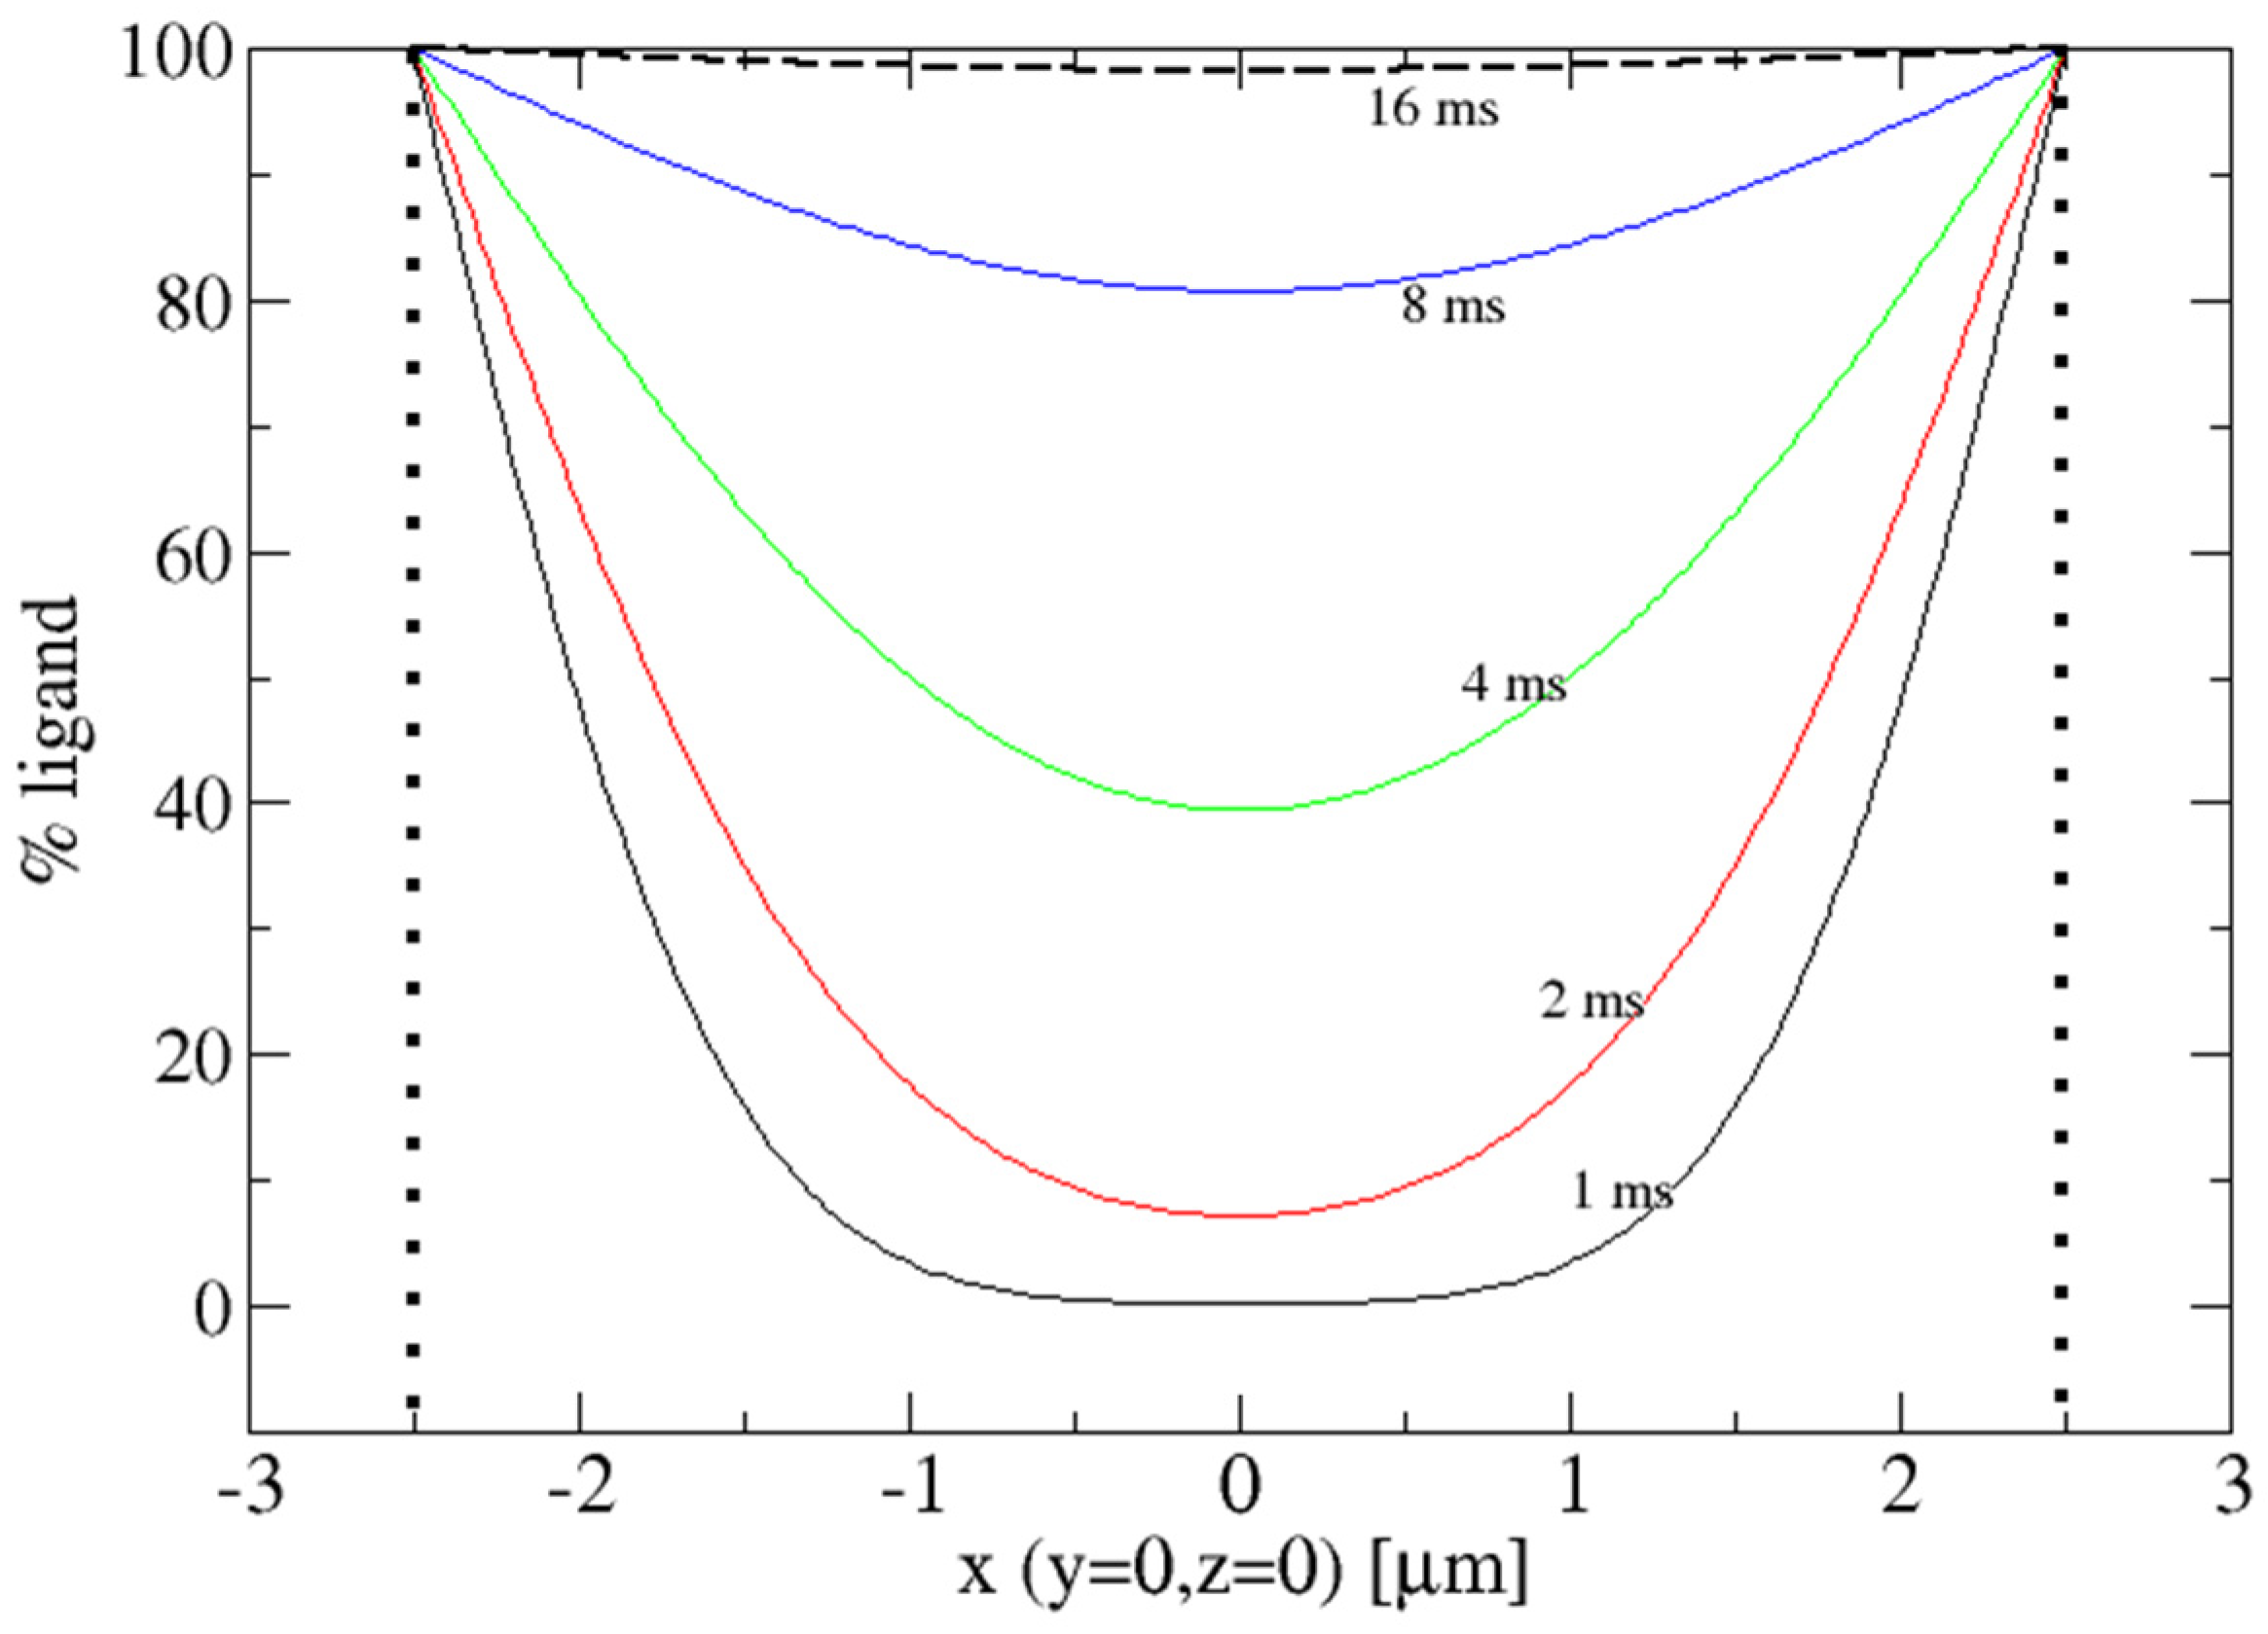
Figure 1. Concentration profile through the center of a 5 μm shoe box crystal. The initial ligand concentration is assumed to be 100 % instantaneously outside the crystal. The diffusion coefficient of the ligand is 2.3 × 10⁻⁶ cm2/s. Equation (2) was solved with n, l, and m ranging from 0 to 20 and plotted across x, with y and z equal to 0.
Crystals 10 00116 g001
Figure 2. Mixing strategies using liquid jets. (a) Mixing with a T-junction outside the nozzle rod. The crystals (green) are mixed with the substrate (Ceftriaxone, yellow). The mixture is injected with a gas dynamic virtual nozzle (GDVN) into the X-ray beam (red). The diffraction pattern is collected on an X-ray sensitive area detector. The time-delays are on a second scale. Figure from Kupitz et al. [38]. (b) The optimized mixing device fabricated by the Pollack group. The substrate is mixed with microcrystals (pink) within the nozzle device and quickly injected into the X-ray interaction region. Delays between mixing and injection can be in the sub-millisecond region. This figure is a modified version of the one shown in Calvey et al. [44].
Crystals 10 00116 g002
Figure 3. Ceftriaxone binding (a), enzyme-substrate complex formation (b), and the formation of the covalently bound acyl-complex (c) in the BlaC of M. tuberculosis determined by a mix-and-inject experiment at the LCLS. The dashed arrown in (b) and (c) indicates the formation of the covalent bond between the enzyme and substrate that happens between 100 and 500 ms. This figure is a modified version of the one shown in Olmos et al. [12].
Crystals 10 00116 g003
Figure 4. Pump–probe experiment at the European X-ray free electron laser (XFEL). The crystal slurry is applied with a few percent of fluorinated oil that is added by a T-junction. Crystals are excited by several hundred kHz of blue femtosecond laser pulses before they are probed by X-ray pulses. The X-ray pulse sequence is organized in trains and is shown in the inset. The Adaptive Gain Integrating Pixel Detector (AGIPD) collects the diffraction patterns, which will be sorted based on the pulse ID (arrows). The figure is from Pandey et al. [66].
Crystals 10 00116 g004
Figure 5. Timing schemes for ultrafast pump-probe strategies (a), (b), and mix-and-inject (c) experiments. (a) Intra-train reaction initiation: N X-ray pulses, each, are in a pulse train separated by up to a few μs depending on the pulse rate of the EuXFEL (European XFEL). Before an individual X-ray pulse arrives, the reaction is initiated by an optical laser pulse (blue). Short time-delays on the femtosecond time scale can be reached. One X-ray pulse in between probes a reference in the dark. The pulse trains repeat every 99.5 ms. (b) A real example from the first TR-SFX experiment at the EuXFEL with 88 pulses per train, 556 kHz X-ray pulse repetition rate and 141 kHz laser excitation (blue bars). The red box denotes the time it takes for the laser excited jet volume to move out of the X-ray interaction region. (c) Green bar: the reaction initiation by mixing and diffusion (mix-and-inject); the millisecond time scale is probed on time scales > 5 ms by the entire pulse train. Since the time-delay is fixed by the distance between the mixing region and the X-ray interaction region, all X-ray pulse in the train (as well as in all subsequent trains) contribute to the same time-delay. This figure is a modified version of the one shown in Pandey et al. [66].
Crystals 10 00116 g005
Figure 6. Results of a pump–probe experiment on photoactive yellow protein (PYP) by Pandey et al., 2019. Demonstration how the laser excited volume leaves the X-ray interaction region. After 3.56 μs, the signal vanishes. Difference electron densities in red (−3 σ) and blue (3 σ). (a) 10 ps pump-probe delay with features α (negative) and β positive. Blue structure: PYP in cis configuration. (bd): microsecond time-delays measured by subsequent X-ray pulses show how the laser excited volume is transported out. Features α and β differ from (a). The features are interpreted by the mixture of pR1 (magenta) and pR2 (red) intermediates which are typical for PYP on this time scale. Feature β2 (arrow) remains up to 3.56 μs, and is completely absent at 5.33 μs. Figure from Pandey et al. [66].
Crystals 10 00116 g006
Figure 7. Mix-and-diffuse experimental setup for multicompound screening (schematically). M compounds can be individually and sequentially selected by a multiport manifold. Each compound is mixed with microcrystals. Diffusion into the microcrystals is supported by a delay line. Finally, the mixture is injectect into X-ray interaction volume and probed by XFEL pulses.
Crystals 10 00116 g007