Microstructural Characterization and Corrosion-Resistance Behavior of Dual-Phase Steels Compared to Conventional Rebar

 ,
,  ,
,  , ,
, ,
Abstract
1. Introduction
2. Materials and Methods
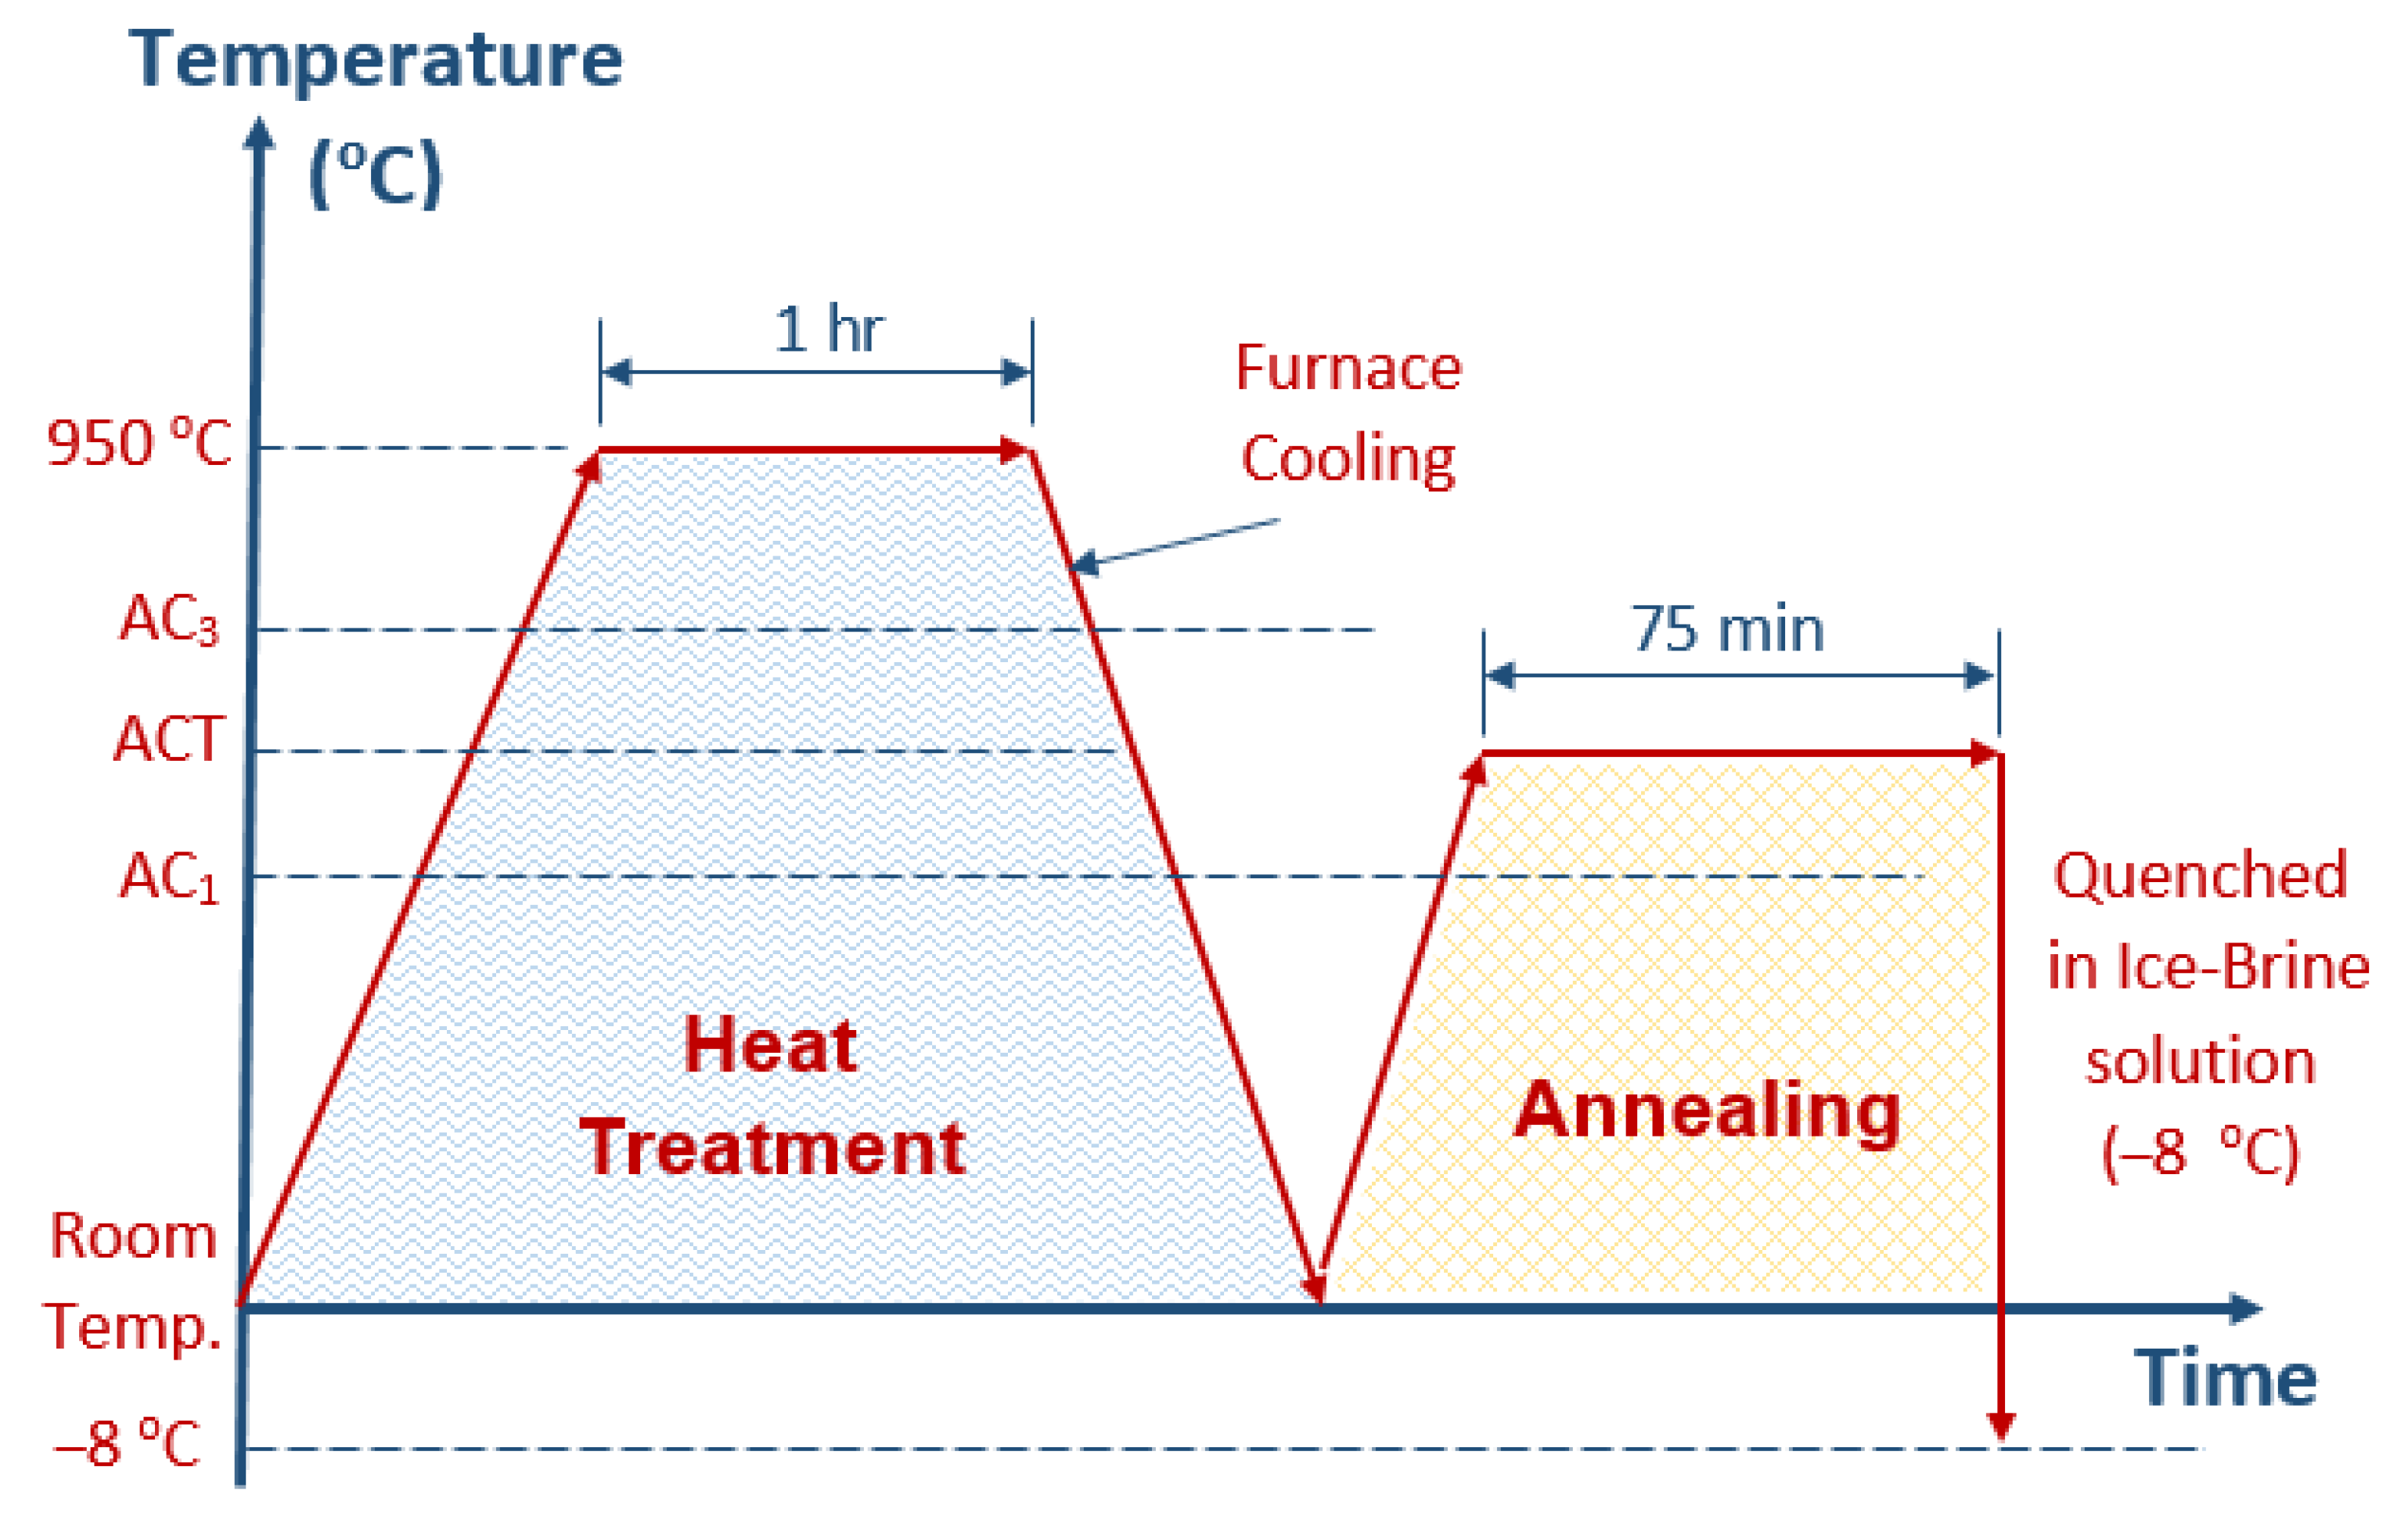
2.1. Heat Treatment
2.2. Metallography
2.3. Hardness Measurement
2.4. Volume Fraction Calculation
2.5. Corrosion Testing
3. Results
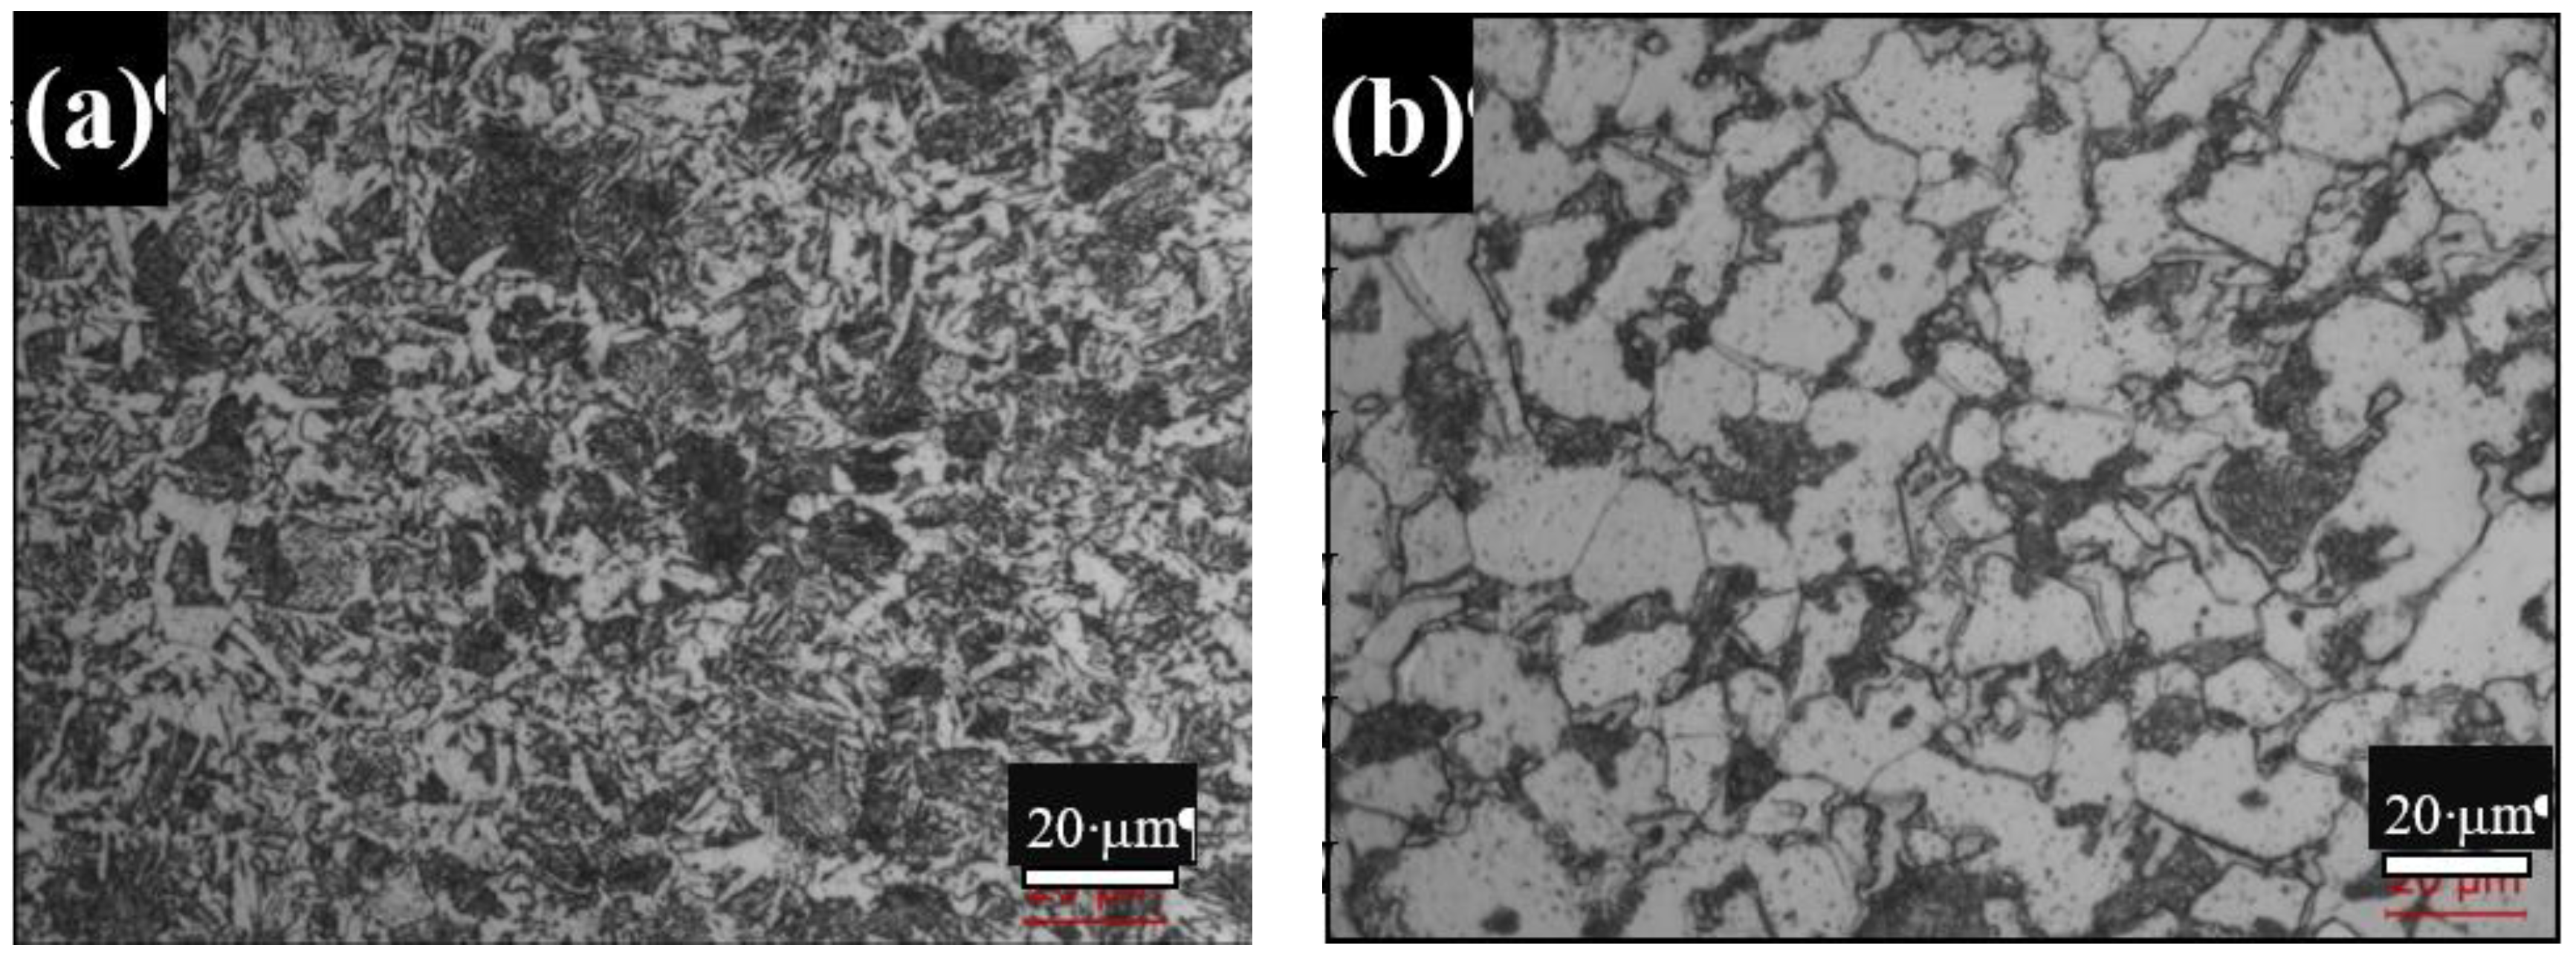
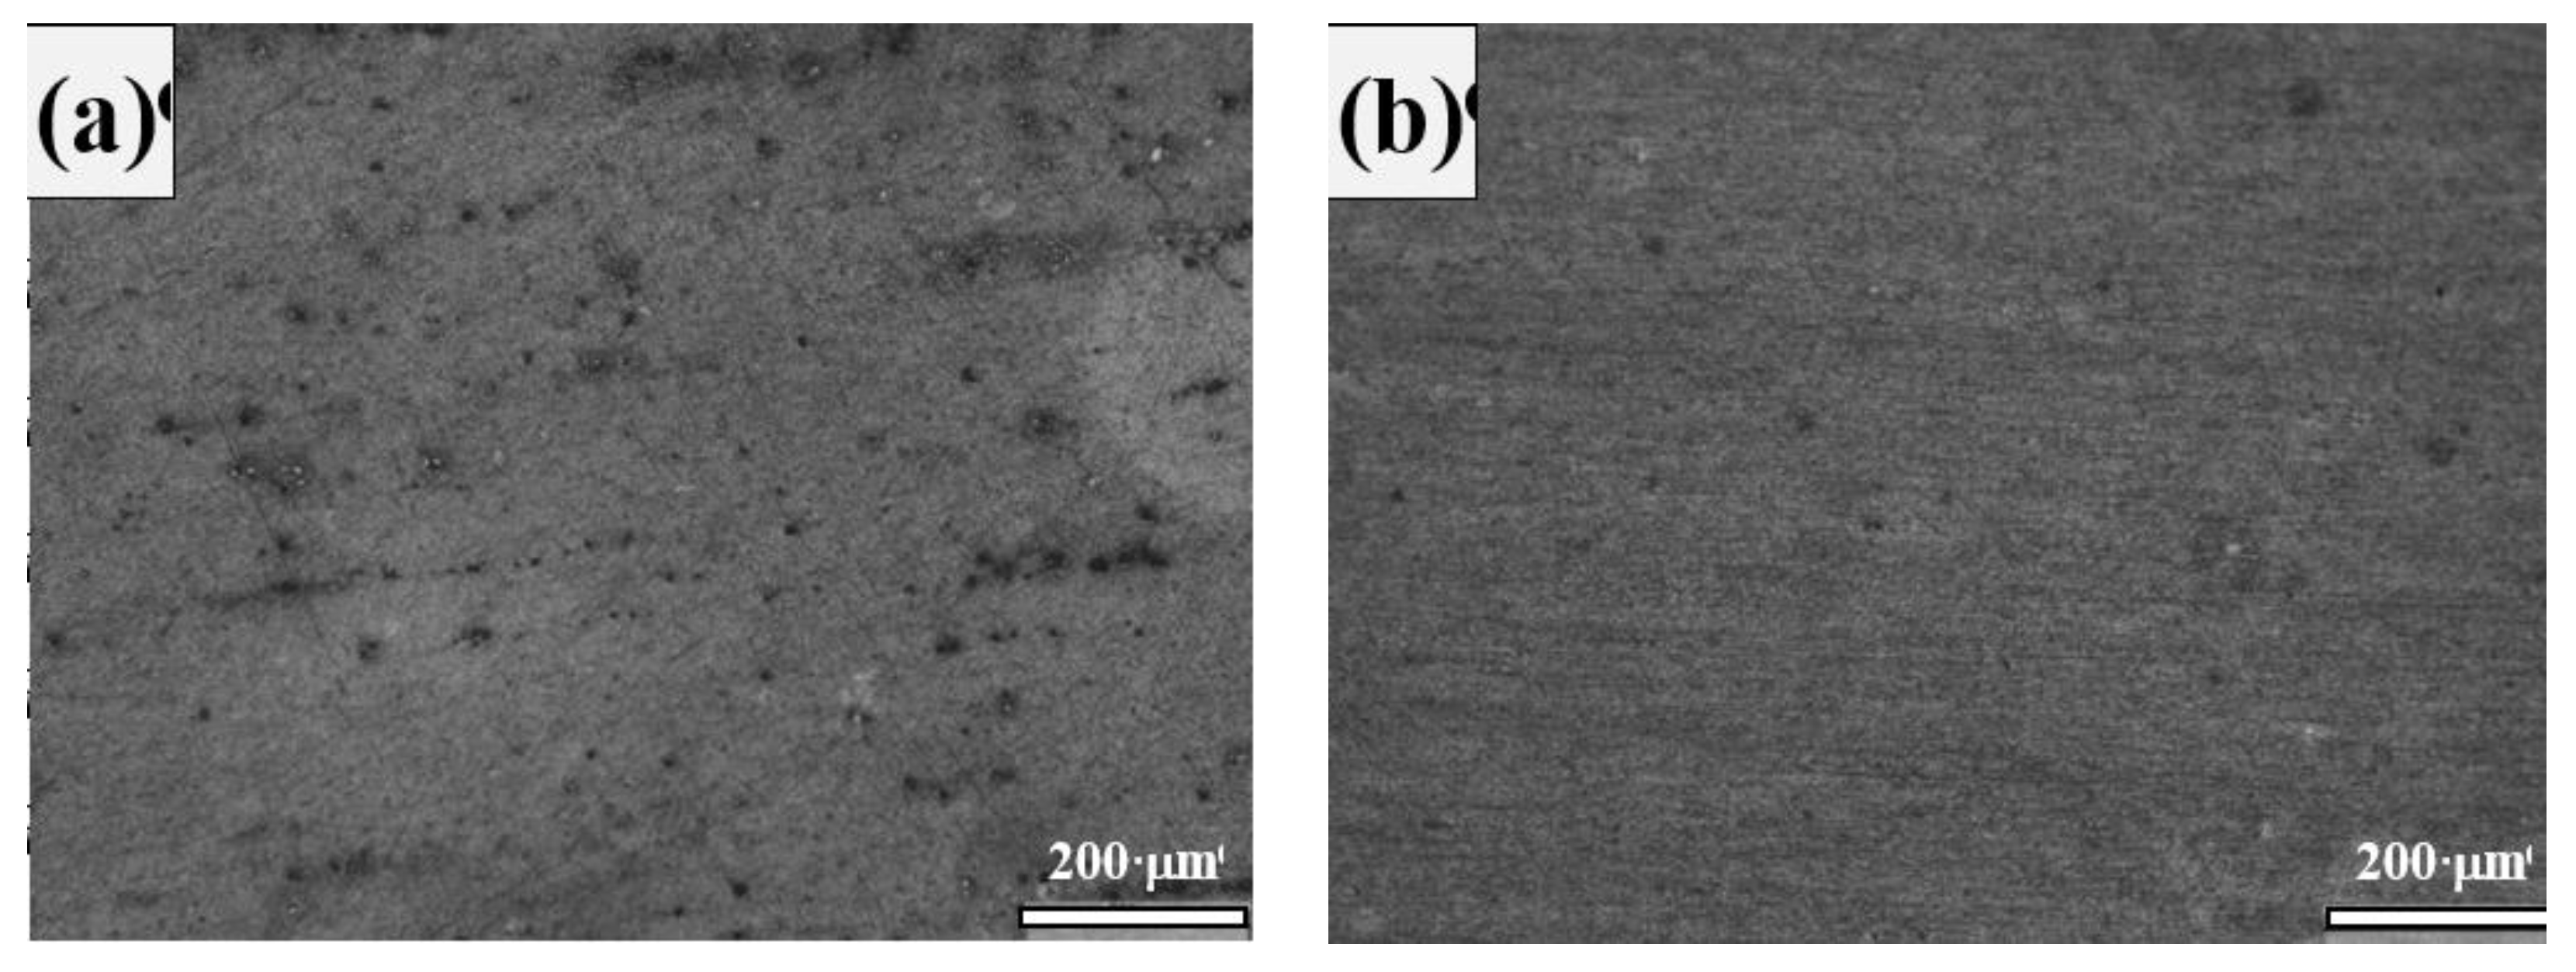
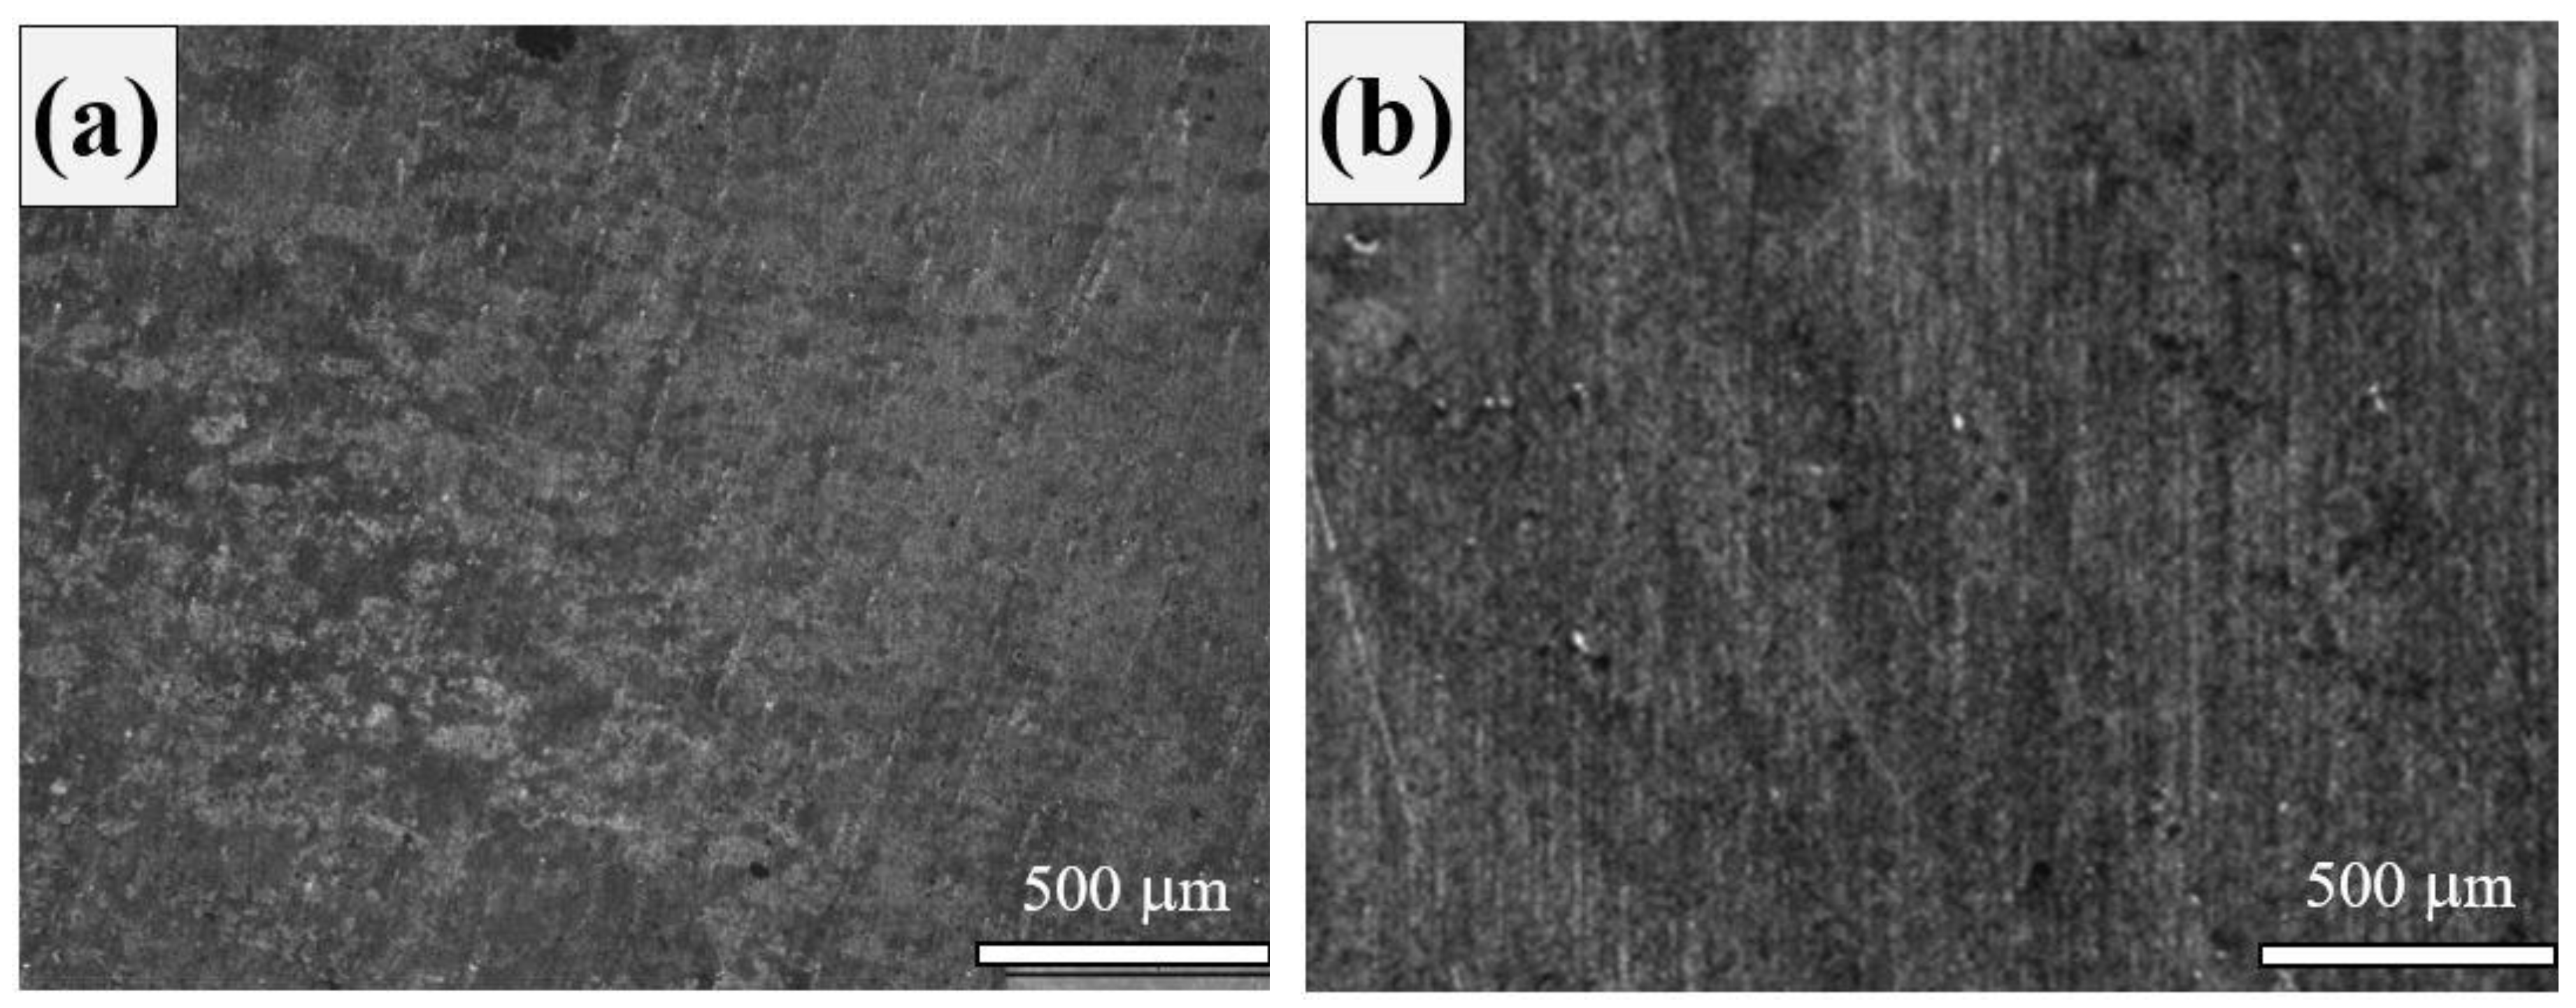
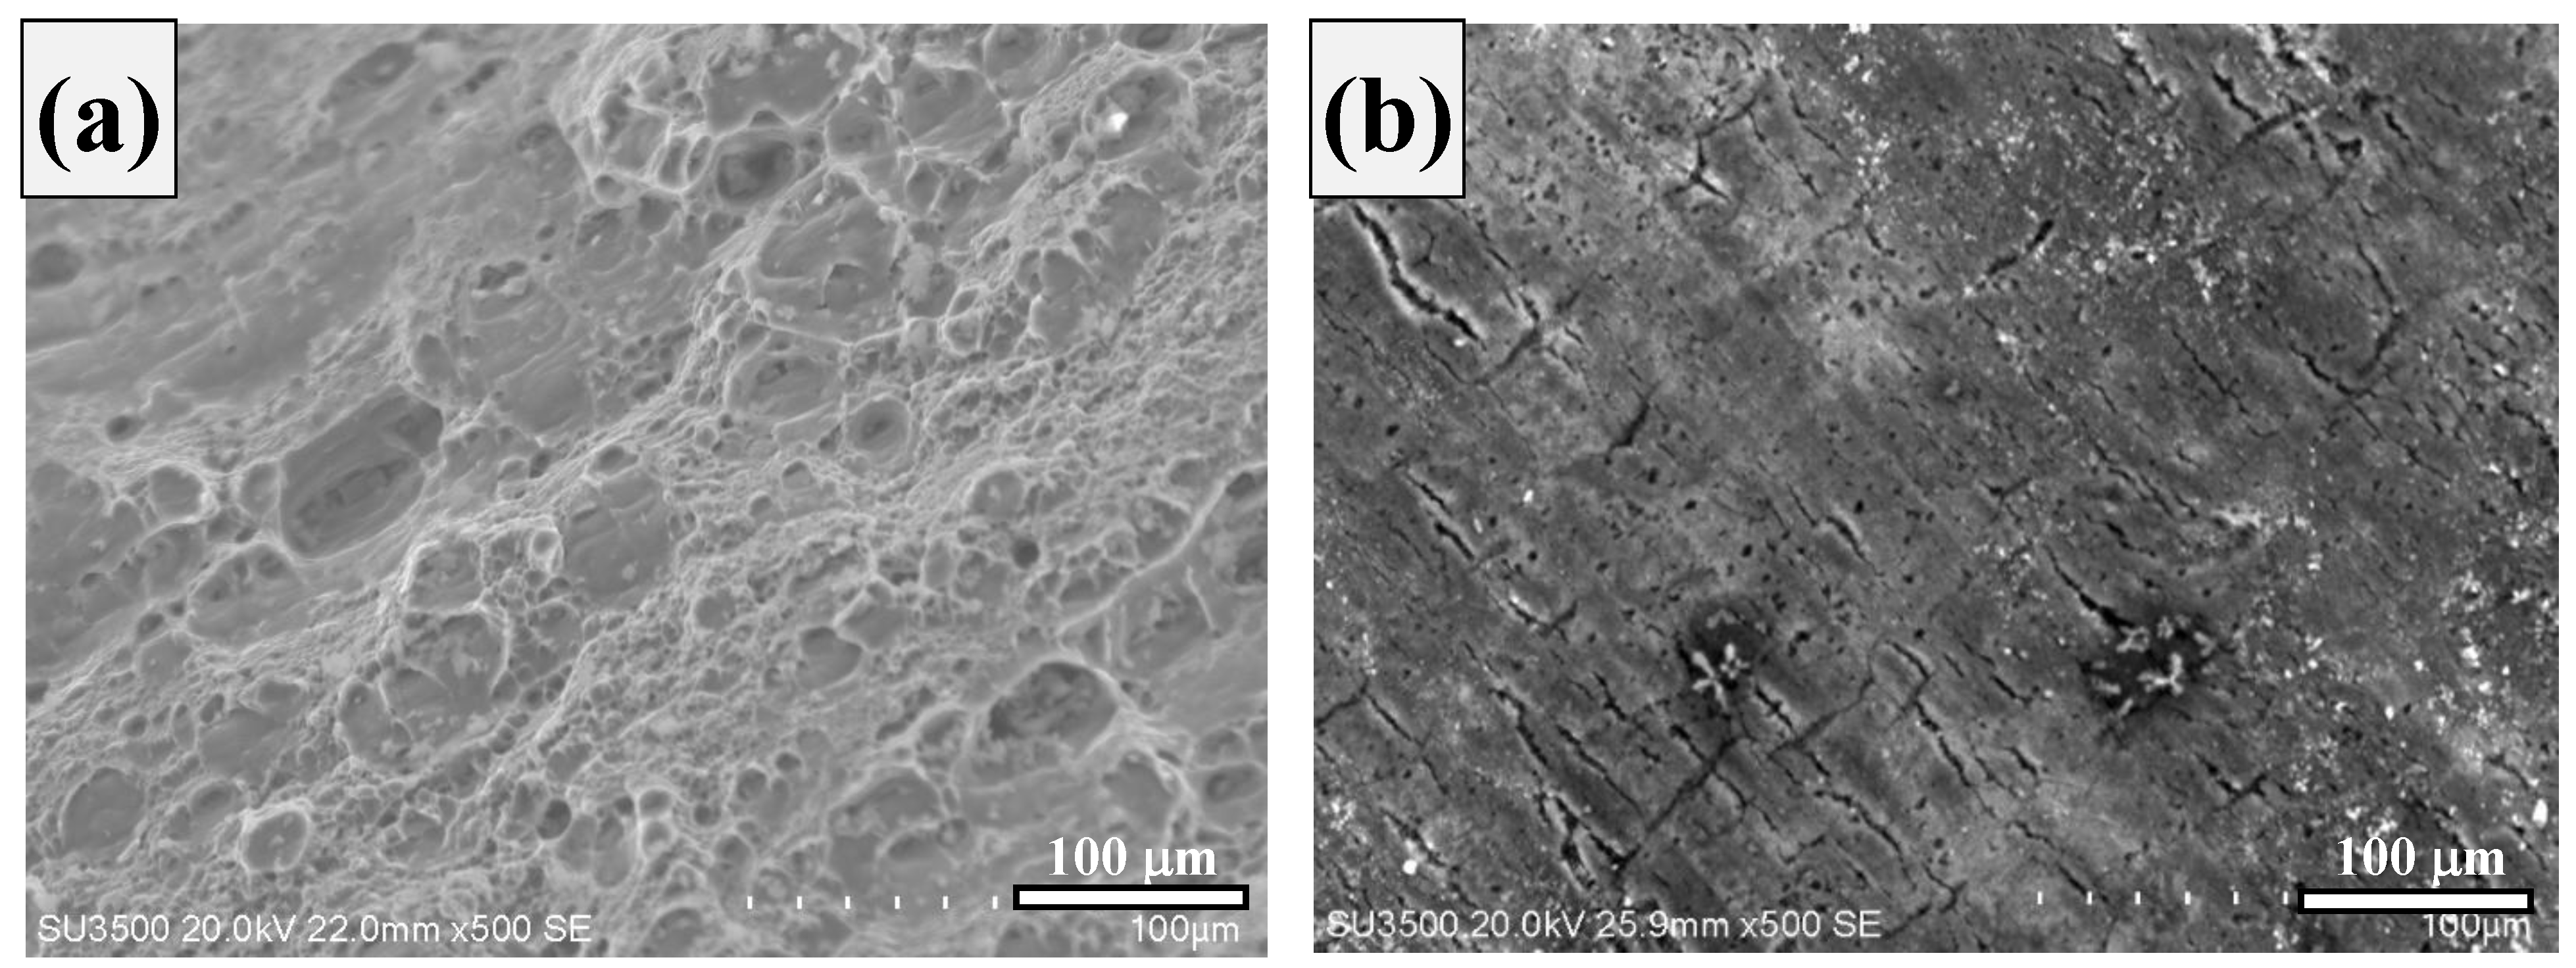
3.1. Microstructure
3.2. Hardness
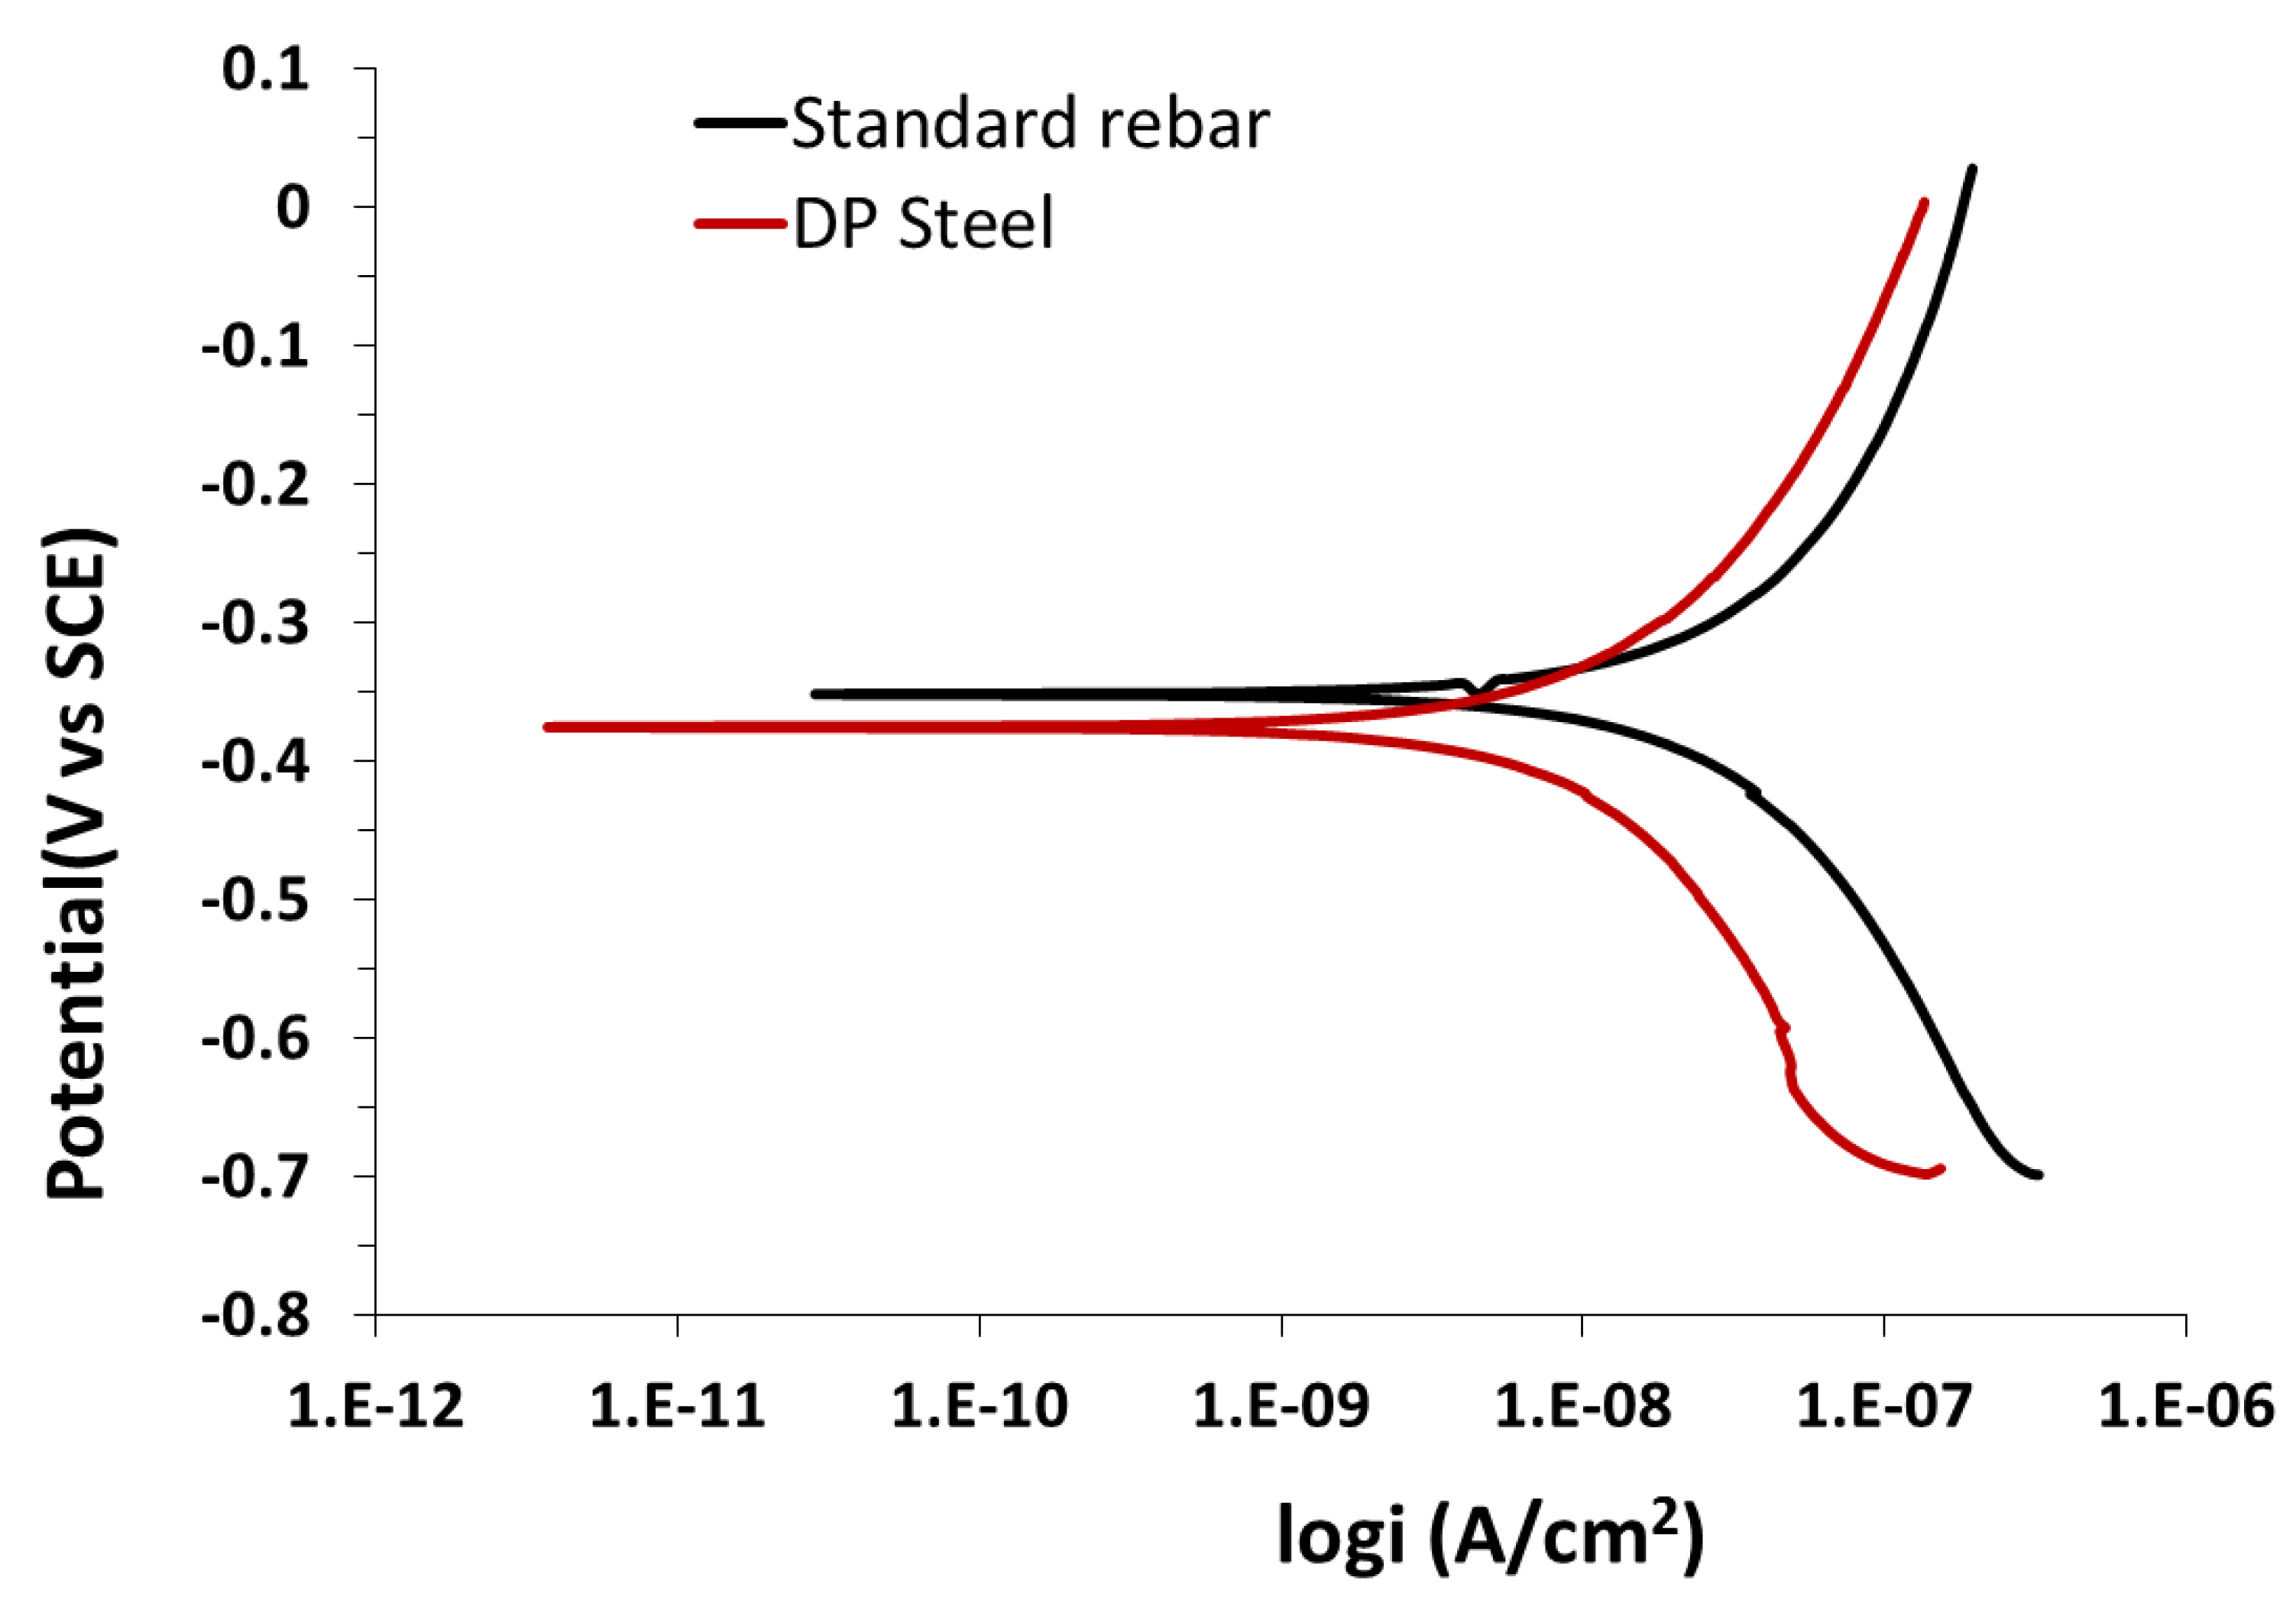
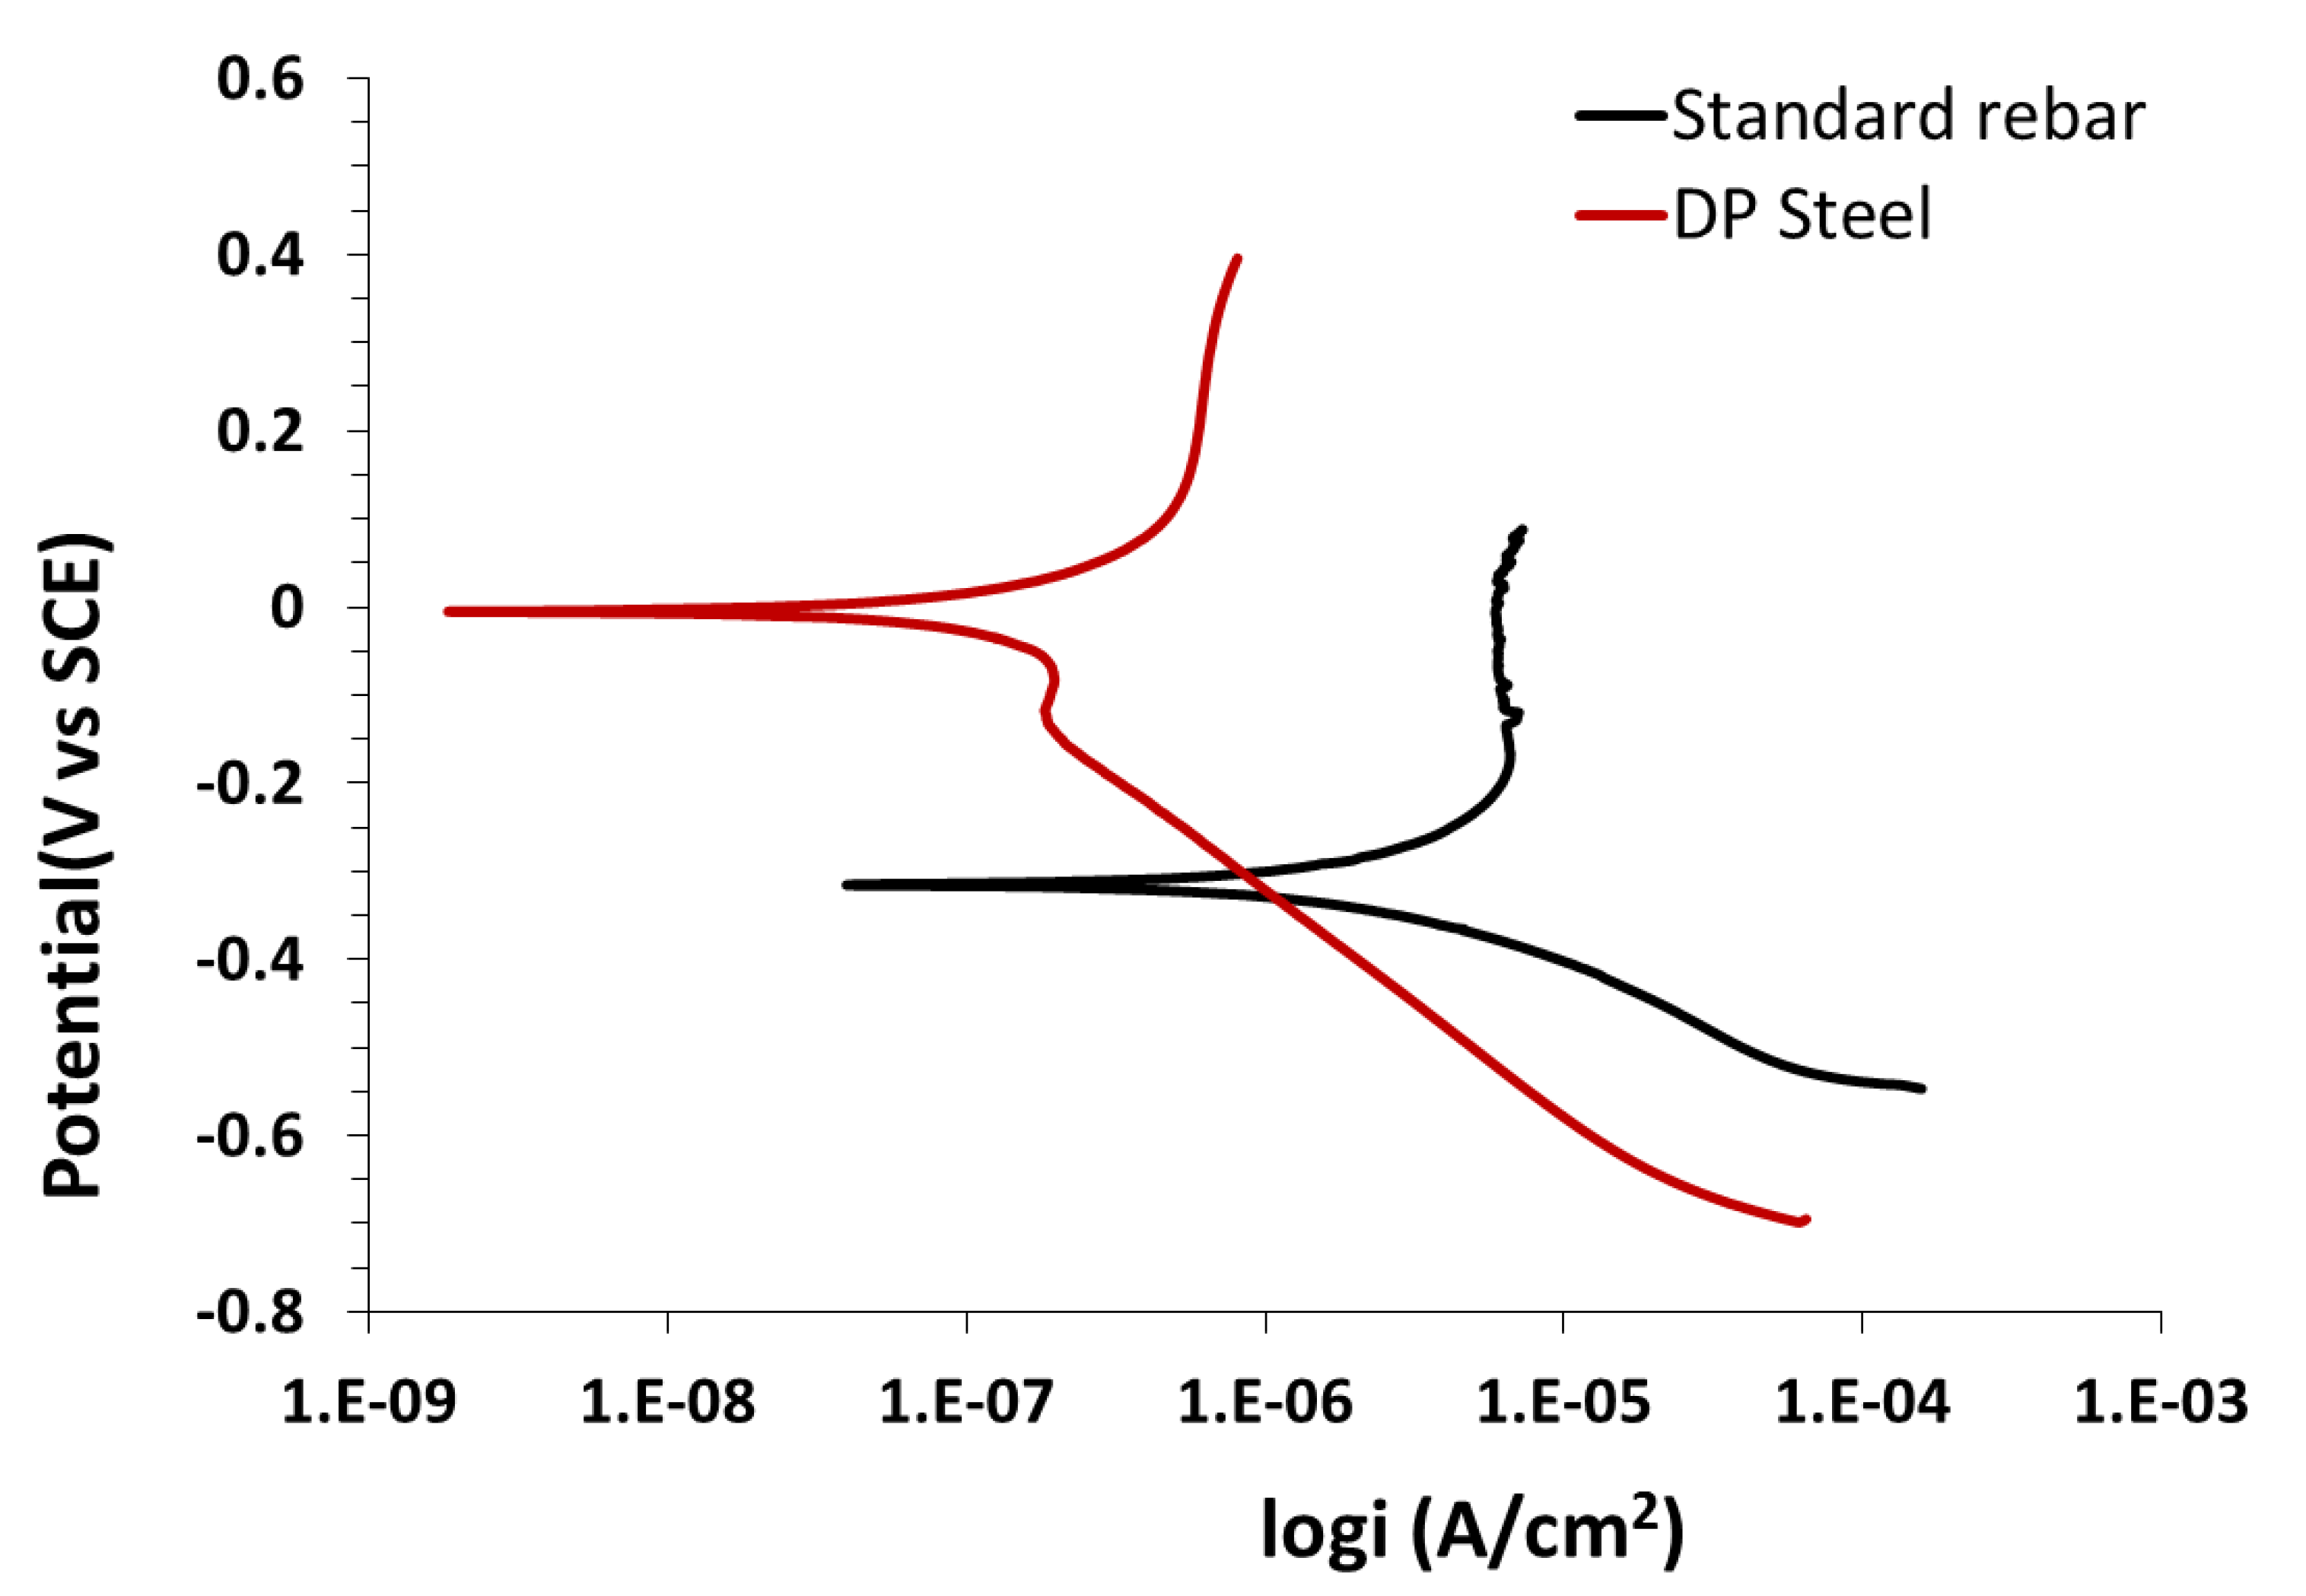
3.3. Potentiodynamic Polarization
3.3.1. NaOH (0.9 M, pH = 13.9) + 0.2% Cl− Solutions
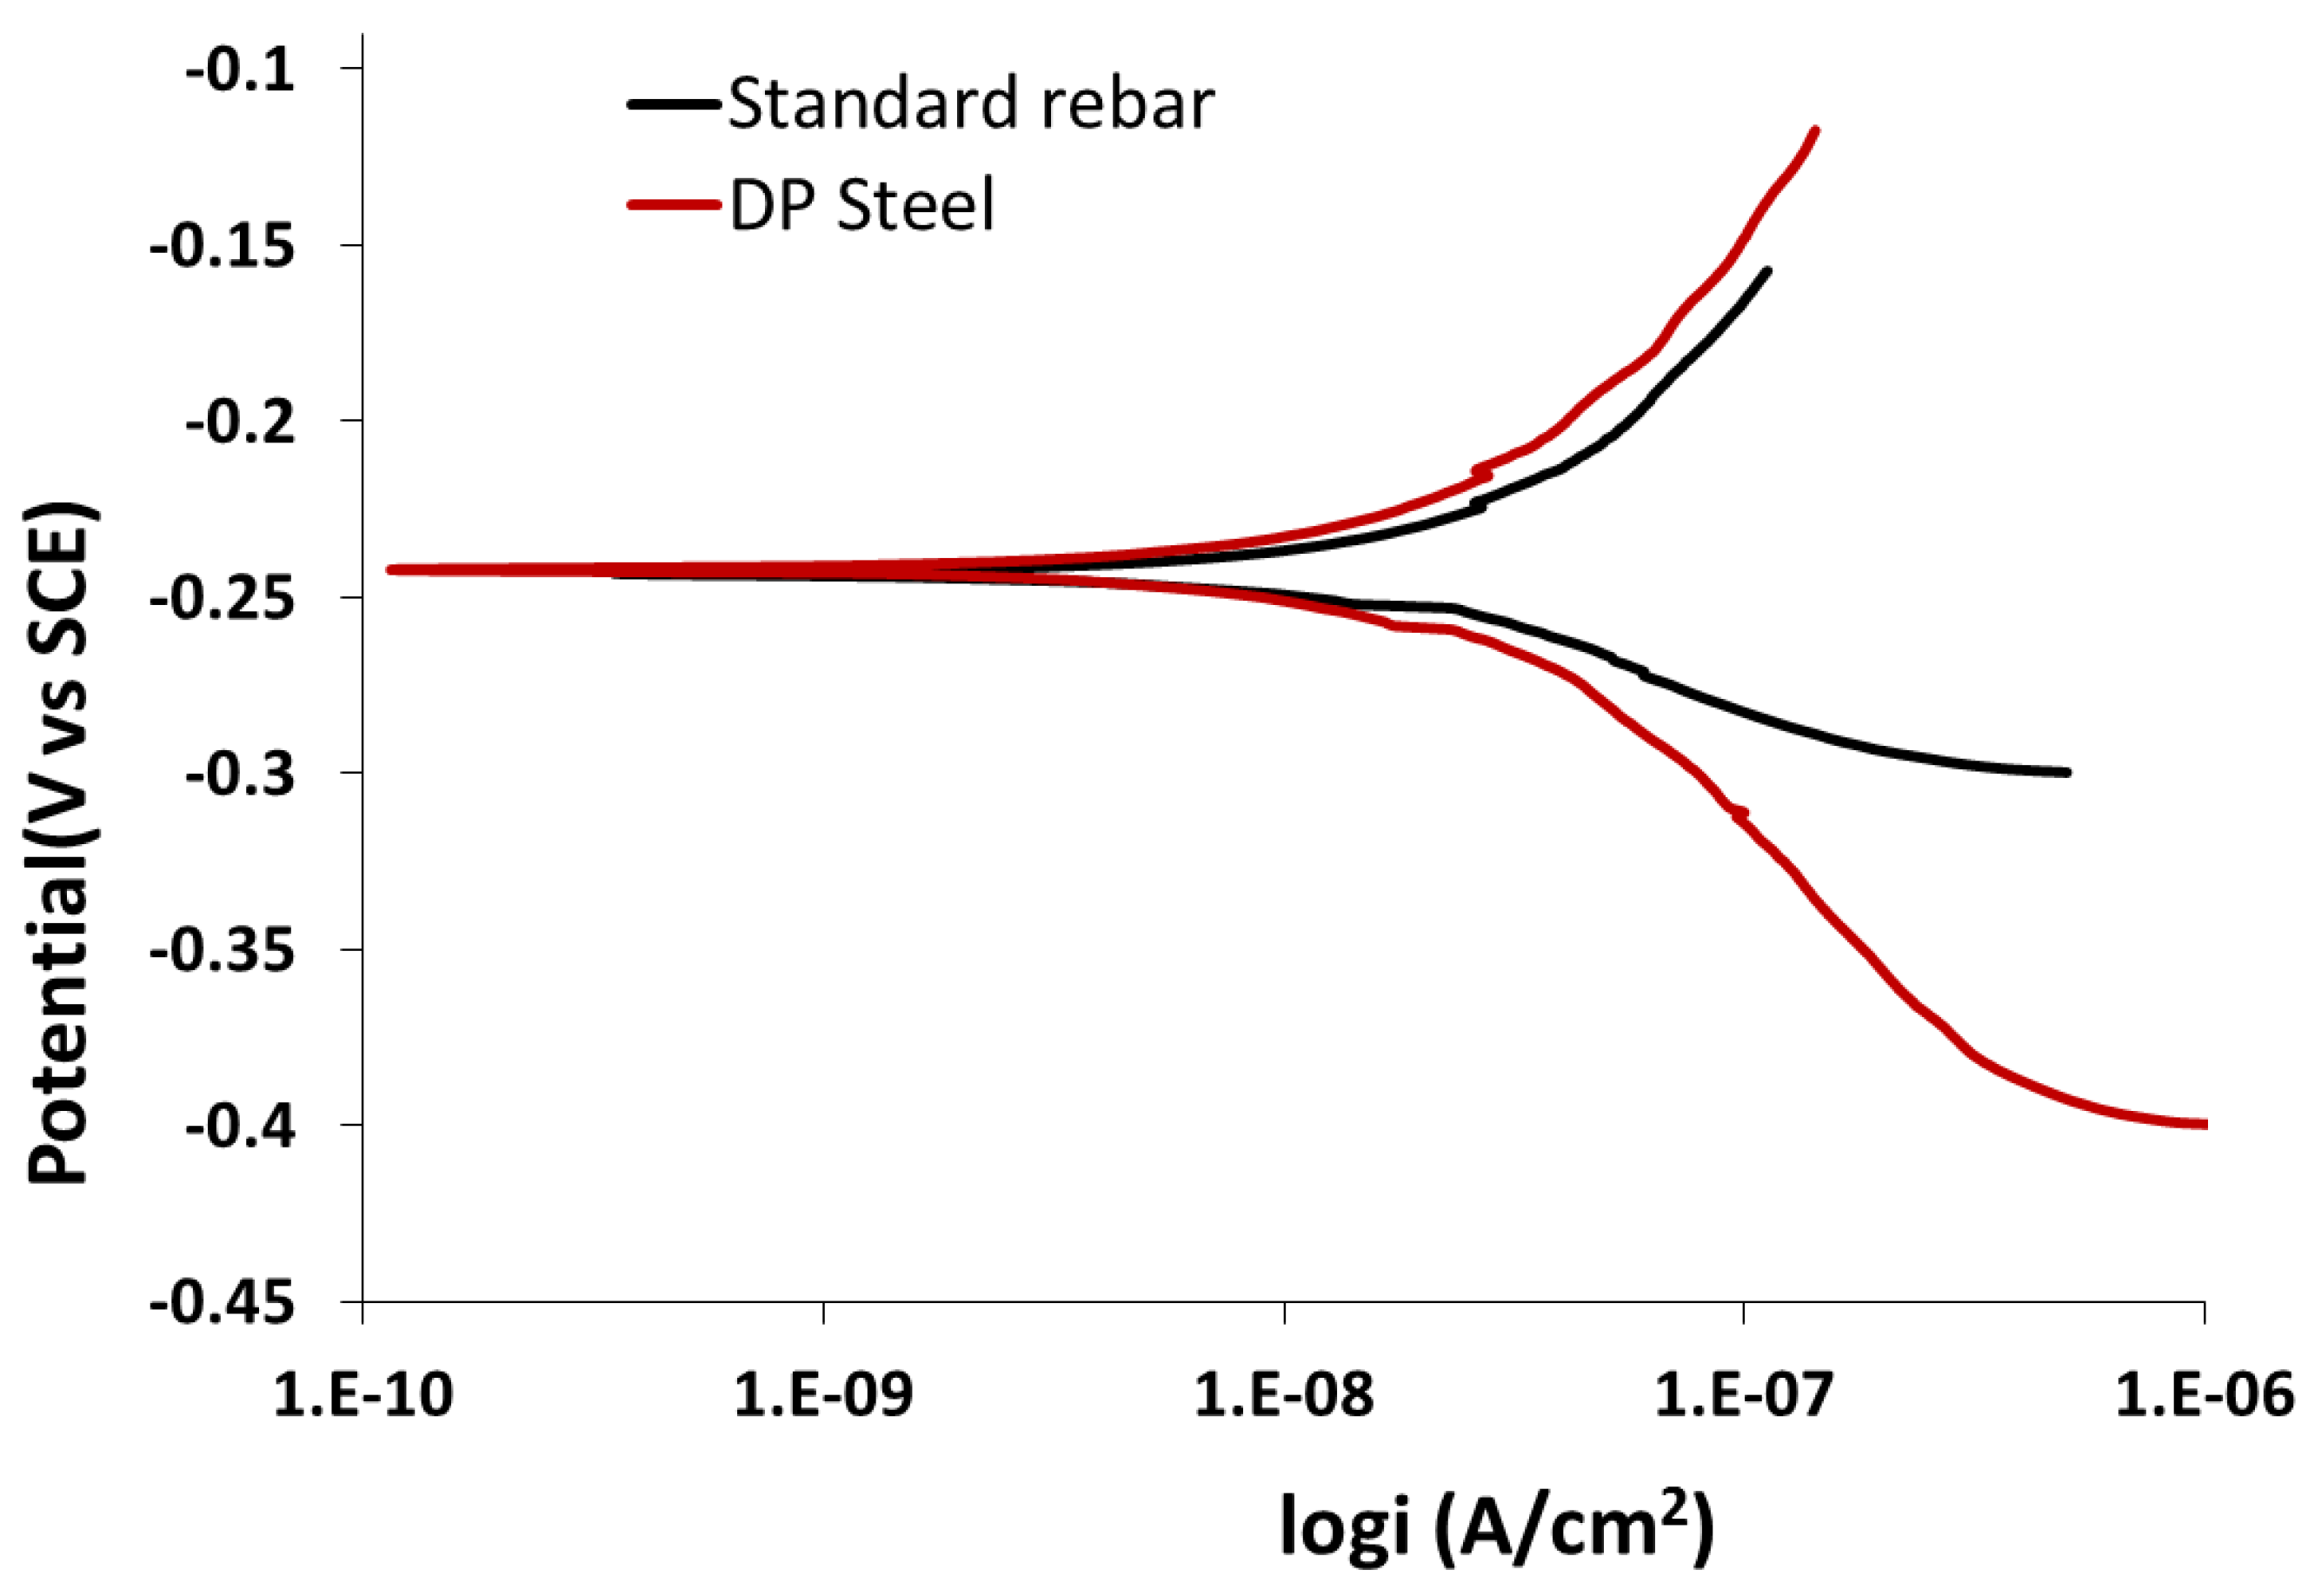
3.3.2. Saturated Ca(OH)2 (pH = 12.5) + 0.2% Cl− Solutions
3.3.3. 0.3 M NaHCO3 + 0.1 M Na2CO3 (pH = 9.0) Solution
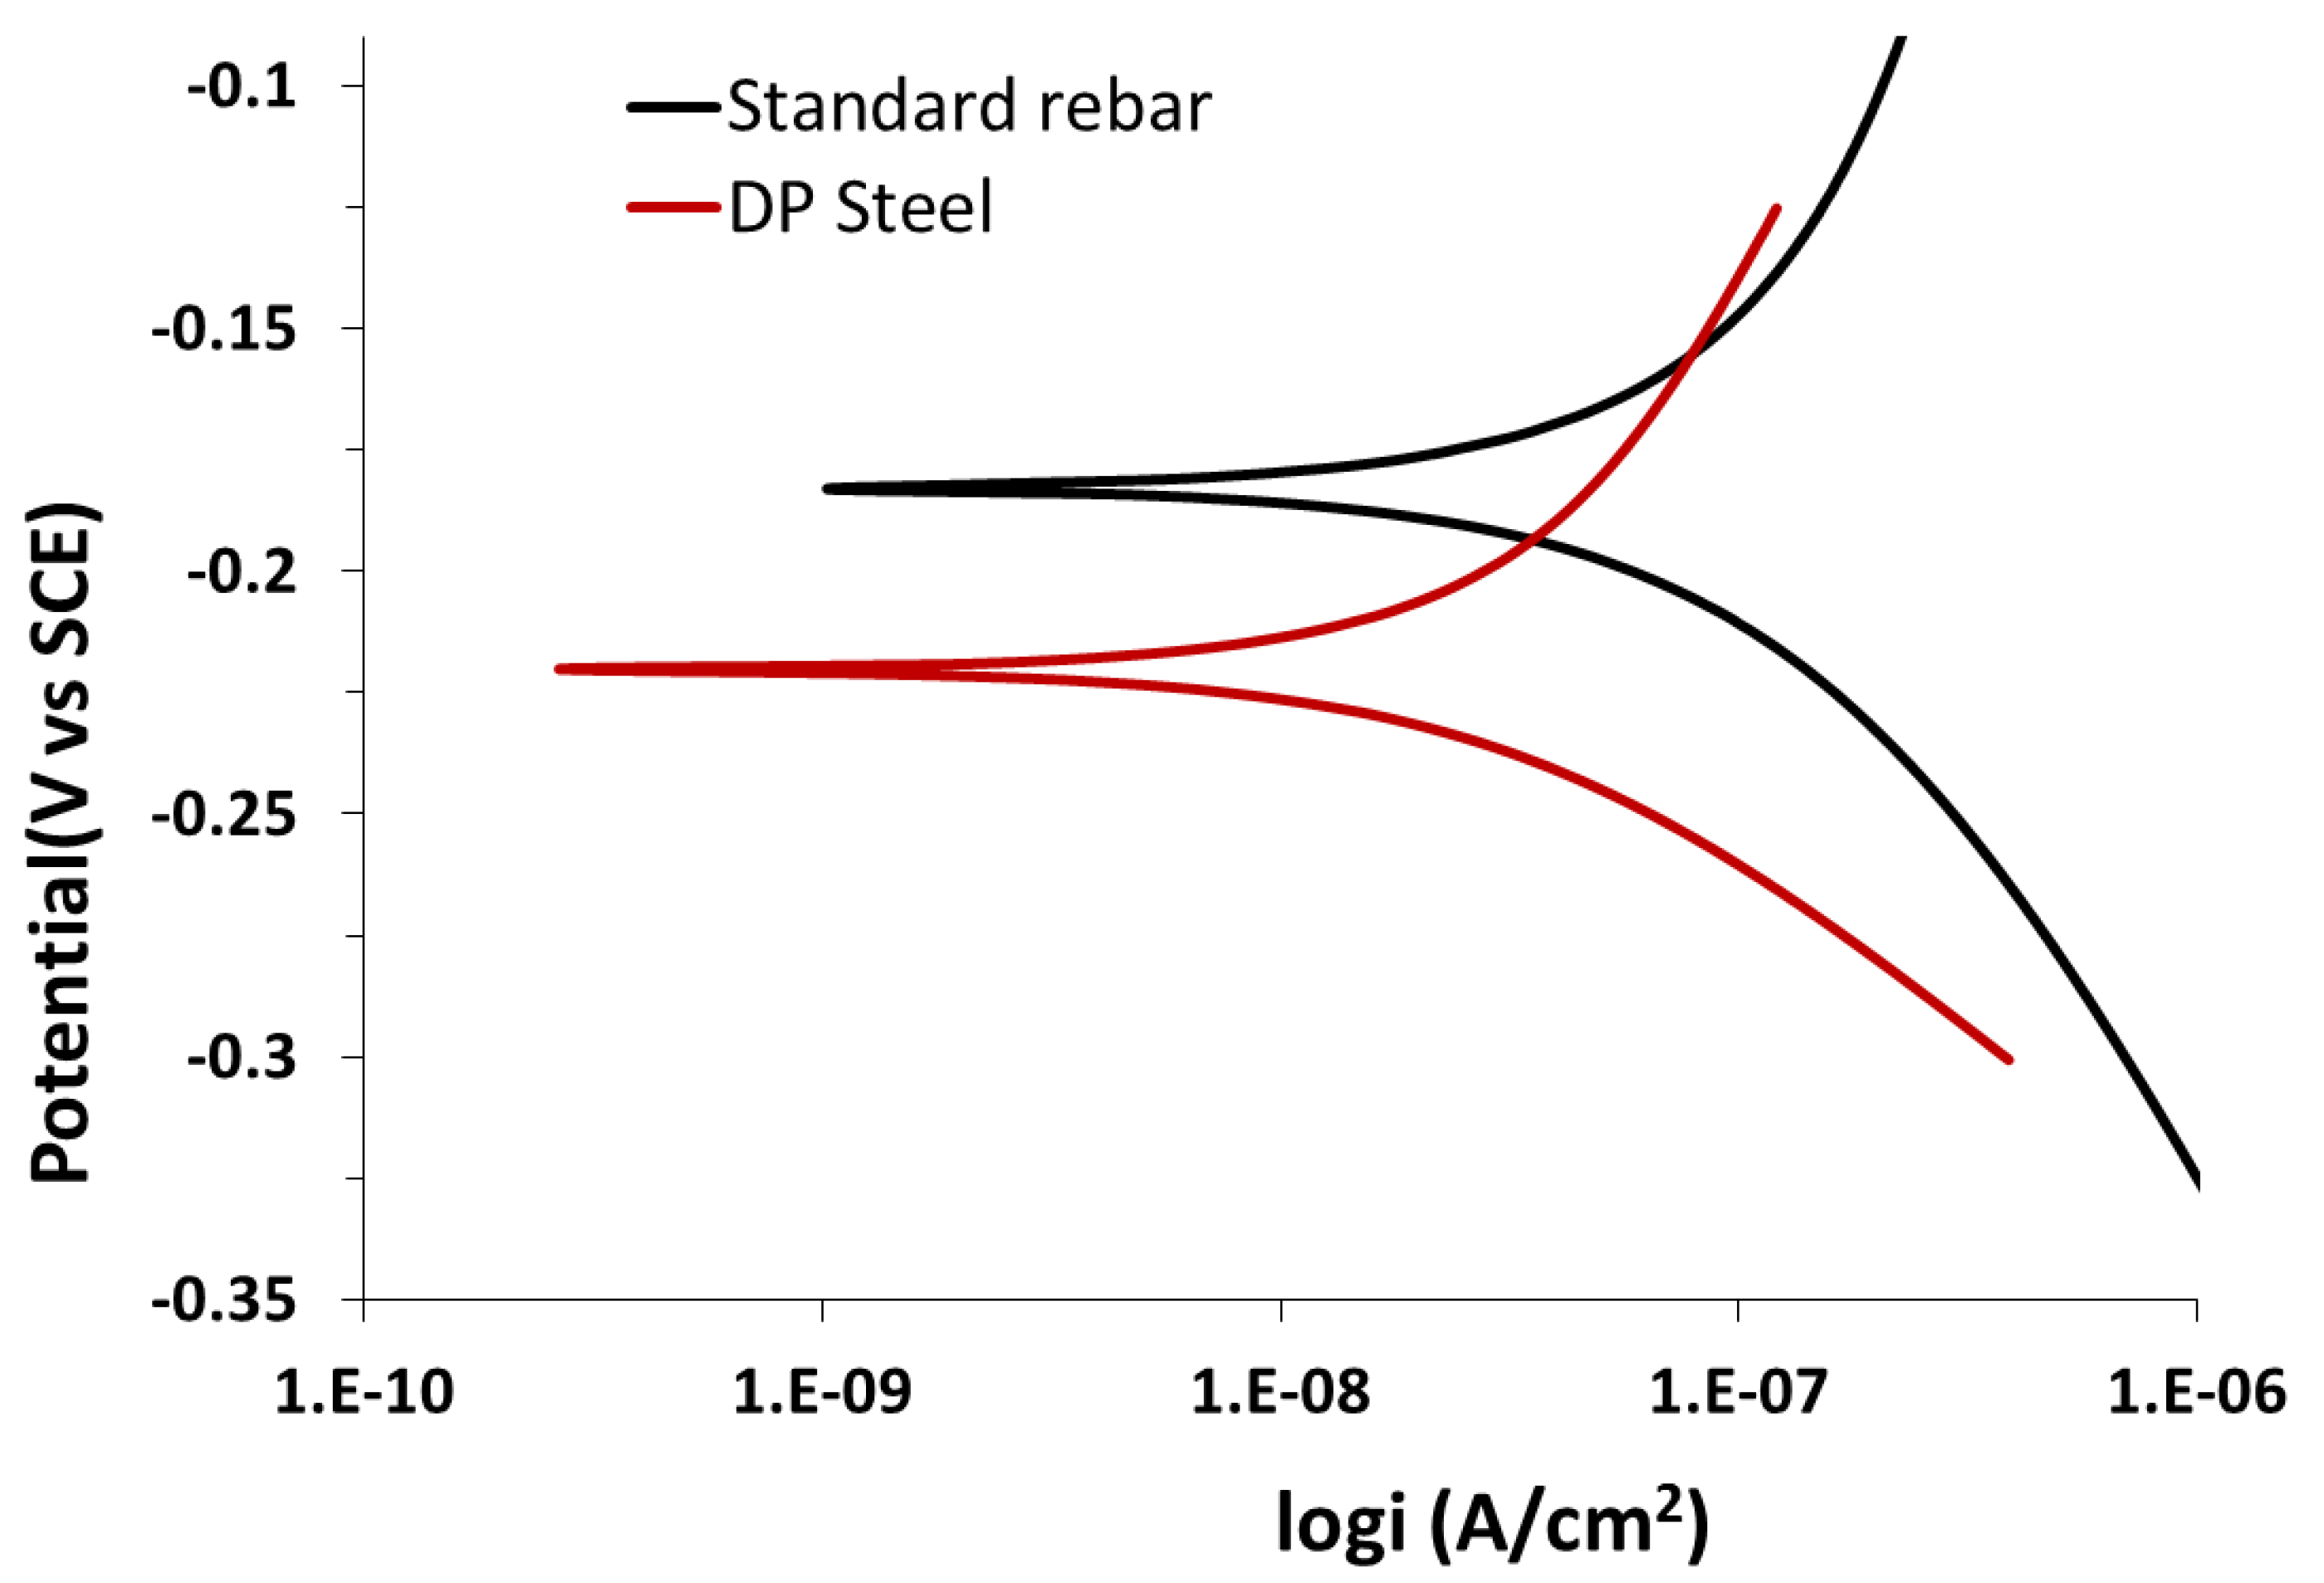
3.3.4. 0.015 M NaHCO3 + 0.005 M Na2CO3 (pH = 9.0) Solution
4. Discussion
5. Conclusions
- DP steel preserves its passive state in highly alkaline media and environments (i.e., high-carbonate/bicarbonate concentrations), even in the high potential range. A generalized corrosion of DP steel occurs at any potential that is higher than the free corrosion potential in the case of low carbonate/bicarbonate concentrations because there is no chance of passivation.
- From a mechanical point of view, the pitting process is mainly affected by the degree of alkalinity of the solution (i.e., carbonate/bicarbonate concentrations). In highly alkaline solutions, pitting is initiated by the laceration of the passive layer, while in low-concentration solutions, pitting initiates on surfaces that are subject to a generalized corrosion.
- The localized corrosion of DP steel can be improved by either increasing the solution pH or the alkalinity degree, which has a salutary effect on chloride effectiveness. Chloride plays an important role in increasing the corrosion rate by breaking the passive layer. Thus, in order to protect a structure from corrosion, the alkalinity of the solution should be increased (i.e., the pH should be high).
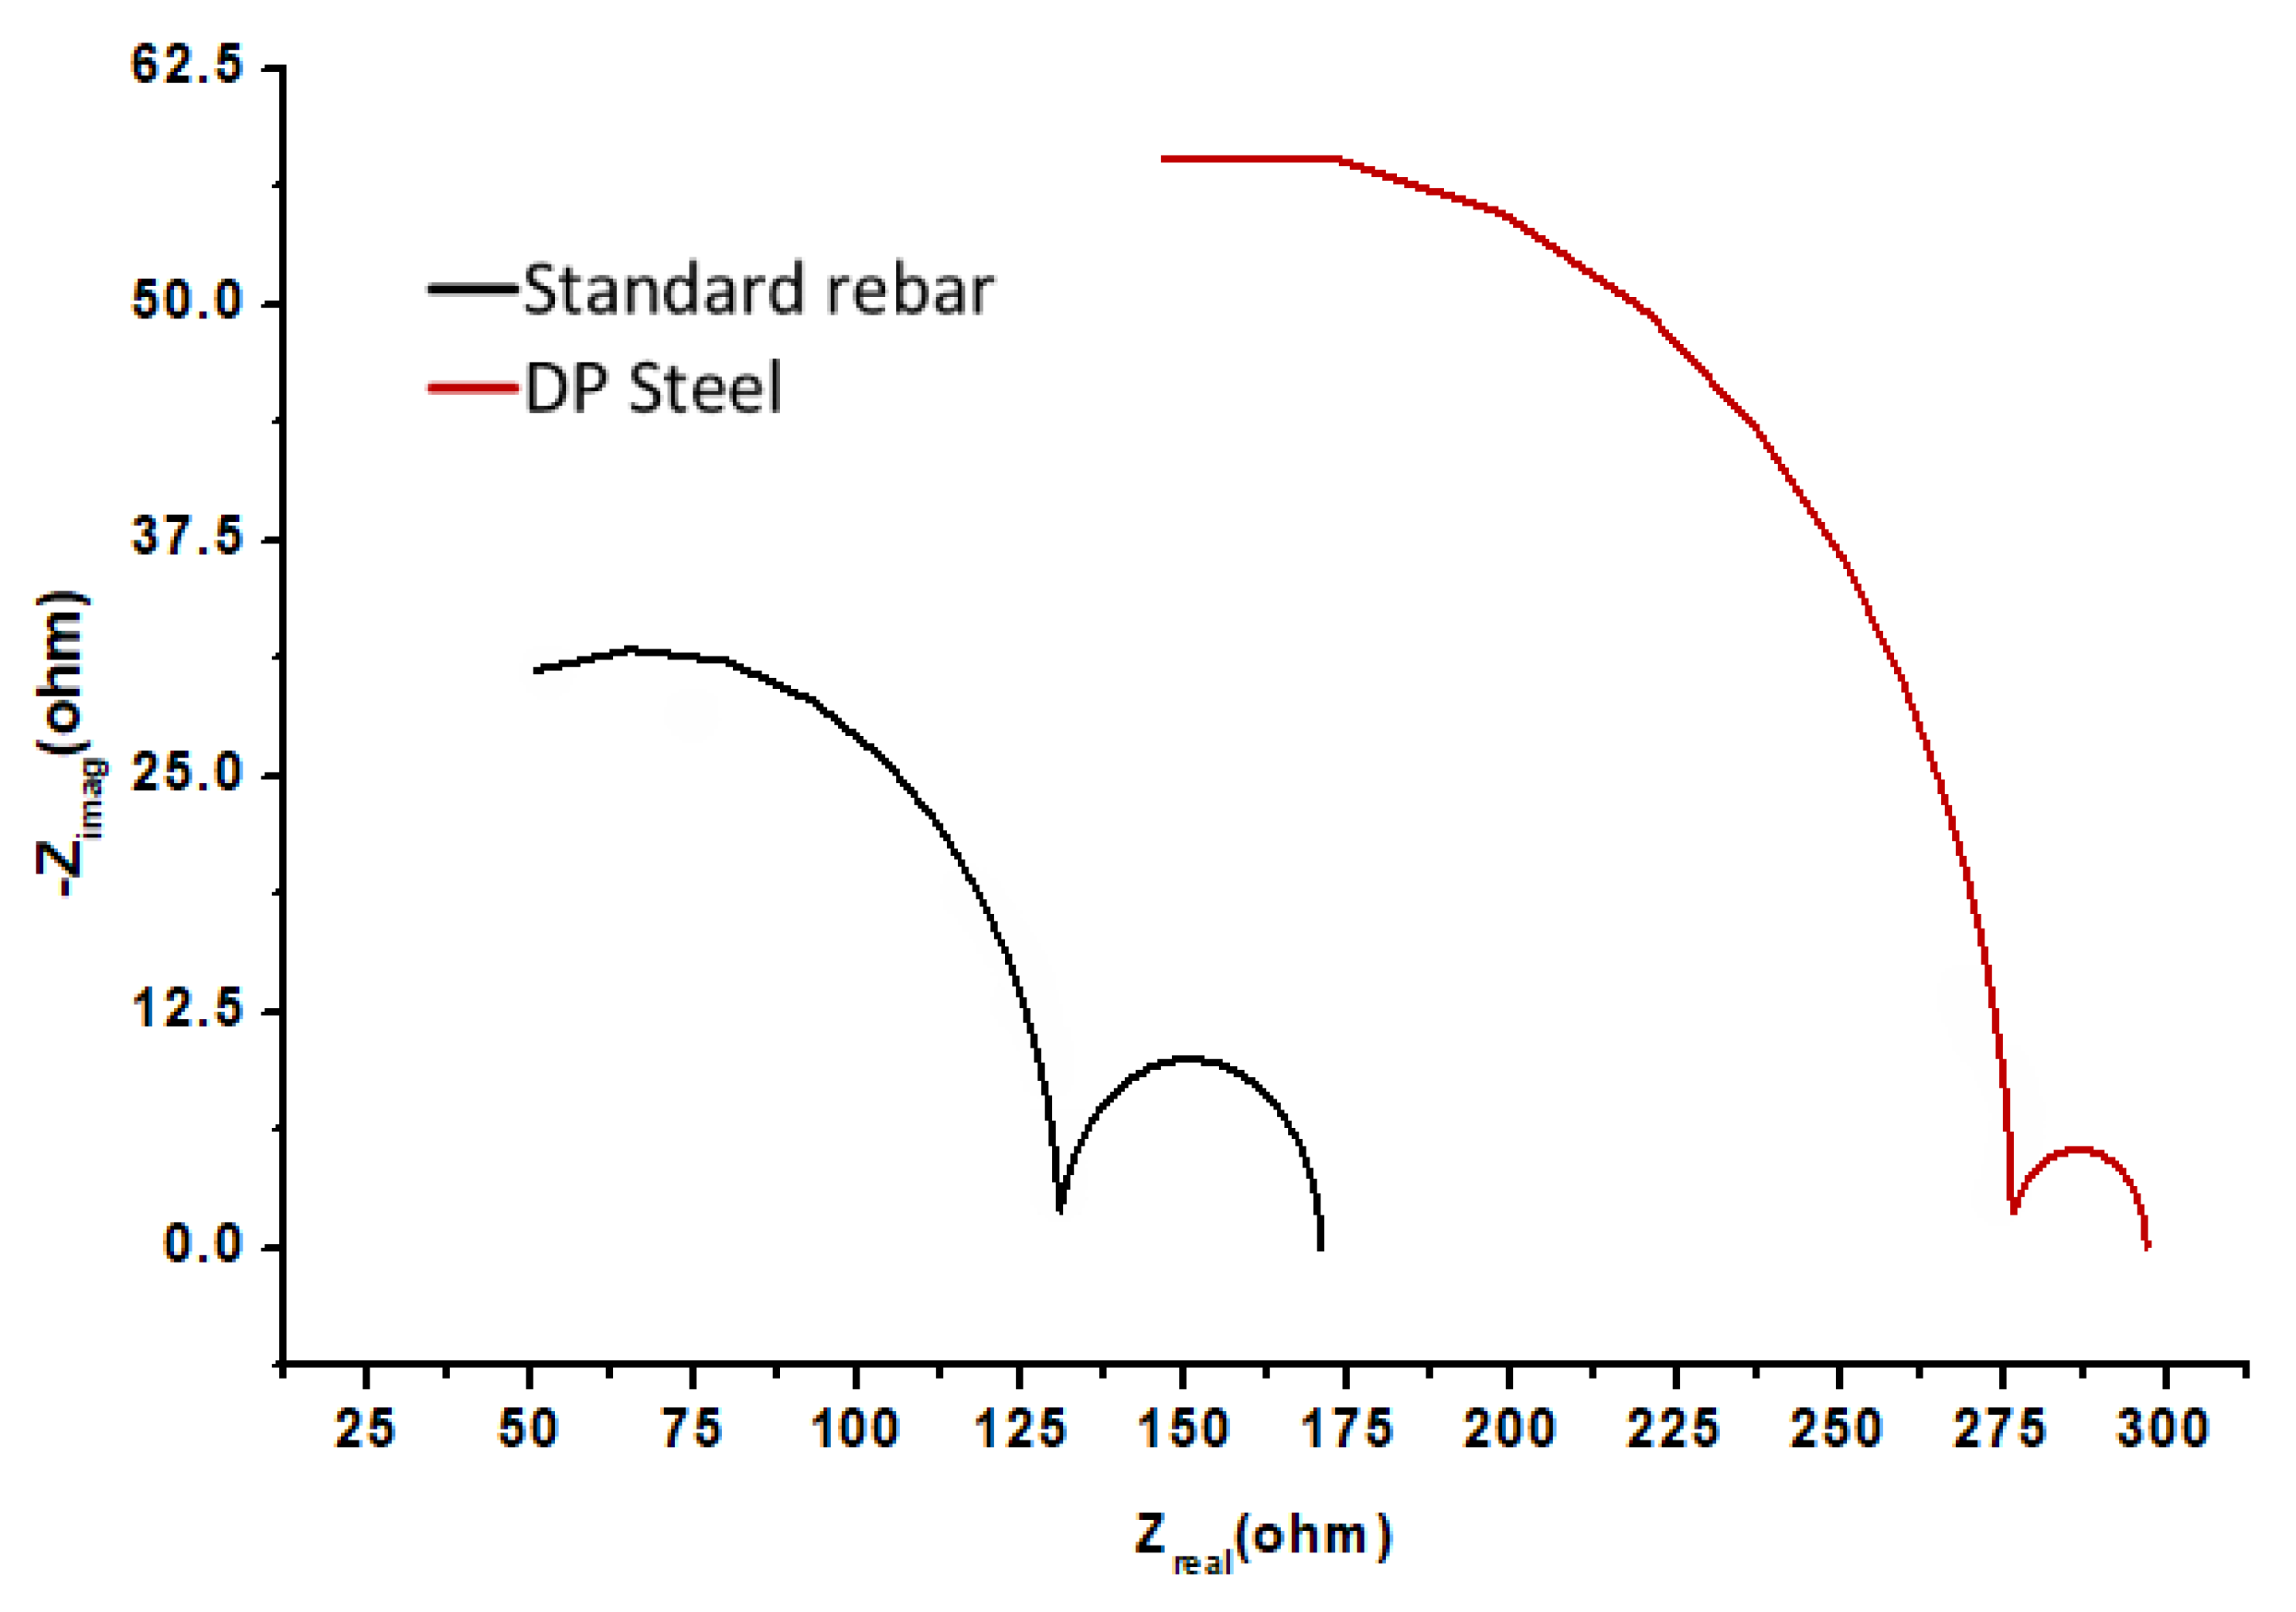
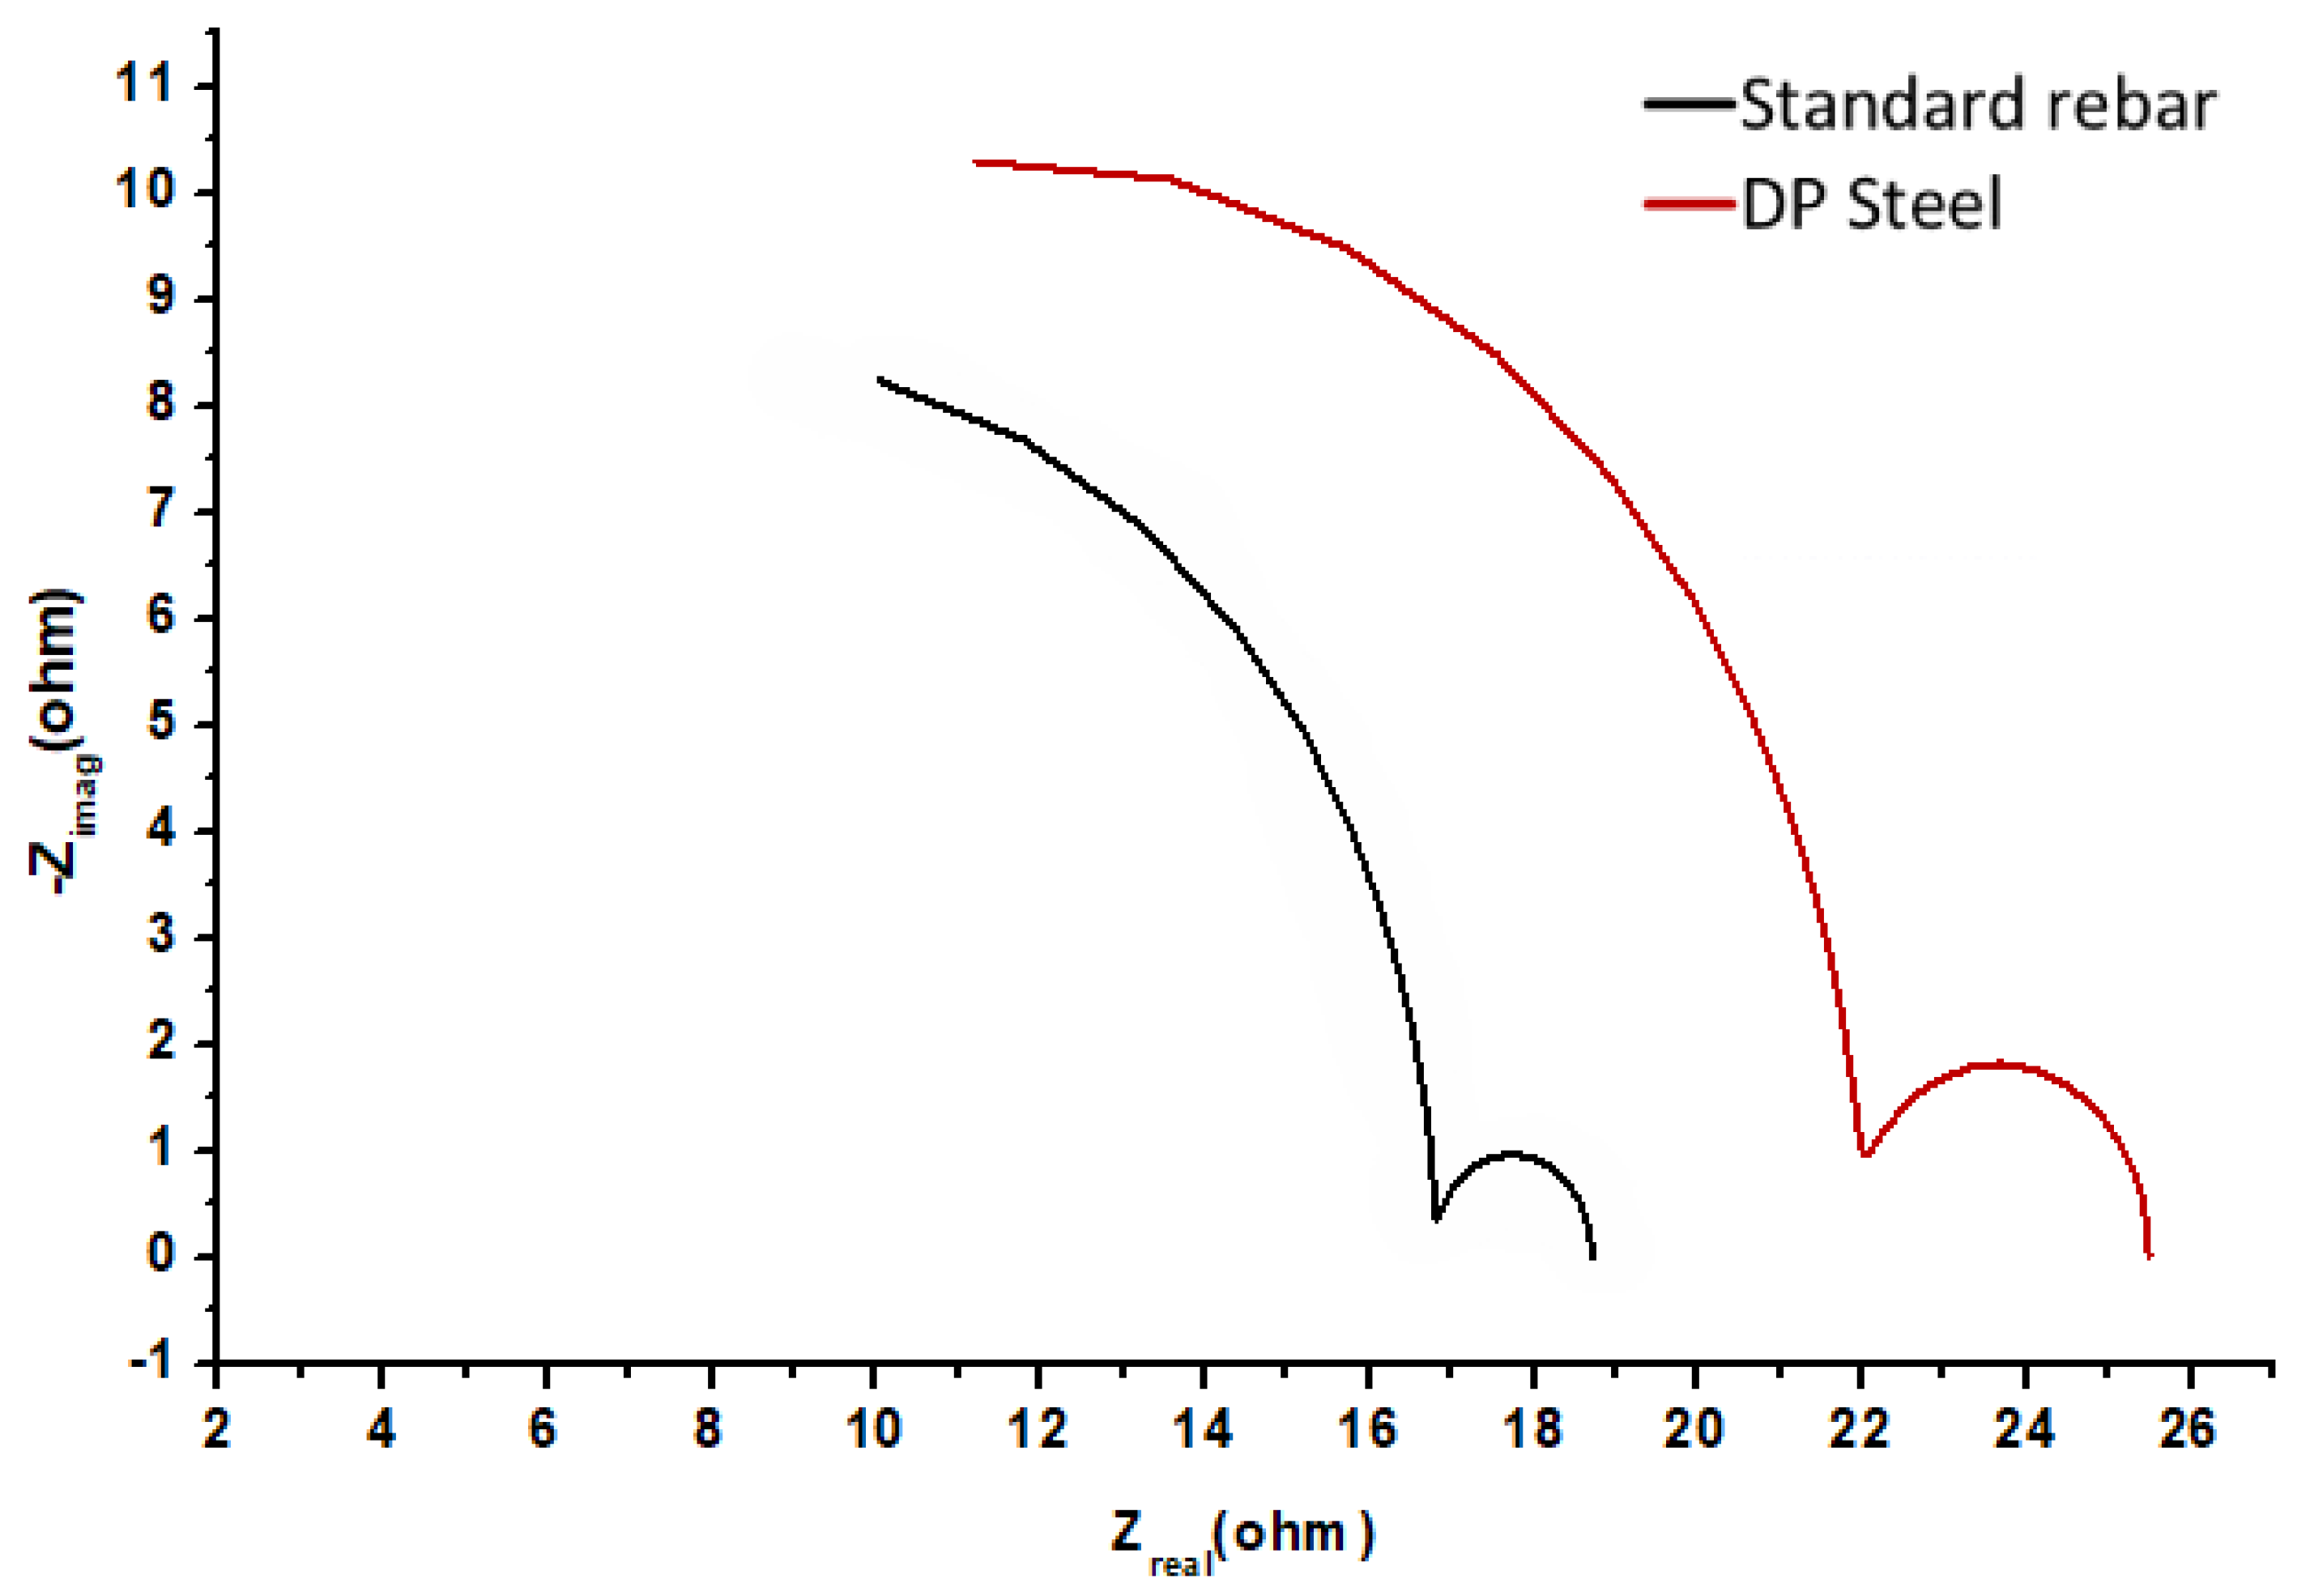
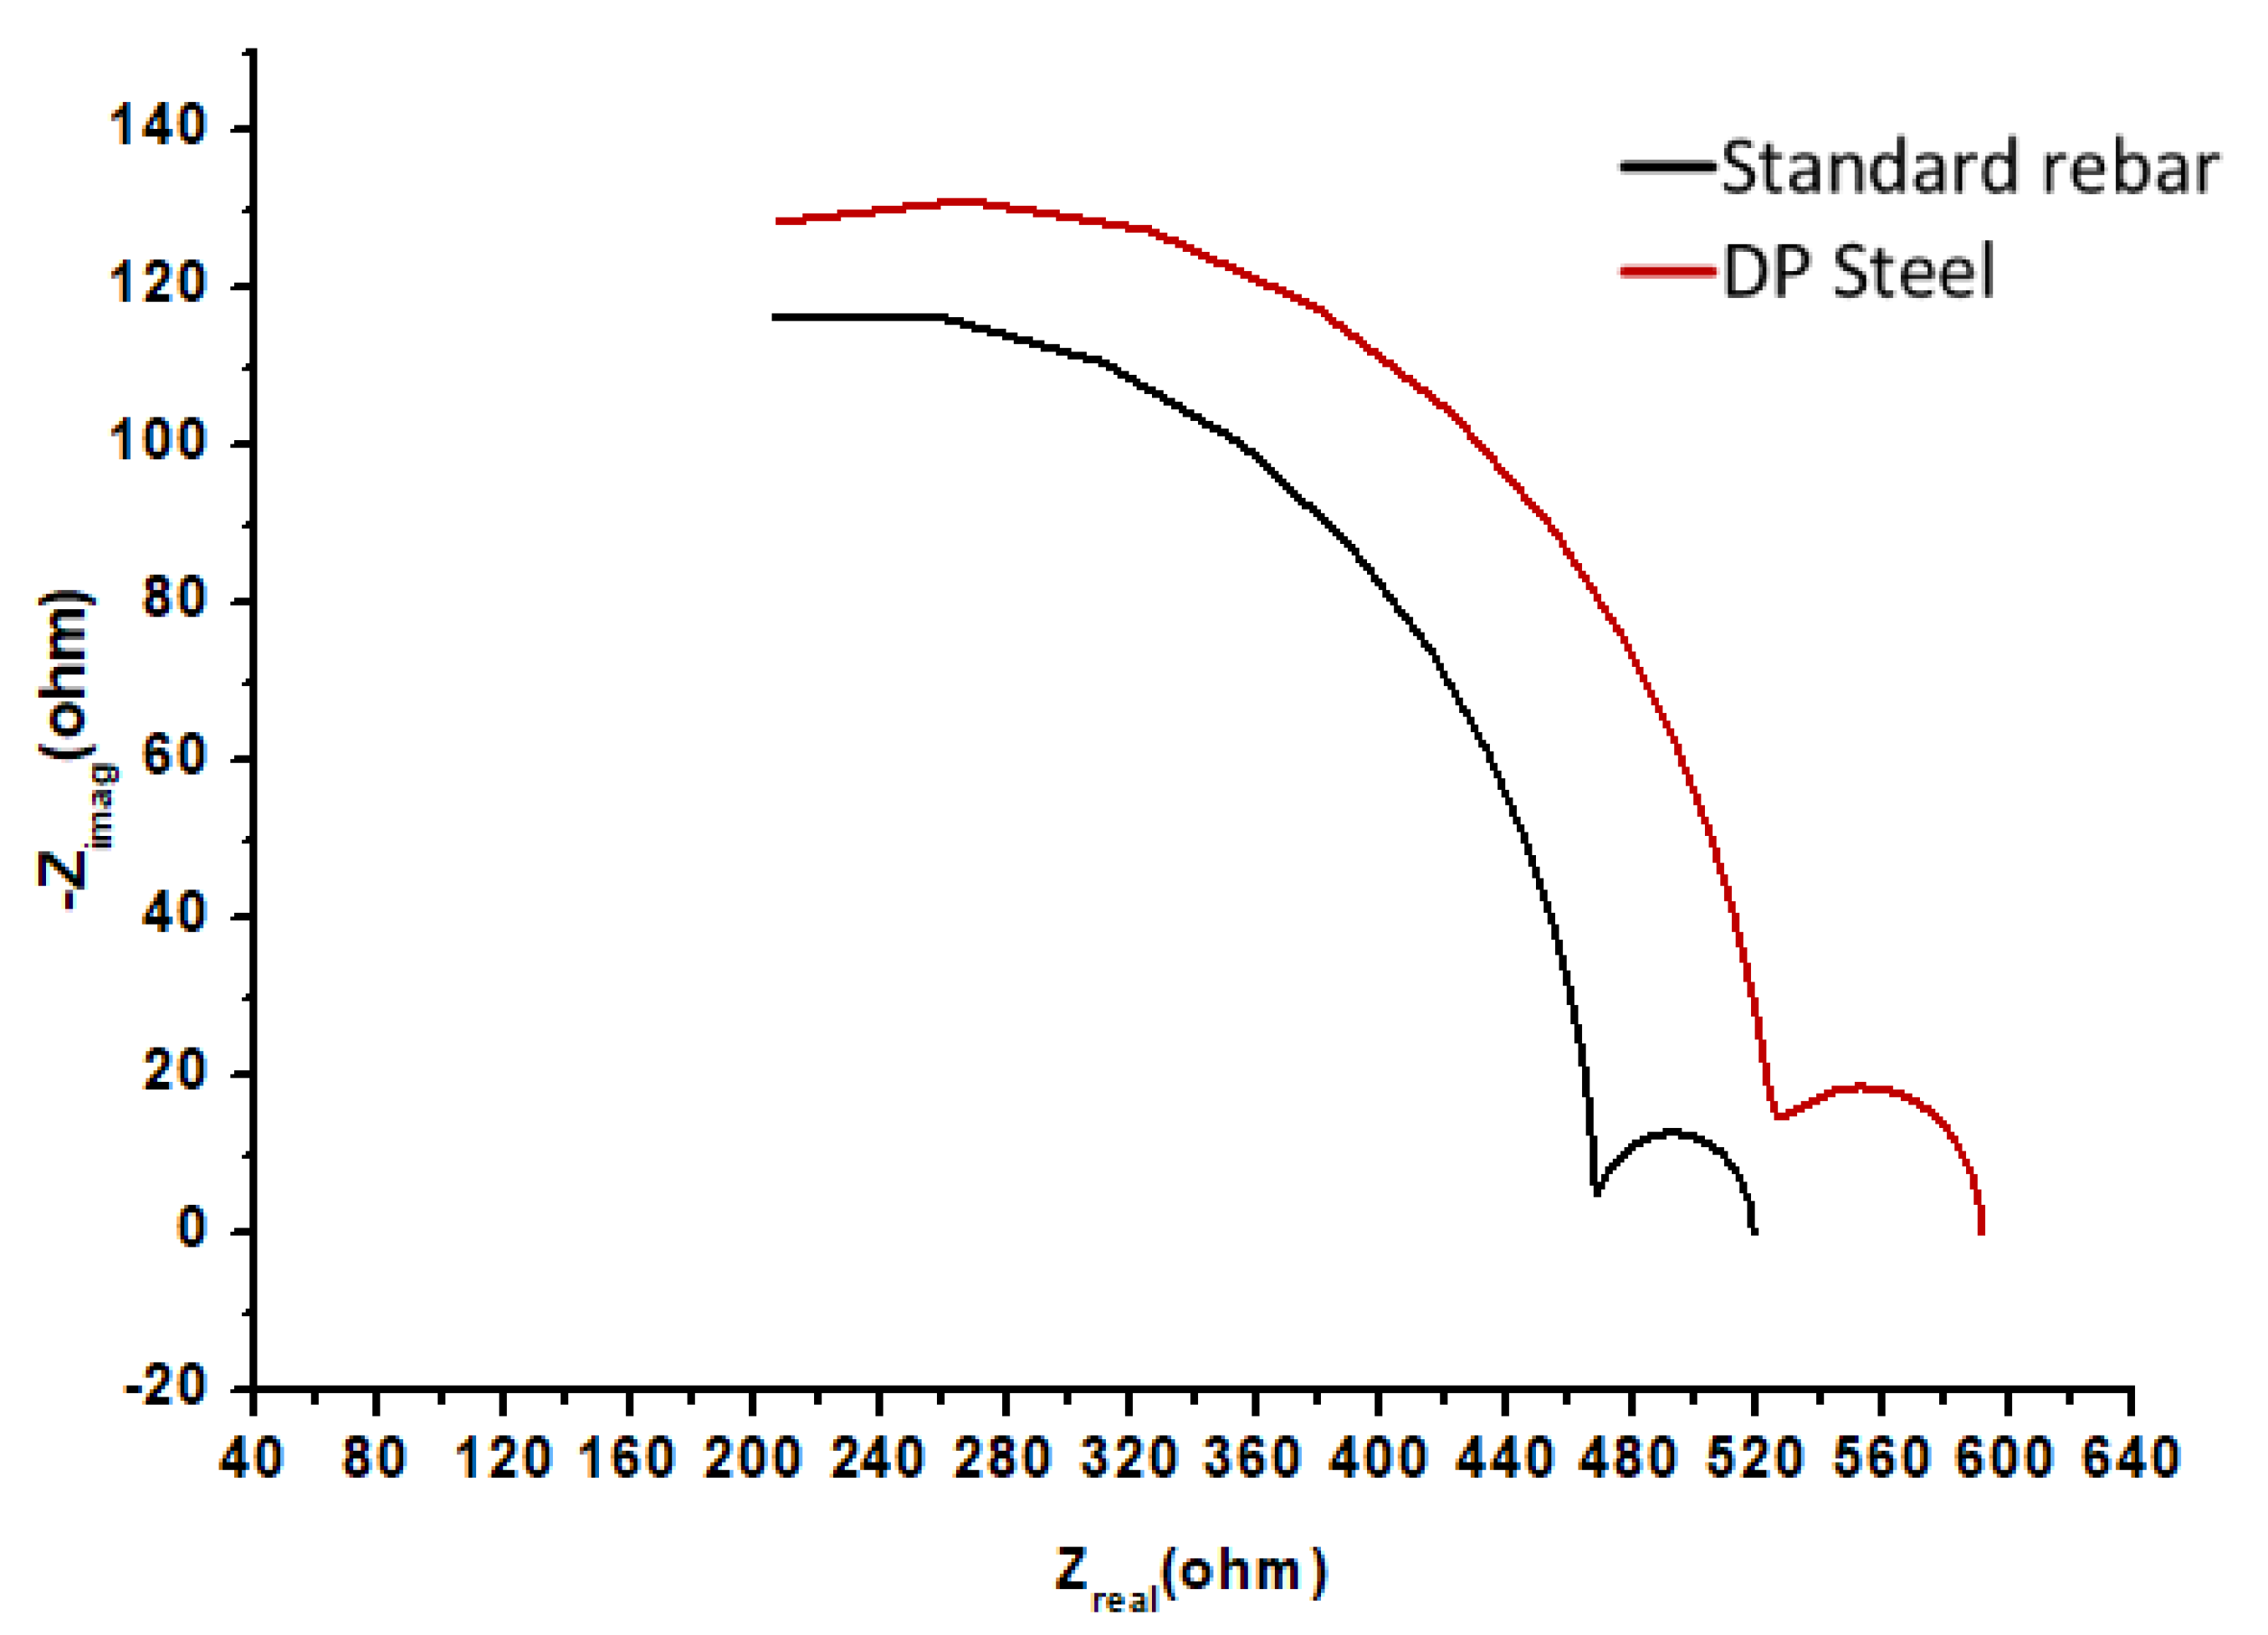
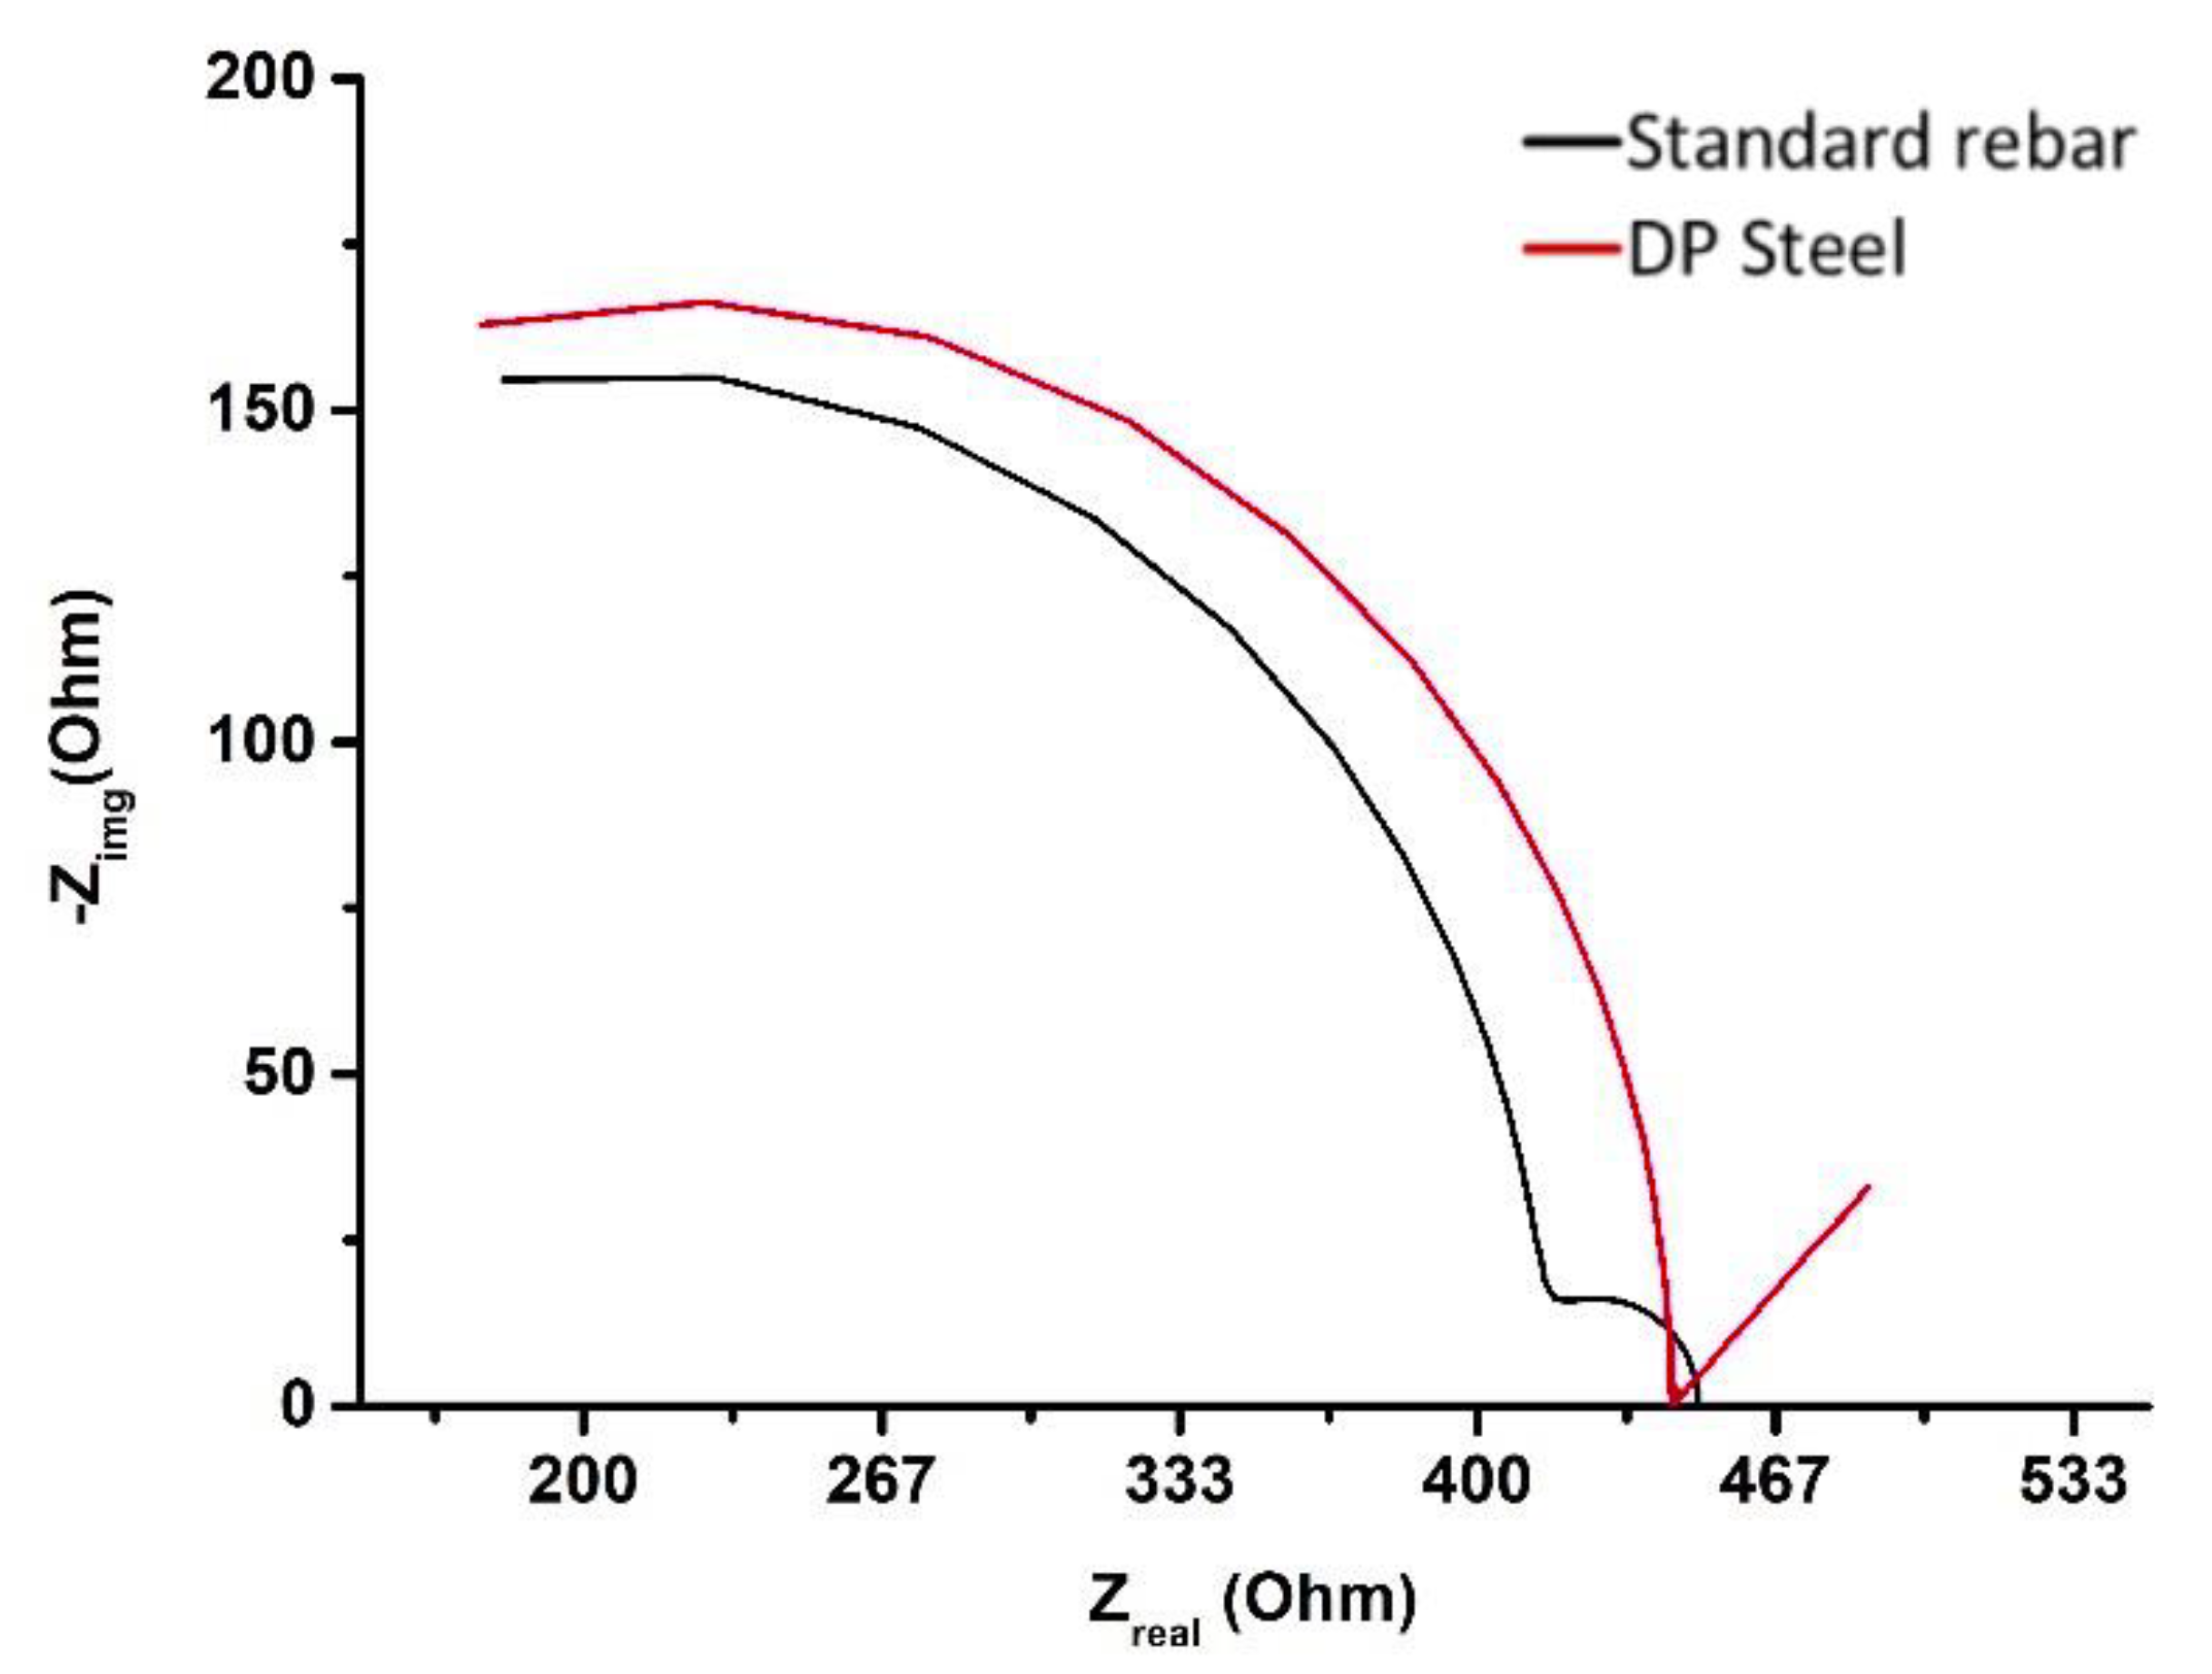
- The value of icorr is higher for conventional rebar than for DP steel. The polarization value is inversely proportional to icorr, and this theoretical aspect is confirmed by the EIS results. In all solutions, the polarization resistance is higher for DP steel than for conventional rebar.
- Based on all of the analyses performed, it is concluded that DP steels exhibit a superior corrosion resistance and strength compared to conventional rebar. The reported results show that DP steels are good candidates for concrete reinforcement, especially in aggressive and corrosive environments.
Author Contributions
Funding
Acknowledgments
Conflicts of Interest
References
- Alonso, C.; Andrade, C.; Castellote, M.; Castro, P. Chloride threshold values to depassivate reinforcing bars embedded in a standardized OPC mortar. Cem. Concr. Res. 2000, 30, 1047–1055. [Google Scholar] [CrossRef]
- Alonso, C.; Castellote, M.; Andrade, C. Chloride threshold dependence of pitting potential of reinforcements. Electrochim. Acta 2002. [Google Scholar] [CrossRef]
- Li, L.; Sagüés, A.A. Effect of chloride concentration on the pitting and repassivation potentials of reinforcing steel in alkaline solutions. In Proceedings of the NACE—International Corrosion Conference Series, San Antonio, TX, USA, 25–30 April 1999. [Google Scholar]
- Bertolini, L.; Bolzoni, F.; Pastore, T.; Pedeferri, P. Behaviour of stainless steel in simulated concrete pore solution. Br. Corros. J. 1996, 31, 218–222. [Google Scholar] [CrossRef]
- Hausmann, C.M. Corrosion of reinforcing bars in concrete. ACI J. Proc. 1965, 62. [Google Scholar] [CrossRef]
- Gouda, V.K. Corrosion and corrosion inhibition of reinforcing steel: I. immersed in alkaline solutions. Br. Corros. J. 1970, 5, 198–203. [Google Scholar] [CrossRef]
- Tasan, C.C.; Diehl, M.; Yan, D.; Bechtold, M.; Roters, F.; Schemmann, L.; Zheng, C.; Peranio, N.; Ponge, D.; Koyama, M.; et al. An overview of dual-phase steels: Advances in microstructure-oriented processing and micromechanically guided design. Annu. Rev. Mater. Res. 2015, 45, 391–431. [Google Scholar] [CrossRef]
- Sezen, H.; Setzler, E.J. Reinforcement slip in reinforced concrete columns. ACI Struct. J. 2008. [Google Scholar] [CrossRef]
- Dieter, G.E.; Bacon, D. Mechanical metallurgy. J. Frankl. Inst. 1962, 273, 338. [Google Scholar] [CrossRef]
- Kuziak, R.; Kawalla, R.; Waengler, S. Advanced high strength steels for automotive industry. Arch. Civ. Mech. Eng. 2008, 8, 103–117. [Google Scholar] [CrossRef]
- Zackay, V.; Parker, E.R.; Fahr, D.; Busch, R. The enhancement of ductility in high-strength steels. Trans. ASM 1967, 60, 252–259. [Google Scholar]
- Bode, R.; Meurer, M.; Schaumann, T.W.; Warnecke, W. Selection and use of coated advanced high-strength steels for automotive applications. Rev. Métallurgie 2004, 101, 551–558. [Google Scholar] [CrossRef]
- Mintz, B. Hot dip galvanising of transformation induced plasticity and other intercritically annealed steels. Int. Mater. Rev. 2001, 46, 169–197. [Google Scholar] [CrossRef]
- Ball, A.; Chauhan, Y.; Schaffer, G.B. Microstructure, phase equilibria, and transformations in corrosion resistant dual phase steel designated 3CR12. Mater. Sci. Technol. 1987, 3, 189–196. [Google Scholar] [CrossRef]
- Llewellyn, D.T.; Hillis, D.J. Dual phase steels. Ironmak. Steelmak. 1996, 23, 471–478. [Google Scholar]
- Luqman, M.; Seikh, A.H.; Sarkar, A.; Ragab, S.A.; Mohammed, J.A.; Ijaz, M.F.; Abdo, H.S. A comparative study of the electrochemical behavior of α and β phase Ti6Al4V alloy in Ringer’s solution. Crystals 2020, 10, 190. [Google Scholar] [CrossRef]
- Bleck, W.; Phiu-On, K. Microalloying of cold-formable multi phase steel grades. Mater. Sci. Forum 2005, 500–501, 97–114. [Google Scholar] [CrossRef]
- Kruger, J.; Calvert, J.P. Ellipsometric-potentiostatic studies of iron passivity. J. Electrochem. Soc. 1967, 114, 43. [Google Scholar] [CrossRef]
- Verdeja, J.I.; Pero-Sanz, J.A.; Asensio, J. Multiphase steels: Structure-mechanical properties relationships in the cold rolled and continuous annealed condition. Mater. Sci. Forum 2005, 500–501, 429–436. [Google Scholar] [CrossRef]
- Katiyar, P.K.; Behera, P.K.; Misra, S.; Mondal, K. Comparative corrosion behavior of five different microstructures of rebar steels in simulated concrete pore solution with and without chloride addition. J. Mater. Eng. Perform. 2019, 28, 6275–6286. [Google Scholar] [CrossRef]
- Ismail, M.; Muhammad, B.; Hamzah, E.; Keong, T. Corrosion behaviour of dual-phase and galvanized steels in concrete. Anti-Corros. Methods Mater. 2012, 59, 132–138. [Google Scholar] [CrossRef]
- Trejo, D.; Monteiro, P.; Thomas, G.; Wang, X. Mechanical properties and corrosion susceptibility of dual-phase steel in concrete. Cem. Concr. Res. 1994, 24, 1245–1254. [Google Scholar] [CrossRef]
- Ismail, M.; Hamzah, E.; Guan, G.C.; Rahman, I.A. Corrosion performance of dual-phase steel embedded in concrete. Arab. J. Sci. Eng. 2010, 35, 81–90. [Google Scholar]
- Salamci, E.; Candan, S.; Kabakci, F. Effect of microstructure on corrosion behavior of dual-phase steels. Kov. Mater. 2017, 55, 133–139. [Google Scholar] [CrossRef]
- Yonezawa, T.; Ashworth, V.; Procter, R.P.M. Pore solution composition and chloride effects on the corrosion of steel in concrete. Corrosion 1988, 44, 489–499. [Google Scholar] [CrossRef]
- Galvele, J.R. Transport processes and the mechanism of pitting of metals. J. Electrochem. Soc. 1976, 123, 464. [Google Scholar] [CrossRef]
- Thomas, J.G.N.; Davies, J.D. Influence of hydrogen carbonate and chloride ions on the stability of oxide films on mild steel in near-neutral solutions. Br. Corros. J. 1977, 12, 108–114. [Google Scholar] [CrossRef]
- Parsons, R. Atlas of electrochemical equilibria in aqueous solutions. J. Electroanal. Chem. Interfacial Electrochem. 1967, 13, 471. [Google Scholar] [CrossRef]
- Galvele, J.R. Effect of molybdenum on the pitting potential of high purity 18% Cr ferritic stainless steels. J. Electrochem. Soc. 1978, 125, 1204. [Google Scholar] [CrossRef]
- Bellezze, T.; Giuliani, G.; Roventi, G. Study of stainless steels corrosion in a strong acid mixture. Part 1: Cyclic potentiodynamic polarization curves examined by means of an analytical method. Corros. Sci. 2018, 130, 113–125. [Google Scholar] [CrossRef]
- Abdo, H.S.; Sherif, E.-S.M.; El-Serehy, H.A. Manufacturing of Ti–6%Al and Ti–6%Al–4%V alloys and their corrosion in sodium chloride solutions. Crystals 2020, 10, 181. [Google Scholar] [CrossRef]
- Mao, X.; Liu, X.; Revie, R.W. Pitting corrosion of pipeline steel in dilute bicarbonate solution with chloride ions. Corrosion 1994, 50, 651–657. [Google Scholar] [CrossRef]


| C | Mn | Si | S | P | V | Mo | Nb | |
|---|---|---|---|---|---|---|---|---|
| DP Steel | 0.21 | 0.80 | 0.172 | 0.023 | 0.017 | <0.01 | <0.01 | <0.01 |
| standard rebar | 0.25 | 0.82 | 0.170 | 0.035 | 0.015 | <0.01 | <0.01 | <0.01 |
| Sample | Hardness (VHN) |
|---|---|
| Standard rebar | 257 |
| DP steel | 310 |
| Sample | Icorr (µA/cm2) | Ecorr (V) | Rp (Ω·cm2) | α |
|---|---|---|---|---|
| Standard rebar | 14 | −0.36 | 175 | −0.80 |
| DP steel | 9 | −0.38 | 300 | −0.93 |
| Sample | Icorr (µA/cm2) | Ecorr (V) | Rp (Ω·cm2) | α |
|---|---|---|---|---|
| Standard rebar | 156 | 0.10 | 18 | −0.65 |
| DP steel | 45 | −0.30 | 26 | −0.71 |
| Sample | Icorr (µA/cm2) | Ecorr (V) | Rp (Ω·cm2) | α |
|---|---|---|---|---|
| Standard rebar | 9 | −0.24 | 470 | −0.92 |
| DP steel | 5 | −0.24 | 600 | −0.98 |
| Sample | Icorr (µA/cm2) | Ecorr (V) | Rp (Ω·cm2) | α |
|---|---|---|---|---|
| Standard rebar | 4 | −0.25 | 345 | −0.89 |
| DP steel | 1 | −0.18 | 456 | −0.92 |
Publisher’s Note: MDPI stays neutral with regard to jurisdictional claims in published maps and institutional affiliations. |
© 2020 by the authors. Licensee MDPI, Basel, Switzerland. This article is an open access article distributed under the terms and conditions of the Creative Commons Attribution (CC BY) license (http://creativecommons.org/licenses/by/4.0/).
Share and Cite
Abdo, H.S.; Seikh, A.H.; Mandal, B.B.; Mohammed, J.A.; Ragab, S.A.; Abdo, M.S. Microstructural Characterization and Corrosion-Resistance Behavior of Dual-Phase Steels Compared to Conventional Rebar. Crystals 2020, 10, 1068. https://doi.org/10.3390/cryst10111068
Abdo HS, Seikh AH, Mandal BB, Mohammed JA, Ragab SA, Abdo MS. Microstructural Characterization and Corrosion-Resistance Behavior of Dual-Phase Steels Compared to Conventional Rebar. Crystals. 2020; 10(11):1068. https://doi.org/10.3390/cryst10111068
Chicago/Turabian StyleAbdo, Hany S., Asiful H. Seikh, Biplab Baran Mandal, Jabair A. Mohammed, Sameh A. Ragab, and Mohamed S. Abdo. 2020. "Microstructural Characterization and Corrosion-Resistance Behavior of Dual-Phase Steels Compared to Conventional Rebar" Crystals 10, no. 11: 1068. https://doi.org/10.3390/cryst10111068
APA StyleAbdo, H. S., Seikh, A. H., Mandal, B. B., Mohammed, J. A., Ragab, S. A., & Abdo, M. S. (2020). Microstructural Characterization and Corrosion-Resistance Behavior of Dual-Phase Steels Compared to Conventional Rebar. Crystals, 10(11), 1068. https://doi.org/10.3390/cryst10111068