Article

Probing Lithium-Ion Battery Electrolytes with Laboratory Near-Ambient Pressure XPS

1
SPECS Surface Nano Analysis GmbH, Voltastrasse 5, 13355 Berlin, Germany
2
Institute for Applied Materials (IAM-ESS), Karlsruhe Institute of Technology (KIT), Hermann-von-Helmholtz-Platz 1, 76344 Eggenstein-Leopoldshafen, Germany
*
Author to whom correspondence should be addressed.
Crystals 2020, 10(11), 1056; https://doi.org/10.3390/cryst10111056
Submission received: 28 September 2020 / Revised: 9 November 2020 / Accepted: 16 November 2020 / Published: 20 November 2020
(This article belongs to the Section Inorganic Crystalline Materials)

Abstract

:
In this article, we present Near Ambient Pressure (NAP)-X-ray Photoelectron Spectroscopy (XPS) results from model and commercial liquid electrolytes for lithium-ion battery production using an automated laboratory NAP-XPS system. The electrolyte solutions were (i) LiPF6 in EC/DMC (LP30) as a typical commercial battery electrolyte and (ii) LiTFSI in PC as a model electrolyte. We analyzed the LP30 electrolyte solution, first in its vapor and liquid phase to compare individual core-level spectra. In a second step, we immersed a V2O5 crystal as a model cathode material in this LiPF6 solution. Additionally, the LiTFSI electrolyte model system was studied to compare and verify our findings with previous NAP-XPS data. Photoelectron spectra recorded at pressures of 2–10 mbar show significant chemical differences for the different lithium-based electrolytes. We show the enormous potential of laboratory NAP-XPS instruments for investigations of solid-liquid interfaces in electrochemical energy storage systems at elevated pressures and illustrate the simplicity and ease of the used experimental setup (EnviroESCA).

1. Introduction

X-ray Photoelectron Spectroscopy (XPS) as a powerful and non-destructive technique for material and surface analysis provides quantitative elemental and chemical information of the studied samples. Near Ambient Pressure (NAP) XPS has been developed to enable the analysis of real-world samples under working conditions [1,2,3,4,5]. The transformation of XPS from a UHV-based method towards environmental conditions has revolutionized XPS dramatically and opens completely new fields of research. NAP-XPS is used extensively for in situ measurements and operando studies of industrial relevant (electro) chemical reactions and catalytic processes, especially at gas-liquid, gas-solid, and liquid-solid interfaces [6,7,8,9,10].
Probing realistic battery environments with NAP-XPS is of special interest. During Li-ion battery (LIB) charging and discharging, the cells are operated at voltages outside the stability window of the organic electrolytes. As a consequence, especially during the first discharge of the battery, electrolyte reduction and formation of a solid electrolyte interphase (SEI) on the anode are observed [11,12]. This intentional creation of the SEI prevents the formation of Li-dendrites. During battery charging, the formation of a cathode–electrolyte interphase (CEI) can be seen at high voltages. These interphase formations are crucially influencing the short and long-term performances of a battery [13,14]. In this context, NAP-XPS enables direct observation of the formation, composition, and dynamics of the SEI and CEI providing otherwise inaccessible information. Additionally, additional sample preparation before conventional UHV-based measurements, i.e., battery disassembly, washing, and drying of cycled electrodes, can be avoided. Moreover, the possible side effects of different electrode washing procedures on the interphase composition are circumvented.
In the first part of this study, a V2O5 single crystal is used as a model cathode material. Its model cathode character is not because of its ultimate performance or cycling stability, but because of its chemical and structural stability in the fully charged (de-lithiated) state, giving easy access to the first discharge by spontaneous incorporation of lithium-ions into the surface layer even without electrodes and potentials [15]. When in contact with Li+-containing electrolytes such as the commercial LP30 electrolyte (1 mol LiPF6 in EC/DMC) V2O5 is known for spontaneous accumulation of Li+-ions in its surface layer(s). As the cathode and the different electrolyte components have no overlap in their XPS spectra, a distinction between the different species is easily made.
The second part of our study focused on the model electrolyte based on 1 M bis(trifluoromethane) sulfonimide lithium salt (LiTFSI) in propylene carbonate (PC), which offers the advantage that both salt and solvent signals can be observed and clearly distinguished from each other in NAP-XPS within the C 1s region. Previous work using both synchrotron and in-house NAP-XPS setups probing an electrolyte drop on a Li-metal substrate showed that the salt concentration varied within that drop. At the surface of the liquid, an almost twofold increase in salt concentration was observed [16]. Transferring synchrotron measurements to laboratory applications could allow much easier handling and transfer of various samples, thus enabling also a much higher throughput.
A detailed understanding of the interface reactions at the electrolyte-electrode interface(s) in its elementary steps is still missing. This would allow materials optimization of electrodes and electrolytes and would also help to improve performance, durability, and safety of lithium-ion batteries in general.

2. Materials and Methods

2.1. Materials

Materials were obtained from commercial suppliers and used without further purification except for V2O5 single crystals that were kindly provided by M. Klemm and S. Horn (Universität Augsburg, Germany). Battery grade LP30, a lithium hexafluorophosphate (LiPF6) solution in ethylene carbonate (EC) and dimethyl carbonate (DMC) with a concentration of 1 M of LiPF6 in EC/DMC (50/50; v/v), was obtained from Merck KGaA (Darmstadt, Germany). The LiTFSI electrolyte was prepared by dissolving 1 M bis(trifluoromethane) sulfonimide lithium salt (LiTFSI, BASF, Ludwighshafen, Germany, purity 99.9 wt %) in propylene carbonate (PC, BASF, Ludwighshafen, Germany, purity 99.9 wt %). The salt was dried overnight at 120 °C under vacuum. The solvent PC was used as received.

2.2. Near-Ambient Pressure X-ray Photoelectron Spectroscopy (NAP-XPS)

Laboratory NAP-XPS measurements were done with an EnviroESCA (SPECS GmbH, Berlin, Germany) [17,18,19,20]. The monochromatic Al Kα X-ray source is separated from the measurement chamber by a silicon nitride window, and the hemispherical energy analyzer is under ultra-high vacuum (<1 × 10⁻⁸ mbar) due to a three-stage differential pumping system between the analysis section and analyzer. The entrance aperture (nozzle) has a diameter of 300 μm and the usual working distance is 1–2 times the nozzle diameter.
Figure 1 illustrates schematically the experimental setup which is comparable to the static droplet setup [4]. In our design, it is more like a semi-static reservoir setup because the volumes (2–50 mL) are larger than in a single droplet and the surface is renewed constantly by a convective liquid flow that is caused by differential pumping through the analyzer nozzle. That constant movement and renewal of the probed liquid surface minimize the accumulation of unwanted decomposition products in the analysis region as they are diluted in the larger volume of liquid. Solvent evaporation from the electrolyte during the experiments can be reduced by using an extra reservoir, internally or externally, with the complimentary solvent.
With this setup, it is possible to insert liquid samples, i.e., in a watch glass directly into the load-lock chamber and measure at pressures up to 50 mbar. For ambient pressure measurements, approximately 2–5 mL of electrolyte were inserted into the EnviroESCA and the pressure was slowly reduced to 20 mbar to allow evaporation of residual dissolved gases. The V2O5 single crystal sample was immersed directly in LP30 and was then treated in the same manner as the electrolyte samples. Measurements were performed at 10 mbar for the LiPF6 electrolyte in EC/DMC. LiTFSI electrolyte spectra were measured at a base pressure of 2 mbar. The chosen working pressures above the respective solvent vapor pressures reduce solvent evaporation significantly and affect the resulting photoelectron signal by electron scattering with gas molecules only to a low extent. {The vapor pressures of DMC and EC at 25 °C are 74 mbar and 0.02 mbar [21,22], respectively, and that of PC at 20 °C is 0.17 mbar [23]}.
All survey spectra were acquired in fixed analyzer transmission (FAT) mode at a pass energy of 100 eV, a step size of 1.0 eV, and a dwell time of 0.1 s. High-resolution core-level spectra (F 1s, O 1s, N 1s, C 1s, P 2p, and Li 1s) were recorded in fixed analyzer transmission (FAT) mode at pass energy of 30 eV or 50 eV, a step size of 0.2 eV, and a dwell time of 0.1 s.
The electron emission angle was 0° and the source-to-analyzer angle was 55°. The binding energy scale of the instrument was calibrated according to ISO 15472 [24]. Unless otherwise noted the binding energy scale after environmental charge compensation by the gas was corrected for all spectra using an electron binding energy of 539.3 eV for the O 1s peak of molecular oxygen (referencing to vacuum level gives a binding energy of 543.7 eV) [25,26].
Curve fitting of core-level spectra was done with SpecsLab Prodigy (SPECS GmbH, Berlin, Germany, release 4.73.3) using a Gaussian/Lorentzian product function peak shape model in combination with a Shirley or Tougaard background. Generally, the full width at half maximum (FWHM) was set as a free parameter but constrained to be the same for all peaks within the same core-level spectrum. This did not apply to the core-level peaks originating from gas, which inherently have a different peak shape and FWHM. All the spectra were fitted with a minimum set of peak components except for the O 1s of LiTFSI. Here the O 1s peak components (O=C, O-C) from propylene carbonate (PC) were used with identical FWHM and a constrained peak area ratio of 1 to 2 according to the PC stoichiometry. The third component for TFSI (O=S) was then added to complete the fit of the O 1s core-level data. In some cases, the peak position was fixed based on the energy position of the same peak component found in the gas phase.

2.3. Sample Preparation

2.3.1. Lithium Hexafluorophosphate (LiPF6) in EC/DMC (LP30)

The liquid electrolyte was transferred in a sealed container from a glovebox into the sample environment (load lock) of the EnviroESCA. Then a small amount of the liquid (2–5 mL) was poured into a watch glass under a constant flow of argon. Afterward, the pressure in the sample environment was stabilized at 10 mbar, the sample was transferred into the analysis section of the instrument, and the electrolyte was analyzed directly (i) as received and (ii) in contact with a V2O5 crystal (cf. Figure 1).
The corresponding O 1s spectra exhibit a significant component from molecular oxygen (O2), which together with the H2O component, originates from residual ambient air and/or air exposure during sample preparation and handling.

2.3.2. Lithium Bis(Trifluoromethane) Sulfonimide in PC

The LiTFSI electrolyte was prepared by dissolving 1 M bis(trifluoromethane) sulfonimide lithium salt in propylene carbonate (PC). The salt was dried overnight at 120 °C under a vacuum. All chemicals were handled under an inert argon atmosphere inside a glove box (H2O ~ 1 ppm, O2 ~ 1 ppm) and introduced into the EnviroESCA NAP-XPS instrument via a glove bag, which was Ar-flushed for a minimum of four times directly before any new sample preparation. For transport, all materials and vials containing solvent or electrolyte were sealed in individual vacuum pouch cells to avoid contact with atmospheric conditions. Still a small amount of oxygen (O2) from ambient air is detected in the corresponding O 1s spectrum but that vanishes completely during the course of the experiments (further details are given in the Supplementary Material).

3. Results and Discussion

In the following sections, NAP-XPS data of an LP30 electrolyte solution (LiPF6 in EC/DMC) are presented. The commercial electrolyte was investigated in its gaseous phase, in its liquid phase with the surrounding gas, and in contact with a V2O5 single crystal. Additionally, the immersed V2O5 single crystal was probed with NAP-XPS after cleaning and drying.
The last section presents data from a model electrolyte based on a solution of LiTFSI in PC. This electrolyte was analyzed with synchrotron and in-house NAP-XPS earlier in a hanging drop setup [4], which allows direct comparison with our XPS data from LiTFSI and LiPF6.

3.1. LiPF6 (Commercial) Electrolyte—Vapor Only and Vapor-Liquid Mix

First, the gaseous phase above the sample was analyzed to identify contributions from evaporating electrolyte solution or residual gases. Figure 2a shows the corresponding C 1s and O 1s core-level spectra of the gas phase. The C 1s consist of peaks that can be assigned to C-O (g) and CO3 (g) moieties of ethylene carbonate (EC) and dimethyl carbonate (DMC) [16,27,28,29]. Both moieties are labeled with 1 and 2 in their chemical structures respectively (cf. insets in Figure 2a). This correlation to carbon atoms from evaporated EC and/or DMC molecules later helps to assign solution based peak components. The experimental C-O (g) to CO3 (g) peak component ratio of 2:1 is matching the theoretical one and indicates that only EC/DMC related carbon-species are present in the gas phase surrounding the sample. From the C 1s and O 1s spectra, these two organic carbonates are hard to differentiate but the gas atmosphere is likely DMC-dominated due to the significantly higher vapor pressure of DMC (74 mbar at 25 °C) compared to that of EC (0.01 at 25 °C) [22,23].
O 1s spectra of the gas phase are more complex due to additional contributions from residual molecular oxygen and water next to the oxygen atoms of EC and DMC. As shown in Figure 2a the O 1s core-level spectrum can be fitted very well with 5 components with three components at lower biding energy that can be assigned to H-O-H (g) from water vapor and the oxygen atoms O=C (g) and O-C (g) from EC/DMC [16,27,28,29], these atoms are labeled with 1 and 2 in their chemical structures (cf. insets in Figure 2a). The peak at 540 eV is caused by molecular oxygen O2 and it splits with a shift of 1 eV in a 2:1 ratio due to the paramagnetic nature of molecular oxygen [25,26,30]. This O 1s O2 gas peak is very useful as an internal binding energy reference for energy alignment of different photoelectron spectra.
Binding energies and relative peak component areas of the fitted C 1s and O 1s core-level spectra as shown in Figure 2 are summarized in Table 1 and Table 2.
Significantly more peaks are observed in C 1s and O 1s spectra obtained from the liquid LiPF6 electrolyte. Here further contributions from liquid EC/DMC molecules have to be considered. Figure 2b shows those C 1s and O 1s solution spectra that were fitted with the same strategy used for the gas phase spectra.
The C 1s spectrum of the liquid electrolyte mixture contains three new components located at 287.7 eV and 291.4 eV, assigned to the C-O (l) and CO3 (l) moieties in the liquid phase, together with a CC/CH component from hydrocarbons located at 285.5 eV. (The binding energy difference to usual CC/CH values of 285.0 eV is a consequence of the applied energy scale referencing to O 1s O2 peak.)
Comparable binding energy differences of about 1 eV or even more between core-level peaks of gaseous and condensed phases with the liquid at lower binding energies have been reported earlier for other solvents [25,26,30,33,34,35].
Similar to the C 1s core-level spectrum of the liquid electrolyte two additional components O=C (l) at 533.0 eV and O-C (l) at 534.7 eV originating from liquid EC and DMC molecules are identified in the O 1s spectrum (cf. Figure 2b, right panel). H2O and O2 peak components exhibit significantly decreased contributions to the O 1s peak when compared to the electrolyte gas-phase spectra (cf. Figure 2a). The probed volume appears to be dominated by the liquid LiPF6 electrolyte and only a small amount of gas is contributing to the overall NAP-XPS signal.
High-resolution P 2p and F 1s spectra, shown in Figure S1 (Supplementary Material), exhibit only single peaks around 137 eV and 687 eV. Corresponding to earlier reports those peaks represent LiPF6 [27,36,37,38]. Other peaks indicating typical electrolyte decomposition products were not observed. Taking this into consideration and the different carbon and oxygen components of the EC/DMC mixture that can contribute to the gas phase as well as the condensed phase the experimental data could be interpreted and fitted very well. This is very helpful for NAP-XPS data interpretation of more complex samples composed of electrolytes, electrodes, and further additives.

3.2. LiPF6 (Commercial) Electrolyte-V2O5 Single Crystal in Solution

Following those initial tests, a more realistic sample was chosen. As cathode material, a single crystal of V2O5 was placed directly in the LiPF6 electrolyte and analyzed while in the LP30 solution to study the consequences of this addition, see Figure 1 (top right). A region on the V2O5 was selected where the liquid electrolyte film covering the solid was thin enough (layer thickness < XPS information depth) to probe both the electrolyte and the crystal’s surface. There was no potential applied but a spontaneous Li-intercalation into the crystal surface can be expected [15].
Figure 2c shows the corresponding C 1s and O 1s spectra. Applying the same fitting strategy as for the electrolyte, additional peaks originating from V2O5 are needed to reconstruct the measured spectra.
The hydrocarbon-related CC/CH peak component area of the C 1s increases to 36% compared to 27% in the liquid electrolyte alone. These additional CC/CH contributions originate most probably from (adventitious) hydrocarbons adsorbed on the single crystal surface.
Compared to the neat electrolyte the O 1s detail spectrum changes significantly due to vanadium oxide species, which are considered by an additional O-V peak component located at 531.0 eV. Similarly, V-O species are present in the V 2p core-level spectra with V 2p3/2 around 518 eV (cf. Figure 3a) [38].
High-resolution P 2p and F 1s spectra (cf. Figure S1, Supplementary Material) have only single peaks at 687 eV and 137 eV corresponding to LixPFy species as reported previously for LiPF6 [16,27,36,37]. The absence of other F 1s and P 2p peaks at lower binding energies, typically related to decomposition products like LiF, LixPOyFz, or other phosphates, indicate mostly intact LiPF6-anions in solution. Moreover, a very small and broad feature is potentially present in the Li 1s region at around 56 eV indicating the presence of lithium in the analyzed solid-liquid interface region (cf. Figure 4d).
These findings indicate that with our experimental set up we can investigate both the liquid electrolyte and the solid V2O5 crystal at the same time as long as the electrolyte film thickness is smaller than the XPS information depth (up to 10 nm). Such solid-liquid interfaces are important boundaries in electrochemical devices. Especially the solid electrolyte interface (SEI) [28,29,39] on the negative electrode of LIBs can be investigated with this setup.

3.3. LiPF6 (Commercial) Electrolyte-V2O5 Crystal after Cleaning

After the immersion in the electrolyte (and a short ethanol rinse) the dry V2O5 crystal was investigated to determine the remaining electrolyte components on the crystal’s surface. The corresponding C 1s and O 1s core-level spectra are presented in Figure 2d.
EC/DMC-related carbon components are lost almost completely as seen in the C 1s spectra. The main carbon species with a peak component area of 80% originates from CC/CH together with minor contributions from C-O and COO species (cf. Table 3), which could originate from solvent residues or contaminations on the crystal surface. Carbonate-related CO3 species could not be detected in the C 1s spectrum of the crystal surface.
The thickness of the adventitious carbon layer on the crystal surface after immersion in LP30 is estimated to be ca. 3 nm under the assumption that this layer is mainly composed of hydrocarbons (CC/CH), see Figure 2d and Table 1. On the pristine V2O5 crystal a hydrocarbon layer with a thickness of only 0.5 nm was found, which implies that the outermost surface layers on the V2O5 crystal are structurally and chemically very different after being immersed LP30. The elemental composition was calculated to be 29 at.-% vanadium and 71 at.-% oxygen on the pristine crystal whereas 60 at% oxygen, 27 at.-% fluorine, and 13 at.-% vanadium were detected after contact with LP30 (compositions after carbon correction, cf. Figure S8, details for contamination layer thickness estimations are given in the Supplementary Material).
In the O 1s spectrum, the vanadium-related O 1s component is now the most intense one. Additional contributions in the binding energy region from 532–535 eV are observed, which could originate from oxidized carbon or lithium species, e.g., LixPFyOz, LixOy, LiOH, Li2CO3, or ROCO2Li.
Also F- and P-containing species were found on the crystal surface after drying. High-resolution P 2p and F 1s spectra show only single peaks assigned to LixPFy species (cf. Figure S2, Supplementary Material). The same was observed also in the liquid LiPF6 electrolyte and again that lack of other F 1s and P 2p peaks at lower binding energies indicate the absence of F- and P-based decomposition products (LiF, LixPOyFz, LixPF3−xO) even on the air-dried crystal. This is further corroborated by the fact that no carbonate components like Li2CO3 or ROCO2Li [27,36,37] were detected in the C 1s spectrum.
Since neither phosphate nor carbonate peaks were detected the additional oxygen species present around 532–535 eV in the O1s core-level spectrum of the dry crystal are most probably originating from lithium oxide species like Li2O, LiOH, Li2O2, LiO2, or LixV2O5 together with some minor contributions from carbon-oxygen related contaminations. This finding is supported by a broad Li 1s peak around 58 eV (cf. Figure S4, Supplementary Material).
Additional information could be obtained from the curve fit of V 2p3/2 core-level spectrum which indicates reduction from V5+ to V4+ during intercalation and enrichment of V4+ species on the crystal surface after cleaning and drying as illustrated in Figure 3.
Alkali intercalation in V2O5 leads to a charge transfer of the outer shell Li 2s electron to unoccupied V 3d-derived conduction band states that split-off due to localization effects. Exposure of such an intercalated LixV2O5 leads to surface reactions of the lithium with water vapor, forming lithium oxides (Li2O), hydroxides (LiOH), peroxides (Li2O2), and superoxides (LiO2). Part of the oxygen needed for this comes from the V2O5 structure itself, leaving behind oxygen vacancies. This reaction transfers electrons back to the vanadium ions, filling unoccupied V 3d states, and by that increase the number of V4+ species due to V5+-> V4+ reductions [15,38,39,40]. This effect is reflected by an increased V4+ peak component area to the total V 2p3/2 peak area from 4.4% when in solution to 9.3% on the dry crystal.
With that basic but straightforward experiment using a V2O5 model cathode with the common battery electrolyte LP30 (LiPF6 in EC/DMC), we could demonstrate exemplarily the enormous potential of in situ and operando NAP-XPS for studying electrode surfaces and their interfacial reactions in different environments. Each step of such a reaction or process can be followed in the XPS system and changes in the respective core-level spectra, e.g., alkali incorporation into the V2O5 crystal surface and vanadium reduction (V5+-> V4+) can be monitored immediately.

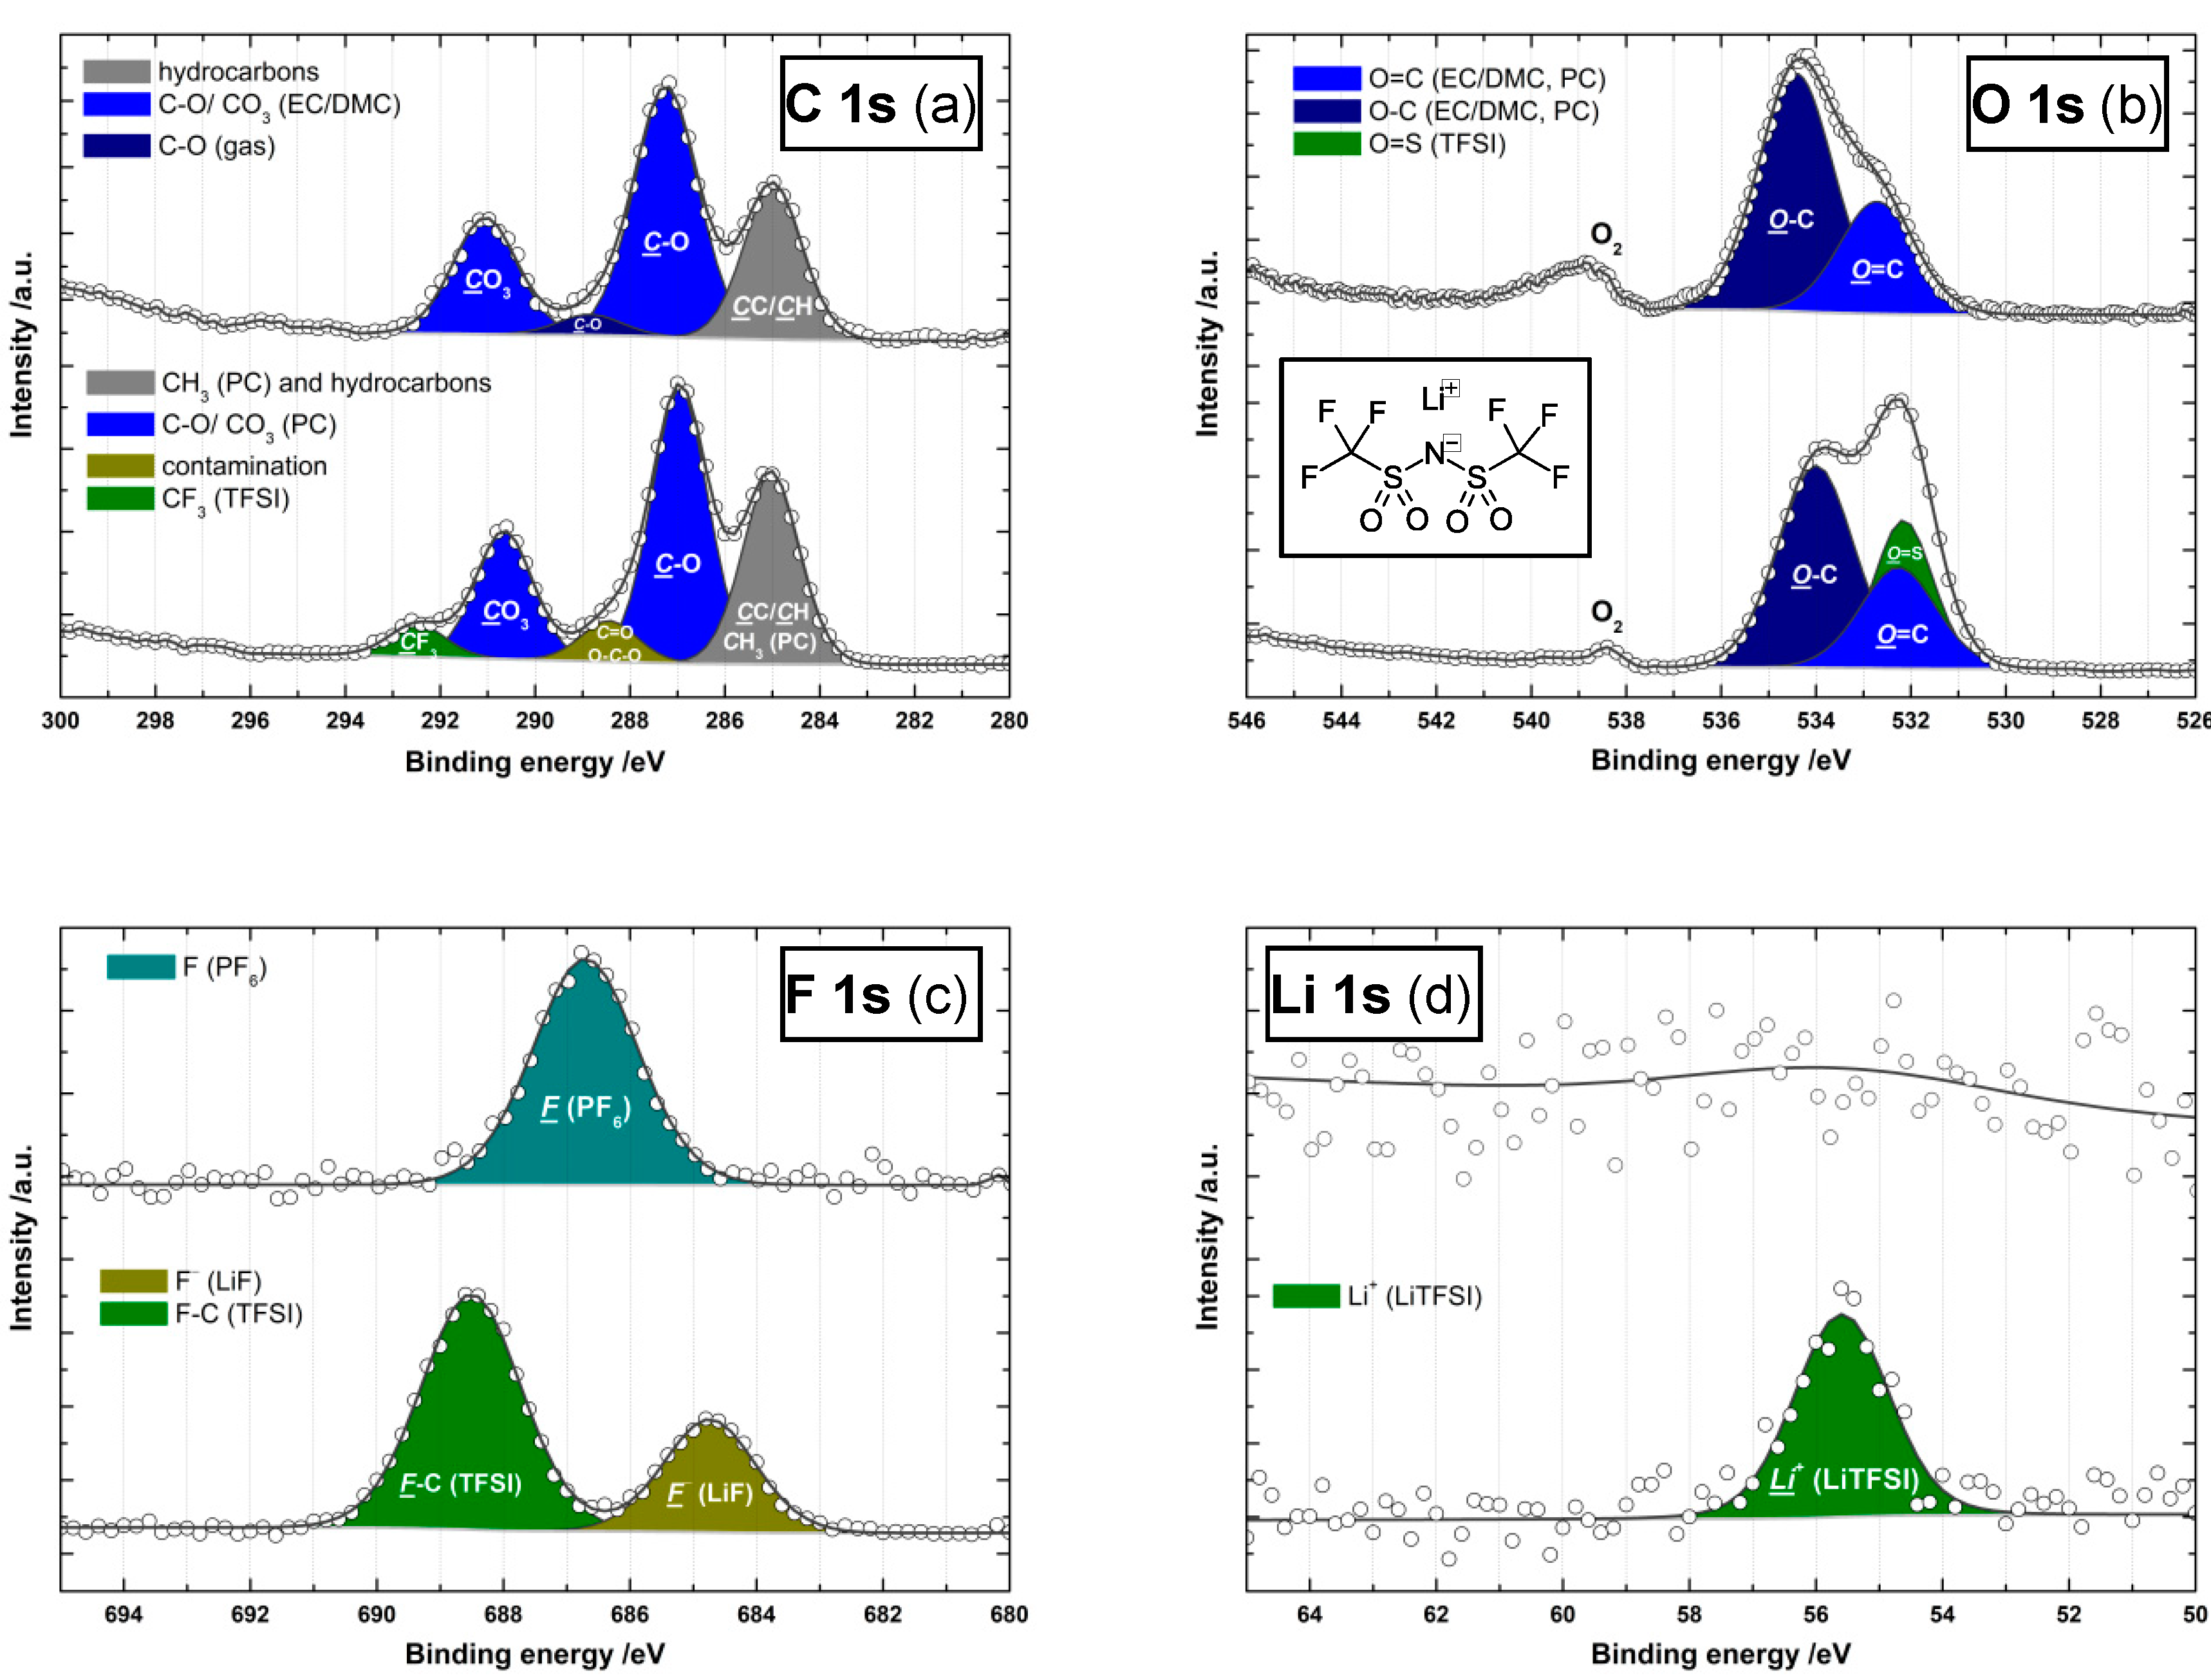
3.4. Comparison of LiTFSI (Model) and LiPF6 (Commercial) Electrolyte

After these encouraging experiments, we were able to relate the results of the LiPF6 electrolyte with data of the LiTFSI model electrolyte, which was previously analyzed with synchrotron and in-house NAP-XPS [16]. As we used the same setup for both liquids a direct comparison of the high-resolution core-level spectra from the LiTFSI and LiPF6 electrolyte is possible. The measured core-level spectra as shown in Figure 4 were fitted according to the method proposed by Maibach et al. [16] using a minimum number of peak components. Thus, the contributions from gaseous and liquid phases are combined (except for LP30, here an additional C-O gas component was needed). The resulting peak components and assignments are summarized in Table 3.
C 1s core-level spectra of LiTFSI and LiPF6 are showing similar components from the respective organic carbonate solvents EC, DMC, and PC together with an additional hydrocarbon peak. LiTFSI has an extra peak originating from the CF3 moiety located at 292.5 eV and an additional component at 288.5 eV (C=O/O-C-O) related to unknown contamination or additional gas-phase contributions. In contrast to the first report of NAP-XPS on LiTFSI, an additional CFx component at 289.4 eV was not needed to fit and reconstruct our experimental C 1s data.
The O 1s core-level spectra of LiTFSI and LiPF6 are characterized by solvent related O=C and O-C components with a nominal 1 to 2 ratio. Only the TFSI shows an additional O=S contribution at 532.2 eV due to the sulfonimide groups N(SO2CF3)2. The most obvious differences between the two electrolytes are found in the respective F 1s spectra. LiPF6 exhibits only one single peak located at 686.7 eV whereas the LiTFSI shows two peaks at 688.5 eV (CF3) and a smaller one located at 684.6 eV (F) [16,27,36,37]. The latter peak results from an F contamination of the LiTFSI salt. All these findings are in accordance with earlier reports about LiTFSI [16]. The Li 1s, S 2p, and N 1s core-level spectra of LiTFSI (cf. Figure S7) indicate no other species present in the electrolyte than the bis(trifluoromethane) sulfonimide lithium salt. F 1s and P 2p single peaks indicate mostly intact LiPF6-anions in the LP30.
All elemental ratios of LiTFSI and LiPF6 electrolytes calculated from the quantified XPS data are summarized in Table 4. The Li:F elemental ratios of 2:1 (LiPF6) and 2.3:1 (LiTFSI) indicate that lithium is enriched at the surface of both electrolyte liquids under the applied measurement conditions. The carbonate solvent contribution to the survey scans gives C:O ratios of 1:1 (LiPF6) and 1:1.5 (LiTFSI), which are quite close to the expected values of 1:1 (LiPF6) and 1:1.3 (LiTFSI) as calculated from stoichiometry. The LiTFSI concentration on the liquid surface appears to be higher than the nominal one as determined from the CF3 to C-O ratio in C 1s spectra yielding a TFSI to PC ratio of 1 to 8 compared to the expected ratio of 1 to 12. Similar findings were reported earlier by Maibach et al. [16] using the hanging droplet method.
High-resolution F 1s and P 2p spectra of LiPF6 are shown in Figure S1 (Supplementary Material). The quantitative analysis of the peak areas suggests a P to F ratio of 1 to 2 which is considerably less than the 1 to 6 ratio expected from LiPF6 stoichiometry. These findings in the liquid PF6 electrolyte are in contrast to earlier observations made on residual electrolyte components in SEI layers on dried electrode surfaces where the phosphor is often depleted [28,29].
The results of these first tests with LiTFSI in PC correspond well with previous results from the hanging static droplet experiments using synchrotron radiation NAP-XPS.

4. Conclusions

New possibilities for studying lithium-based electrolytes with a laboratory NAP-XPS system are presented using one model and one commercial electrolyte example. The special design of the used laboratory NAP-XPS machine (EnviroESCA) enables a simple experimental set up with easy handling and operation due to a horizontal semi-static droplet design with a sufficient volume to investigate Li-ion battery systems under realistic working conditions.
In the first set of experiments, we studied the commonly used LP30 electrolyte (LiPF6 in EC/DMC) and found a useful fitting approach to interpret the elemental core-level spectra, especially C 1s and O 1s.
Then we proceeded with a model V2O5 cathode placed in battery grade LiPF6 electrolyte to illustrate the capabilities of NAP-XPS for studying surface reactions at the solid–liquid interphase. It was also possible to probe different environments such as gas, liquid, and solid-phase during the same experiment. As a direct consequence, we were able to observe the surface reactivity of the V2O5 single crystal with Li+ containing electrolyte by a reduction of the V-oxidation state (V5+-> V4+). The presence of lithium at the crystal surface indicated the formation of LixV2O5 due to lithium incorporation.
Additional tests with a model electrolyte composed of LiTFSI in PC showed very good agreement with earlier results from synchrotron and in-house NAP-XPS using a hanging version of the static droplet design.
In contrast to those studies, we worked with much larger volumes of electrolyte. Thus, solvent evaporation during the analysis is uncritical at the used working pressure and droplet stabilization with background gas is not necessary. Additionally, accidental falling down of the hanging droplet is avoided. The electrolyte can be measured as is immediately in a horizontal arrangement. Furthermore, a laboratory NAP-XPS circumvents limited access to synchrotron facilities.
The possibility to extend this set up easily with additional electrodes, electrochemical cells, liquid flow, and other devices will help to further promote operando NAP-XPS studies of Li-ion batteries and other electrochemical systems in general.
Current work in progress aims to study lithium-ion batteries under working conditions with applied potentials to get a deeper insight into the real nature of the solid-electrolyte interphase on the negative electrode. A special focus lies on in situ studies of LiTFSI and PC decomposition in contact with the electrodes.

Supplementary Materials

The following are available online at https://www.mdpi.com/2073-4352/10/11/1056/s1, Figure S1: F 1s and P 2p core-level spectra of LP30 electrolyte and in contact with a V2O5 single crystal at 10 mbar, Figure S2: F 1s and P 2p core-level spectra of the immersed V2O5 single crystal after cleaning with EtOH, Figure S3. V 2p core-level spectra of a pristine V2O5 single crystal and in contact with the LP30 electrolyte at 10 mbar, Figure S4: Li 1s core-level spectra of the V2O5 single crystal after immersion in LP30 electrolyte and cleaning with EtOH, Figure S5: P 2p core-level spectrum of LP30 electrolyte at 10 mbar, Figure S6: Decrease of the O2 peak at ~538eV in the O 1s core-level spectra of LiTFSI electrolyte, initially and after 40 min at 1 mbar, Figure S7: Li 1s, S 2p, and N 1s core-level spectra of LiTFSI in PC electrolyte at 2 mbar, Figure S8: Survey spectra and quantification results after carbon contamination correction of the pristine V2O5 single crystal and after immersion in LiP306 electrolyte and cleaning with EtOH.

Author Contributions

Conceptualization; methodology; validation; formal analysis; investigation; resources; data curation; writing—original draft preparation; writing—review and editing; visualization; supervision, P.M.D., L.G., J.M. and A.T. All authors have read and agreed to the published version of the manuscript.

Funding

This research was funded by the German Federal Ministry of Education and Research, grant number FKZ 03XP0131.

Acknowledgments

We would like to thank René Hausbrand and Wolfram Jaegermann (Dept. of Materials science, TU Darmstadt) for a generous donation of the LP30 electrolyte. J.M. and L.G. gratefully acknowledge funding from the German Federal Ministry of Education and Research (FKZ 03XP0131).

Conflicts of Interest

The authors declare no conflict of interest.

References

  1. Salmeron, M.; Schlögl, R. Ambient pressure photoelectron spectroscopy: A new tool for surface science and nanotechnology. Surf. Sci. Rep. 2008, 63, 169–199. [Google Scholar] [CrossRef] [Green Version]
  2. Bluhm, H. Photoelectron spectroscopy of surfaces under humid conditions. J. Electron Spectrosc. Relat. Phenom. 2010, 177, 71–84. [Google Scholar] [CrossRef]
  3. Brown, M.A.; Jordan, I.; Beloqui Redondo, A.; Kleibert, A.; Wörner, H.J.; van Bokhoven, J.A. In situ photoelectron spectroscopy at the liquid/nanoparticle interface. Surf. Sci. 2013, 610, 1–6. [Google Scholar] [CrossRef]
  4. Trotochaud, L.; Head, A.R.; Karslıoğlu, O.; Kyhl, L.; Bluhm, H. Ambient pressure photoelectron spectroscopy: Practical considerations and experimental frontiers. J. Phys. Condens. Matter 2016, 29, 053002. [Google Scholar] [CrossRef]
  5. Arble, C.; Jia, M.; Newberg, J.T. Lab-based ambient pressure X-ray photoelectron spectroscopy from past to present. Surf. Sci. Rep. 2018, 73, 37–57. [Google Scholar] [CrossRef]
  6. Palomino, R.M.; Hamlyn, R.; Liu, Z.; Grinter, D.C.; Waluyo, I.; Rodriguez, J.A.; Senanayake, S.D. Interfaces in heterogeneous catalytic reactions: Ambient pressure XPS as a tool to unravel surface chemistry. J. Electron Spectrosc. Relat. Phenom. 2017, 221, 28–43. [Google Scholar] [CrossRef]
  7. Crumlin, E.J.; Bluhm, H.; Liu, Z. In situ investigation of electrochemical devices using ambient pressure photoelectron spectroscopy. J. Electron Spectrosc. Relat. Phenom. 2013, 190, 84–92. [Google Scholar] [CrossRef]
  8. Dou, J.; Sun, Z.; Opalade, A.A.; Wang, N.; Fu, W.; Tao, F. Operando chemistry of catalyst surfaces during catalysis. Chem. Soc. Rev. 2017, 46, 2001–2027. [Google Scholar] [CrossRef]
  9. Starr, D.E.; Favaro, M.; Abdi, F.F.; Bluhm, H.; Crumlin, E.J.; van de Krol, R. Combined soft and hard X-ray ambient pressure photoelectron spectroscopy studies of semiconductor/electrolyte interfaces. J. Electron Spectrosc. Relat. Phenom. 2017, 221, 106–115. [Google Scholar] [CrossRef] [Green Version]
  10. Stoerzinger, K.A.; Hong, W.T.; Crumlin, E.J.; Bluhm, H.; Shao-Horn, Y. Insights into Electrochemical Reactions from Ambient Pressure Photoelectron Spectroscopy. Acc. Chem. Res. 2015, 48, 2976–2983. [Google Scholar] [CrossRef] [Green Version]
  11. Goodenough, J.B.; Kim, Y. Challenges for Rechargeable Li Batteries. Chem. Mater. 2010, 22, 587–603. [Google Scholar] [CrossRef]
  12. An, S.J.; Li, J.; Daniel, C.; Mohanty, D.; Nagpure, S.; Wood, D.L. The state of understanding of the lithium-ion-battery graphite solid electrolyte interphase (SEI) and its relationship to formation cycling. Carbon 2016, 105, 52–76. [Google Scholar] [CrossRef] [Green Version]
  13. Peled, E.; Menkin, S. Review—SEI: Past, Present and Future. J. Electrochem. Soc. 2017, 164, A1703. [Google Scholar] [CrossRef]
  14. Verma, P.; Maire, P.; Novák, P. A review of the features and analyses of the solid electrolyte interphase in Li-ion batteries. Electrochim. Acta 2010, 55, 6332–6341. [Google Scholar] [CrossRef]
  15. Wu, Q.-H.; Thißen, A.; Jaegermann, W. Photoelectron spectroscopic study of Li intercalation into V2O5 thin films. Surf. Sci. 2005, 578, 203–212. [Google Scholar] [CrossRef]
  16. Maibach, J.; Källquist, I.; Andersson, M.; Urpelainen, S.; Edström, K.; Rensmo, H.; Siegbahn, H.; Hahlin, M. Probing a battery electrolyte drop with ambient pressure photoelectron spectroscopy. Nat. Commun. 2019, 10, 3080. [Google Scholar] [CrossRef] [Green Version]
  17. Kjærvik, M.; Schwibbert, K.; Dietrich, P.; Thissen, A.; Unger, W.E.S. Surface characterisation of Escherichia coli under various conditions by near-ambient pressure XPS. Surf. Interface Anal. 2018, 50, 996–1000. [Google Scholar] [CrossRef] [Green Version]
  18. Dietrich, P.M.; Bahr, S.; Yamamoto, T.; Meyer, M.; Thissen, A. Chemical surface analysis on materials and devices under functional conditions—Environmental photoelectron spectroscopy as non-destructive tool for routine characterization. J. Electron Spectrosc. Relat. Phenom. 2019, 231, 118–126. [Google Scholar] [CrossRef]
  19. Mocanu, A.; Isopencu, G.; Busuioc, C.; Popa, O.-M.; Dietrich, P.; Socaciu-Siebert, L. Bacterial cellulose films with ZnO nanoparticles and propolis extracts: Synergistic antimicrobial effect. Sci. Rep. 2019, 9, 17687. [Google Scholar] [CrossRef]
  20. Arinchtein, A.; Schmack, R.; Kraffert, K.; Radnik, J.; Dietrich, P.; Sachse, R.; Kraehnert, R. Role of Water in Phase Transformations and Crystallization of Ferrihydrite and Hematite. ACS Appl. Mater. Interfaces 2020, 12, 38714–38722. [Google Scholar] [CrossRef]
  21. Daubert, T.E.; Daubert, T.E.; Danner, R.P. Physical and Thermodynamic Properties of Pure Chemicals: Data Compilation; Taylor & Francis: Washington, DC, USA, 1989; ISBN 978-0-89116-948-2. [Google Scholar]
  22. Howard, P.H.; Meylan, W.M. Handbook of Physical Properties of Organic Chemicals; Lewis: Boca Raton, FL, USA, 1997; ISBN 978-1-56670-227-0. [Google Scholar]
  23. Nelson, R.F.; Adams, R.N. Propylene carbonate: A versatile solvent for electrochemistry and EPR. J. Electroanal. Chem. Interfacial Electrochem. 1967, 13, 184–187. [Google Scholar] [CrossRef]
  24. ISO 15472:2010 Surface Chemical Analysis—X-ray Photoelectron Spectrometers—Calibration of Energy Scales; International Organization for Standardization: Geneva, Switzerland, 2010.
  25. Avval, T.G.; Chatterjee, S.; Hodges, G.T.; Bahr, S.; Dietrich, P.; Meyer, M.; Thißen, A.; Linford, M.R. Oxygen gas, O2(g), by near-ambient pressure XPS. Surf. Sci. Spectra 2019, 26, 014021. [Google Scholar] [CrossRef]
  26. Patel, D.I.; Bahr, S.; Dietrich, P.; Meyer, M.; Thißen, A.; Linford, M.R. Ambient air, by near-ambient pressure XPS. Surf. Sci. Spectra 2019, 26, 024002. [Google Scholar] [CrossRef]
  27. Andersson, A.M.; Abraham, D.P.; Haasch, R.; MacLaren, S.; Liu, J.; Amine, K. Surface Characterization of Electrodes from High Power Lithium-Ion Batteries. J. Electrochem. Soc. 2002, 149, A1358. [Google Scholar] [CrossRef]
  28. Nie, M.; Abraham, D.P.; Seo, D.M.; Chen, Y.; Bose, A.; Lucht, B.L. Role of Solution Structure in Solid Electrolyte Interphase Formation on Graphite with LiPF6 in Propylene Carbonate. J. Phys. Chem. C 2013, 117, 25381–25389. [Google Scholar] [CrossRef]
  29. Nie, M.; Lucht, B.L. Role of Lithium Salt on Solid Electrolyte Interface (SEI) Formation and Structure in Lithium Ion Batteries. J. Electrochem. Soc. 2014, 161, A1001. [Google Scholar] [CrossRef]
  30. Hedman, J.; Hedén, P.-F.; Nordling, C.; Siegbahn, K. Energy splitting of core electron levels in paramagnetic molecules. Phys. Lett. A 1969, 29, 178–179. [Google Scholar] [CrossRef]
  31. Powell, C.J.; Seah, M.P. Precision, accuracy, and uncertainty in quantitative surface analyses by Auger-electron spectroscopy and x-ray photoelectron spectroscopy. J. Vac. Sci. Technol. A 1990, 8, 735–763. [Google Scholar] [CrossRef]
  32. Dietrich, P.M.; Streeck, C.; Glamsch, S.; Ehlert, C.; Lippitz, A.; Nutsch, A.; Kulak, N.; Beckhoff, B.; Unger, W.E.S. Quantification of Silane Molecules on Oxidized Silicon: Are there Options for a Traceable and Absolute Determination? Anal. Chem. 2015, 87, 10117–10124. [Google Scholar] [CrossRef]
  33. Avval, T.G.; Cushman, C.V.; Bahr, S.; Dietrich, P.; Meyer, M.; Thißen, A.; Linford, M.R. Dimethyl sulfoxide by near-ambient pressure XPS. Surf. Sci. Spectra 2019, 26, 014020. [Google Scholar] [CrossRef]
  34. Patel, D.I.; O’Tani, J.; Bahr, S.; Dietrich, P.; Meyer, M.; Thißen, A.; Linford, M.R. Ethylene glycol, by near-ambient pressure XPS. Surf. Sci. Spectra 2019, 26, 024007. [Google Scholar] [CrossRef]
  35. Shah, D.; Patel, D.I.; Bahr, S.; Dietrich, P.; Meyer, M.; Thißen, A.; Linford, M.R. Liquid water, by near-ambient pressure XPS. Surf. Sci. Spectra 2019, 26, 024003. [Google Scholar] [CrossRef]
  36. Shi, P.; Zheng, H.; Liang, X.; Sun, Y.; Cheng, S.; Chen, C.; Xiang, H. A highly concentrated phosphate-based electrolyte for high-safety rechargeable lithium batteries. Chem. Commun. 2018, 54, 4453–4456. [Google Scholar] [CrossRef] [PubMed]
  37. Rezqita, A.; Sauer, M.; Foelske, A.; Kronberger, H.; Trifonova, A. The effect of electrolyte additives on electrochemical performance of silicon/mesoporous carbon (Si/MC) for anode materials for lithium-ion batteries. Electrochim. Acta 2017, 247, 600–609. [Google Scholar] [CrossRef]
  38. Wu, Q.-H.; Thissen, A.; Jaegermann, W.; Liu, M. Photoelectron spectroscopy study of oxygen vacancy on vanadium oxides surface. Appl. Surf. Sci. 2004, 236, 473–478. [Google Scholar] [CrossRef]
  39. Laubach, S.; Schmidt, P.C.; Thißen, A.; Fernandez-Madrigal, F.J.; Wu, Q.-H.; Jaegermann, W.; Klemm, M.; Horn, S. Theoretical and experimental determination of the electronic structure of V2O5, reduced V2O5−x and sodium intercalated NaV2O5. Phys. Chem. Chem. Phys. 2007, 9, 2564–2576. [Google Scholar] [CrossRef]
  40. Donsanti, F.; Kostourou, K.; Decker, F.; Ibris, N.; Salvi, A.M.; Liberatore, M.; Thissen, A.; Jaegerman, W.; Lincot, D. Alkali ion intercalation in V2O5: Preparation and laboratory characterization of thin films produced by ALD. Surf. Interface Anal. 2006, 38, 815–818. [Google Scholar] [CrossRef]
Figure 1. Experimental setup of laboratory Near Ambient Pressure (NAP)–X-ray Photoelectron Spectroscopy (XPS) (EnviroESCA) and an electrolyte (LP30) cathode (V2O5) interface in measurement position directly under the analyzer aperture. Additionally shown is a typical solid sample in a liquid using a watch glass, which is placed on a standard sample holder.
Crystals 10 01056 g001
Figure 2. C 1s (left panel) and O 1s (right panel) core-level spectra of the LiPF6 electrolyte in EC/DMC: (a) gas phase; (b) liquid phase with surrounding gas; (c) in contact with V2O5; and (d) the same crystal after cleaning with EtOH. Open circles represent experimental data and black lines are envelopes of fitted curves.
Crystals 10 01056 g002
Figure 3. V 2p3/2 core-level spectra of a V2O5 single crystal (a) immersed in LiPF6 in EC/DMC electrolyte and (b) the same crystal after cleaning in EtOH and drying in air. Open circles represent experimental data and the black line is the envelope of the fitted curve.
Crystals 10 01056 g003
Figure 4. C 1s (a), O 1s (b), F 1s (c), and Li 1s (d) core-level spectra of LiPF6 in EC/DMC (upper curves) at 10 mbar and of LiTFSI in PC (lower curves) at 2 mbar. The chemical structure of LiTFSI is shown in the inset of 4b.
Crystals 10 01056 g004
Table 1. Peak fit results of C 1s core-level spectra from LP30 electrolyte as shown in Figure 2.
Peak ComponentBinding Energy Position (eV) 1 and Relative Peak Component Areas (%) 2
Electrolyte
Gas
Electrolyte
Gas + Liquid
V2O5
in Electrolyte
V2O5
Cleaned and Dry
CO3 (g)292.1 (32.9)292.2 (3.6)292.3 (0.9)-
CO3 (l)-291.4 (19.1)291.4 (17.6)-
COO---289.4 (4.5)
C-O (g)288.7 (67.1)289.0 (5.4)288.9 (3.6)-
C-O (l)-287.7 (44.8)287.6 (41.4)287.6 (15.8) 3
CC/CH-285.5 (27.2)285.4 (36.5)285.6 (79.7)
1 B.E. was referenced to main O 1s peak component of molecular O2 located at 539.3 eV [25,26]. 2 A relative uncertainty of 20% has to be considered for the relative peak component areas [31,32]. 3 B.E. position is indicating a C-O species but it might be other than those observed for the EC/DMC mixture.
Table 2. Peak fit results of O 1s core-level spectra from LP30 electrolyte as shown in Figure 2.
Peak ComponentBinding Energy Position (eV) 1 and Relative Peak Component Areas (%) 2
Electrolyte
Gas
Electrolyte
Gas + Liquid
V2O5
in Electrolyte
V2O5
Cleaned and Dry
O2 (g)540.4 (16.1)540.4 (2.6)540.3 (6.6)540.3 (10.2)
539.3 (31.9)539.3 (6.8)539.3 (15.3)539.3 (17.0)
H-O-H (g)536.5 (5.2)537.0 (0.7)--
O-C (g)535.6 (32.2)535.5 (17.9)535.3 (8.4)535.5 (3.9) 3
O-C (l)-534.7 (41.6)534.7 (25.7)534.4 (12.7) 3
O=C (g)533.9 (14.7)533.8 (9.0)534.0 (4.2)533.5 (10.1) 4
O=C (l)-533.0 (21.4)532.9 (21.4)532.4 (10.6) 4
O-V--531.0 (18.5)531.1 (35.5)
1 B.E. was referenced to the main O 1s peak component of molecular O2 located at 539.3 eV [25,26]. 2 A relative uncertainty of 20% has to be considered for the relative peak component areas [31,32]. 3 B.E. positions are indicating O-C species but might be other than observed for EC/DMC mixture. 4 B.E. positions are indicating O=C species but might be other than the ones observed for EC/DMC mixture, e.g., Li2O, Li2O2, Li(OH).
Table 3. Photoelectron peaks, binding energy positions, and relative peak areas of the fitted core-level spectra from LiPF6 in EC/DMC and LiTFSI in PC as shown in Figure 4.
PeakPeak ComponentBinding Energy Position (eV) 1 and Relative Peak Component Areas (%) 2
LiPF6LiTFSI
C 1sCF3--292.54.9
CO3291.122.0290.719.1
C-O (g)/C=O288.94.0288.46.1
C-O (l)287.247.2287.041.3
CC/CH285.026.7285.028.6
O 1sO=C532.931.4532.324.2
O–C534.568.6534.048.3
O=S 532.227.6
F 1sCF3--688.569.4
PF6686.7100--
F---684.730.6
Li 1sLi+55.610055.6100
1 For better comparison with published NAP-XPS data of LiTFSI the B.E. scale was referenced using the C 1s CC/CH peak component located at 285.0 eV [16]. 2 A relative uncertainty of 20% has to be considered for the relative peak component areas [31,32].
Table 4. Elemental ratios of electrolyte components in LiTFSI and LiPF6.
SampleElementExperimental RatioStoichiometry
LiTFSIN:S:F:Li1:3.5:6.25:14.51:2:6:1
LiPF6P:F:Li1:2:41:6:1
Publisher’s Note: MDPI stays neutral with regard to jurisdictional claims in published maps and institutional affiliations.

