Abstract
Liquid exfoliation of three-dimensional bulk solids with an inherent layered structure is an effective and scalable method to produce stable re-aggregation colloidal inks of 2D materials that are suitable for solution processing. Shear mixing is a relatively gentle technique that allows exfoliation while preserving the native lateral size of the 3D precursors, while tip sonication often leads to extensive structural damage, producing 2D sheets where many edge defects are introduced. We present a mixed approach to obtain liquid dispersions of few-layer graphene flakes, wherein the average lateral size of the colloids can be tuned in a controlled way. This strategy relies on the application of defined tip sonication steps on graphene inks previously prepared through the use of a shear mixer, thus starting with already-exfoliated micro-sheets with a limited amount of edge defects. Our approach could represent a valuable method to prepare 2D material inks with variable size distributions, as differences in this parameter could have a significant impact on the electronic behavior of the final material and thus on its field of application.
1. Introduction
The production of 2D materials through scalable methods that can preserve their quality and ensure their industrial exploitation in a wide variety of devices [1,2,3,4] and applications [5,6,7,8] is a major concern the applied research of today [9]. Bottom-up approaches to produce these materials, such as epitaxial growth on catalytic substrates through chemical vapor deposition [10] or organic synthesis starting from precursor molecules [11], are not advantageous from an economical point of view for industrial-scale production, unless highly pure single-layer species are required. In order to find a cheaper and less hazardous process for large-scale graphene production, liquid-phase exfoliation (LPE) methods have been developed in the last few years [12,13]. These techniques provide a system with the required energy to overcome the van der Waals forces between layers in 3D crystals without increasing the in-plane defect degree. The LPE process generally involves threes steps, namely the dispersion of the bulk material in a given solvent or water/surfactant solution, the exfoliation itself and the purification. The last step (normally carried out through liquid cascade centrifugation) is necessary for the separation of the exfoliated fraction from the un-exfoliated one and it affects the final concentration of the 2D material ink. The choice of the solvent is also crucial as it determines the strength of the solute–solvent interactions. The ideal solvent should minimize the interfacial tension between the liquid and the 2D flakes in order to avoid the flakes re-adhering to one another. In the case of the LPE of graphene, the best solvent identified to fulfill these requirements is undoubtedly N-cyclohexyl-2-pyrrolidone (CHP), given its matching surface tension compared to that of graphite (γ ~ 40 mJ m−2) [14].
Among the LPE methods, it is convenient to distinguish between the use of shear mixer-type devices and tip sonicators. The former feature an instrument head made of a rotor and stator: the rotation of the inner part causes the formation of the strong shear and thrust forces to which the mixture is subjected. The procedure is controlled by hydrodynamic shear forces under laminar flow in the complete absence of turbulence, avoiding the formation of in-plane defects. Paton et al. have shown that exfoliation occurs whenever the local shear rate exceeds a critical value of around 104 s−1 [14]. On the other hand, tip sonication consists of ultrasound-assisted exfoliation, during which hydrodynamic shear forces associated with cavitation act on the bulk material and induce exfoliation. The exfoliation mechanism is accompanied by fracturing processes, due to shockwaves generated by immediately adjacent inertial cavitation activity, with the resulting effect of producing sheets with an elevated number of edge defects [15].
Here, we report on the use of a two-step LPE method that allows us to control the average size of few-layer graphene sheets dispersed in CHP, with significant relevance to the future production of size-defined graphene inks for solution processing. This method consists of the previous production of graphene micro-sheets through shear mixing, starting from large-sized graphite crystals, followed by a tunable reduction in the lateral sizes by applying tip sonication protocols. We provide a complete physico-chemical characterization of the thus produced size-controlled graphene inks that allows for the rationalization of the effects of the sonication parameters employed on such a post-synthetic method.
2. Materials and Methods
The EXG 3000 ink in CHP was prepared according to the procedure reported previously in [16]. Solvents were from Sigma-Aldrich (Merck KGaA, Darmstadt, Germany) and were used as received. Shear mixing LPE was carried out with an IKA T25 digital shear mixer operating at 8000 rpm. The sample was cooled to 0 °C in an ice bath during operation. Tip sonication was carried on a Baudelin Sonopuls tip sonicator operating at a 40% and 60% power using pulses of 3 s on/3 s off. The samples were contained in 250 mL quartz beakers kept in an ice bath. Raman spectroscopy was carried out using a Senterra Raman microscope (Bruker, Hamburg, Germany) working with an excitation laser at λ = 532 nm. All the samples were prepared by two consecutive centrifugation steps using a mixture made with some drops of graphene suspension in EtOH to get rid of the non-volatile solvent. The graphene/EtOH suspension was deposited on a pre-cleaned oxidized Si wafer and the solvent was evaporated. The focus was obtained with a 50× lens. The instrumental settings were optimized and used for all the measurements: 5 s, 40 co-additions, 5 mW of laser power. Dynamic light scattering (DLS) measurements were conducted with a Malvern Zetasizer Nano-ZS device (Malvern, UK). The DLS system was operated by the Zetasizer software from Malvern Panlytical (Malvern, UK). The instrumental settings adopted were as follows: 20 °C, toluene as solvent with a refractive index of 1.496 and graphene refractive index of 2.411. The samples were prepared dissolving a drop of graphene mixture in toluene. The samples were measured in Rotilabo precision glass cuvettes with a light path of 10 mm and a volume of 3.5 mL. TEM images were acquired on a FEI Tecnai G2 microscope (Hillsboro, OR, USA) operating at 100 kV. HR-TEM and selected area electron diffraction (SAED) patterns were captured from samples created by drop-casting lacy carbon grids with an FEI Tecnai G2 20 X Twin instrument (Hillsboro, OR, USA) using 200 kV accelerating voltage. Thermogravimetric analysis (TGA) was run in air on a ∼1 mg sample using a Q5000 IR model TA instrument (New Castle, UK) starting at 100 °C. The sample was kept isothermal for 20 min, then ramped up by 10 °C min−1 until it reached 1000 °C. UV–visible absorption spectra were acquired on a Goebel Uvikon spectrophotometer (Au in der Hallertau, Germany), originally suspended in CHP, then further diluted with dimethylformamide to achieve optical densities around 0.5.
3. Results and Discussion
Some of the authors of this paper reported, in a previous work [16], the production of LPE graphene micro-sheets of lateral sizes up to 50 µm or more and an average number of layers around five when starting from high-quality Madagascar graphite and employing the shear mixing method introduced by Paton et al. in CHP [14]. The resulting ink is a stable to re-aggregation colloidal suspension, characterized by a concentration of graphene sheets in the range of 250–300 µg mL−1 [16]. This colloidal sample is named EXG 3000 after the purification protocol employed. This consists of three subsequent centrifugation steps at increasing centrifugation speeds, the last being carried out at 3000 rpm (1170× g) and allowing for the isolation of the most exfoliated fraction within the mixture that underwent LPE. To this graphene micro-sheet ink, tip sonication processes of different durations and power were applied and the resulting products were characterized by Raman spectroscopy, dynamic light scattering (DLS), transmission electron microscopy (TEM) and thermogravimetric analysis (TGA) to provide a detailed picture in terms of average flake sizes and defect distributions.
In more detail, three different ultrasonication treatments were applied, starting from EXG 3000, which are summarized in Table 1 in terms of sonication power and time.

Table 1.
Conditions applied for the ultrasonication of the graphene ink EXG 3000.
As can be inferred from this table, the protocol employed aims at verifying whether two subsequent sonication steps at short times and medium power (the first two entries in the table) differ from the application of one single long step at high power (last entry). The first time interval of the two-step case was kept lower than 1 h to verify the effect of a relatively short initial sonication.
The products were first analyzed via Raman spectroscopy (Figure 1). In Figure 1a, a section of the Raman spectra of the different samples is reported, precisely in the range in which the D (defect-related) and G (sp2 structure-related) bands are located. The small shoulder appearing on the high wavenumber side of the G band is the so-called D’ band [17,18]. The intensity ratio between the D band (ID) over the G band (IG) was evaluated for the three samples and for EXG 3000 and the resulting values are summarized in Table 2.
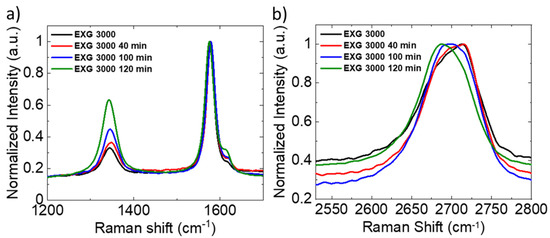
Figure 1.
Raman spectroscopy analysis on the ultrasonicated EXG 3000 samples and on pristine EXG 3000. (a) Detail of the D and G bands with relative intensity normalized on the G peak. (b) Detail of the 2D band.
Table 2.
Relevant intensity ratios between Raman peaks in Figure 1a.
The D band intensity clearly increases with the time and power of sonication applied. This is particularly evident for the sample sonicated in one single step for a long time and with a high power (EXG 3000 120 min), while, for the sample sonicated for the shorter time (EXG 3000 40 min), the increase is relatively low. The observed trend could be related to the presence of a greater number of defects either at the edges or in the basal plane. In the first case, a greater number of edges could be correlated to a decrease in the graphene flakes’ lateral size, while in the second case defects located in the basal plane could be generated as a side effect of the sonication energy applied. To distinguish between the two types of defects, the intensity of the D band (ID) over the D’ band (ID’) was evaluated in order to verify the nature of said defects (Table 2), according to Eckmann et al., and this evaluation demonstrated how the value of the ID/ID’ ratio depends only on the types of defects rather than on their quantity [18]. For each sample, the value of the ID/ID’ ratio evaluated is smaller than 3.5, a threshold that indicates the presence of edge defects. The other kinds of defects on the crystal structure of graphene, i.e., sp3 carbons and vacancy, are characterized by higher ratio values. Hence, the major effect of the sonication step was to reduce the graphene flakes’ size. The higher the sonication power, the smaller the flakes and consequently the more edges were visible.
The analysis of the 2D band (Figure 1b) shed light on other interesting information about the degree of exfoliation and how it is affected by the sonication step. Indeed, the 2D band shape and shift of the maximum are heavily affected by the number of graphene layers present in an analyzed sample [17]. In single-layer graphene, the intensity of the 2D (I2D) peak should be roughly four times IG and it should quickly decrease as the number of layers increases. In the analyzed samples, I2D was found to be about half of IG. Hence, in the inks, few-layer graphene predominates over single-layer graphene. This result is also confirmed by the value of the full width at half maximum (FWHM) of the 2D band. The FWHM is larger than 50 cm−1 and it is almost double the single-layer graphene 2D peak. Nonetheless, the corresponding peaks show a progressive downward shift of more than 25 cm−1 with respect to the starting material (Figure 1b), accounted for by the contemporary flake exfoliation during the sonication step [19]. Through the qualitative analysis of the 2D band shape, within which two components can be distinguished at around 2725 and 2675 cm−1, which undergo a change in relative intensity in relation to the number of layers in the specimen, as described in detail by Ferrari et al. in [17], it is clear that the layer number progressively decreases with the increasing time and sonication power, as the intensity of the 2725 cm−1 component progressively decreases while the 2675 cm−1 one increases. Moreover, the more sonicated samples show a similar 2D band shape and this is due to their degree of exfoliation. In particular, the sample to which one single long and high-power sonication step was applied (EXG 3000 120 min) is the one in which the 2D band shape and position of the maximum recall more closely those of single-layer graphene. Indeed, the rate of the exfoliation of the graphene flakes becomes slower if their size decreases and, as a consequence, it is hard to further exfoliate the smaller flakes in suspension [20].
The quantitative analysis of the flake sizes was conducted via DLS. The technique could only give reliable results on colloidal sizes for spherical particles, while graphene flakes are almost completely planar. However, in this case, the DLS results were not used to define the hydrodynamic diameter of the flakes but to search for a trend resulting from the controlled sonication processes. Indeed, it is evident that smaller flakes can be obtained with a longer and stronger ultrasonication step (Figure 2). In particular, DLS analysis reveals that the flake size drastically decreases after 40 min of sonication, but there are only minor changes for further sonication times. In fact, the hydrodynamic diameter obtained for the sample after the 120 min sonication cycle is similar to the one obtained after the 100 min cycle in two consecutive steps of 40 and 60 min.
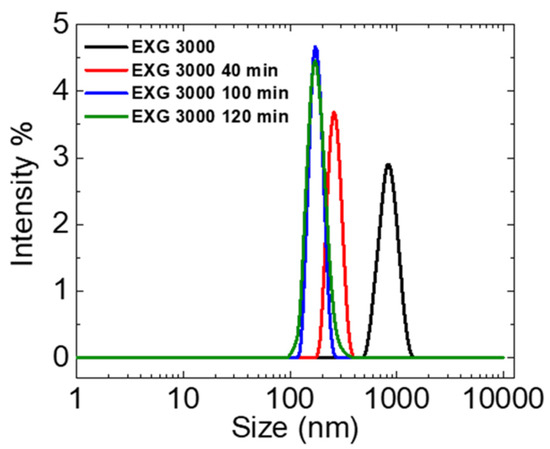
Figure 2.
Dynamic light scattering (DLS) spectra of the ultrasonicated EXG 3000 samples and of pristine EXG 3000.
More detailed information on the sample morphologies can be obtained by performing TEM and high-resolution (HR-TEM) analyses. Figure 3 reports TEM images at the lower and higher resolutions of the starting LPE ink, EXG 3000. The considerable lateral extension of the graphene sheets contained within the colloidal suspension is evident from the left image, where the flakes appear to be covering a large part of the TEM grid. In more detail, from the right image, it is possible to notice that the remarkable size extension (which originates due to the fact that shear mixing is not a destructive method of graphite exfoliation, as well as the fact that the initial Madagascar graphite sample was comprised of very large crystals [16]) causes the flakes to fold in some places, forming wrinkles. The selected area electron diffraction (SAED) in Figure 3c shows the presence of reflections typical of a graphite-like sp2 carbon phase (those indicated as 100, 110 and 112) and a very weak signal of a reflection, assignable to a diamond-like phase, and thus sp3 carbon (the one indicated as 311), probably due to the existing sp3 defects in the sample that give rise to a non-zero D-band in Figure 1a (black line).12 Given the lateral extension of the sample, it is difficult to identify edges and therefore such a weak sp3 carbon signal could be due to the defects present in the basal plane of the flakes (which may have already been present in the pristine graphite).
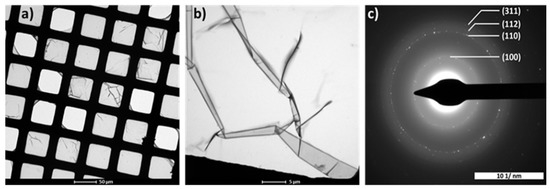
Figure 3.
TEM images of EXG 3000 showing (a) the considerable size of the graphene flakes present in the sample at lower magnification and (b) their wrinkled nature at higher magnification. (c) SAED of the sample.
The sonication of EXG 3000 for 40 min at medium power (EXG 3000 40 min) causes a considerable reduction in the flake size that does not surpass the 1 µm threshold, with the smallest components also featuring lateral extensions of 50–100 nm (Figure 4a). HR-TEM allows us to precisely examine the nature of the exfoliation, confirming what was seen from the Raman analysis of the 2D peak, i.e., an insignificant difference in the number of stacked layers from the pristine EXG 3000 sample (around 5, Figure 4b).
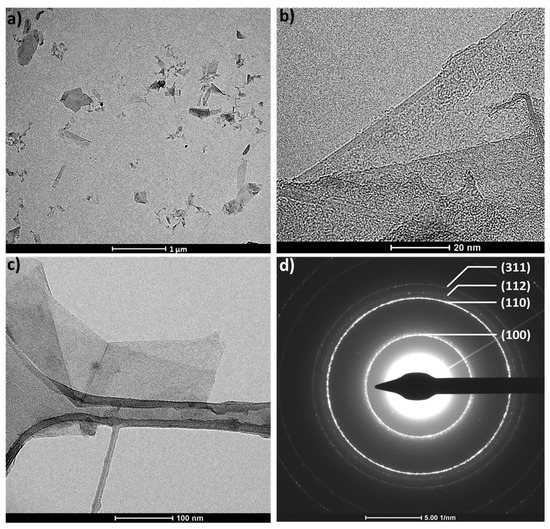
Figure 4.
Transmission electron microscopy characterization of the EXG 3000 40 min sample. (a) Low magnification TEM image of the sample. (b) HR-TEM high magnification detail showing a number of superimposed graphene layers in the samples equal to 5. (c) HR-TEM detail on the geometrical shape of the flake edges. (d) SAED of the edges with indicated numbers of the identified reflections (see text for speciations).
While the breaking of the flakes is extensive, the action of the sonication process on the 2D material edges appears to be relatively regular, with the overall morphology in these parts maintaining defined angles and straight lines, and with no sign of hole formation within the basal planes. The nature of the defects at the edges is difficult to predict; however, selected area electron diffraction (SAED) could provide interesting insights on this aspect if addressed specifically to this part of the flakes. Figure 4d shows the SAED pattern obtained by selectively focusing on a flake edge, from which the graphite-like reflections of 100, 110 and 112 are still detected and the diamond-like reflection (311) is considerably more visible than in the initial EXG 300 sample (Figure 3c) [21]. This increase in intensity could be an indication that some of the defects created at the sheet edges through prolonged sonication are carbon atoms in tetrahedral form. On the other hand, their distribution should give rise to areas with a crystalline order (also if very small ones), as otherwise they could not give rise to a detectable diffraction pattern.
The average size of the flakes that underwent the second step of sonication at low power (EXG 3000 100 min) and that of those from the single-step high power treatment (EXG 3000 120 min) were very similar and extended in the range of few hundreds of nm (between 100 and 500 nm maximum). The latter sample was further analyzed through HR-TEM, showing the formation of peculiar morphologies at the edges, where irregular shapes are found as a result of the aggressive treatment. Figure 5 reports a summary of these features: in the two top panels (Figure 5a,b), it is possible to notice the formation of holes in the basal plane of the flakes with different dimensionalities and an irregular geometry. These patterns are to be considered edges and not in-plane defects, given their considerable extension. The increased level of exfoliation is seen by focusing on edge areas where the highly irregular trend is not present, such as the one highlighted in Figure 5c. The numbers of superimposed graphene flakes between 2 and 3 are thus identified, while monolayers are mainly found where the disordered damage is located, with an example in Figure 5d. In these rugged edges, the same sp3 carbon SAED signature described above (Figure 4d) can be detected, together with those typical of graphite (inset of Figure 5d).
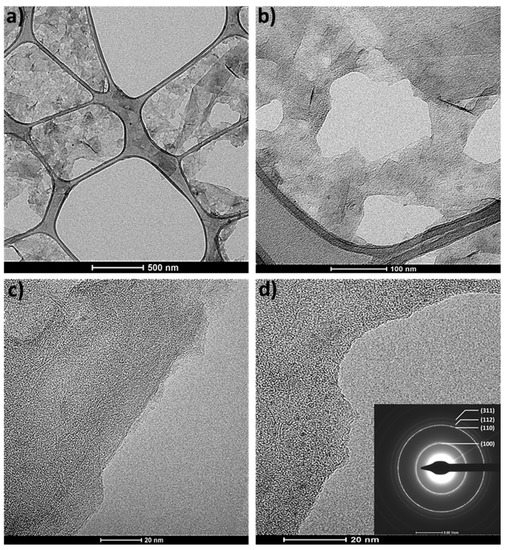
Figure 5.
HR-TEM images of EXG 3000 120 min. The pronounced nature of the damage caused by prolonged sonication of the starting EXG 3000 sample is seen in these images with (a,b) the generation of holes in the basal planes of the nano-sheets, (c) a more extensive exfoliation and (d) a rugged morphology at the edges.
The sonicated samples were further analyzed for their thermal behavior, by performing TGA in air to determine the decomposition temperature. For EXG 3000, no net transition was identified (like the one of pure graphite), as the material was found to have a little degradation already at around 250 °C. Nonetheless, a decomposition temperature of 490 °C was extrapolated at the intersection of two linear fits where the slope of the decomposition curve was most pronounced [16]. The sonication treatment considerably increases this progressive weight loss as a result of increased temperature in the presence of oxygen, with almost 80% of the initial mass of the specimen decomposed at 450 °C and the remaining 20% completed within a 50 °C step ahead for the EXG 3000 sample sonicated for 40 min (red curve in Figure 6). The second step of sonication then further worsens the thermal stability (blue curve in Figure 6), with an initial drop in weight that is even more considerable. On the other hand, the sample sonicated in one single, long high-power step features a thermal behavior similar to the EXG 3000 40 min one, indicating that the two materials could have similar stabilities, despite their different morphology and average sizes.
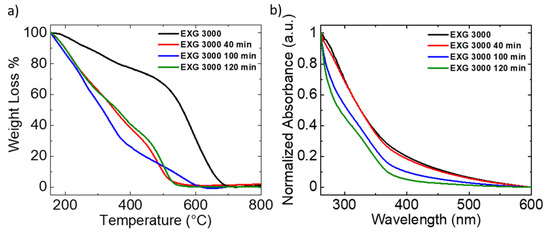
Figure 6.
(a) Thermograms in air of the ultrasonicated EXG 3000 samples and of pristine EXG 3000. (b) UV–visible absorption spectra of the ultrasonicated EXG 3000 samples and of pristine EXG 3000.
We finally carried out a UV–visible spectroscopic characterization of the ultrasonicated samples and compared their spectra with that of pristine EXG 3000, in order to verify the effect of extensive flake damage on the optical and plasmonic properties of the dispersed graphene sheets. As can be inferred from Figure 6b, a constant decrease in absorption along the whole visible range is detected for the two samples that underwent the longest sonication treatments (i.e., EXG 3000 100 and 120 min), while the sample sonicated for the shortest time (EXG 3000 40 min) maintains an absorption profile similar to that of the pristine material. Such a deterioration in the optical response in the smallest produced nanosheets points at a modification of the plasmonic response in the material, where electrons likely have lower freedom to move along a surface with a high amount of defects compared to the case of an extended micro-sheet and thus start to feel a sort of confinement (which, in extreme cases, would lead to the obtainment of graphene quantum dots, fully 0D materials).
4. Conclusions
In this study, we reported on a new approach to produce LPE graphene inks in CHP where the size and defect profiles of the suspended micro-sheets can be controlled by applying ultrasonication post-synthetic parameters. The size reduction of the starting micro-sheets was found to be considerable even at the shortest sonication time evaluated (40 min), leading to the formation of nano-sheets, suggesting that a very short or intermediate duration could provide lateral extensions that remain in the µm range. The effect of high power and time was seen to generate holes in the basal planes with variable sizes and geometries, but these were still considered as edge defects given the relatively large extension, as the presence of real in-plane defects should provide a different value for the ID/ID’ ratio in the Raman spectra (these last types of defects are most likely individual sp3 carbon moieties generated in a scattered manner on the sheets as an effect of, for example, a chemical treatment-like functionalization [18]). In addition, an interesting perspective on the nature of the thus-formed edge defects was provided through the use of SAED analysis, suggesting that ordered sp3 carbon structures could be formed at these sites as an effect of sonication.
Our data provide a valid platform for future studies aimed at determining the effect of different sizes and defect distributions on the properties of LPE graphene samples, with potential applications for other 2D material inks. As a perspective for future work, a more thorough determination of the effect of shorter and less aggressive sonication procedures will be investigated, allowing us to complete the scenario presented here, with a better morphological characterization of the obtained species (for example through atomic force microscopy). In addition, a better understanding of the modification induced in the electronic properties of the samples following the tip sonication treatment is necessary. The changes observed in the optical absorption profiles of the sonicated materials compared to the pristine EXG 3000 sample provide the first insights into existing variations in the plasmonic (and consequently electronic) response [22], but other means have to be identified to better describe them, such as electrochemistry, conductive atomic force microscopy or charge transport measurements. The thus-produced and characterized graphene inks could be of interest for multiple applications where the size of the flakes and their defect identities are relevant, from solution-processed thin layers and devices to composites. They could even represent starting materials for selective chemical functionalization strategies [23,24,25] aimed at specific sites on the sheets [26,27], such as the edges or the holes in the basal plane formed after the most aggressive treatments.
Author Contributions
Conceptualization, T.G.; methodology, C.D.B. and T.G.; validation, C.D.B., P.B., F.L. and T.G.; formal analysis, C.D.B., F.L. and T.G.; investigation, C.D.B., P.B., F.S., F.L., E.M. and T.G.; resources, C.D.B., P.B., F.L., E.M., Á.K. and T.G.; data curation, C.D.B. and T.G.; writing—original draft preparation, C.D.B. and T.G.; writing-review and editing, C.D.B., P.B., F.S., F.L., E.M., Á.K. and T.G.; visualization, C.D.B. and T.G.; supervision, T.G.; project administration, T.G.; funding acquisition, Á.K. and T.G. All authors have read and agreed to the published version of the manuscript.
Funding
F.S. and T.G. thank the DFG for financial support via the Research Training Group 2204 “Substitute Materials for Sustainable Energy Technologies”. T.G. further acknowledges the “Fonds der Chemischen Industrie” of the VCI. Funding from the Hungarian National Research Development and Innovation office through the project 2017-2.3.7-TÉT-IN-2017-00008 is also acknowledged by the contribution of Á.K.
Conflicts of Interest
The authors declare no conflict of interest.
References
- Avouris, P. Graphene: Electronic and Photonic Properties and Devices. Nano Lett. 2010, 10, 4285–4294. [Google Scholar] [CrossRef] [PubMed]
- Pumera, M. Graphene-Based Nanomaterials for Energy Storage. Energy Environ. Sci. 2011, 4, 668–674. [Google Scholar] [CrossRef]
- Sahoo, N.G.; Pan, Y.; Li, L.; Chan, S.H. Graphene-Based Materials for Energy Conversion. Adv. Mater. 2012, 24, 4203–4210. [Google Scholar] [CrossRef]
- Cheng, J.; Wang, C.; Zou, X.; Liao, L. Recent Advances in Optoelectronic Devices Based on 2D Materials and Their Heterostructures. Adv. Opt. Mater. 2019, 7, 1800441. [Google Scholar] [CrossRef]
- Mosconi, D.; Blanco, M.; Gatti, T.; Calvillo, L.; Otyepka, M.; Bakandritsos, A.; Menna, E.; Agnoli, S.; Granozzi, G. Arene C–H Insertion Catalyzed by Ferrocene Covalently Heterogenized on Graphene Acid. Carbon 2019, 143, 318–328. [Google Scholar] [CrossRef]
- Gatti, T.; Manfredi, N.; Boldrini, C.; Lamberti, F.; Abbotto, A.; Menna, E. A D-π-A Organic Dye–Reduced Graphene Oxide Covalent Dyad as a New Concept Photosensitizer for Light Harvesting Applications. Carbon 2017, 115, 746–753. [Google Scholar] [CrossRef]
- Yang, Y.; Asiri, A.M.; Tang, Z.; Du, D.; Lin, Y. Graphene Based Materials for Biomedical Applications. Mater. Today 2013, 16, 365–373. [Google Scholar] [CrossRef]
- Cai, X.; Luo, Y.; Liu, B.; Cheng, H.-M. Preparation of 2D Material Dispersions and Their Applications. Chem. Soc. Rev. 2018, 47, 6224–6266. [Google Scholar] [CrossRef]
- Milana, S. The Lab-to-Fab Journey of 2D Materials. Nat. Nanotechnol. 2019, 14, 919–921. [Google Scholar] [CrossRef]
- Novoselov, K.S.; Mishchenko, A.; Carvalho, A.; Castro Neto, A.H. 2D Materials and van Der Waals Heterostructures. Science 2016, 353, aac9439. [Google Scholar] [CrossRef]
- Yoon, K.-Y.; Dong, G. Liquid-Phase Bottom-up Synthesis of Graphene Nanoribbons. Mater. Chem. Front. 2020, 4, 29–45. [Google Scholar] [CrossRef]
- Tao, H.; Zhang, Y.; Gao, Y.; Sun, Z.; Yan, C.; Texter, J. Scalable Exfoliation and Dispersion of Two-Dimensional Materials–an Update. Phys. Chem. Chem. Phys. 2017, 19, 921–960. [Google Scholar] [CrossRef]
- Hu, G.; Kang, J.; Ng, L.W.T.; Zhu, X.; Howe, R.C.T.; Jones, C.G.; Hersam, M.C.; Hasan, T. Functional Inks and Printing of Two-Dimensional Materials. Chem. Soc. Rev. 2018, 47, 3265–3300. [Google Scholar] [CrossRef]
- Paton, K.R.; Varrla, E.; Backes, C.; Smith, R.J.; Khan, U.; O’Neill, A.; Boland, C.; Lotya, M.; Istrate, O.M.; King, P.; et al. Scalable Production of Large Quantities of Defect-Free Few-Layer Graphene by Shear Exfoliation in Liquids. Nat. Mater. 2014, 13, 624. [Google Scholar] [CrossRef] [PubMed]
- Khan, U.; O’Neill, A.; Lotya, M.; De, S.; Coleman, J.N. High-Concentration Solvent Exfoliation of Graphene. Small 2010, 6, 864–871. [Google Scholar] [CrossRef] [PubMed]
- Zheng, M.; Lamberti, F.; Franco, L.; Collini, E.; Fortunati, I.; Bottaro, G.; Daniel, G.; Sorrentino, R.; Minotto, A.; Kukovecz, A.; et al. A Film-Forming Graphene/Diketopyrrolopyrrole Covalent Hybrid with Far-Red Optical Features: Evidence of Photo-Stability. Synth. Met. 2019, 258, 116201. [Google Scholar] [CrossRef]
- Ferrari, A.C.; Meyer, J.C.; Scardaci, V.; Casiraghi, C.; Lazzeri, M.; Mauri, F.; Piscanec, S.; Jiang, D.; Novoselov, K.S.; Roth, S.; et al. Raman Spectrum of Graphene and Graphene Layers. Phys. Rev. Lett. 2006, 97, 187401. [Google Scholar] [CrossRef] [PubMed]
- Eckmann, A.; Felten, A.; Mishchenko, A.; Britnell, L.; Krupke, R.; Novoselov, K.S.; Casiraghi, C. Probing the Nature of Defects in Graphene by Raman Spectroscopy. Nano Lett. 2012, 12, 3925–3930. [Google Scholar] [CrossRef]
- Malard, L.M.; Pimenta, M.A.; Dresselhaus, G.; Dresselhaus, M.S. Raman Spectroscopy in Graphene. Phys. Rep. 2009, 473, 51–87. [Google Scholar] [CrossRef]
- Turner, P.; Hodnett, M.; Dorey, R.; Carey, J.D. Controlled Sonication as a Route to In-Situ Graphene Flake Size Control. Sci. Rep. 2019, 9, 8710. [Google Scholar] [CrossRef]
- Esmeryan, K.D.; Castano, C.E.; Bressler, A.H.; Abolghasemibizaki, M.; Fergusson, C.P.; Roberts, A.; Mohammadi, R. Kinetically Driven Graphite-like to Diamond-like Carbon Transformation in Low Temperature Laminar Diffusion Flames. Diam. Relat. Mater. 2017, 75, 58–68. [Google Scholar] [CrossRef]
- Cunha, E.; Proença, M.F.; Costa, F.; Fernandes, A.J.; Ferro, M.A.C.; Lopes, P.E.; González-Debs, M.; Melle-Franco, M.; Deepak, F.L.; Paiva, M.C. Self-Assembled Functionalized Graphene Nanoribbons from Carbon Nanotubes. ChemistryOpen 2015, 4, 115–119. [Google Scholar] [CrossRef] [PubMed]
- Barbera, V.; Brambilla, L.; Milani, A.; Palazzolo, A.; Castiglioni, C.; Vitale, A.; Bongiovanni, R.; Galimberti, M. Domino Reaction for the Sustainable Functionalization of Few-Layer Graphene. Nanomaterials 2019, 9, 44. [Google Scholar] [CrossRef] [PubMed]
- Gatti, T.; Vicentini, N.; Mba, M.; Menna, E. Organic Functionalized Carbon Nanostructures for Functional Polymer-Based Nanocomposites. Eur. J. Org. Chem. 2016, 6, 1071–1090. [Google Scholar] [CrossRef]
- Gabrielli, L.; Altoè, G.; Glaeske, M.; Juergensen, S.; Reich, S.; Setaro, A.; Menna, E.; Mancin, F.; Gatti, T. Controlling the Decoration of the Reduced Graphene Oxide Surface with Pyrene-Functionalized Gold Nanoparticles. Phys. Status Solidi Basic Res. 2017, 254, 1700281. [Google Scholar] [CrossRef]
- Barbera, V.; Brambilla, L.; Porta, A.; Bongiovanni, R.; Vitale, A.; Torrisi, G.; Galimberti, M. Selective Edge Functionalization of Graphene Layers with Oxygenated Groups by Means of Reimer–Tiemann and Domino Reimer–Tiemann/Cannizzaro Reactions. J. Mater. Chem. A 2018, 6, 7749–7761. [Google Scholar] [CrossRef]
- Guerra, S.; Barbera, V.; Vitale, A.; Bongiovanni, R.; Serafini, A.; Conzatti, L.; Brambilla, L.; Galimberti, M. Edge Functionalized Graphene Layers for (Ultra) High Exfoliation in Carbon Papers and Aerogels in the Presence of Chitosan. Materials 2019, 13, 39. [Google Scholar] [CrossRef]
Publisher’s Note: MDPI stays neutral with regard to jurisdictional claims in published maps and institutional affiliations. |
© 2020 by the authors. Licensee MDPI, Basel, Switzerland. This article is an open access article distributed under the terms and conditions of the Creative Commons Attribution (CC BY) license (http://creativecommons.org/licenses/by/4.0/).